
Abstract
BACKGROUND:
Cardiac dysfunction accompanies acute ischemic stroke and affects the effective implementation of early rehabilitation interventions. There is a lack of reference hemodynamic data on cardiac function in the subacute phase of ischemic stroke.
OBJECTIVE:
In this study, we aimed to identify appropriate cardiac parameters for exercise training utilizing a pilot study.
METHODS:
We used a transthoracic electrical bioimpedance non-invasive cardiac output measurement (NICOM) device to monitor cardiac function in real time for two groups [i.e., subacute ischemic stroke inpatients group (
RESULTS:
We considered stroke volume index (SVI) and systemic vascular resistance index (SVRi) as the primary outcomes, and there was significant intragroup difference (stroke group:
CONCLUSION:
SVRI, SVI, and CI values highlight cardiac dysfunction in stroke patients the most. At the same time, these parameters suggest that cardiac dysfunction in stroke patients may be closely related to the increased peripheral vascular resistance caused by infarction and the limitation of myocardial systolic function.
Keywords
Introduction
Concurrent cardiac dysfunction is common in patients with cerebrovascular disease [1]. Typically, ischaemic stroke alters the autonomic and neurohormonal pathways involved in the control of cardiac function, induces neurovascular uncoupling and disrupts cerebral autoregulation, making cerebral blood flow directly dependent on cardiac function [2, 3, 4, 5].
Previous reviews have estimated that myocardial injury, ischemia-like electrocardiographic changes, and arrhythmias are frequently encountered in acute stroke patients, even in the absence of primary heart disease. These findings support a central nervous system (CNS) origin for these electrocardiographic abnormalities [6, 7, 8]. Sposato et al. pointed out that atrial fibrillation can be detected by cardiac monitoring in up to 20% of patients with stroke [9]. In a meta-analysis of over 50,000 participants, Gunnoo et al. reported that the incidence of cardiovascular complications in the acute phase of ischemic stroke ranged from 3% for myocardial infarction to
Hence, currently, early detection of cardiac function in patients with ischemic stroke is regarded as essential for exposure rating and appropriate rehabilitation planning. However, most of the literature to date, including current clinical guidelines, have focused only on monitoring cardiac function within 24 hours of a patient suffering an ischemic stroke [18]. There is a paucity of literature on hemodynamic data collected for guiding cardiac rehabilitation training in patients who are in the subacute phase. According to conventional concepts, the most serious complications after ischemic stroke have been identified in the acute phase. On the contrary, recent studies have shown that damage to cardiac function still accounts for a large proportion in ischemic stroke inpatients [19, 20, 21, 22]. Besides, relevant studies have also pointed out that continuous monitoring of cardiac function in the subacute phase can help to prevent secondary stroke and reduce complications caused by cardiovascular events. Yoshimura et al. evaluated patients at rest and found that cardiac dysfunction that manifested during the acute phase after brain injury usually resolves over the following several weeks alongside improvement of neurological function [23]. Nevertheless, whether cardiac dysfunction has also improved when patients were evaluated during exercise is still controversial.
In patients with ischemic stroke, penumbral perfusion is maintained by collateral flow, and specifically maintained by stabilizing normal mean arterial pressure (MAP) levels in acute interventions [24]. This is because MAP is related to cerebral perfusion (CP), as constant cerebral blood flow (CBF) is maintained over a wide range of MAP due to vessel auto-regulation [25]. According to Deegan et al., MAP also correlates with cardiac output (CO), since MAP is the product of CO and systemic vascular resistance (SVR) [26]. In a study by Marik et al., drug administration schedules were adjusted to enhance CO according to the Frank-Starling curve and SVR via fluid and/or catecholamine administration, to increase MAP levels of patients [27]. Earlier studies have demonstrated that the correlation of MAP levels to CO are volume state-dependent. Therefore, in areas with impaired autoregulation, CO may be a better parameter to focus on, as CBF is dependent on CO rather than on MAP.
In recent decades, measurement of CO using non-invasive or minimally invasive devices has gained popularity due to its advantages of safety, convenience, and high repeatability [28, 29, 30]. Transthoracic electrical bioimpedance (TEB) is an easy-to-use approach among various non-invasive cardiac output measurements (NICOM) as it provides rapid hemodynamic information in clinical practice [30]. The method of hemodynamic monitoring by TEB was popularized in clinical medicine by the extensive studies by Shoemaker et al. [31], illustrating a calculation of the impedance from the voltage changes by passing a small current through the patient’s thorax. The first derivative
In this research, we proposed a pilot study to compare the cardiac function in subacute inpatients with ischemic stroke (first onset
Methods
This pilot controlled trial was conducted at the Rehabilitation Medicine Department of the Longhua People’s Hospital in Shenzhen City, China. The experimenter was blinded to data analysis, and data analysts did not participate in conducting the experiment. The study was conducted with approval from the Longhua Human Medical Ethics Committee (for Research) [2021(112)]. The study was registered in the clinical registration database under number ChiCTR2100047079.
Recruitment of study respondents
After obtaining approval for the study from the Institutional Review Board, we screened 50 ischemic stroke inpatients admitted between February and April 2021 to the Longhua People’s Hospital. The inclusion criteria for stroke inpatients were: (1) aged between 30 and 60 years old; (2) diagnosed with a unilateral brain lesion due to ischemic stroke, first onset and within 6 months of onset, (3) had no other neurological deficits or secondary onset; (4) had satisfactory cognition (as measured by the Mini-Mental State Examination [MMSE
Experimental setup and protocol
We used a TEB-NICOM device (Enduro, Physioflow@ Manatec, France) to measure the cardiac hemodynamic parameters in both groups in the study. An illustration of the system is shown in Fig. 1A. This commercial monitoring system provides continuous non-invasive cardiac output monitoring. The device recorded ECG and measured chest bioimpedance, which changes with the respiratory and cardiac cycles. Bioimpedance changes associated with ECG were used to calculate stroke volume and other CO parameters automatically every 10 seconds with the NICOM system. The data were instantly displayed on the PC screen and saved for offline processing.
(A) An illustration of the TEB-NICOM system adopted in this study. (B) A demonstration of the electrode configuration to conduct the non-invasive cardiac output measurement with the device shown above. (The figure is amended from original image of Atlas of Human Anatomy, Xichi Ltd, China).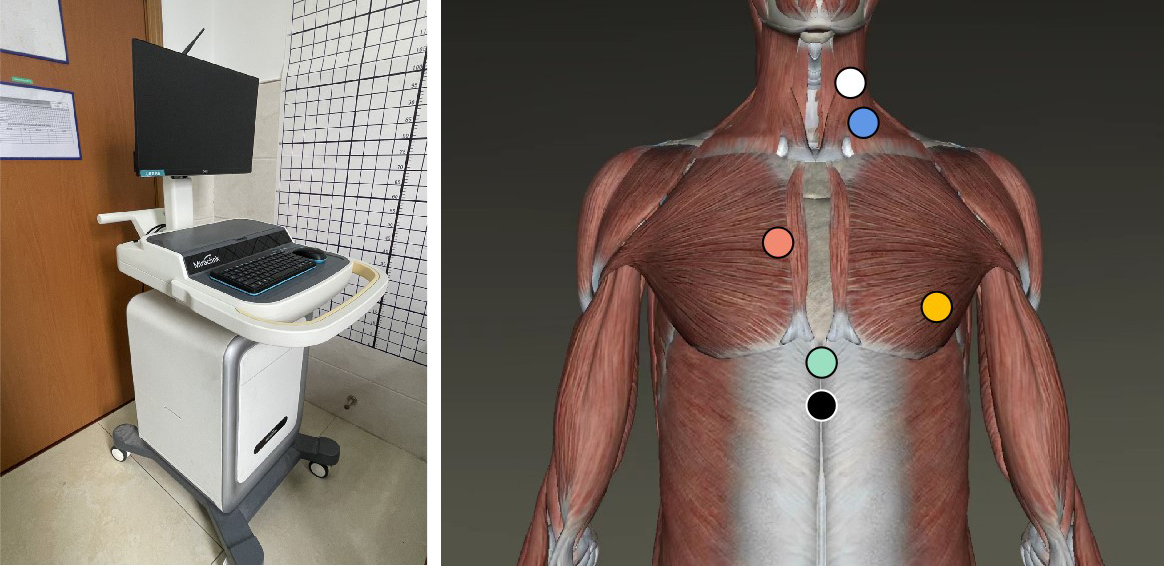
Before starting the measurement, the participant was instructed to lie on a bed in the supine position. After skin preparation, 6 electrodes were placed on the neck and chest. The configuration of the electrodes is shown in Fig. 1B. The white electrode was placed behind the left side of the neck under the earlobe. The blue electrode was placed in the angle between the left neck clavicle and the sternocleidomastoid muscle. The dark orange electrode was placed in the second intercostal space at the left edge of the sternum. The light orange electrode was placed in the fifth intercostal space at the front of the left axilla. The green electrode was placed in the left paraspinal region flush with the height of xiphoid, and the black electrode was placed directly 1 cm below the green. The six electrodes were connected to a wireless signal transmission box. Subsequently, the experimenter operated the device in the following sequence: launch the detection software; connect the signal transmission box with the NICOM device via Bluetooth; enter individual demographic information; and conduct system calibration.
After the system was calibrated, the participants were informed that the experiment was starting. They were required to first lie in the bed calmly for 3 minutes, then sit up and sit quietly for 3 minutes, and finally they moved to the training platform for the seated cycling exercise for 15 minutes, as shown in Fig. 2. The specific speed and resistance parameter settings for each individual were determined according to the 3-minute cycling pre-test to ensure that all participants received medium-intensity exercise. The resistance and speed remain unchanged during the entire 15 minutes of exercising. Real-time NICOM monitoring was done throughout the whole process. After the exercise ended, the Borg fatigue index score was measured again. All participants got scores of 13–15.
A subject was instructed to perform three steps of actions in sequence. (1) lie in bed peacefully for 3 minutes; (2) sit up and sit quietly for 3 minutes; (3) cycling exercise under the seat for 15 minutes.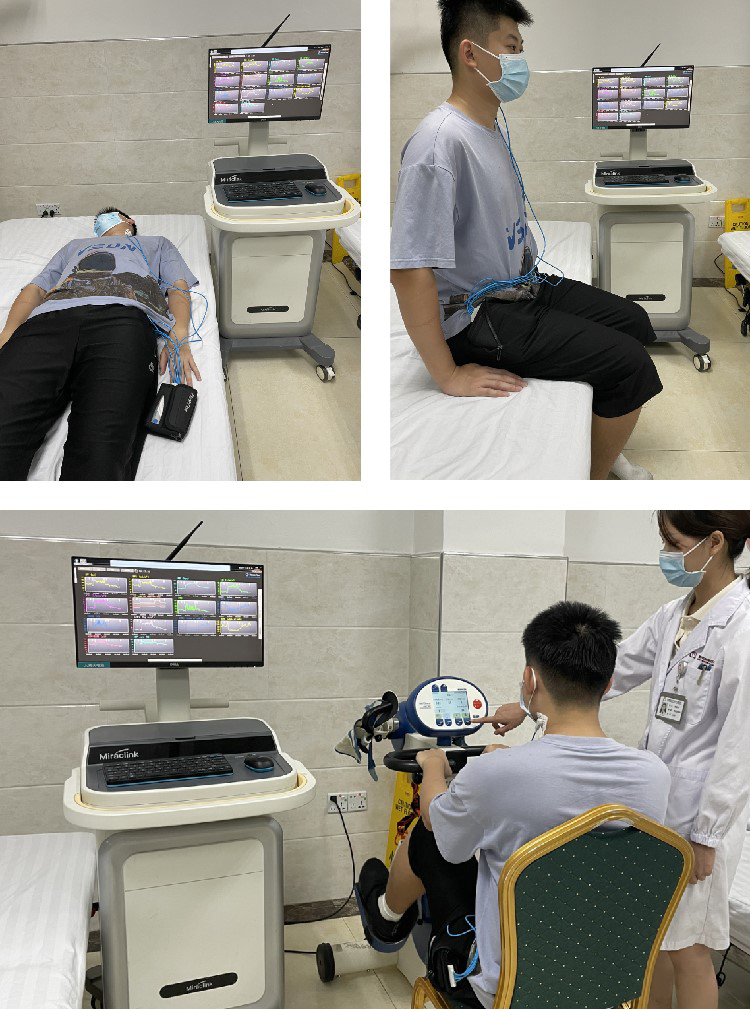
The data that was computed online was exported from the NICOM device. Initially, we cut the raw data flow into three segments [i.e., recumbent resting state (T1), sitting resting state (T2), and cycling state (T3)] according to the sequential process of the experiment with manually tagged markers. Then, we performed the data preprocessing within each individual segment, and we deleted 30-second-long data segments both at the beginning and end of the segment to avoid errors caused by switching between tasks. After that we eliminated data points exceeding 3 times the standard deviation beyond the mean value in each segment to reduce ambient noise. Additionally, to observe the gradual CO variances throughout the duration of the cycling exercise, we further divided the T3 segment into six sub-segments (i.e., T3A, T3B, T3C, T3D, T3E, and T3F), which contained data of 150 seconds. In the subsequent analysis, we not only observed the temporal changes in the entire line of data, but also averaged the data points of each segment to explore the differences in CO parameters of the two groups in each time period.
Statistical analysis
All statistical analyses were performed using IBM SPSS 22. We selected the following main CO parameters as the primary CO parameters in our study: SVI, SVRi, cardiac contraction index (CTI), CI, EF, and EDV. Two-way analysis of variance (ANOVA) was used to evaluate the differences with respect to the independent factors of the group (i.e., the ischemic stroke participants and the healthy controls) and segment period (i.e., T1, T2, T3A, T3B, T3C, T3D, T3E, and T3F). Then, we performed one-way ANOVA to investigate the intragroup difference of either the EG or CG group at different segment periods using the Bonferroni post hoc test. Finally, the intergroup difference of the two groups at each segment period was analyzed using independent
Results
The cycling exercise and NICOM evaluation were completed by all the recruited participants. No participant felt unwell or withdrew during the entire experiment. The two groups were examined using Fisher exact tests for their demographic data (
Demographic data of the participants in both groups
Demographic data of the participants in both groups
No significance was found between the two groups. EG, Experimental group; CG, Control group.
The results of intergroup differences (including probabilities and effect sizes) with respect to time and group by two-way ANOVA
The results of intragroup evaluation by one-way ANOVA, with respect to the timing segments (i.e. T1, T2, T3A, T3B, T3C, T3D, T3E and T3F) for the experimental group (EG) and the control group (CG) respectively
The variation of all CO parameters of both groups are shown in time sequence.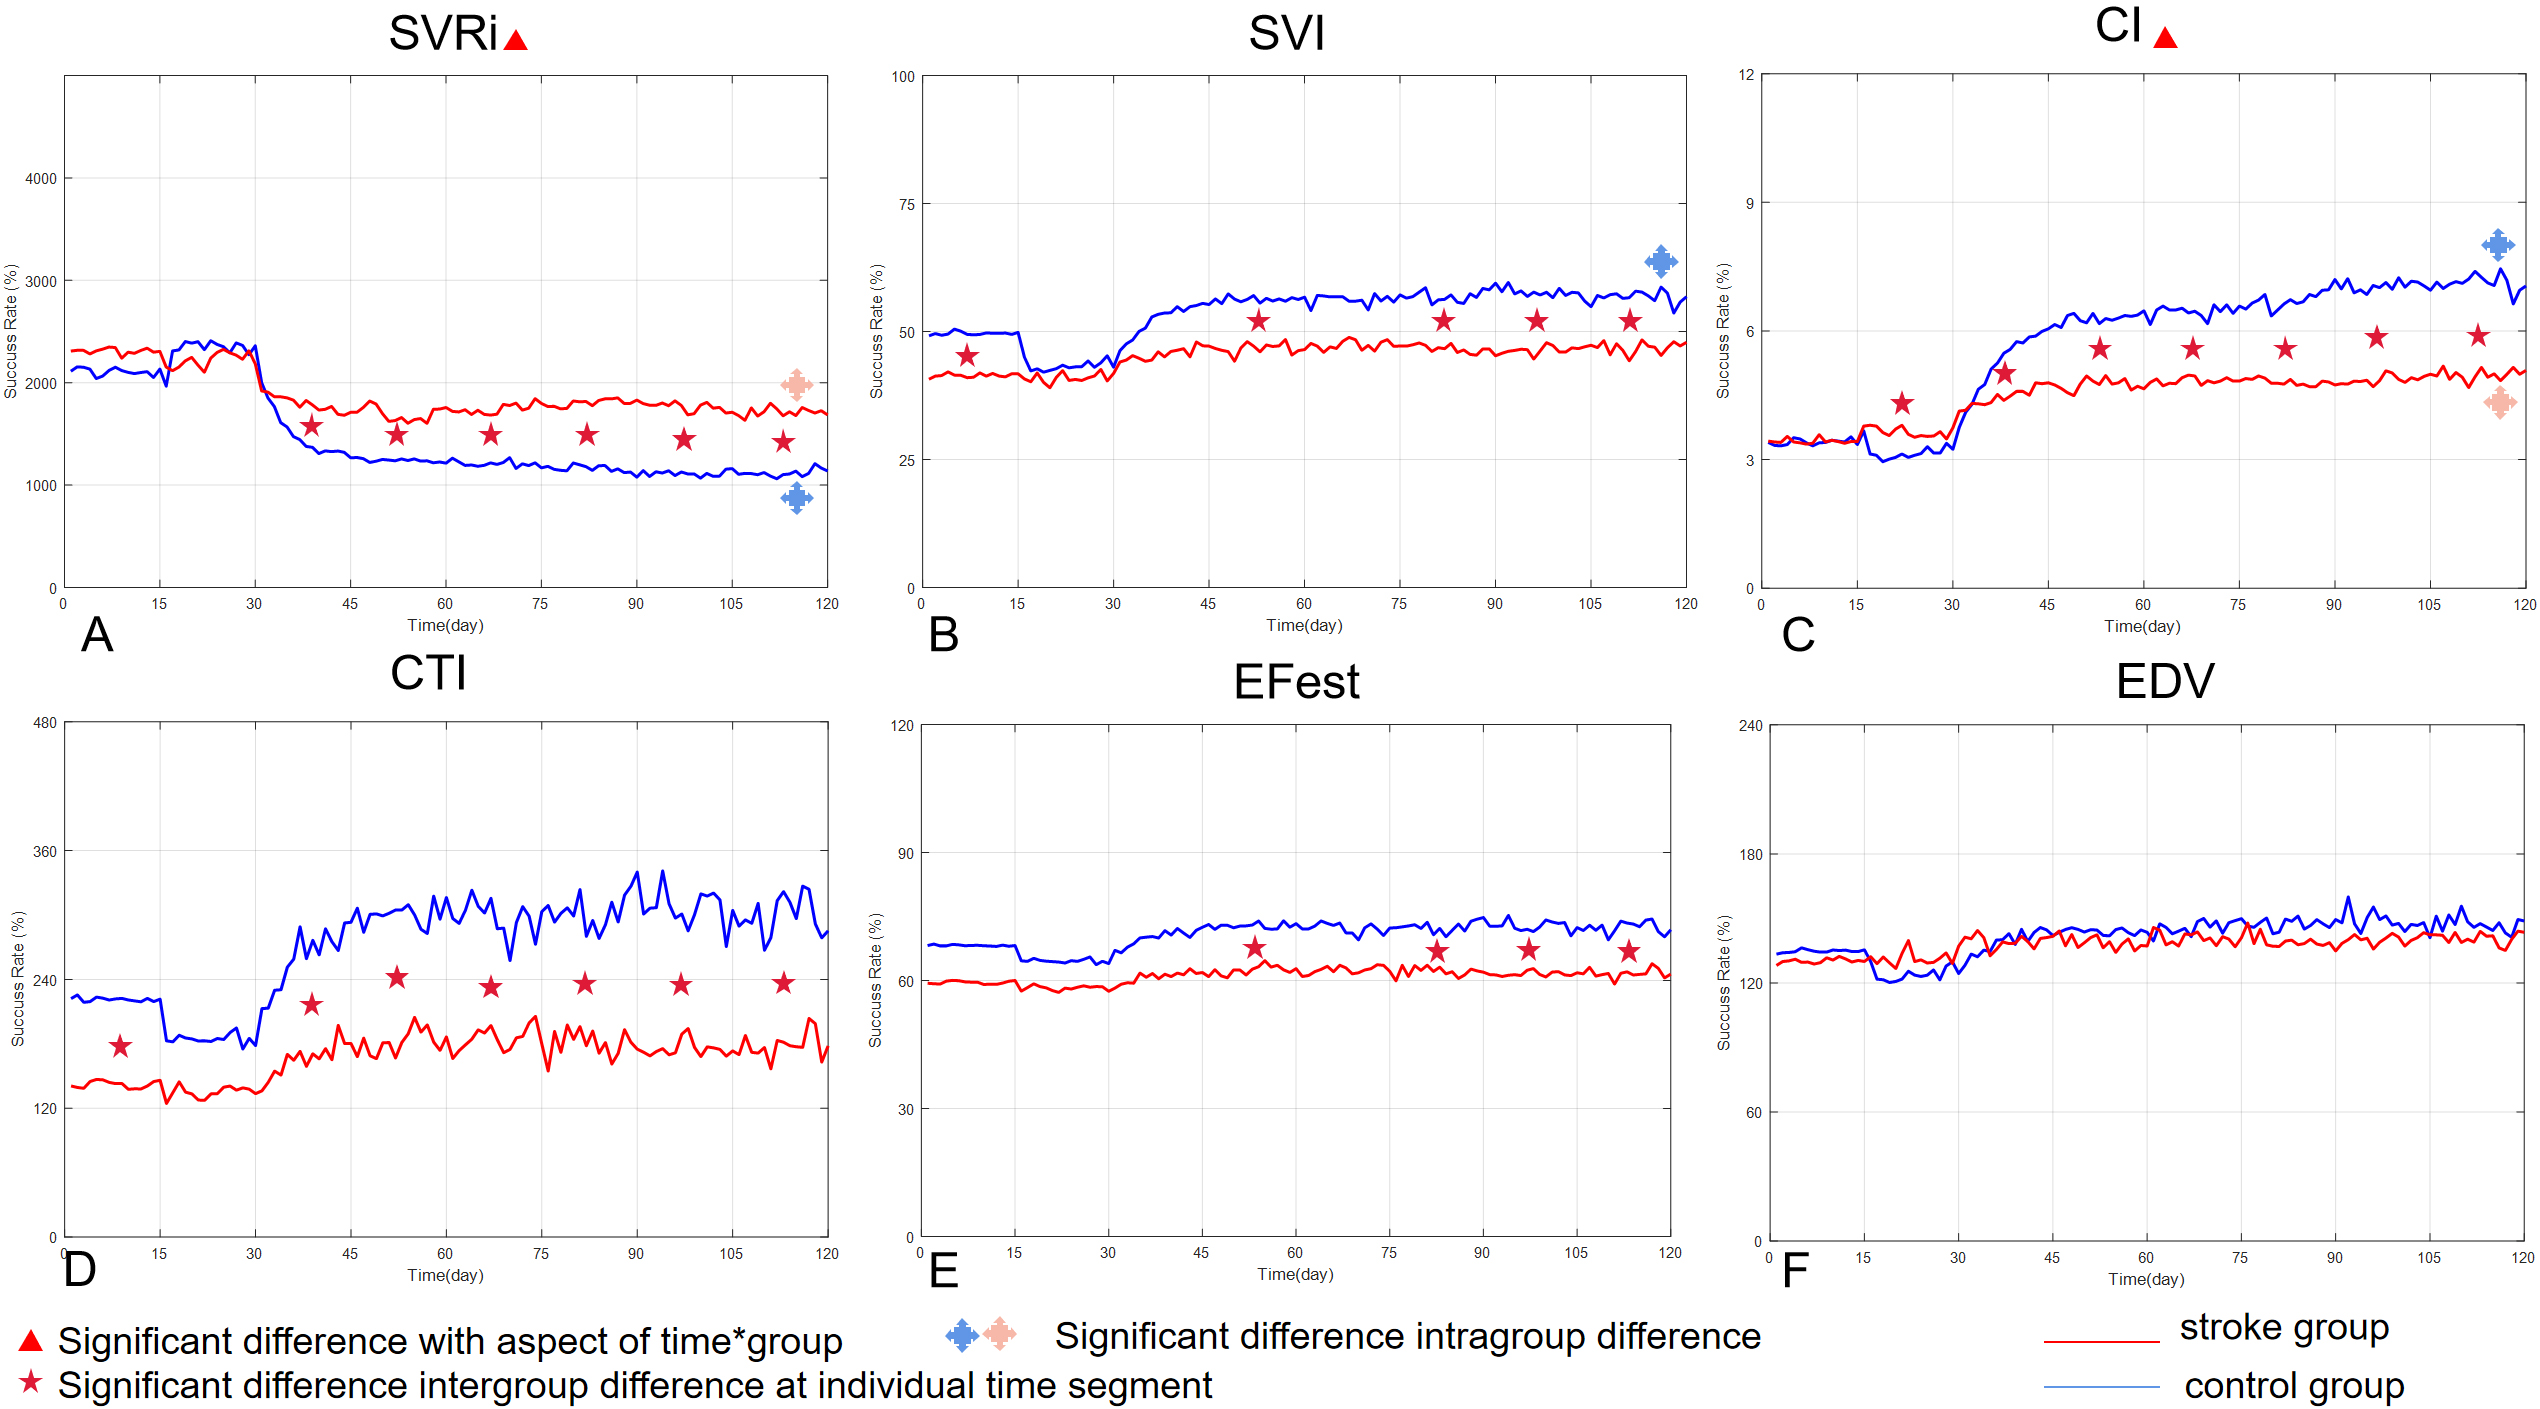
Figure 3 shows the variation of all CO parameters of both groups in the time series. In the figure, the red solid line represents the mean value variations of ischemic stroke patients, while the blue dotted line represents the mean changes in the healthy control group. From the six subgraphs, it is evident that there are differences in some of the CO parameters between the ischemic stroke group and the healthy control group, and there are also similar characteristics. There were significant differences between the two groups in the primary outcome results (i.e., SVI and SVRI), affirming our hypothesis.
Our two-way ANOVA analysis revealed that there were significant differences in SVRi scores with respect to the time (
Regarding the SVi scores, we observed significant differences with respect to time (
Secondary outcomes
In addition to the primary outcomes, we noticed that other parameters also revealed the similarities and differences in cardiac function between the two groups of participants during cycling, as shown in Fig. 3.
Figure 3C indicates the variation in CI scores across the whole experiment process for both the stroke and control groups. Significant differences were observed with respect to the term of time (
Figures 3D and E present the means of CTI and EF scores, respectively. It is evident from the subgraphs that although the relevant parameters of the two groups were different in different time segments of the
A summarization of the six major CO parameters measured in this study, including the means and 95% confidence interval of each parameter together with the independent
-test probabilities to compare the intergroup difference at each time segment (i.e. T1, T2, T3A, T3B, T3C, T3D, T3E and T3F)
A summarization of the six major CO parameters measured in this study, including the means and 95% confidence interval of each parameter together with the independent
experiment, the trend of the mean value of the two groups was quite similar. This is consistent with the results of two-way ANOVA, which shows significant differences with respect to time (
As shown in Fig. 3F, there were no significant intergroup differences or intragroup differences in EDV scores. The similarity of both curves was relatively high in the subgraph when compared to the curves in subgraphs of other hemodynamic data.
In this study, we compared the CO parameters of subacute ischemic stroke inpatients with those of healthy adults during a bicycle exercise test. The results confirmed our previous conjecture that although some stroke patients did not show cardiac dysfunction at rest, and their CO parameters were similar to those of healthy people, the characteristics of cardiac dysfunction could be prominently seen in the process of exercise initiation and exercise maintenance. Table 4 shows the CO parameters and the independent T-test results in detail at each time segment (i.e., T1, T2, T3A, T3B, T3C, T3D, and T3F). The radar map in Fig. 4 provides a holistic perspective to show the changes across time of all the six CO parameters of both groups.
A demonstration of the timing changes of the parameters of the two groups of subjects in each stage of the experiment via the radar map.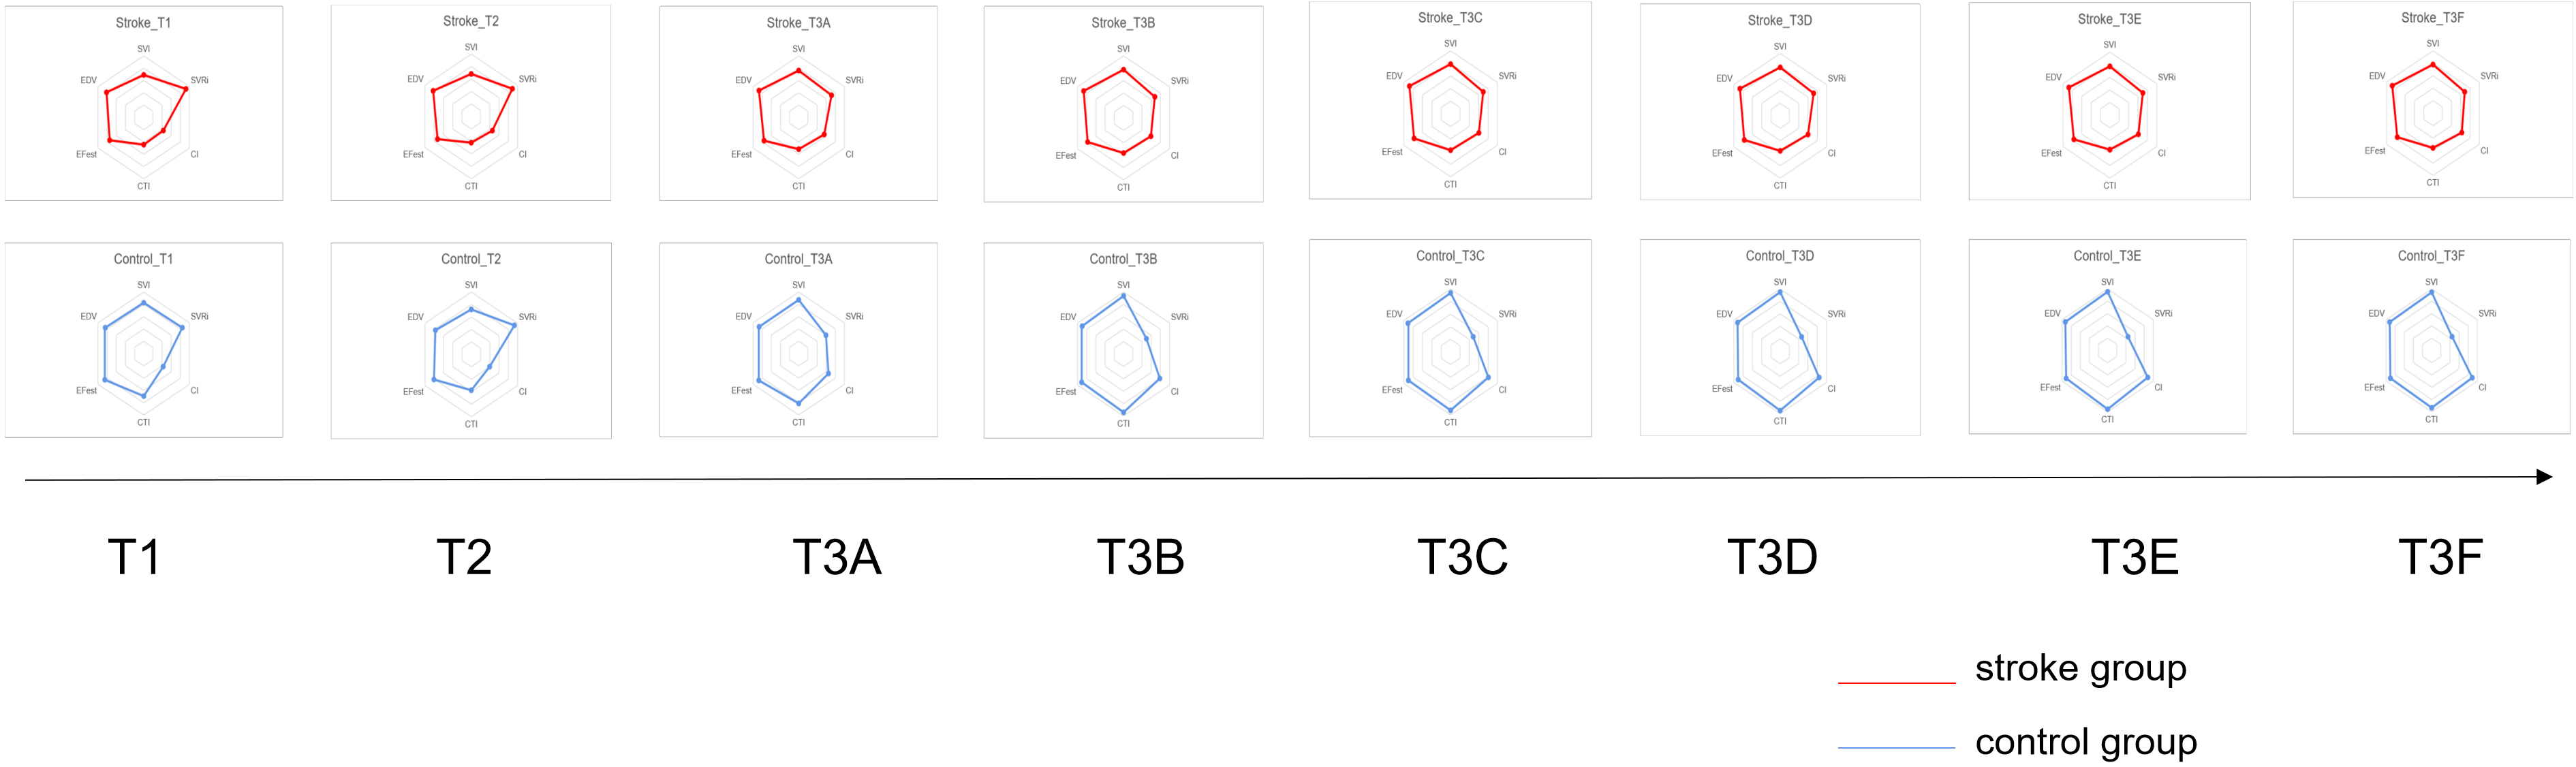
For example, in this study, there was no difference in SVRi between the two groups in the resting state, which reflected that the cardiac afterload function in the subacute stage of ischemic stroke improved since the ischemic stroke when the patient was at rest. According to this phenomenon, researchers speculated that the cardiac function of patients with ischemic stroke can recover within one month after the onset of stroke [34]. However, in this study, we found that the SVRi of ischemic stroke inpatients was significantly higher than that of the healthy control group throughout, from the beginning to the end of cycling exercise. On the one hand, it directly indicates that the peripheral vascular resistance of ischemic stroke patients could hardly be autoregulated under exercising state, and on the other hand, it indirectly suggests that the cerebral microcirculation may not be unobstructed during this period. In the past, the view that the risk of cardiac dysfunction of stroke mainly occurs within 24 hours has been supported by ECG research [35], but given the current need for early rehabilitation training, there is still an urgent lack of data pertaining to ECG monitoring during exercise in patients in the subacute phase. Future research in this aspect will be helpful to improve the prompt warning of risk in early training and assist in the formulation of rehabilitation planning.
Another primary outcome we have focused on is the SVI score. At present, this index can be used to predict the recovery of patients’ cardiac and cerebral function and to warn of secondary stroke risk. A recent study has shown that the decrease of SVI is closely related to time spent below saturation of 90% [36]. Real-time SVI monitoring in early rehabilitation training is helpful to remind therapists to pay attention to patients’ saturation, thus improving the ability for early warning of risk and avoiding injury. In this study, the SVI value of the patients was significantly lower than that of healthy controls in five time segments, i.e., T1, T3B, T3D, T3E, and T3F. This result suggests two possible phenomena: one is that the myocardial systolic function of patients with subacute stroke had not fully recovered, which is based on the gentle slope of the SVI curve throughout the whole exercising process; the other is that patients with subacute stroke are intolerant to more than 10 minutes of moderate exercise during early rehabilitation training. In the experiment, the patients’ saturation in the whole process was not lower than 90% based on continuous monitoring, and the Borg fatigue index of patients was also within the appropriate range after the exercise. Despite this, the SVI of patients still did not increase significantly in the group, suggesting that there could be an obstacle to myocardial systolic function during exercise.
In this study, apart from the relevant parameters of the primary outcome, the results of the CI scores are also noteworthy. Resting CI score has been widely used to evaluate cardiac function in clinical practice. In this study, we found that the resting CI of the healthy participants decreased significantly from the lying position to the sitting position, and then increased rapidly from the sitting position to exercise initiation, while that of the stroke patients were relatively stable throughout the whole process. The phenomenon is consistent with the two-way ANOVA results with respect to the interaction aspect. In the process of exercise initiation and exercise maintenance, the CI value of ischemic stroke patients remained significantly lower than that of healthy controls. We believe that not only the CI value during rest, but also the CI value during exercise has clinical significance for ischemic stroke rehabilitation. When seen along with the SVI value, a possible explanation is that the impairment of myocardial contractility has not been overcome at this stage, hence appropriate cardiopulmonary function training is needed to assist the progress of exercise rehabilitation. In a study by Fuhrer et al., the authors found that there was a correlation between CI value and MAP value, and MAP directly affected the functional recovery of lateral branch perfusion in the penumbra. Therefore, paying attention to CI value in the process of early rehabilitation training will not only help to improve the efficiency of exercise training from the cardiac perspective, but also facilitate the spontaneous recovery of the central nervous system.
The diversity and innovation of medical devices contribute greatly to improving the quality and efficiency of medical services [37]. Artificial intelligence (AI) can be used in medicine to diagnose, treat and predict diseases [38]. The results of Almina et al.’s study showed that the overall performance of AI in cardiovascular application models was above 83%, which could be used as a diagnostic tool in the future [39]. Rachel et al. found that the introduction of machine learning (ML) algorithms into medical device (MD) management strategies benefit healthcare organizations not only in terms of improving the safety and quality of patient diagnosis and treatment, but also in terms of cost optimization and resource management [40].
In this study, we confirmed our hypothesis that patients with subacute stroke still have significant cardiac dysfunction. We monitored the cardiac output function of two groups in real time using non-invasive cardiac output. On further comparison, we found that of the six parameters observed, SVRI, SVI and CI values were the most indicative of cardiac dysfunction in stroke patients. At the same time, these parameters suggest that cardiac dysfunction in stroke patients may be closely related to the increased peripheral vascular resistance caused by infarction and the limitation of myocardial systolic function.
Footnotes
Conflict of interest
None to report.
Funding
This study was supported by the Traditional Chinese Medicine Bureau of Guangdong Province (Grant number 20211346) and Shenzhen Science and Technology Program (Grant number: RCBS20210609104401012).