
Abstract
An important application of semantic technologies in industry has been the formalisation of information models using OWL 2 ontologies and the use of RDF for storing and exchanging application data. Moreover, legacy data can be virtualised as RDF using ontologies following the ontology-based data access (OBDA) approach. In all these applications, it is important to provide domain experts with query formulation tools for expressing their information needs in terms of queries over ontologies. In this work, we present such a tool, OptiqueVQS, which is designed based on our experience with OBDA applications in Statoil and Siemens and on best HCI practices for interdisciplinary engineering environments. OptiqueVQS implements a number of unique techniques distinguishing it from analogous query formulation systems. In particular, it exploits ontology projection techniques to enable graph-based navigation over an ontology during query construction. Secondly, while OptiqueVQS is primarily ontology driven, it exploits sampled data to enhance selection of data values for some data attributes. Finally, OptiqueVQS is built on well-grounded requirements, design rationale, and quality attributes. We evaluated OptiqueVQS with both domain experts and casual users and qualitatively compared our system against prominent visual systems for ontology-driven query formulation and exploration of semantic data. OptiqueVQS is available online and can be downloaded together with an example OBDA scenario.
Introduction
Adoption of semantic technologies has been a recent development in many large companies such as IBM [34], the steel manufacturer Arcelor Mittal [5], the oil and gas company Statoil [52], and Siemens [2,55,74]. An important application of these technologies has been the formalisation of information models1
An information model is a representation of concepts and the relationships, constraints, rules, and operations to specify data semantics for a chosen domain of discourse [60], such as functionality of and information flow between different assets in a power plant [51,72].
In all these applications, it is important to provide domain experts – who have extensive domain knowledge but not necessarily skills and knowledge in semantic technologies and formal query languages such as SPARQL – with query formulation tools for expressing their information needs over ontologies. The problem of query formulation for end users has been acknowledged by many [7,21,36,85] and numerous systems have been developed so far. These systems can be categorised as follows:
Textual query editors (e.g., the Virtuoso SPARQL Query Editor2
See e.g.
Keyword search (e.g., [14]) interprets a query as a bag of words. These systems are simple to use, but are inherently limited in expressiveness. There are approaches, such as KESOSD [63] and SWSE [42], that aim at increasing the accuracy and completeness of keyword search.
Natural language interfaces (e.g., [47,62]) interpret natural language phrases as queries, taking linguistic considerations into account, but suffer from ambiguities and linguistic variability. There are approaches to overcome this problem, such as user dialogues for feedback and clarification [26].
Visual query languages (VQL), such as RDF-GL [43] and QueryVOWL [38], are based on a well-defined formal semantics with a visual notation and syntax. They are comparable to formal textual languages as they demand technical skills and knowledge to interpret the visual formalism.
Visual query systems (VQS) [21], such as Rhizomer [15] and Konduit VQB [4], are based on a system of interactions rather than a visual formalism, and therefore can have a design demanding no or limited technical background. They often compromise expressivity to reach a fine balance between expressiveness and usability.
To the best of our knowledge, no system from any of these categories has been developed to meet industrial requirements or evaluated with industrial users. In this work we present a VQS, namely OptiqueVQS [86,92], which is designed upon (i) requirements from Statoil and Siemens consolidated during the joint OBDA project Optique3
Optique project:
OptiqueVQS implements a number of unique techniques that distinguish it from comparable query formulation systems. In particular:
it exploits ontology projection techniques to enable graph-based navigation over an ontology during query construction;
while OptiqueVQS is primarily ontology driven, it exploits sampled data to enhance selection of data values for some data attributes;
it is built on well-grounded requirements, design rationale, and quality attributes; and
it is evaluated with different types of end users in different contexts.
We evaluated OptiqueVQS with different user groups and contexts: a study involving casual users [86]; a comparative study with PepeSearch (a form-based query interface) [103]; and three studies with Statoil and Siemens domain experts reported in this article. Our studies provided encouraging results; in particular, studies with Statoil and Siemens users revealed that domain experts could use OptiqueVQS to formulate queries meeting their daily data needs in a few minutes with high effectiveness and efficiency.

OptiqueVQS in context – possible scenarios and architectural overview.
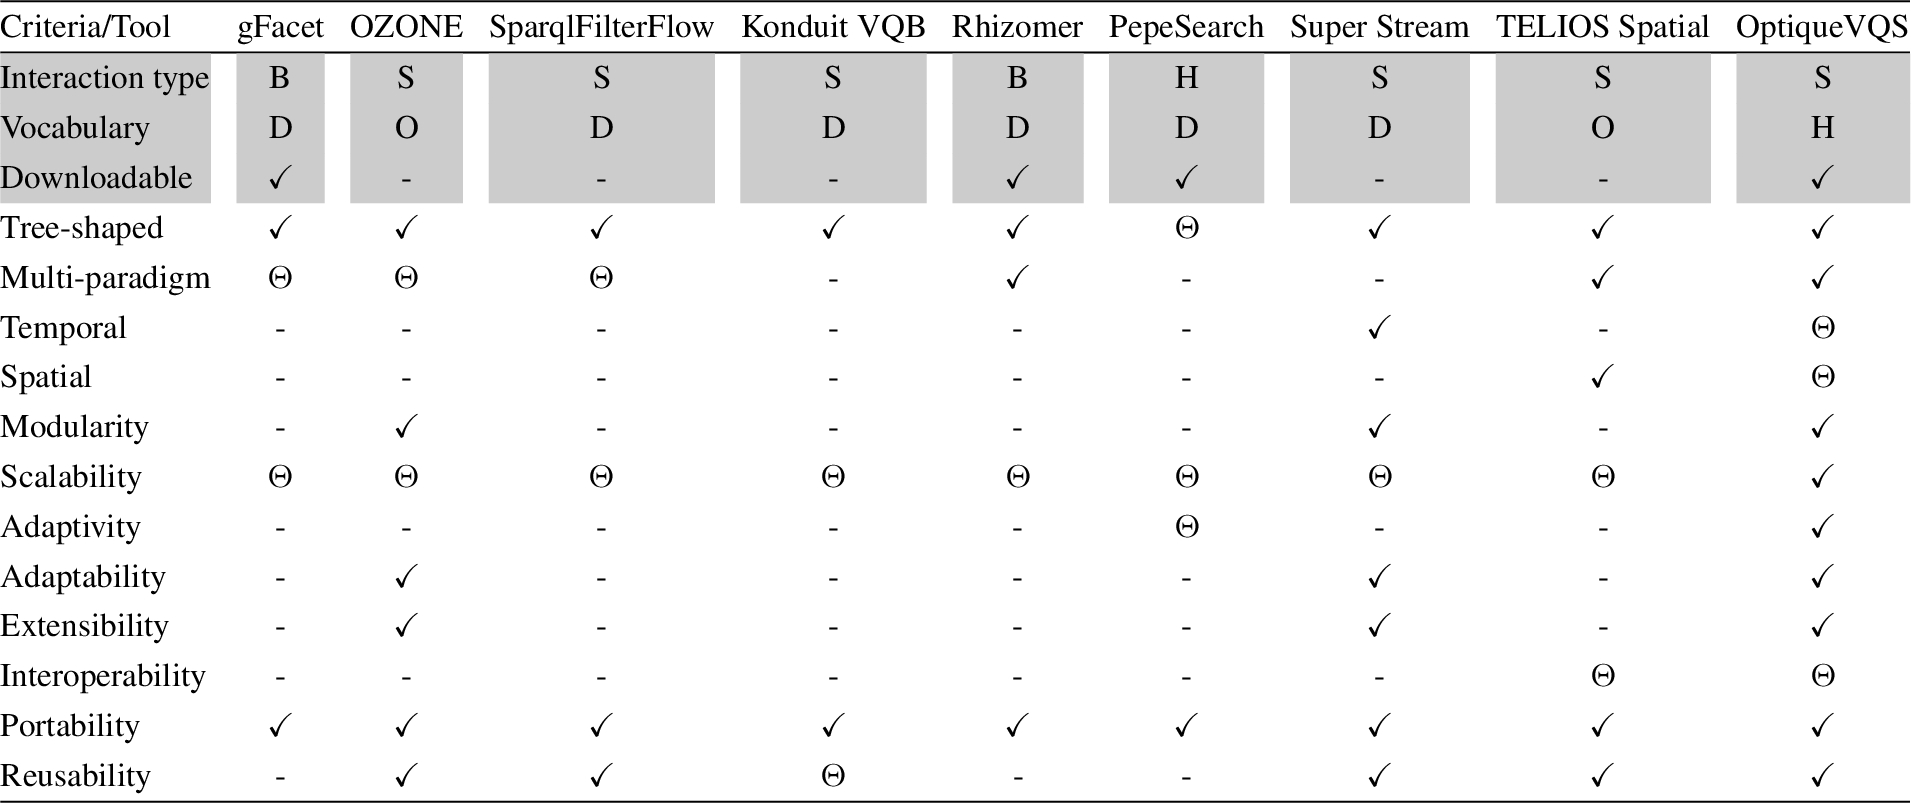
Finally, we qualitatively compared OptiqueVQS against prominent existing visual systems for ontology-driven query formulation and exploration of semantic data that are the most relevant to our system. For the comparison, we considered gFacet [41], OZONE [95], SparqlFilterFlow [37], Konduit VQB [4], Rhizomer [15], PepeSearch [102], Super Stream Collider framework [73], and TELIOS Spatial [28]. The comparison revealed that OptiqueVQS possesses an important set of quality attributes relevant in an industrial context, while others meet only a few of them. OptiqueVQS is available online and can be downloaded together with an example OBDA scenario including a data set, an ontology, mappings etc. from the project’s website (see Section 6 for details).
The rest of this article is organised as follows: in Section 2, we highlight the main contributions of this article with links to our related work. In Section 3, we present preliminary notations and concepts used throughout the article. In Section 4, we present the Statoil and Siemens use cases. In Section 5, we discuss a set of requirements and quality attributes, while in Section 6, we present OptiqueVQS itself. In Sections 7 and 8, we evaluate OptiqueVQS, first against the requirements and then using a set of usability studies. In Section 9, we discuss related work and similar tools, while in Section 10 we discuss both our main findings and the limitations of OptiqueVQS. Finally, we conclude the article and discuss the future work in Section 11.
OptiqueVQS can be used in two different scenarios – see Fig. 1: directly over a triple store through an endpoint (i.e., scenario A), or over an OBDA framework that virtualises relational data into RDF (i.e., scenario B). In both scenarios, the setup consists of two parts. Part A deals with visual query formulation and Part B with query answering. The contributions of this article fall into visual query formulation (i.e., part A), while OBDA is the application scenario (i.e., scenario B) [32].
Our work builds on several iterative and self-standing focused research activities complementing each other. This article extends our previous work on OptiqueVQS in several important directions. In particular, we present:
a detailed account of the Statoil and Siemens use cases, characterising existing data sources, data access infrastructures, end-users, and data access routines such as the frequency of interaction, variance of query tasks, and structural complexity of query tasks;
requirements collected systematically, including a comprehensive analysis and classification of representative queries collected from use cases and established best practices culled from experience with visual query systems for relational databases;
a qualitative comparison with eight other query formulation systems based on quality attributes collected from literature and a set of corresponding features realising the suggested quality attributes;
a detailed analysis of design choices behind OptiqueVQS supporting the design rationale behind each representation and interaction paradigm and extensions for spatial and temporal query formulation support;
three extensive user studies with domain experts at Siemens and Statoil and a discussion of limitations and key findings from these studies; and
an improved and extended OptiqueVQS backend presented in detail, including its expressive power and the role of and motivation behind each individual component.
Regarding the links to our previous and related work, extensions (a), (b), (c), and (d) follow the methodology and a qualitative analysis of visual query formulation approaches that we extracted through a survey [82,85]. We discussed initial ideas on design and implementation of OptiqueVQS with domain experts at Statoil and Siemens (d) by rapidly developing a prototype [83,92].
An early user study with casual users on a generic domain [86] provided us with early insights before experimenting with the domain experts (e); – domain experts often have constrained availability, while casual users are more accessible and have desired characteristics for our purposes (i.e., lack of technical knowledge and skills). Additionally, a comparative user study [103] allowed us to compare the suitability of graph and form-based paradigms for different user groups (d) and revealed supporting evidence for our core design choice. The OptiqueVQS backend [86,89] has been consolidated continuously as a result of the requirements collected through user experiments (f). For example, we developed a technique for ranking and ordering ontology elements (i.e., adaptive query formulation) based on query logs (f), which falls outside the scope of this article but is presented elsewhere [84].
The Optique solution, as an end-to-end OBDA framework including OptiqueVQS, has been deployed in Statoil [49,50,52] and Siemens [53,56,57]. The specifics of OBDA setup, such as mappings, query transformation, deployment, and query answering (i.e., the part B of scenario B) are also beyond the scope of this article.
Preliminaries
In the following, we give a brief tour of some notions from description logics (DL), RDF, OWL, SPARQL queries and their semantics. The goal of this section is to semi-formally introduce some relevant semantic web notions that we follow, in order to prepare the reader for the examples and explanations appearing in the article. Since in this article we study how to support the construction of queries over ontologies in industrial settings and focus mostly on user driven requirements rather than complexity and other formal accounts, we make the formal descriptions below light weight and refer the reader to relevant material for more details.
We use standard notions from first-order logic. We assume pairwise disjoint countably infinite sets of constants, unary predicates (also called classes or atomic classes) and binary predicates (also called properties). Constants, in turn, are divided into disjoint sets of objects (also called individuals) and literal values. A fact is a ground atom and a knowledge base is finite set of facts.
An ontology is a finite set of first-order sentences. The web ontology language OWL 2 [25] is a recursive set of ontologies, closed under renaming of constants and the subset relation. Each OWL 2 ontology can be represented using a specialised DL syntax [8,45] where variables are omitted and which provides operators for constructing complex concepts and properties from simpler ones, as well as a set of axioms. The semantics of an OWL 2 ontology is defined in a standard way using first-order interpretations [65]. Note that, for convenience and readability, in the examples we use the Manchester OWL syntax [44], which is a user-friendly compact syntax for OWL 2 ontologies
For example, consider the following statement about the application domain:
SPARQL [40] is the standard query language to access RDF data. SPARQL queries are defined in terms of basic graph patterns (BGPs)
Industrial use cases
In the context of the Optique project, the development and evaluation of OptiqueVQS was guided by use cases from Statoil and Siemens, including sample queries and data sets. In both cases, domain experts typically access relevant data through predefined queries. IT experts, who have extensive technical knowledge but often lack domain knowledge, extract relevant data through an extract-load-transform (ETL) process [29] when an information need is not met through available queries. However, this approach is quite inefficient and highly iterative due to miscommunication between IT experts and domain experts, high workload of IT experts, complexity of query formulation, and long query execution times.
Statoil and Siemens have their data stored in relational databases rather than triple stores, as majority of the world’s enterprises do. In the Optique project, the use case data sets have been represented as knowledge bases using an OBDA technology to enable in-place querying of legacy relational data sources [32]. OBDA technologies are important in the context of visual query formulation as well, as they extend the reach of ontology-based visual query formulation from triple stores to relational databases; hence, raising it as a viable and realistic solution for all. The OBDA approach we employed is built on two mechanisms [18,22,94]:
mappings declaratively relate ontological terms with the underlying data and are used to virtualise the relational data in databases into graph data expressed over a language defined in an ontology;
and query rewriting is used to expand and translate the posed queries (e.g., SPARQL) into the language of the underlying relational database system (e.g., SQL) hosting the data for execution.
The specifics of the OBDA framework are out of scope of this work; therefore, we refer interested readers to the Optique project [31,32,52,57].
In the following subsections, we describe the characteristics of each use case. We believe that they are representative for many of the data access challenges faced by today’s data-intensive industries. Descriptions were provided by the organisations themselves and confirmed through interviews and on-site visits. We highlight and mark some parts of the descriptions as evidences (i.e.,En) supporting the requirements presented in Section 5. Due to corporate confidentiality policies, some numbers in the descriptions have been approximated.
Statoil use case
The overall goal of the Statoil use case in the Optique project is to enable geologists and geoscientists at Statoil to find answers to their information needs – questions that generally concern locating new petroleum deposits – and there are currently 900 geologists and geophysicists in Statoil accessing data routinely(E1). Domain experts with technical skills and knowledge are rare. There are several complex and large databases and schemas in use are typically designed from an abstract generic information model and present themselves quite obscurely to their end users. For example, one of the databases, called EPDS, currently has about 3,000 tables with about 37,000 columns. Building interesting SQL queries require therefore in many cases a very large number of table joins (i.e., 50 to 200 joins)(E2), thus making the task of handcrafting SQL queries towards this database a very complex and time-consuming process.
To access the data sets, Statoil personnel use special purpose software tools that contain predefined and mostly generic queries. The data sets are never directly accessed by domain experts through hand-written queries. Hence, in order to answer specific and detailed information needs a Statoil domain expert must gather data from the answer sets of multiple such predefined queries and process the answers by manipulating, joining and filtering the data in other software tools, like spreadsheet applications. This is a manual task that is prone to error, inefficient and difficult to automate and reproduce. Moreover, the database extraction tool is complex and contains a large number of predefined queries(E3), so finding the correct queries can be an elaborate process. Due to the complexity of the tool and the underlying database schema new queries are in practice never added to the tool. Domain experts spend considerable time on data extraction activities daily in oil & gas industry; in Statoil 30–70% of time spent on analytics task is used for extracting the right data(E4); therefore, in this situation, the value creation potential is severely limited.
Siemens use case
Siemens runs several service centres for power plants, each responsible for remote monitoring and diagnostics of many thousands of gas/steam turbines and associated components such as generators and compressors. Diagnosis engineers working at the service centres are informed about any potential problem detected on site(E5). Unlike Statoil, a good number of diagnosis engineers at Siemens have technical skills and knowledge. They access a variety of raw and processed data with predefined queries in order to isolate the problem and to plan appropriate maintenance activities. For diagnosis situations not initially anticipated, new queries are required, and an IT expert familiar with both the power plant system and the data sources in question has to be involved to formulate various type of queries; in Siemens there are around 4,000 predefined queries and query patterns. On average, 35 queries are modified monthly, 10% of queries are modified yearly, and several new queries are added every month(E6). Thus, unforeseen situations may lead to significant delays of up to several hours or even days.
The required data is spread over hundreds of tables with very complex structure for event data; the database size is in the order of hundreds of terabytes growing at a rate of 30 GB per day coming from appliances (up to 2,000 sensors in each) and static data sources(E7). With few built-in features for manipulating time intervals, traditional data base systems offer insufficient support for querying time series data, and it is highly non-trivial to combine querying techniques with the statistics-based methods for trend analysis that are typically in use in such cases. Domain experts’ daily routines are very data intensive, and they spend 80% of their diagnostic time on gathering the relevant data(E8). IT experts will not be required anymore for adding new queries, and manual pre-processing steps can be avoided by enabling domain experts to formulate complex queries on their own with respect to an expressive and high-level domain vocabulary.
Requirements
Domain experts have in-depth knowledge and understanding of the semantics of their domain of expertise. However, they might or might not have technical skills and knowledge on programming, databases, and query languages. In the latter case, they often have low tolerance, intention, or time to use and learn formal textual query languages. Therefore, our primary goal is to provide a visual query specification mechanism for users who cannot or do not desire to use formal textual query languages to retrieve data. We also expect that domain experts with technical skills and knowledge could often benefit from the availability of such visual mechanism, particularly if they are given the opportunity to switch between textual and visual query formulation within a task.
Visual query formulation [21,82,85] as an end-user development paradigm [61] is promising to remediate the end-user data access problem. It is built on the direct manipulation idea [77], in which end users recognise and interact with the visual representations of domain elements, rather than recalling domain and syntax elements and programmatically combining them. Epstein [30] considers visual approaches for query formulation in two categories, VQS and VQL, which we introduced earlier. However, a VQL, compared to a VQS, demands considerable technical skills and knowledge to interpret the visual semantics and syntax and to understand the relevant technical jargon.
A VQS has to support certain data access efforts: exploration, i.e., understanding the reality of interest, which relates to the activities for understanding and finding schema concepts and relationships relevant to the information need at hand; and construction, which concerns the compilation of relevant concepts and constraints into formal information needs (i.e., queries) [21]. On these grounds, the choice of visual representation and interaction paradigms along with the underlying metaphors, analogies etc. is of primary importance. Catarci et al. [21] classify VQSs with respect to both visual representation paradigms such as forms, diagrams and icons, and interaction paradigms such as navigation and browsing. The choice of appropriate representation and interaction paradigm depends on query, task, and user types, e.g. variance of query tasks, structural complexity of queries, and users’ familiarity with the subject domain [21].
One should also realise the distinction between browsing and querying. Browsing means that users, to a large extent, operate at data level to filter down an information space using e.g. faceted search interfaces (e.g., [99]). When querying, which we predominantly use in OptiqueVQS, users directly interact with the vocabulary of the domain (concepts and relations) (e.g., [11]), but not directly with concrete data as e.g. in OLAP cube interfaces. This is necessary because:
the queries we need to pose are more complex than what can be achieved by more data oriented interfaces;
and both the evaluation of those queries and the caching of all possible precomputed results would use too much resources.
For domain experts and other non-skilled users, query formulation is a complex task; therefore, an end-user visual query formulation tool is often limited in expressiveness to ensure good usability. End users make very little use of advanced functionalities and are likely to drop their own requirements for the sake of having simpler ways for basic tasks [20]. But even a VQS at the right level of expressiveness is not necessarily adopted by end users and organisations unless it also reaches a certain level of quality in terms of user experience, system design, and run-time performance.

An analysis of the Statoil and Siemens query catalogues.
Overall, we highlight three main challenges:
Identifying common query types (i.e., typicality) that are reasonably complex (i.e., perceived complexity) and would meet the majority of end-users’ information needs to set an appropriate balance between usability and expressiveness.
Identify query, task and user types at hand in order to select representation and interaction paradigms that fit best.
Identify a set of quality attributes [48], i.e., non-functional requirements, ensuring that a VQS can function and evolve as needed.
In the following, we list an elaborate set of requirements in terms of expressivity and quality attributes.
Description of query types
Description of query types
In order to address C1, we first studied the typicality by constructing a query catalogue from 97 representative sample queries provided by Statoil in natural language. Information needs in the query catalogue are considered as patterns of information needs, and each such request represents one topic that geologists are typically interested in. We verified with domain experts that the catalogue provides a good coverage for the information needs of Statoil geologists.
Two SPARQL experts reformulated these information needs in SPARQL given a domain ontology. Then we made a syntactical analysis of the query catalogue (see Fig. 2) with respect to notable query types described in Table 1 and with respect to the SPARQL specification [40]. These query types include conjunctive queries (QT1), disjunctive queries (QT2), queries with cycles (QT3), queries with aggregation (QT4), queries with negation (QT5), and ground queries (QT6). The identification of queries of QT1, QT2, QT4 and QT5 are straight forward as they are built on clear SPARQL operators; however, identification of QT3 queries is more involved as it relates to the topology of a given query. Therefore, we transformed each query into an undirected-labelled graph and executed a cycle detection algorithm to identify QT3 queries.
The analysis suggests that the majority (64%) of Statoil’s queries are ground queries – see Fig. 2(a). A similar analysis of queries supplied by Siemens later in natural language revealed that a large part (40%) of Siemens’ queries are ground queries – see Fig. 2(b). These analyses are in line with the literature suggesting that many user queries are tree-shaped conjunctive queries [69] – i.e., conjunctive queries without cycles. Considering perceived complexity by the end users, we assumed queries including cycles and queries including disjunction and negation, particularly at object property level, to be comparatively harder. The first group requires visiting the same node twice in a query, while the second group requires a deeper understanding of these notions. Therefore, we are led to the first requirement:
Support the formulation of tree-shaped conjunctive queries.
Framework for selecting the representation paradigms
In order to address C2, we conducted a thorough conceptual literature survey [85]. Particularly the longstanding literature on visual query formulation over relational databases reveals a substantial number of findings [21]. We employed the framework suggested by Catarci et al. [21] and considered dimensions presented in Table 2 to identify suggested paradigms for each dimension in the order of priority. All queries in the query catalogues are unique and cover a wide range of typical information needs. The query catalogues show that respectively 73% and 60% of queries involve more than three concepts, referring to a high structural complexity (Fig. 2). These evaluations led us to the second requirement:
Provide a multi-paradigm user-interface where a diagram-based paradigm has the central role and is supported by form-based and iconic representation paradigms.
This requirement is inline with one global finding that visual query tools that combine multiple representation and interaction paradigms are better to address varying user, task, and query types [21,46].
One should note that the Siemens case focuses on streaming sensor data (i.e., temporal queries), which leads to somewhat more domain-specific requirements on the user interface – i.e., the possibility to involve stream properties and to select relevant stream templates and parameters. This is also partly valid for Statoil as queries often deal with geographical data (i.e., spatial queries), and domain experts would benefit a lot from a map component for constraining and selecting data values. Therefore, a third requirement also needs to be met:
Provide domain-specific components for dealing with temporal and spatial data sources.
We derived a set of quality attributes for VQSs from an end-user development perspective in order to meet C3. Quality attributes are non-functional requirements that effect run-time behaviour, design, and user experience and effectively increase the benefits gained and decrease the cost of adoption for end users [96]. We followed the approach employed by Khalili and Auer [48] and extracted a set of quality attributes. For this purpose, we used the conceptual survey we conducted earlier [82,85] as well as input we received from the use case partners. In the following, we describe the attributes, which are relevant in our context.
Discussion
A VQS should not be considered in isolation from the context, which could be characterised by a variety of dimensions such as user, task, data, and organisation [27,80]. In this respect, quality attributes presented previously are related and support usability directly/indirectly. They mainly ensure sustainability against potential variances in context. In other words, they support the evolution of a VQS against ever-changing context dimensions without losing the expressiveness-usability balance. For example, the heterogeneity of data necessitates domain-specific presentation and interaction components for improved user experiences. In this respect, modularity and extensibility plays an underpinning role by facilitating the development and integration of such components. Another example would be the organisational context: a VQS is often a part of larger tool portfolio for data extraction, analysis, and decision-making, and in this context interoperability is valuable to ensure a seamless orchestration.
One of the main problems that typical VQSs face is the scalability against large ontologies [46]. A VQS has to provide its users with fragments of the ontology (e.g., concepts and properties) continuously, so that users can select relevant ontology elements and iteratively construct their queries. However, even with considerably small ontologies, the number of concepts and properties to choose from increases drastically due to the propagation of property restrictions [23]. In turn, the high number of ontology elements overloads the user interface and hinders usability (i.e., scattering and cluttering). This can be approached with progressive disclosure technique meaning disclosing only the minimal amount of information and functionality required for the task at hand gradually and on demand. Another prominent approach is adaptivity [16], that is in our context selecting and displaying the most relevant fragments of the ontology at each step.
The structural complexity of query tasks deserves special attention for choosing the right representation and interaction paradigms. Our use cases come with non-simple query tasks, which are structurally complex. Respectively, navigational interaction style becomes essential, i.e., query by navigation (QbN) [90,97]. Recent faceted search approaches, which are originally used to browse instances of a single concept, strive to offer the possibility to navigate and combine a number of concepts and create complex structures to retrieve data (e.g., [6,15]). We consider graph-based representation and navigation as an appropriate choice in this respect. This is because graphs are effective mechanisms to navigate, construct, and communicate complex topological structures for end users [21,46]. Secondly, it is well-known that the majority of end-user queries are conjunctive, and thus, in the semantic web setting, they could naturally be seen as graphs since we are dealing with unary and binary predicates only.
OptiqueVQS
OptiqueVQS is composed of an interface and a navigation graph extracted from the underlying ontologies. The interface components are populated and driven according to the information in the navigation graph. In the following subsections, we present each part.
OptiqueVQS generates non-temporal queries in SPARQL [40], while in temporal cases generates queries in STARQL [67]. STARQL provides an expressive declarative interface to both historical and streaming data. We chose STARQL since it supports OBDA, but OptiqueVQS could potentially generate queries in any other language. Technical details of STARQL are beyond the scope of this article; interested readers are referred to relevant material [56,67,87].
Regarding the spatial queries, OptiqueVQS generates queries still in SPARQL and qualitative spatial predicates (containment, overlap etc.) are supported by VQS as regular predicates. Their special meaning is taken care of by the OBDA platform, either by mapping to geospatial operations in the database, or to some materialised representation of these relations [49]. Besides, a map component allows selecting entities based on their geospatial location, rather than by name.
OptiqueVQS is available online together with the whole Optique platform, a comprehensive tutorial, and an example OBDA scenario including an ontology, a sample data set, and mappings for online testing and download.4
Access to OptiqueVQS online demo and the whole Optique platform with an example OBDA scenario:

OptiqueVQS interface – an example query in visual mode.
The OptiqueVQS interface is designed as a widget-based user-interface mashup (UI mashup), which aggregates a set of applications in the form of widgets in a common graphical space and orchestrates them for achieving common goals [91]. Apart from flexibility and extensibility, such a modular approach provides us with the ability to combine multiple representations and interaction paradigms, and distribute functionality to appropriate widgets.
Initially, three widgets appear in OptiqueVQS, as depicted in Fig. 3 (recall R2 at Section 5):
The first widget is a menu-based QbN widget accompanied with icons that allows the user to navigate concepts by picking relationships between them (see the bottom-left part of Fig. 3).
The second widget is form-based and presents the attributes of a selected concept for selection and projection operations (see the bottom-right part of Fig. 3).
The third widget is diagram-based and presents the constructed query and affordances for manipulation (see the top part of Fig. 3) .
On the one hand, W1 and W2 provide a view; i.e., they focus the user to the current phase of the task at hand by providing means for gradual and on-demand exploration and construction. On the other hand, W3 provides an overview, i.e., an outlook of the query formulated so far, and lets the user refocus. These three widgets are orchestrated by the system, through harvesting event notifications generated by each widget as the user interacts.

OptiqueVQS interface – an example query in textual mode.
A typical interaction between the user and the interface happens as follows:
the user first selects a kernel concept, i.e., the starting concept, from W1, which initially lists all domain concepts with their descriptions;
the selected concept appears on the graph (i.e., W3) as a variable node and becomes the pivot (active, focus) node (i.e., the node coloured in orange or highlighted);
W2 displays the attributes of the selected variable node in the form of text fields, range sliders, etc., so that the user can select them for output or constrain them;
the attributes selected for output (i.e., using the “eye” button) appear on the corresponding variable node with a letter “o”, while constrained attributes appear with a letter “c”;
the user can further refine the type of variable node from W2 by selecting appropriate subclasses, which are treated as a special attribute (named “Type”) and presented as a multi-selection combo-box form element;
once there is a pivot node, each item in W1 represents a combination of a possible relationship-range concept pair pertaining to the pivot (i.e., indeed a path of length one);
a selection of path/item in W1 triggers a join between the pivot and the new variable node (of type range concept) over the specified relationship, and the new variable node becomes the focus (i.e., pivoting).
The user has to follow the same steps to involve new concepts in the query and can always jump to a specific part of the query by clicking on the corresponding variable node in W3. The arcs that connect variable nodes do not have any direction, but are implicitly read left to right. This is because for each active node only outgoing relationships and inverses of incoming relationships are presented for selection in W1. An example query is depicted in Fig. 3 for the Statoil use case. The query asks for all the wellbores that belong to a development well and are operated by a company. In the output, we want to see the name of the wellbore, the synchronisation date and the name of the company.
The user can delete nodes, access the query catalogue, save/load queries and undo/redo actions through affordances provided by the buttons at the bottom part of W3. W3 indeed acts as a master widget, since it possesses the whole query and deals with its persistence. The user can re-use existing queries stored in the system by anyone, hence could modify an existing query to fit his/her current needs.
The user can also switch to an editable SPARQL mode and see the textual form of a query by clicking on “SPARQL Query” button at the bottom-right part of W3 as depicted in Fig. 4. The user can keep interacting with the system in the textual form and continue to the formulation process by interacting with the widgets. For this purpose, the pivot/focus variable node text is highlighted and every variable node text is associated with a hyperlink to allow users to change the focus. Availability of the textual mode and its synchronisation with the visual mode enable us to realise collaboration between end users and IT experts. Especially for highly complex queries, IT experts could provide help on the textual mode, which they are expected to be more comfortable with, while end users can keep working on the visual mode. Moreover, from a didactic perspective, end users, who are eager to learn the textual query language, could switch between two modes and see the new query fragments being added/deleted after each interaction. Note that the SPARQL mode is constrained, in terms of expressiveness, to what can be represented in the visual mode.
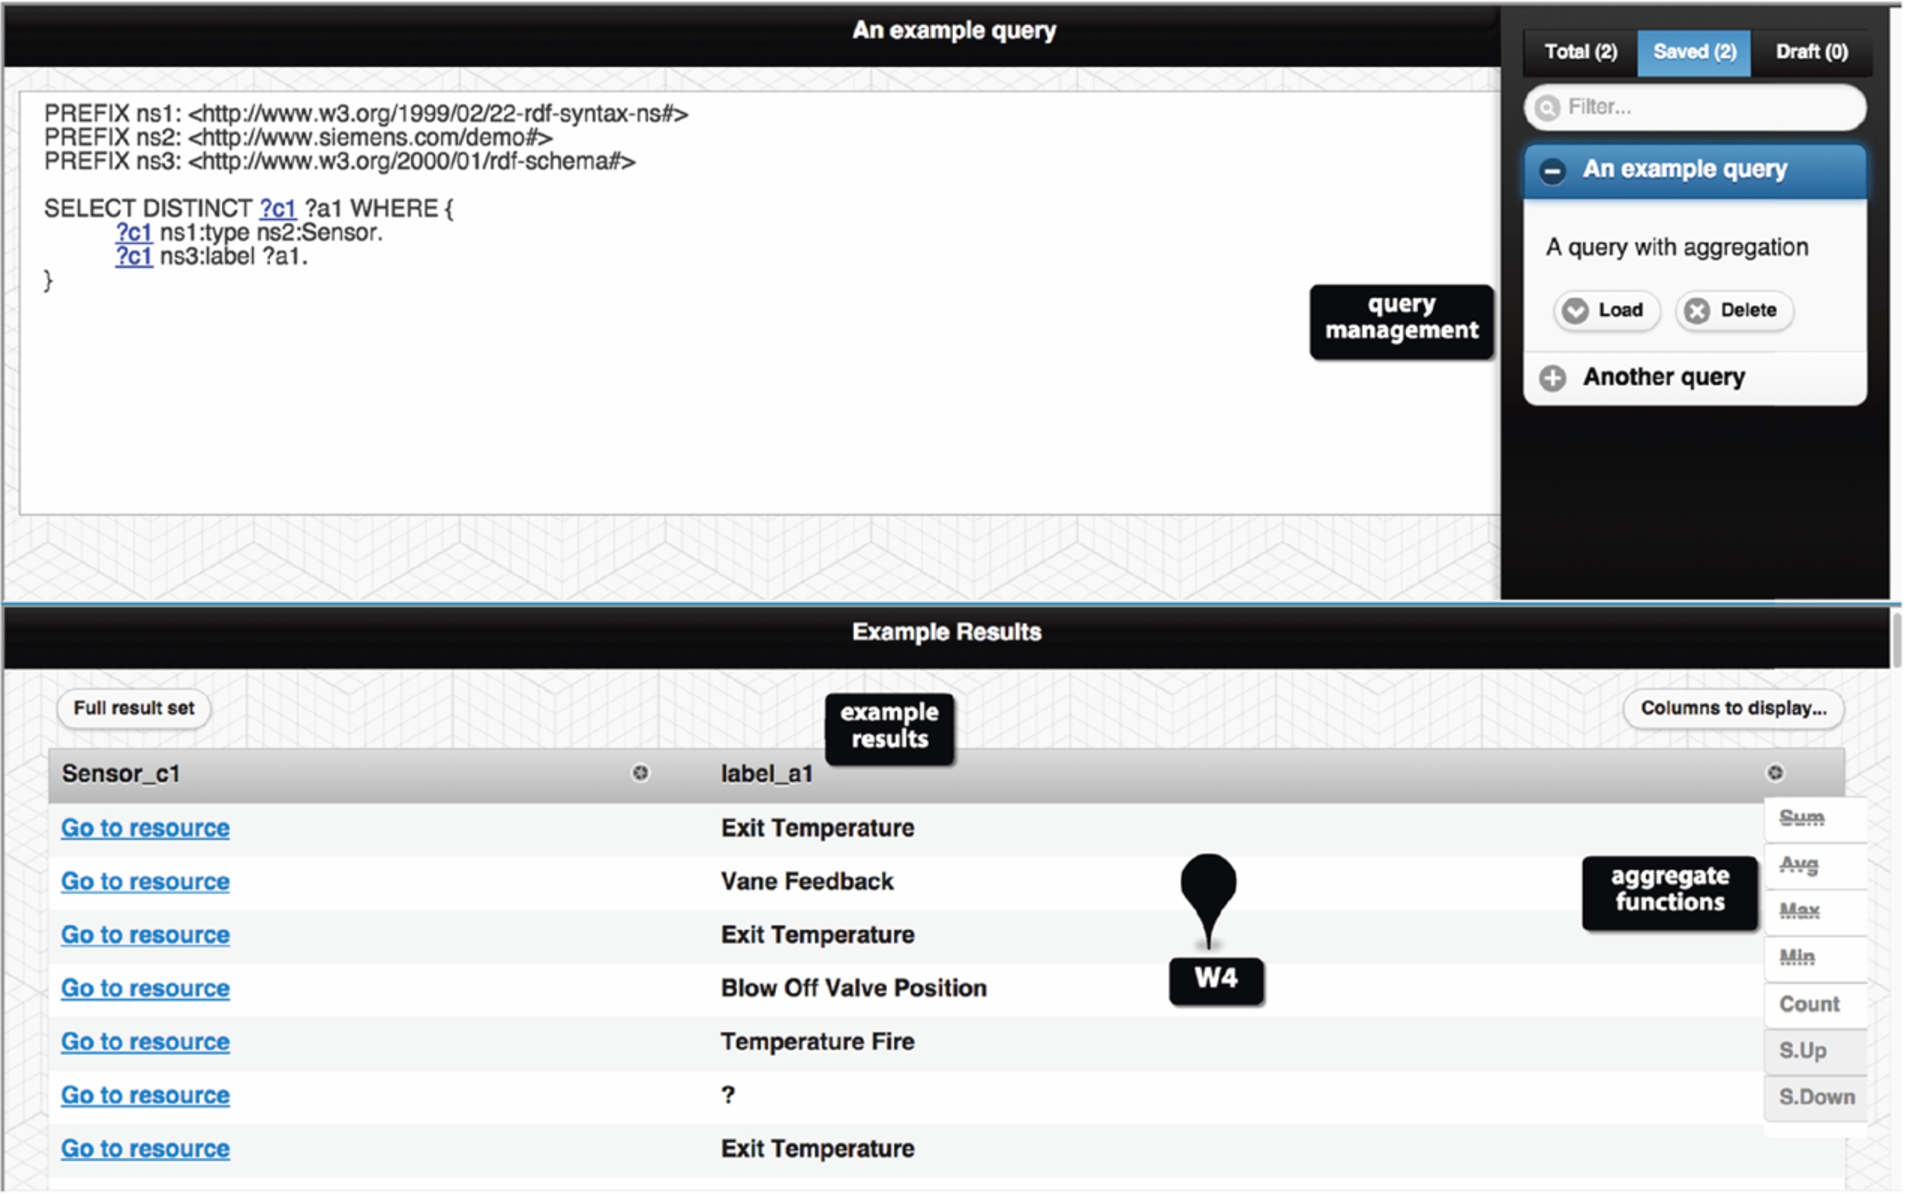
OptiqueVQS interface – the tabular result widget with aggregation and sequencing support.
We extended OptiqueVQS with three new widgets, which provide evidence on how a widget-based architecture allows us to distribute and hide complex functionality to/behind layers and combine different paradigms. One widget is for viewing example results, the other two widgets are addressing spatial and temporal use cases. They are activated by annotating (via OWL annotations) relevant properties as temporal or spatial (recall R3 in Section 5). The widgets are described as follows:
The fourth widget is a tabular result widget and appears as soon as the user clicks on the “Run Query” button (see Fig. 5). It provides an example result list for the current query and also affordances for aggregation and sequencing operations.
Aggregation and sequencing operations fit naturally to a tabular view, since it is a related and familiar metaphor. Users can also view the full result list, inspect the individuals, and export data. For these purposes, in Optique, we use the Information Workbench (IWB)5
The fifth widget is a map widget. It is a domain-specific component for Statoil use case, and it allows end users to constrain attributes by selecting an input value from the map (see Fig. 6).
A button with a pin icon is placed next to every appropriate (i.e., annotated as spatial) attribute presented in W2 to activate the map widget.

OptiqueVQS interface – the map widget.
The sixth widget is a domain-specific component and supports temporal queries in the context of Siemens use case (see Fig. 7).
OptiqueVQS produces temporal queries in STARQL. OptiqueVQS switches to STARQL mode when the user selects a dynamic property (i.e., whose extensions are time dependent, and coloured in blue). A stream button appears on top of W1 and lets the user configure streaming parameters such as slide (i.e., frequency at which the window content is updated/moves forward) and window width interval. If the user clicks on the “Run Query” button, a template selection widget (W4) appears for selecting a template for each stream attribute, which is by default “echo” (see Fig. 8); W4 is normally used for displaying example results in SPARQL mode. The example query depicted in Fig. 7 and Fig. 8 asks for a train with turbine named “Bearing Assembly”, and queries for the journal bearing temperature reading in the generator. The user can register the query in W4 by clicking on the “Register query” button for continuous execution.
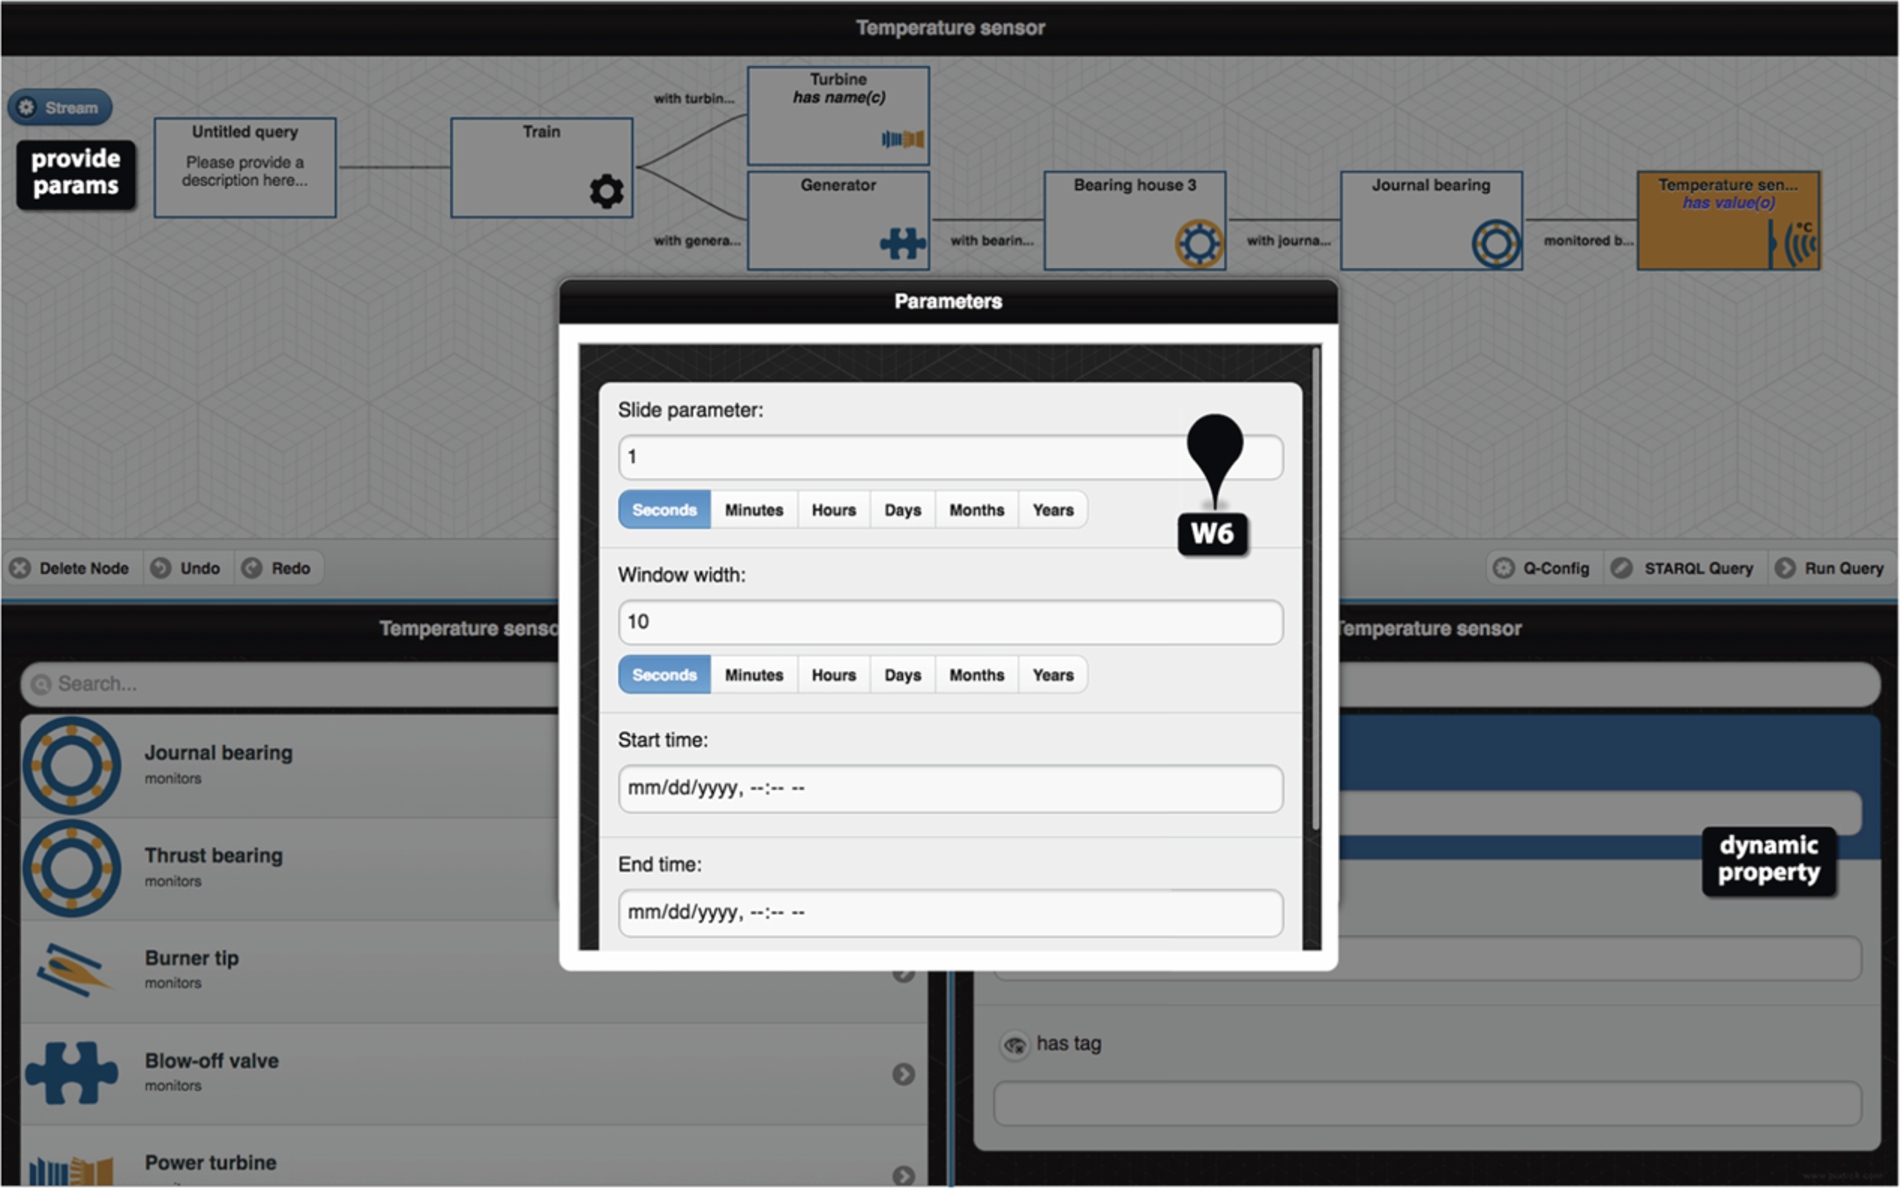
OptiqueVQS interface – the stream parameter selection widget.

OptiqueVQS interface – template selection for a stream query.

OptiqueVQS backend architecture.
The usability of OptiqueVQS is built on several design choices. In this section, we address the local design choices concerning the implementation of individual widgets. Major local design choices involve:
tree-shaped query representation (W3) is meant to increase comprehensibility compared to generic graph representations with arcs and nodes directed and placed to arbitrary points;
inverted object properties (W1 and W3) ensure a direction-free query representation and navigation in order to increase the visual readability of the query formulated;
object property – range concept pairs (W1) decrease the number of navigational steps; i.e., rather than selecting an object property then a range concept, the user can select a pair at a single step;
simplified type refinement (W2) reduces the type refinement to the attribute level; that is, the list of subclasses presented as an ordinary form element to provide a simplified and familiar solution.
In general, such design choices provide an orderly presentation and hide complexity and technical jargon related to the graphs, query language, and ontologies effectively, so as to reduce the cognitive load and knowledge and skills required. The semantics and syntax of the underlying query language and ontology are not delivered as they are; however, a correct translation from end-user operations to the query language is ensured.
For example, in a variant of OptiqueVQS, a graph representation is employed along with ingoing/outgoing arc distinction. In a user study with casual users, the participants complained about disorder in the presentation and their confusion due to the ingoing/outgoing relation distinction [103]. However, in another study with original OptiqueVQS with casual users, the participants praised the order and simplicity of the tree-shaped presentation [86].
OptiqueVQS backend
In this section, we present the main components of the OptiqueVQS backend. Currently, the OptiqueVQS backend relies on the infrastructure provided by the IWB. The IWB provides the OptiqueVQS backend with a triple store for storing ontologies, query logs, (excerpts of) query answers, etc., and generic interfaces and APIs for semantic data management (e.g. an ontology processing API). We have also started the implementation of a standalone version of the OptiqueVQS, which will not rely on the IWB.6
For updates, see
The frontend communicates with the backend via a REST API that returns a JSON object according to the performed request. The backend is in charge of accessing (i) the ontology, which drives the information displayed in the frontend, and (ii) the query log, which plays an important role in ranking [84] as well as serving examples for the formulation of similar future queries.
The ontology can optionally be enriched with additional axioms to capture values that are frequently used and rarely changed (refer to the data sampler in the architecture); this includes the list of values and numerical ranges in an OWL data property range (i.e., for max/min sliders and drop-down boxes in W2). We use OWL annotation properties for this purpose.
The number of suggestions presented in W1 and W2 may grow quickly due to ontology size, number of relationships between concepts, inverse properties, and the propagative effect of inheritance of restrictions etc. As the lists grow, the time required for a user to find elements of interest increases; therefore, adaptive query formulation, i.e., ranking ontology elements with respect to previously executed queries (i.e. a query log), is a critical aspect in OptiqueVQS (refer to the ranking component). We implemented a light version of the ranking method described in Soylu et al. [84]. OptiqueVQS ranks suggestions presented in W1 and W2 with respect to the partial query that the user has constructed so far and the query history (i.e., context-aware). A given partial query is compared against similar queries in the query log and a rank is calculated for each possible extension accordingly.
The main component of the backend is the graph projector (described in the next section), which creates a navigation graph according to the ontology axioms. The graph projector in conjunction with the VQS feeder drives the population of the frontend widgets. Regarding the synchronisation of the widgets and the underlying graph, in its initial status OptiqueVQS lists all ontology concepts in W1, while W2 and W3 are empty. Hence, when initialising the OptiqueVQS frontend the backend returns a JSON object containing a list of all the concepts in the ontology. When a concept in W1 (or W3) is selected, that concept becomes the pivot or focus. This selection (from the frontend) triggers three requests (associated to the pivot concept) to the backend, which returns a JSON object for each of the following:
neighbour concepts of the pivot to populate W1;
attributes of the pivot to populate W2;
and subclasses of the pivot to populate attribute “Type” in W2.
Regarding the backend scalability, firstly the computation of the navigation graph as well as enhancement with annotations is done offline; therefore, OptiqueVQS is not doing any heavy computations such as reasoning in real time. Note that the size of the navigation graph is primarily determined by the size of the terminological knowledge (T-box), which is typically much smaller than the size of the assertional knowledge (A-box), i.e., data. Secondly, the navigation graph is kept in the memory on the backend to efficiently serve requests from the OptiqueVQS frontend and the synchronisation between the frontend and the backend, as described, is gradual and on demand, that is, every time only a small fragment of the ontology is requested and returned. Nevertheless, if a very large ontology is to be used in OptiqueVQS (e.g., SNOMED CT [93]), ontology modularisation techniques (e.g., [24,75]) might also be integrated into OptiqueVQS to enhance the user experience by extracting the relevant ontology module. For example, the entities in the query log for a specific user or user group could be used as a seed signature for the extraction of a relevant ontology module.
From our work on the use cases, we discovered that end users ask mostly schema-level queries, e.g., “give me all wellbores that are located in a certain area”. Thus, we are targeting at query formulation that is done in terms of classes and properties. OWL 2 axioms, on the other hand, can be exploited to help a user in navigating between classes and properties. For example, if a user during query formulation has the concept
The nodes of a navigation graph are unary predicates, constants (named individuals, literal values) or datatypes, and edges are labelled with possible relations between such elements, that is, binary predicates. The key property of a navigation graph is that every X-labelled edge
Let
(i) Edges e of the form ‘ A combination of range and domain axioms of the form: ‘ ‘ ‘ Top-down propagation of restrictions: ‘ Bottom-up propagation of restrictions: ‘ ‘ A combination of range and domain axioms of the form: ‘ ‘ Top-down propagation of restrictions: ‘ Bottom-up propagation of restrictions: ‘ ‘ A combination of range and domain axioms of the form: ‘ ‘
(ii) Edges e of the form
(iii) Edges e of the form
(iv) Edges e of the form
The edges in the navigation graph are used to populate the frontend widgets (i.e. views) with suggestions to guide the end user in the formulation of the query. Edges of type (i) are used to populate W1, while edges of types (ii) and (iii) populate the attributes in W2 for the current focus concept A in W3. Edges of type (iii) and (ii) also guide the automatic customisation of W2 with specific input fields for a given datatype, pre-populated dropdown lists for enumeration of values (e.g., company names) and range sliders for datatype restrictions (e.g., min/max possible depth of wellbores). Edges of type (iv) populate the list of subclasses for the focus concept A, which are treated as the special attribute “Type” in W2. OptiqueVQS relies on the OWL 2 reasoner HermiT [33] to build the navigation graph (e.g., extraction of classification) in order to consider both explicit and implicit knowledge defined in the ontology O.
To realise the idea of ontology and data guided navigation, we require that interfaces conform to the navigation graph in the sense that the presence of every element on the interface is supported by a graph edge. In this way, we ensure that interfaces mimic the structure of (and implicit information in) the ontology and data and that the interface does not contain irrelevant (combinations of) elements.
Our goal is to help a user to construct such queries that would be “justified” by the navigation graph. We assume that all the definitions in this section are parametrised with a fixed ontology
Let Q be a conjunctive query. The graph of Q is the smallest multi-labelled directed graph
Finally, we are ready to define the notion of conformation.
Let Q be a conjunctive query and G a navigation graph. We say that Q conforms to G if for each edge If If
Now we describe the class of queries that can be generated using OptiqueVQS and show that they conform to the navigation graph underlying the system. First, observe that the OptiqueVQS queries follow the following grammar:
When users interact with OptiqueVQS,
They start with a kernel class, as described above. Clearly, this initial query conforms to any navigation graph, including the one, underlying the system. Then, the system suggests the list of
OptiqueVQS has the following interrelated features that are mapped to the quality attributes (i.e., An) proposed at Section 5.2:
View and overview provide a continuous outlook of the query formulated so far while supplying the user with a set of possible actions. The goal is to ensure maximum end-user awareness and control [81] (A1). Realisation: W3 provides a global overview of the user query, while W1 and W2 focus the user on the pivot for possible join, select, and projection operations. Exploration and construction allow the user to navigate the conceptual space for exploration and construction purposes. Exploration could be also at instance level, in terms of cues (i.e., sample results) and instance level browsing [21,76] (A1). Realisation: W1 and W2 suggest domain elements and allow ontology navigation. Each action adds reversible query fragments into the query. The user can also use the tabular result widget, i.e., W4, for example results. Collaborative query formulation is meant to enable collaboration between users actively or passively. Such collaboration could be between an end user and an IT expert or between end users [64] (A1). Users can formulate more complex queries and improve their effectiveness and efficiency. Realisation: OptiqueVQS synchronises visual and textual modes (i.e., active collaboration between IT experts and end users), allows users to share queries (i.e., passive collaboration), and harnesses the query log to offer suggestions (i.e., passive). Query reuse enables the user to reuse existing queries as they are or to modify them to construct more complex queries and/or to improve the effectiveness and efficiency (A1 and A9). Query reuse could indeed be considered a passive form of collaboration [64] (F3). Realisation: OptiqueVQS allows users to store, load, and modify queries. Queries are stored in a query catalogue with descriptive texts to facilitate their search and retrieval. Spiral/layered design (recall progressive disclosure) refers to distributing system functionality into layers [77], so as to enable an orderly access to the system, prevent complex functionalities to hinder the usability for less competent users (A1), view the ontology at different levels of detail (A3), tailor available functionality with respect to user needs (A4 and A5), and to add new functionalities without overloading the interface (A6). Realisation: OptiqueVQS delegates functionality and ontology visualisation tasks to the different widgets. For instance, W4 offers aggregation and sequencing operations, while W2 presents data attributes and offers selection and projection functions. Gradual access (recall progressive disclosure) is to cope with large ontologies with many concepts and properties. The amount of information that can be communicated on a finite display is limited. Therefore, gradual and on-demand access to the relevant parts of an ontology is necessary [46] (A1 and A3). Realisation: W1 and W2 provide ontology elements adaptively and gradually on user demand, hence avoid cluttering and scattering the interface. Iterative formulation allows the user to follow a formulate-inspect-reformulate cycle (A1), since a query is often not formulated in one iteration [64,100]. Realisation: OptiqueVQS provides affordances to inspect, manipulate and extend a formulated query. For instance, users can freely change the pivot, delete nodes, and add new nodes from any point of the query. Ranked suggestions improve the user efficiency by ranking ontology elements with respect to context, e.g., previous query log, and filtering down the amount of knowledge to be presented [84] (A1, A3, and A4). Ranking is a form of passive collaboration as it utilises queries formulated by others to provide gradual access (F3 and F6). Realisation: OptiqueVQS offers a ranking method, which exploits the query history of users to rank and suggest ontology elements (in W1 and W2) with respect to a partial query that a user has constructed so far. Domain specific representations support varied data types and domains. This ensures contextual delivery of data leading to immediate grasping [98] (A1). The availability of domain specific representations provides users and system with the opportunity to select representation paradigms that fit best to the data and task (A4 and A5). Realisation: OptiqueVQS allows introducing new domain-specific widgets for visualisation and interaction, for instance, the map widget (W5) for geospatial interaction and visualisation. Multi-paradigm and multi-perspective presentation is meant to combine multiple representation and interaction paradigms such as form and diagrams, and query formulation approaches such as visual query formulation and textual query editing, to meet diverse contexts [21,46] (A1). Moreover, the system and users can adapt the presentation (A4 and A5) and users can select among various paradigms depending on their role (F3), task (F2), and data at hand (F9). Realisation: OptiqueVQS puts multiple representation and interaction paradigms (i.e., list/menus (W1), diagrams (W3), forms (W2), tables (W4)) as well as query formulation approaches (i.e., textual and visual) together. Modular architecture allows new components to be easily introduced and combined in order to adapt to changing requirements and to support diverse user experiences (A1, A2 and A6). This could include alternative/complementary components for query formulation, exploration, visualisation, etc. with respect to context (A3, A4, A5, F9, and F10). Realisation: OptiqueVQS is based on a UI mashup approach and is built on a widget-based architecture, where widgets are independent components acting as the building blocks. They communicate through broadcasting event notifications. Data exporting enables the user to feed analytics tools with the data extracted for sense-making processes, as they are not expected to have skills to transform data from one format to another. Therefore, means to export data in different format are required to ensure that the system fits into the organisational context (A7) and a broader user experience (A1). Realisation: OptiqueVQS allows users to export data in various formats. For instance, in the context of Statoil use case, users can export query results in the format of their data analytics tools. Domain-agnostic backend ensures domain independence. This allows a VQS to operate over different ontologies and datasets without any extensive manual customisation and code change [47,62] (A8). Realisation: OptiqueVQS relies on a domain-agnostic backend. It projects the underlying ontology into a graph for exploration and query construction. Yet, it also allows domain-specific components to be introduced.
User evaluation
The purpose of a VQS is to enable users to formulate queries effectively and efficiently. The effectiveness [13,20] is measured in terms of accuracy and completeness that users can achieve. The cost associated with the level of effectiveness achieved is called efficiency [13,20], and is mostly measured in terms of the time spent to complete a query. Note that, typically in information retrieval (IR), effectiveness is measured in terms of precision, recall, and f-measure (harmonic mean of precision and recall) over the result set; however, a VQS in our context is a data retrieval (DR) paradigm, for which a single missing or irrelevant object implies total failure [82]. In other words, data retrieval systems have no tolerance for missing or irrelevant results, while IR systems are variably insensitive to inaccuracies and errors, since they often interpret the original user query and the matching is assumed to indicate the likelihood of the relevance, rather than being exact [9,101]. Therefore, for a VQS, effectiveness is given in terms of a binary measure of success (i.e., correct/incorrect query) [47].
In the course of Optique project, we conducted a total of four industrial workshops with our use case partners (two for each use case). In the first set of workshops, we conducted unstructured interviews with domain experts and observed them in their daily routines. Shortly after the first set of workshops, we demonstrated a paper mock-up and had further discussions. A running prototype was developed iteratively with representative domain experts in the loop. At the second round of workshops, domain experts experimented with the prototype in a formal thinking-aloud session and we measured the effectiveness and efficiency of OptiqueVQS.
We also conducted two usability studies in a non-industrial context. The results are published elsewhere, but can be briefly summarised as follows:
An experiment involving casual users without any technical skills and knowledge. It was conducted on a generic domain. The results suggested that casual users without any technical background can effectively and efficiently use OptiqueVQS to formulate complex queries [86].
A comparative experiment comparing a variant of OptiqueVQS and a form-based query interface called PepeSearch [102]. The results suggested that OptiqueVQS is the preferred tool for formulating complex query tasks, while PepeSearch is the preferred tool for less experienced users for completing simple tasks [103].
In this article, we report the design and the results of the experiments that we conducted with our industrial partners:
Statoil experiment employed a bootstrapped (i.e., automatically generated [52,78]) oil and gas ontology7
Siemens experiment without temporal queries employed a manually constructed diagnostic ontology with five concepts, five relationships (excluding inverse properties), and nine attributes [89].
Siemens experiment with temporal queries employed a manually constructed turbine ontology with 40 concepts and 65 properties [88].
The ontologies, data, and information needs used in the experiments are provided by the industrial partners themselves and therefore are not artificial but reflect the reality and real interests.
Profile information of the participants
The experiments were designed as a think-aloud study. Each participant performed the experiment in a single session, while being watched by an observer. Participants were instructed to think aloud, including any difficulties they encounter (e.g., frustration and confusion), while performing the given tasks. A five minutes introduction of the topic and tool was delivered to the participants along with an example before they were asked to fill in a profile survey. The survey asked users about their age, occupation and level of education, and asked them to rate their technical skills, such as on programming and query languages, and their familiarity with similar tools on a Likert scale (i.e., 1 for “not familiar at all,” 5 for “very familiar”). Participants were then asked to formulate a set of information needs into queries with OptiqueVQS (i.e., tasks).
A number of empty queries, each corresponding to a task in the experiment, was generated in OptiqueVQS for each user. Users received their tasks one by one on paper, and for each task loaded the corresponding empty query. Formulating and executing a query, i.e., clicking “Run Query” button, and inspecting the result set constituted one attempt. Participants had a maximum of three attempts per task, this was enforced by the system (the “Run Query” button was blocked after three attempts). A task was ended when the participant indicated completion or exhausted his/her three attempts. Every attempt for each task was recorded by the OptiqueVQS as a draft query, along with the time taken for each attempt.
Three participants from Statoil and seven participants from Siemens took part in the experiments. The profiles of participants are summarised in Table 3, which shows that participants vary in technical skills and experience with similar tools and have no familiarity with semantic web technologies.
Information needs used in the experiments – marked tasks (*) are temporal
Information needs used in the experiments – marked tasks (*) are temporal
Aggregated experiment results: correct completion rate, first attempt correct completion rate, average time, and average number of attempts
There were nine tasks for the Statoil experiment (Ex3), five tasks for the first Siemens experiment (Ex4), and five tasks for the second Siemens experiment with temporal queries (Ex5). Each task corresponds to a conjunctive query and is listed in Table 4. The key elements are highlighted in the context of this article for clarity.
The results of all the three experiments are summarised in Fig. 10 and Table 5.
Regarding the Statoil experiment (Ex3), a total of 27 tasks were completed by the participants. Results show 84% correct completion rate, 69% first-attempt correct completion rate (i.e., percentage of correctly formulated queries in the first attempt), and an average of 243 seconds and 1.4 attempts for completing a task. The first participant had only one incorrect, and the second participant had no incorrect task. T3 was about fields operated by Statoil, and the third participant formulated a Field–FieldOperator pair instead of a Field–Company pair. This confusion between FieldOperator and Company led him to incorrectly solve T5 as well. T7 not only takes the longest time but also the highest average attempts; participants raised that the ontology did not match their understanding of the domain and therefore they found it hard to formulate this query.
In the Siemens experiment without temporal queries (Ex4), a total of 18 tasks were completed by the participants. The third participant exceeded the allocated time for the session and could not attempt the last two tasks, therefore these are omitted from the results. Correct completion rate was 88%, while first-attempt correct completion rate was 72%. Average time and number of attempts for completing a task were 132 seconds and 1.5 respectively. The third and fourth participants had one incorrect task. Participants had a minor issue with the date format, therefore Task 11, where a date constraint appeared for the first time, took the longest time.
In the Siemens experiment with temporal queries (Ex5), a total of 15 tasks were completed by the participants. The results show 100% correct completion rate, 66% first-attempt correct completion rate, and an average of 103 seconds and 1.3 attempts for completing a task. Participants had a minor issue with the fact that they need click on the “Run Query” button in order to select a template from the tabular view – starting from the Task 17, which took the longest time. A straight forward solution for stream based queries would be to change the name of button to “Select a Template” to prevent confusion, as the “Run Query” button is originally meant for non-stream query tasks.

Experiment results for the three usability studies with domain experts.
Overall, the results indicate high effectiveness and efficiency suggesting that OptiqueVQS is a viable tool to visually construct considerably complex queries for querying structured data sources. All participants praised the utility of OptiqueVQS for formulating complex information needs into queries. A common statement was that such a solution will not only improve their current practices, but also augment their value creation potential due to the flexibility of formulating arbitrary queries. Three complex queries formulated by Statoil and Siemens domain experts and casual users (for reference) are given in Fig. 11, Fig. 12 and Fig. 13 respectively. The first query was provided by a Statoil domain expert for the query catalogue and he estimated that he would need a full day to extract this information with the existing tools. On the other hand, the same Statoil user was able to formulate a query of similar complexity with OptiqueVQS within less than 10 minutes. The second query (Ex3) only took 63 seconds on average to complete by Siemens’ domain experts. The third query took only 91 seconds to complete on average for a casual user [86].

A complex query formulated by Statoil’s domain experts.

A complex query formulated by Siemens’ domain experts.

A complex query formulated by casual users.
If one compares the aggregated results presented in Table 5, it is noticeable that Statoil domain experts spent more time on average when completing a task, while the average number of attempts are similar. This has two reasons according to participants’ feedback and our observations: (i) conceptual mismatch between the Statoil domain expert’s understanding of domain and the ontology – note that the Statoil ontology was automatically bootstrapped with little manual fine tuning, while the Siemens diagnostic ontology used in the experiment was smaller in size and was manually created (i.e., of higher quality); (ii) Statoil domain experts were more engaged with the data and spent considerably more time on checking the validity of the results, since the Statoil experiment was conducted on real data and participants were able to recognise and relate with the data, while in the Siemens case data was temporal and anonymised.
In general, participants raised two major issues. First, they asked for a longer training session; indeed, the training sessions were intentionally kept short in order to test the learnability of OptiqueVQS. The high completion rates, even with complex queries, suggest that the tool has high learnability. Secondly, participants pointed that the ontology did not always reflect their understanding of the domain, which was mostly an issue for the Statoil experiment. This issue is particularly likely to emerge in OBDA scenarios where an ontology is bootstrapped from database schemas and similar artefacts, since the ontology then will reflect the quality and nature of the given sources. Therefore, better heuristics are required for the automatic generation ontologies such as from database schemas as well as a careful manual fine tuning process. The usability of an ontology is as crucial as the usability of a query formulation tool; however, ontology usability is an overlooked issue in the research community and demands more attention.
Finally, a few participants had inquiries regarding the capabilities of OptiqueVQS:
the ability to have advanced operations such as disjunction (asked for mainly by domain experts with IT skills and knowledge);
the ability to combine and/or join concepts that are not directly linked; and
automatic filtering of attributes and attribute values with respect to the previously selected constraints and the partial query at hand.
We will discuss these matters in Section 10.
Visual approaches for querying structured semantic data sources are primarily categorised into VQLs and VQSs, as explained in Section 1. A VQS is built on an informal set of user actions that effectively capture a set of syntactic rules specifying a query language (e.g., [4,4,41]), while a VQL employs a formal visual notation and syntax corresponding to a textual query language (e.g., [11,38,43]). Such approaches can be further classified with respect to the main interaction paradigm.
Browsing (for query formulation purposes) and schema navigation are two prominent interaction paradigms. The former refers to interacting at an instance level, that is the user browses the data set by adding and removing constraints and following the links between instances. Faceted search is a very good example of this paradigm, e.g., [6,15,99]. The latter is used by OptiqueVQS and refers to interacting at a conceptual level, that is using an external vocabulary, for example provided by an ontology, to express the information need at the schema level, e.g., [4,37]. Browsing alone is often not good for meeting complex information needs and could be computationally problematic for very large data sets. The user is usually restricted to the individuals of a single concept and partial results need to be calculated for each possible future selection. Schema navigation is a better approach for meeting complex information needs even when both data and results sets are large.
Another categorisation arises from the source of vocabulary, which might be extracted from the data set or be provided by an external ontology. The former refers to extracting concepts and relationships by analysing the data set, i.e., extracting a pseudo ontology (e.g., [15,102]). This approach is adequate for cases where an ontology is not available, prevents the user from building unsatisfiable queries (i.e., no empty result sets), and allows using statistics about data for optimisation. The latter approach uses an ontology to feed the query formulation process, e.g., [95]. An ontology could be much more expressive than what one can extract from data, and the vocabulary extraction process could be quite expensive for large and dynamic data sets. For example, data sets in our use cases change very rapidly in vast amounts and this makes real time processing very hard. Offline processing is not an option as this would lead to missing and/or incorrect results; users need to access real time data. Finally, it is not always desirable to formulate queries with guaranteed results. For example, in the Siemens use case, most of the user queries specify an error situation in their hardware for which there is often no matching data at the time of query formulation (i.e., the user gets notified when the data changes and the query becomes satisfied). OptiqueVQS uses a hybrid approach, where an ontology is the main source of vocabulary and data set is used for a limited extent (recall Section 6.2).
Regarding the visual approaches in general, notable examples of VQLs are LUPOSDATE [36], RDF-GL [43], Nitelight [79], GQL [11], and QueryVOWL [38]. LUPOSDATE, RDF-GL and Nitelight follow RDF syntax at a very low level through node-link diagrams representing the subject-predicate-object notation, while GQL and QueryVOWL represent queries at comparatively higher level, such as with UML-based diagrams. Each of these languages are managed by a VQS providing means for construction and manipulation of queries in a visual form. Although VQL-based approaches with higher level of abstraction are closer to end users, the users still need to possess a higher level of knowledge and skills to understand the semantics of visual notation and syntax and to use it. Note that although OptiqueVQS uses a tree-shaped query representation, it is informal, simplified, and free of any syntax and jargon related to ontologies and query languages.
Comparison of related tools with respect to our industrial requirements (
,
,
,
,
;
,
,
)
Comparison of related tools with respect to our industrial requirements (
VQSs have a better potential to offer a good balance between expressiveness and usability. The prominent examples of VQSs are gFacet [41], OZONE [95], SparqlFilterFlow [37], Konduit VQB [4], Rhizomer [15], and PepeSearch [102]. gFacet, OZONE, and SparqlFilterFlow employ a diagram-based approach and diagrams representing the queries are rather informal. Konduit VQB and Rhizomer employ a form-based paradigm. Diagram-based approaches are good in providing a global overview; however, they remain insufficient alone for view (i.e., zooming into a specific concept for filtering and projection). This is because the visual space as a whole is mostly occupied with query overview. Form-based approaches provide a good view; however, they provide a poor overview, since the visual space as a whole is mostly occupied with the properties of the focus concept. Approaches combining multiple representation and interaction paradigms are known to be better since they can combine view and overview. gFacet and Rhizomer are originally meant for data browsing, that is they operate on data level rather than schema level and every user interaction generates and sends SPARQL queries in the background. Therefore, they are highly data-intensive, which is often impractical for large data sets. Finally, PepeSearch uses conventional forms and mixes schema-based search and browsing; search is limited with a kernel concept and concepts directly related to it, and relevant terms are extracted from the data. Apart from limited expressivity, PepeSearch suffers from poor domain knowledge extracted from data (compared to a rich ontology), although the interface is naturally tailored by the data. Also, it does not offer means to cope with large and frequently changing datasets (i.e., one needs to re-extract schema information if data changes).
As far as temporal queries are concerned, notable examples of temporal query languages in the Semantic Web are C-SPARQL [10], SPARQLstream [17], and CQELS [59]. These approaches extend SPARQL with a window operator whose content is a multi-set of variable bindings for the open variables in the query. However, in this paper we are rather interested in visual solutions sitting on top of any of these languages. Although several visual tools exist for SPARQL [85], the work is very limited for temporal languages. An example is SPARQL/CQELS visual editor designed for the Super Stream Collider framework [73]. However, the tool follows the jargon of the underlying language closely and is not appropriate for end users as it will demand considerable knowledge and skills.
Concerning spatial querying, notable formal textual query languages are stSPARQL [12] and geoSPARQL [68]. stSPARQL is an extension of SPARQL 1.1 for querying linked geospatial data that changes over time, while geoSPARQL is a recent standard of the Open Geospatial Consortium (OGC) for static geospatial data. Although there are numerous tools for visualising and interacting with spatial data such as Sextant [66], visual query tools are limited. A visual query tool, which is an adaptation from an earlier facet-based search tool, is being developed in the TELIOS project [28], by introducing a supplementary map component for constraining certain location dependent attributes.
Table 6 gives a comparison of the prominent tools. The summary suggests that none of the tools alone can address our industrial requirements. The majority of tools presented are either formal or have a strong focus on browsing, which leads them to be highly explorative and instance oriented. While browsing is very adequate for open Web, in our context, due to the large data size and the nature of the tasks, interacting with the ontology instead of directly with the data is more suitable for domain experts and computationally more feasible. OptiqueVQS is, however, a visual query system working primarily at a conceptual level and it is not our concern to reflect the underlying formality (i.e., query language and ontology) per se. We are also not interested in providing full expressivity, as we aim to reach a usability-expressiveness balance. The design of OptiqueVQS is based on clear requirements, solid design choices with a rationale, and quality attributes. Finally, there is a lack of rigorous theoretical underpinning in the context of RDF and OWL 2. Existing approaches mostly either focus on RDF, thus essentially disregarding the role of OWL 2 ontologies, or do not reveal how underlying semantics are projected to drive exploration and query formulation.
The use case analyses of Statoil and Siemens and experiments conducted with OptiqueVQS on different user groups (i.e., casual users and domain experts) and scenarios support two primary findings:
the majority of end user queries are tree-shaped and conjunctive [69]; and
a multi-paradigm design has good potential to support different types of users and tasks [21].
Currently OptiqueVQS supports 67% and 65% of the queries in the Statoil and Siemens query catalogues respectively, which are tree-shaped conjunctive queries with aggregation and excluding negation (recall Fig. 2). This is a considerable achievement towards supporting domain experts on meeting their own information needs. Domain experts had 90% average success rate overall in three experiments (recall Table 5) without any prior training, appreciated OptiqueVQS’s design, and indeed suggested interesting improvements, which we will discuss below.
The overall process itself also revealed useful insights and blueprints towards a more systematic research and development of OptiqueVQS-like tools and systems. This includes topics such as analysis and categorisation of a representative query catalogue, query types, context of use, and potential representation and interaction paradigms. Design choices behind OptiqueVQS at macro and micro levels along with a list of quality attributes and interrelated supporting features are valuable as useful design practices. OptiqueVQS meets a good number of quality attributes compared to other existing systems thanks to this systematic approach (recall Table 6). That being said, in the following, we will discuss the limitations of OptiqueVQS and potential solutions.
Note that OptiqueVQS is designed to meet diverse user and task types, for a context of use involving frequent use and varied and structurally complex query tasks. Therefore, a query interface with a specialised design and functionality, for example built on a single paradigm or having higher/lower level of expressiveness, could perform better for a different context. In our earlier comparative study [103], we found that casual users prefer a simpler form-based interface although they can successfully use a more advanced interface like OptiqueVQS. The reason is that when the tasks are structurally simple, it becomes a cognitive burden to use an interface with more functionality and extended design. Another example concerns querying temporal and spatial data sources. OptiqueVQS deals with such data in a non-specialised way due to the scenarios it primarily supports, that is spatial and temporal aspects are not in the core of OptiqueVQS’s design. For example, a specialised interface having a map representation in the core of its design could be required for data with high spatial orientation.
As discussed in Section 8, a few domain experts raised questions regarding the expressiveness level of OptiqueVQS and its capabilities. The first point concerns the formulation of more complex queries including such as disjunction. Expectedly, this was raised by domain experts with higher technical skills and knowledge. Implementing complex functionality is often not straightforward without compromising usability. Today, OptiqueVQS does not support this expressiveness level; however, we follow a strategy for raising it. Our strategy involves hiding complex functionalities behind layers and enabling them only on demand and implementing simpler and restricted forms of them. For example, we consider implementing negation and disjunction on the data property level rather than the object property level due to the visual simplicity of the former.
Domain experts also enquired about the ability to combine and join concepts that are not directly related, and automatic filtering of attributes and attribute values depending on the constraints selected earlier and the query formulated so far. Regarding the former, one could consider two forms of such functionality. First, a user could drop several concepts into the query pane and expect the system to connect them, which is called multi-pivot approach [71]. Second, a user could join the pivot with a distant concept that is multiple hops away [11]; we call this non-local navigation [85]. In both cases, the problem is suggesting appropriate connecting relationships. An often used approach is finding the shortest paths between the given set of concepts [11,71]; however, a shortest path approach does not necessarily lead to semantically meaningful connections. A better approach would be extending our ranking approach to offer paths. Considering automatic filtering of property values, this is among our current efforts; it is analogous to faceted search and requires frequent interaction with the data to calculate partial results, which could be problematic for large data sources.
Scalability against large ontologies in terms of user interaction [46] (i.e., large amount of properties and concepts to choose from) also requires further work. Currently, we tackle visual scalability through gradual and on-demand access to terminological knowledge and ranking concepts and properties with respect to the partial query at hand and the query log. However, we did not get a chance to evaluate its effectiveness as it requires collecting data over longer terms before experimenting with the users, while query logs from public endpoints are either not of high quality or are not complex enough structurally to detect patterns. Complementary approaches could include using modularisation techniques [24,75] with respect to interests of different user groups and letting users hide concepts and ontology elements they are not interested in their daily routine.
Finally, the quality of the ontology and supplementary information (e.g., descriptions, naming, icons etc.) is also important. Users often get confused when an ontology does not represent their understanding of the domain, and the namings and descriptions etc. are unclear or misleading. An ontology should not be considered just as an input to a work environment, it is also an output representing a collective and explicit understanding of the domain, that is it is essentially owned by its users. However, in organisations, creating ontologies from scratch is a painful and long process especially when there is a lack of expertise; therefore, it is often preferred to automatically generate ontologies from existing schemas, which often yields poor results due to problems origination from impedance mismatch between relational databases and ontologies. An important contribution would be letting users provide feedback and supplementary information from the query interface.
Conclusion and future work
In this article, we have proposed an interactive end-user visual query formulation tool OptiqueVQS that is based on pragmatically motivated requirements and relies on a theoretical framework of navigation graphs. OptiqueVQS is targeted for addressing complex and specific information needs without demanding any specialised IT background and aims at providing a good balance between usability and expressivity. We evaluated our solution with different user groups, including two industrial use cases, with limited IT knowledge and skills with encouraging results.
Future work involves exploring possibilities for realising more complex query types, hidden at different layers, and supportive features such as non-local navigation and faceted search like filtering. We also plant to execute further user studies to validate the core design choices behind OptiqueVQS. Finally, we will continue working on a ranking approach and potential means to test it both from computational and user perspectives (i.e., perceived usefulness).
Footnotes
Acknowledgements
This work was funded by the EU FP7 Grant “Optique” (agreement 318338); the EPSRC projects MaSI3, DBOnto and ED3; the BIGMED project (IKT 259055); and the SIRIUS Centre for Scalable Data Access (Research Council of Norway, project no.: 237889).