
Abstract
The linked data Web provides a simple and flexible way of accessing information resources in a self-descriptive format. This offers a realistic chance of perforating existing data silos. However, in order to do so, space, time and other semantic concepts need to function as dimensions for effectively exploring, querying and filtering contents. While triple stores, SPARQL endpoints, and RDF were designed for machine access, large burdens are still placed on a user to simultaneously explore and query the contents of a given endpoint according to these dimensions. First, one has to know the semantic concepts and the type of knowledge contained in an endpoint a-priori in order to query content effectively. Second, one has to be able to write and understand SPARQL and RDF. And third, one has to understand complex data type literals for space and time. In this article, we propose a way to deal with these challenges by interactive visual query construction, i.e., by letting query results feedback into both (space-time) exploration and filtering, and thus enabling exploratory querying. We propose design principles for SPEX (Spatio-temporal content explorer), a tool which helps people unfamiliar with the content of SPARQL endpoints or their syntax to explore the latter in space and time. In a preliminary user study on a repository of historical maps, we found that our feedback principles were effective, however, that successful question answering still requires improvements regarding space-time filtering, vocabulary explanation and the linking of space-time windows with other displays.
Keywords
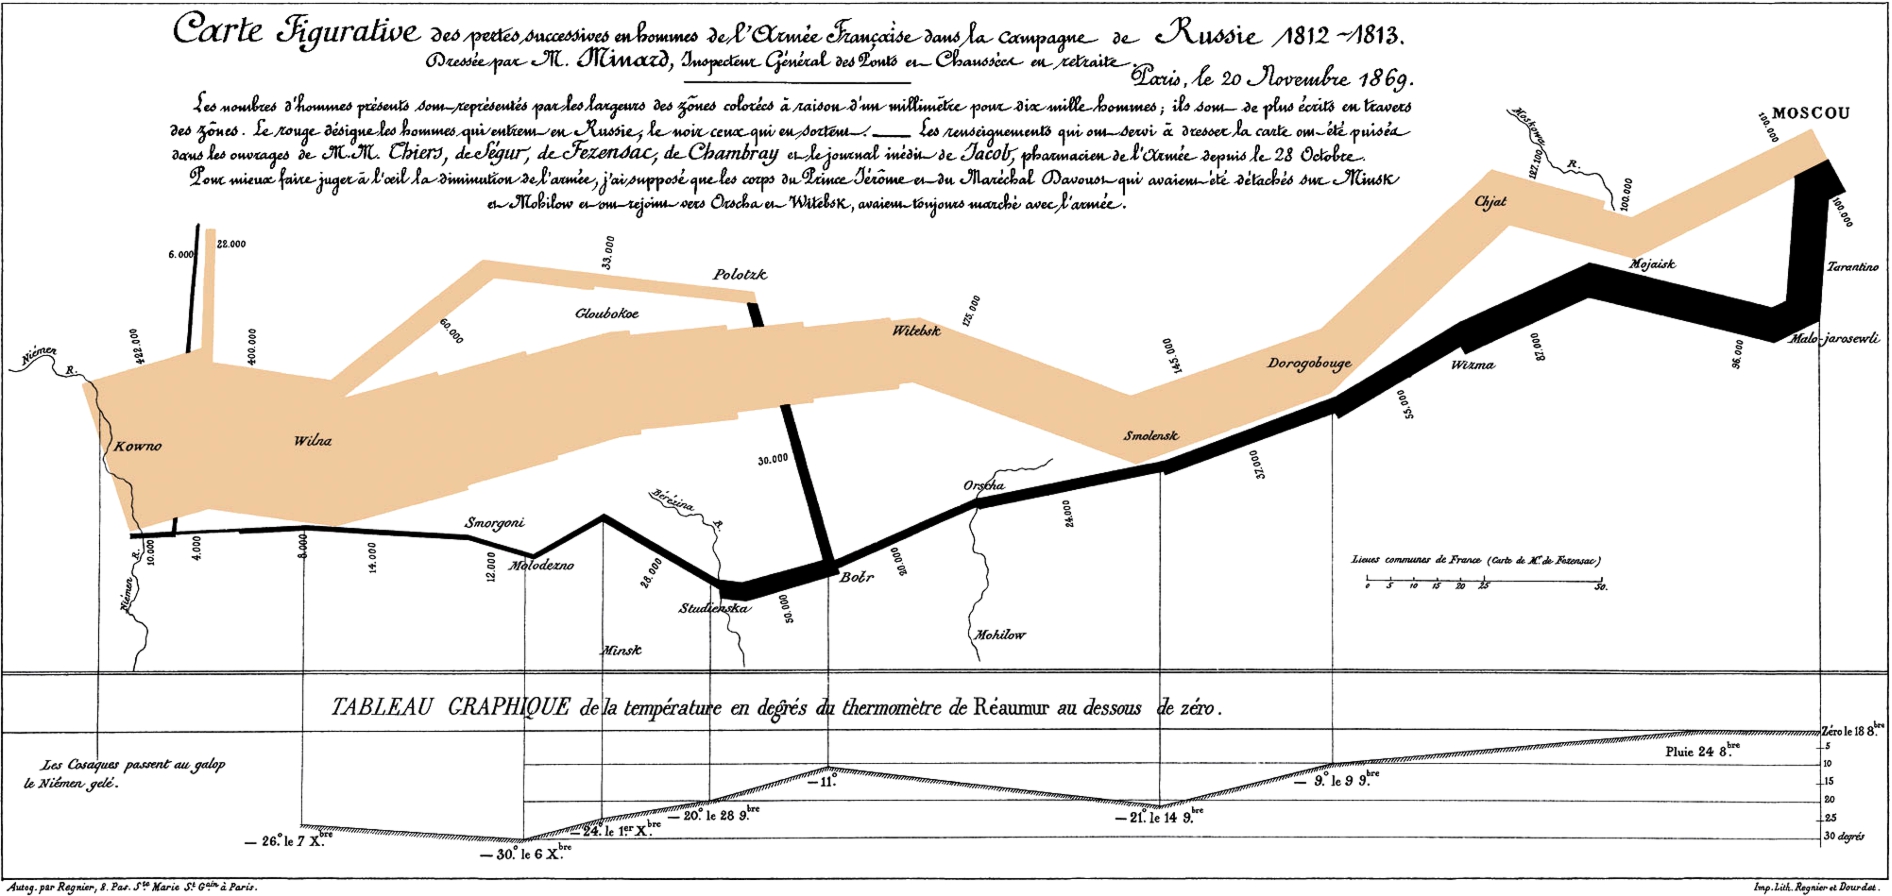
Charles Minard’s map from 1861 about Napoleon’s 1812 march on Moscow. How could users unfamiliar with spatio-temporal (linked) data query for its complex content in a way which goes beyond keywords [44]?
Data repositories often remain black boxes, for lay persons and database experts alike and regardless of whether the repository in question is a traditional relational database, a Web-based fast indexing and search system such as Elasticsearch,1
Resource Description Framework,
Space and time are primary dimensions for structuring and searching information [25], and thus can help open up data silos. Map-like query interfaces can play a key role in retrieval tasks [37] and are easily adopted by users [23]. In addition, a very large proportion of data (some say 80% [14]), not only from traditional sources but also from the Semantic Web,4
Compare the representative sample of linked geospatial data crawled from the Web and described in
Also, as of December 9, 2015, about 20% of all triples from the Linked Data Cloud cover the geographic domain (see
Handling space and time references, however, still poses a burden to users. While information on the Web is largely referenced to space-time in rather simplistic ways,8
Based on coordinate points as footprints, similar to Wikipedia.
Compare e.g. the Europeana Open Culture App http://blog.europeana.eu/2013/07/europeana-open-culture-apps-maps-and-plans/.
Linked open data, even though it changes the conditions for and approaches to retrieval of spatio-temporal and other information in positive ways [34,50], places further burdens on a user. Think about an historian or librarian who wants to find maps which contain information about Napoleon’s invasion to Russia [44] (Fig. 1). Suppose he or she is given a list of URIs of SPARQL10
RESTful RDF repository interfaces for sending SPARQL queries on the Web. http://labs.mondeca.com/sparqlEndpointsStatus.html is a list of available endpoints.
In this article, we suggest that a major challenge in improving this situation is a dilemma which has to do with the lacking integration of exploration and querying along all dimensions of space, time and theme, and correspondingly, with the lacking possibility of simultaneously learning about the information needed while specifying it.
Think again about our example in Fig. 1. Piecewise data exploration does not allow users to perform complex searches and does not scale across larger datasets which cannot be explored manually. There are two traditional kinds of counter measures: either, one ignores data concepts and exploits text search, or one makes use of data concepts and formulates queries. From a user’s viewpoint, text search is simple but also imprecise. For example, searching for “Napoleon” or “Russia” will not lead to any success, because the intended map (cf. Fig. 1) happens to have the digitized title “Carte Figurative des pertes successives en hommes de l’armé française dans la campagne de Russie 1812–1813”. A database or linked data query may identify the right map because it works independently from keyword labels. However, it remains unclear, first of all, how to formulate the right query, and secondly, which kinds of relations and concepts are required and available in order to formulate the right query [44]. Furthermore, in our case, the historian might want to filter results by a certain spatial area in Russia and a certain time interval (1812–1813) and thus needs to handle georeferenced historical map regions with complex polygon shapes [44]). This requires specific interaction strategies to facilitate map overview, zooming, as well as geometric comparison and filtering.
All this unfortunately presupposes a lot of expertise, and systems which make strong assumptions about technical skills and a-priori knowledge strongly limit the set of potential users. On the other hand, a query system that allows users inexperienced with repository contents and linked data to acquire such knowledge needs to support them in interacting with concepts and data in novel ways. That is, at the end of the day, successful queries require exploration and scalable exploration requires queries. While similar insights have recently motivated exploratory query [29] and, more generally, exploratory search [40,52] as fields in information retrieval, it remains an open question how Semantic Web technologies and how space and time can be used in order to realize it.
In this article, we focus on the following research questions:
How to integrate exploration and querying of linked spatio-temporal data in a tightly closed loop, such that people inexperienced with content of a repository, its syntax or data types are still put in a position to answer complex questions about it? What is the role of spatio-temporal interfaces in such exploratory query systems?
We experience a lack of systematic and empirically tested design principles for linked data tools that combine query with exploration on the three dimensions of space, time and theme.12
What we have in mind here are studies like [35].
In seeking for answers, we first discuss corresponding challenges and related work (Section 2), and then suggest a set of design principles (Section 3) for a SPARQL query and exploration tool called SPEX (Section 4). Other tools are compared against these principles. A historical maps scenario (Section 5) serves to test the tool in a preliminary user study (Section 6). The scenario builds on earlier work in the map library area [43,44] illustrating the requirements of handling complex space-time queries. The approach and design principles suggested in this paper, however, are novel and not restricted to the domain of historical maps. While an empirical validation is still future work, the study provides first insights on how users unfamiliar with linked data make use of these principles to answer complex questions about a repository, on the role of spatio-temporal interfaces, and on the main open problems.

Schema of chaining exploration and retrieval strategies via displays and query construction. With linked data, this loop can be performed both on meta-data as well as data, and on space as well as on time.
Joining exploration with querying parallels the old dilemma of joining the learning of concepts with their specification: How to specify something if that something is basically unknown? This dilemma may have stimulated the relational schema in classical database research. A relational schema [11] allows users to specify a piece of data without knowing all the details (e.g. its particular value). However, for this purpose, users need to explore the schema. Exploration, in our sense, is something that people do when looking at and manipulating a display in order to learn about something, e.g., when looking up a table schema in a relational database or a digital map. Specification is something that people do when they construct retrieval requests, e.g., by specifying a “select” query. Retrieval is something that only machines do. However, it often requires specification as input and may have exploration applied to its output.
Since linked data is inherently self-descriptive, it can be used to do both specification and learning about concepts at the same time. Technically, linked meta-data are simply linked data, and as such are not hidden in the data structure [34], in contrast to a relational database schema.13
Syntactically, table schemas are different from table contents and thus need special syntax for look up.
This principle allows users to perform exploration and retrieval in a closed loop (see Fig. 2): Finding meta-data is simply done in terms of a certain kind of query (a query for classes and relations, called classify here). This information is suggested in a display and can be explored. Exploration feeds back into the construction of an instantiation query (e.g. a query for instances of classes and relations), which retrieves explorable results that can feedback into another query, and so on. How does space and time fit into this loop? Since space and time can be handled in terms of linked data types (compare Section 2.4 below), one only needs appropriate display (e.g. map), exploration (e.g. zoom), query construction and query strategies (e.g. spatial filters) which take advantage of the space-time semantics, and which smoothly fit into ordinary linked data interaction strategies that might follow up in the loop.
In the following, we discuss the different stages of this loop and review corresponding related work.
Catarci et al. [10] distinguished top-down (moving from general to specific) from browsing strategies (moving along neighborhoods of data as well as concepts). In the Semantic Web, top-down query strategies are either instantiations of concepts (finding all instances that satisfy an RDF class description) or browsing of hierarchies of RDF classes and RDF properties (Fig. 2). Browsing can also be done on an instance level (browsing is simply a special case of querying, namely querying for neighborhoods of resources in an RDF graph). In Fig. 2, we furthermore added the bottom up query strategy “classify” (finding classes or properties for certain instances, including the entire domain of instances), as well as direct text-based search of concepts (which is done in current Web search engines).
Exploration strategies
Shneiderman [46] distinguished a number of exploration tasks (not only for visualization purposes), namely:
overview of the collection zoom in on items of interest details-on-demand for items view relationships between items
Zoom, overview, inspection of details and relationships can be realized by focusing attention on parts of a display, scrolling, panning and zooming in our schema (Fig. 2). Note that for all of these exploration tasks, one can choose a top-down, bottom up, browsing or a text retrieval strategy, and for a certain retrieval strategy, one can choose any of the exploration strategies mentioned above. For example, one can search for overview concepts based on their text label or browse through them or query for them. And one can get an overview or visually “zoom into” a concept hierarchy which was itself retrieved by text search or a browser. Retrieval strategies are therefore orthogonal to Shneiderman’s exploration tasks.
Many linked open data (LOD) exploration and visualization tools provide an overview of an endpoint as well as details on demand [12]. Since the linked data structure is a graph, graph based visualization techniques seem obvious to address exploration. However, as Schraefel and Karger argue [45], great big graphs have severe drawbacks for visualizing linked data sets because what they exactly not provide are overview, zoom and details-on-demand. Instead, a mix of graphical options which fit these tasks and corresponding data types are more adequate. Currently discussed techniques in the Semantic Web range from menus, treemaps and sitemaps or simple lists, cartographic overviews, to facets and pivoting (concatenating facets) [8]. One major challenge is to combine those elements on-the-fly to fit a certain purpose or data set [45].
Query construction strategies
A visual query system needs to support query formulation [10] by letting users select visual data representation elements and manipulating them. Each possible manipulation needs to translate into a syntactical operation in the formal query language. Even though the choice of a visual query interface depends on the query language (i.e., SPARQL), the development in the Semantic Web illustrates a wide variety of query construction approaches.
While faceted search is useful to learn about concepts and data, it is restricted in expressive power regarding SPARQL, at least in its pure form: One basically queries by a set of class restrictions, taking into account the immediate property neighborhood of a single class in focus and selecting values for their property ranges. The idea of nesting and branching of facets, as well as pivoting (re-focusing of the class in focus) allows people to use a wider fragment of SPARQL [2].
We find a lot of faceted browsers which support significant subsets of SPARQL, such as LESS [4], RelFinder [19,38], gFacet [20], RDF Gravity,14
Visual or text-based query languages afford the formulation of expressive queries either by typing text or by selecting visual objects (Fig. 2). In general, one can [10] (1) construct schematic paths (and graphs), (2) compose concepts and subqueries (3) query by examples, or (4) select quality ranges (e.g. by maps and time sliders). Semantic Web developers have suggested graphical SPARQL query languages (such as RDF-GL [22] or [53]) which help users generate SPARQL code more conveniently, covering large parts of graph pattern construction, composition and filtering. However, these languages require also some a-priori understanding of SPARQL. Many visual SPARQL clients have been built in the last years. LodLive [9], NITELIGHT [48], IsaViz (SPARQLViz),17
The insight of [45] was that every kind of linked data needs a mix of visualization tools appropriate for the task. One way to handle this is to exploit the different kinds of semantics that linked data offers. A good example for this strategy is spatio-temporal data: one can treat the semantics of spatio-temporal data types (RDF typed literals) with special visualization and query panes, while treating ordinary RDF semantics in a different way. In RDF, linked spatio-temporal data can be encoded as GeoSPARQL [5] and OWL Time.19

In how far is exploratory querying of such data supported by linked data technology? In recent years, we have seen a considerable progress in adopting spatial functionality for linked data. Despite the presence of space and time in the description of datasets of the Linked Data Cloud,20
Compare the statistics from
Ranging from GraphDB’s geo-spatial extension (http://owlim.ontotext.com/display/GraphDB6/GraphDB-SE+Geo-spatial+Extensions) supporting (W3 Geo RDF) point geometries, to Virtuoso’s (7.1+) support for complex WKT geometries (
i.e. the simple features standard of the Open Geospatial Consortium (OGC)
However, we do not know of any tools that specifically exploit the use of maps and time sliders in supporting SPARQL query formulation, and of any user study which covers this aspect. A particular challenge lies in clarifying to users the conceptual link as well as the difference between the kinds of semantics involved, namely between spatial geometries, time intervals (as literals) and ordinary linked data concepts. Correspondingly, it remains unclear how space-time exploration and filtering can be intuitively integrated into query pattern construction, especially for non-tech users.
Users unfamiliar with a linked data repository should be supported in finding complex patterns of information of interest about some subject which is hidden in the repository. Mandel [39, Chapter 5] suggested three general interface design principles which can be translated to this task as follows:
The interface should place users into control, i.e., it should.. Offer users query manipulation overview, allowing them to navigate through a query and to undo each step. Immediately feed-back results into all displays. In this way, users can explore and learn the function of all manipulations based on feedback (see principles 3.3 and 3.2 below). Avoid any menus which could change a display modus (modeless design) and instead use context menus and (mouse) foci for exploration. Automatically parse datatypes into appropriate displays. It should reduce their memory load, i.e., it should.. Always suggest (only) the local space of meaningful query construction possibilities (see explanation in Section 3.2). Progressively disclose options. Use visual cues for possible actions. And it should be consistent, i.e., it should.. Be predictable and exploratory. Use a consistent symbology.
Based on these general objectives, we suggest the following design principles for an exploratory spatio-temporal query interface for linked data.
The syntax is in the visual construction of a query pattern
Syntactical rules for SPARQL need to be enforced by visual construction. This means that bad syntax is avoided upfront by offering only those construction possibilities that correspond to a valid SPARQL query. Furthermore, every construction possibility needs to be visually indicated and needs to be explained. Users should be able to redo every step and reload a query pattern (a state of construction). Visual cues (e.g. colors) should identify every kind of syntactical element of the SPARQL graph pattern in a consistent manner (variable nodes, constant nodes, property edges, sub-patterns…). Furthermore, users should be able to navigate and focus on parts of a query in order to modify it. Selection of suggestions should be possible via context menus locally on selected foci.
Feedback 1: Constructive suggestions are grounded in non-empty results
In formulating a query, search or exploration techniques serve as a starting point to learn about contents. However, during query construction, both techniques can also be used to constantly map out the space of meaningful query construction steps. For example, the space of meaningful predicates to choose from reduces dramatically if a subject or object resource is fixed. The current query restricts the possible ways how to proceed, which can feedback into suggestion tools (Fig. 2) that map out the space of possible actions. Therefore, constructive suggestions should always entail a meaningful (non-empty) query result. Otherwise, they should not be displayed. For this purpose one needs a vocabulary suggester which takes into account the current part of a query in focus and offers exploration/selection of only those vocabulary or data terms which will produce non-empty query results. In this way, it becomes possible to avoid frustrating query attempts and unnecessary browsing. At the same time, users can immediately experience the coverage of data which is available in a repository.
Feedback 2: Results feedback into the construction
Results should be reused in the construction. That is, people should be able to use results directly to filter or restrict a query. This reduces the memory load for users and furthermore allows them to quickly generate smaller result sets which can be visually explored more efficiently.
Typed literals (space and time) are hidden and automatically handled by “display-filters”
Typed literals should be hidden from users and should be handled by special display-filter diagrams. That is, displaying and filtering results should be allowed in the same diagram. This has the advantage that results can be used for exploration as well as for setting of filters. Spatial geometries should be discovered automatically and visualized in maps, and temporal elements in calendars and time sliders. Simple filtering can be performed based on the current extent of the respective windows in time and space. In order to satisfy principle 3.2, filtering should only be possible if variables are “spatio-temporally-enabled”, i.e., if corresponding literals are present.
Resources are explorable, i.e. automatically labeled and visually linked across displays
URIs should never be shown to users and only be used as HTML hyperlinks of result items. Instead, all RDF resources should be displayed by their label, and, if not available, by a prefix abbreviation or a label generated from an URI sub-string. Furthermore, result items should be visually linked across different displays, e.g., by highlighting of mouse events, in order to allow users identifying them across displays.

The SPEX layout consists of three visual panes (query, results, and display-filters). The query pane (upper left) is used to construct query patterns, and space-time filter panes (upper right) are used to set spatio-temporal constraints on nodes. In this example, we queried for historical maps that show periods in the 18th century, their map scale and the villages they represent. Clicking on a result (lower left, e.g. “Gefecht bei Reichenberg in Böhmen”) zooms the space and time windows accordingly.
The design principles discussed above were implemented in SPEX, a Web client written in Javascript. We used object-oriented-programming techniques in Javascript in order to divide the code into meaningful parts. Furthermore, we used evolutionary prototyping in order to quickly build a running system with the principles implemented in a preliminary way. We refined this prototype and added further functionalities after the first heuristic evaluation. The SPEX code is available for exploration and re-use at
Functional analysis
The layout of the user interface is shown in Fig. 3 and is divided into three window parts, namely the query pane (upper left), two display-filters for space and time (upper right) and the results pane (lower left).
The construction of queries is possible in the query pane, through the use of context menus on nodes (see Fig. 4). There are two kinds of nodes (Fig. 5): variable nodes (nodes which represent sets of instances) and instant nodes (nodes which represent particular instances). The former are identified by a question mark inside the node, the latter are empty. Variable nodes can be restricted to an RDF class and are labeled by the name of that class. Otherwise they are labeled by a variable name. Instance nodes are labeled by the particular resource they denote. Spatial or temporal enabling of nodes is depicted by green vs. blue colors.

Context menu on a selected node. It offers node restrictions to things of a kind (i.e. classes) or particular things (i.e. instances), and can be used to specify relationships to/from other things and to carry out space/time filtering on a node.

SPEX visual query constructor elements.

Flow chart of visual query construction and exploration possibilities in SPEX. Each process step is represented by a box and a 2-letter short name and is further subdivided into display – explore – construct and retrieval actions (compare Fig. 2). Dark grey boxes denote actions with spatio-temporal displays.
The different kinds of user interaction with SPEX, which are explained in the following, are depicted in the flowchart model of Fig. 6, labeled with abbreviations. The query pane is initialized with a single unlabeled variable node, a question mark which stands for an unspecified question. A user can add constraints (triple patterns and filters) by selecting a node (SN, Fig. 6) and an option from the node’s context menu: (1) either he or she can text search (TN, Fig. 6) or scroll through available classes or instants (SNL, Fig. 6) connected to this node and submit an instantiation query by pressing return. Class restrictions translate into
Or, (3) he or she can set a spatial or temporal constraint on the node (SC, Fig. 6), adding special filters to the query.23
Map window and time slider window can be zoomed and used to filter out results based on whether linked literal values (e.g., WKT geometries in GeoSPARQL [5] or time instances/intervals in OWL-Time (

Querying for maps of the 18th century that show some important historical event (such as the French revolution).
Result RDF resources are clickable (dereferencing the corresponding URI) (BW, Fig. 6) and selectable (highlighting and zooming) (IO, Fig. 6) and automatically labeled and displayed in terms of a scrollable table (ER, Fig. 6). The number of results is shown above the table, and so empty result sets can be explicitly discovered. Furthermore, results are automatically projected to time line events and map window objects that are visually linked to table items (via mouse over highlighting and zooming), provided that corresponding literals are present. Map and time windows are both zoomable and panable24
Based on Leaflet (
To illustrate the functionality, consider a query for maps of the 18th century that show some important historical event, such as the French Revolution (compare Fig. 7). After constraining the empty node to the class “maps:Map” (7), one can zoom the time line to the 18th century and filter results by the time window (7). Then one can add a property link to the phenomena represented by maps (7) and constrain the new node by the class “dpb-ont:Event” (7).
Qualitative comparison of SPARQL tools against our principles
The current development covers only a subset of SPARQL. It allows the construction of connected conjunctive triple patterns and focuses on SELECT queries with ‘*’, since CONSTRUCT, ASK queries and the distinction of bound and unbound variables are not needed for exploration purposes.25
In an exploratory query system, information on the satisfiability of queries (ASK) comes for free (through data feedback mechanisms, see principle 3.3 and 3.2). Furthermore, CONSTRUCT queries and unbound variables do not support data exploration.
While SPEX implements all our design principles to some extent, it is only a prototype so far. There is much room for improvement (see the discussion in Section 6). Further exploration and query strategies could be added, however, our study revealed that it already requires a considerable time for users to get acquainted with the current functionality (see Section 6).
In Table 1, we compared a number of SPARQL tools in the Semantic Web with respect to the SPEX design principles and the main requirements in this paper, namely target group and query expressivity required for our scenario (to be introduced in Section 5).
In summary, the tools do not fully correspond to these principles and requirements, mainly because they lack query expressivity (in particular space-time querying), are designed rather for linked data-experienced users, or do not support feedback or exploration. However, Rhizomer, ViziQuer and especially gFacet (compare Section 2) seem to have a significant overlap.
ViziQuer [53] has a class and property suggester which is grounded in results, very similar to the one we implemented in SPEX, and thus can prevent users from building non-meaningful queries. However, it has a complex expert-oriented user interface which still allows forming non-meaningful queries, and results are not feed-backed into construction and exploration.
Rhizomer [8] is more than a faceted browser in that it supports expressive queries with variables, properties and classes, supplies only grounded suggestions and is made for persons inexperienced with SPARQL. In Rhizomer, arbitrary class restrictions require filtering of values of the facet “RDF:type”, so that a user needs to understand the RDF syntax to some extent. Rhizomer’s browser and pivoting-based visualisation strategy also makes it difficult to get a visual overview of a query: One needs to move along a link (pivot) or read a natural language-like description of the current query. In addition, the pivoting option is visually separated from the facets, which makes it difficult to learn how the current query can be extended.
gFacet [20] is another faceted browser which links hierarchical facets (facets that can be logically combined) with graph-pattern visualization. Facets in gFacet correspond to class nodes in SPEX, which can be expanded via properties linking to new facets. This provides a visual overview of the query. Since expansion is restricted to locally available properties, query construction is also grounded. Information can be filtered by selecting elements in a facet, which broadcasts into other facets of the graph. This provides feedback of results into a query. Query results are expressed as the set of “valid” elements in each facet, which is the set of elements satisfying all selections and property edges. Nodes cannot only be facets, but also geographic maps or other displays, and the latter can be used both for displaying and selecting geometric points. Thus, compared to SPEX, gFacet seems to be a tool with comparable functional scope regarding our principles (Table 1). What seems missing, however, is a support for spatio-temporal queries and geometries/temporal entities beyond points. Tools like gFacet might be candidates for a comparative evaluation in the future. However, this was out of scope in this preliminary user study, as explained below.
Scenario: Exploring a repository of historical maps
We tested our approach in terms of a query and exploration scenario where users inexperienced with linked data should answer a number of questions about a linked data repository which contains descriptions of various historical maps. The repository has been built in the course of previous work on linked data map geo-referencing and encoding [43,44] and contains 2814 triples. Even though the scenario is domain specific, it illustrates how complex space-time footprints and corresponding queries can be essential for non-expert linked data users, such as historians, and thus serves to make the case for similar kinds of linked spatio-temporal data.
The task was to explore a SPARQL endpoint26
Maps with lakes
How many maps represent lakes? (22)
List those represented lakes that have a name (Lamak lake, Lac du Castillon, Lac du Chambon, Lac de Serre-Poncon)
Maps with cities
How many historical maps represent cities which are in Poland? (1)
Show these cities in the browser (“Stettin”)
Maps with military conflicts
How many historical maps represent military conflicts? (2)
Which years do these maps represent? (1801, 1812)
Maps about Africa
How many maps depict Africa? (5)
How many of them were created by “Karl Ferdinand Weiland”? (1)
Which years do these maps represent (1841)?
Maps about Europe in the 18th century
How many maps show historical periods in the 18th century (6)
Which one of these has the largest map scale (largest scale ratio or smallest divisor)? (“Gefecht bey Reichenberg in Böhmen”)
Name a village which is represented in this map (“Reichenberg”)
These questions [44] correspond to knowledge that is (at least in principle) of interest to historians and historical cartographers, but cannot be posed in current library search systems [43]. Questions increase in complexity, and even though they are partially repetitive and build on each other in order to ease learning, it requires all of the functionality of SPEX to answer them. The different sub-questions (a, b, c…) cover different aspects, i.e., different kinds of triple pattern, spatio-temporal query strategies and also different sets of processes in Fig. 6. Questions where chosen such that it is nearly impossible to answer them by simple text search and that it is difficult to answer them by piecewise exploration (for example by counting in a large result list), but instead require a combination of query and exploration, where queries involve relationship and class instantiation as well as classification. Approximately half of the questions require handling of space and time to some extent. For these reasons, they represent a scenario which is both realistic and challenging for people unfamiliar with SPARQL, space-time data or the repository.
In SPEX, the tasks can be most efficiently solved by the following procedures (see Listing 1) (compare process steps in the flowchart model of Fig. 6, and Fig. 8).

Expected solutions for questions 4a and 5a.

Flowchart based procedures for expected solutions.
To illustrate, let us take a closer look at questions 4a and 5a. In 4a (“How many maps depict Africa?”), the user starts with a reset (Fig. 8), selects the empty start node (SN), types (TN[“Map”]) and selects the class of “maps” (SNL[maps:Map]) to restrict the node to maps. Then she adds a link (AL), types (TL) and selects the property that links maps to what they represent (SLL[maps:mapsPhenomenon]). Then she selects the newly introduced node (SN), changes it from “class” to “instance” mode, types and selects the instance “Africa” (SNL) and looks at the results (ER) to count the maps in the table. Alternatively, after restricting node 1 to maps, one could also zoom the map window (ZM) to where Africa is and filter the query by the map window (SC), correspondingly. In 5a (“How many maps show historical periods in the 18th century?”), after resetting (Fig. 8), the user selects the empty node (SN), types (TN) and selects the map class (SNL[maps:Map]), and then zooms the timeline to the 18th century (ZT). Then she selects node 1 (SN), filters the query by the timeline (SC) and explores the results (ER).
User study design
We tested the functionality of SPEX by observing how users performed on the tasks in Section 5. Note that we did neither a quantitative evaluation of SPEX usability nor an empirical comparison. For our purpose, the functional differences between existing tools, especially regarding space-time functionality, seemed too large to allow for comparisons which exactly involve these functions (compare results in Table 1). Furthermore, our study aimed at discovering in how far the design principles are in effective use, as well as the remaining problems with the tool in order to reach a maturity sufficient for usability tests. While this does not yet allow drawing representative conclusions, it already gives fundamental insights regarding the general workings of the tool and regarding our research questions, which is a necessary basis for further prototype improvement and larger tests.
The SPEX tool was tested with potential users in two stages: in the first stage a heuristic evaluation was done with an expert. The outcomes of this evaluation were used to adjust and improve the information in the “Help file28
The test persons were first asked to familiarize themselves with the SPEX tool through the “Help file” (which was printed on paper) and SPEX displayed on the screen. They were allowed, and even encouraged, to interact with the interface to try to better understand its functioning and design. Thereafter, the test persons were asked to execute the tasks as described in Section 5. One test person took 94 minutes to go through the Help file and familiarize himself with the tool. The other subjects took less time, but still 45 minutes or more. For the execution of the tasks, usually 30 to 45 minutes were needed, although not all test persons could complete all the tasks.
The use and user issues of the SPEX prototype were discovered through qualitative user research in which a mix of methods was applied. Such a mixed approach is quite common in current user research, as different methods lead to different and complementary information about the interaction of a subject with the tool or interface [7,13,51]. We observed the test persons while they were going through the “Help file” and while they were executing their tasks with SPEX. We did that by asking them to constantly think aloud (audio recorded), by screen and event logging (mouse clicks, etc.), by eye movement registration and by video recording their facial expressions. All these recordings were synchronously made, stored and analyzed in a Tobii X60 hardware and Tobii Studio 3.2.1 software envionment, installed in the cartographic usability laboratory of the Faculty ITC of the University of Twente.

The configuration of screen, eye tracking and video recording with one test person at ITC.
The 8–10 hours recordings (in total) were analyzed in a qualitative way by matching the hypothetical SPEX interaction model (Fig. 6) with the thinking aloud and activity protocols, and by studying the usage of the space time interfaces in greater detail with gaze maps based on eye-tracking.
The execution of the user tests went fine although some test persons had difficulties with thinking aloud (they had to be reminded to do so every now and then by the research leader who was in the same room all the time) and the eye movement registration of some subjects sometimes also suffered from the fact that at the end of the long sessions the test persons substantially moved their chairs and bodies. The research leader did not interfere with this in order not to disturb the think aloud process. All in all, the recordings resulted in a substantial and valuable amount of research data. At the end of each test session, the research leader briefly interviewed each subject and asked them about their general satisfaction with SPEX.
For each user, we recorded the path they were following in terms of our flowchart from Fig. 6 to see which exploration-query steps they were performing, and which of them led to a success regarding our tasks, which did not, and why.
Successes and failures of test persons in finding answers to questions from Section 5
Successes and failures of test persons in finding answers to questions from Section 5
A synopsis of successes and failures is given in Table 2: “success” means that the question was answered correctly and as expected; “failed” means that the answer and the way to the solution were incorrect; “success (quasi)” means the way of solution was entirely correct but the answer was not, and this only because of the influence of previous failures (dependencies between answers); “partial” means that the question was not answered correctly, but a significant part of the way to the solution was correct; “skipped” means that the question was skipped for some reason (e.g., because it depends on predecessors which were not answered, or because participants were exhausted or simply forgot to give an answer). The addition of “(a)” for “alternative” means that the test person used an alternative (unforeseen) but in principle valid way to the solution. We also added the solution ratio, which is the proportion of successfully answered questions (either success or quasi success) divided by the number of answers given (without skipped questions).
What can be seen from this table can be summarized as follows:
SPEX in principle allows non-expert users of linked data to answer almost all these questions about an unknown repository (compare test person 1 with a success ratio of 6/8). There is a small learning phase during the first question, after which most people’s performance stabilizes quickly. The most difficult questions, however, required a lot of reasoning and iterative trials by all test persons. Question 5 (the most difficult one) was obviously too difficult for beginners. Complete failures seldom occur (in 14% of all trials). That is, persons chose at least partially valid ways to an answer. Some of them even figured out creative ways to a solution that we did not anticipate (see discussion below for examples). Furthermore, taking into account that the difficulty and level of complexity of our questions was considerably high right from the start and increased a lot towards the end, we notice that the level of successes is still quite high (52%). However, a considerable exhaustion of users can be observed towards the end in terms of a significant increase of skipped trials as well as a decrease of successes.
Listing 2 shows an excerpt of our flowchart based recordings for test person 1 in Table 2. Explanation text in square brackets was added by us, and quotes were uttered by the test person. Comparing Listings 1 with 2 illustrates how usability problems can be spotted immediately. For example, the user in Listing 2 does not succeed in querying with the timeline for Q 5a because he is confused about how the temporal values in the time line relate to query results (creation date?) and whether or not he should rather try a temporal query with a graph query pattern (using the “date” property).

Flowchart based recording of test person 1.
In the following, we will discuss the general insights from our analysis. We start with our observations regarding the functioning of our design principles:
People made effective use of all visual query graph construction possibilities. Choosing node labels and adding visual edges seems in general to translate well into the questions of the task (provided, however, that people understand the meaning of vocabulary terms). All people used visual link construction as well as node labeling to conceptualize the question and to solve their query task. Test person 1 explicitly formulated questions in terms of node-link query patterns, even though linked data principles were unknown to this person. People used result exploration, Web browsing as well as map and timeline exploration in order to answer their questions in ways that were not foreseen by us (“alternative solution”). They used many trials to figure out different ways to reach an equivalent goal (and indeed, “many ways lead to Rome”), e.g.: Using map geometry sizes to figure out map scales; using Web link information (DBpedia) to find information about associated times; Using two filters on space and time and the property “hasScale” to answer questions 5a and 5b, which in principle is a correct (but unexpected) answer. People ran through many query-exploration cycles iteratively (which is not time consuming because SPEX is modeless, i.e., works without menu hierarchies, and has an undo/reset button). This allowed them to quickly learn something new which they could use in the next iteration, i.e., they could make iterative learning progress. For example, test person 1 figured out that pressing return is necessary after input in his first cycle, and then used this in all subsequent cycles. Another test person figured out (after several unsuccessful trials with browsing map descriptions on the Web) that map scales can also be compared via geometry sizes in the map window, which lead to an alternative solution. People explored term meanings using term suggestions and result feedback. For example, test person 1 explored the meaning of the term “Topographic Map” by checking whether results are a subset of “Map”.
The following list contains main difficulties users were confronted with when using the current version of the tool on the given tasks. We classified them according to the causes of their confusion or task failure and added possible cures:
Difficulties with understanding linked data vocabularies and example (historical map) data models
People had difficulties in guessing (without any explanation) the conceptual data model underlying our scenario which treats maps as well as their contents as linked nodes. For example, one test person largely failed to understand that in the repository, maps are entities different from lakes and countries to be selected by a separate node and in need of linking to the latter. This issue has probably to do with the particularly unusual way of modeling map contents by linked data.
People had difficulties with abstract and unclear categories such as “hasPhenomenon” in the property list. For example, test person 1 subsumed “lake” under “phenomenon” but not “country” in the case of Poland and therefore failed to answer question 2. Testers also had trouble understanding the difference between dc:date and the word “period” as used in question 5a), compare Listing 2. This is a consequence of the particular vocabulary terms used and a lack of their explanation in the current version of SPEX. Understanding vocabularies can be improved by adding vocabulary exploration or explanation tools. For example, a simple measure would be to load RDF term comments from the Web and show them to a user whenever a term needs to be selected.
Prefixes occurring in front of terms were disturbing (test person 1: “dct: I have no idea what that is”). As a consequence, URIs should be explained or, if possible, replaced by labels.
Difficulties with the context menu options
The query terminology used in context menus was difficult to understand. For example, the distinction between things of a kind and particular things (test person 1: “Why do I have to make the decision?”) could be removed.
People were easily confused about the necessity of pressing return to go to the next step (extra cognitive effort).
Node context menu options were not offered in sequential steps but all together at all times. For example, label selection was offered also after a label was selected. This made it hard to think about what step was next (test person 1: “I would not expect to see maps here in text form if I have selected the label map already.” “There should be a difference between what you have left behind and what your next task is going to be”.)
Usage of space-time functionality in exploratory querying compared to our expectation exp. Function labels as in Fig. 6
Eye-tracking fixation duration per test person for questions Q 4a and Q 3b, determined within the map window, time window and the entire application window
We did an additional analysis including eye-tracking results in order to learn in how far and how successfully the space-time functionality was used to solve exploratory querying tasks.
Table 3 shows a synopsis of the usage of the map and time windows regarding SPEX functionality as in Fig. 6: inspection of query result objects in map or time windows (IO), zooming of map (ZM) and time line (ZT) and the use of space-time filtering (SC). What can be seen from this table is that the space-time interface was used for roughly half of the questions (especially Questions 3b, 4a/c, and 5a). Compared to what we would consider meaningful given our expected solutions (last row in Table 3), it appears that participants 1–3 (the three most successful ones) roughly matched our expectations. That is, these people used map or time windows in a way which can be considered appropriate for the corresponding task, even if they failed to answer the question, and provided they did not skip the task for some reason. The other participants (4,5,6) made considerably less successful use of the map and time windows. User 6 used the map window for Q 2a, which can be considered appropriate (as Poland can be searched in the map), even though not leading to success. According to our recordings, user 4 thought that the map was only illustrative and thus did not consider it as a tool, while user 5 for some reason only focused on query pattern construction. Usage in general was mostly explorative. Regarding successes, if we compare Table 3 with 2, we see that the questions requiring space-time interfaces (Q 3b, 4c and 5a) were a bit less successfully answered than overall (2 successes (25%), 3 partial (37,5%) and 3 failures (37,5%) out of 8 trials). However, these questions were also among the more difficult ones in terms of general complexity. Quite a few people skipped these tasks. Concerning Q 3b, our recordings reveal that people skipped sometimes because they thought the solution was obvious after they tried out the time slider.
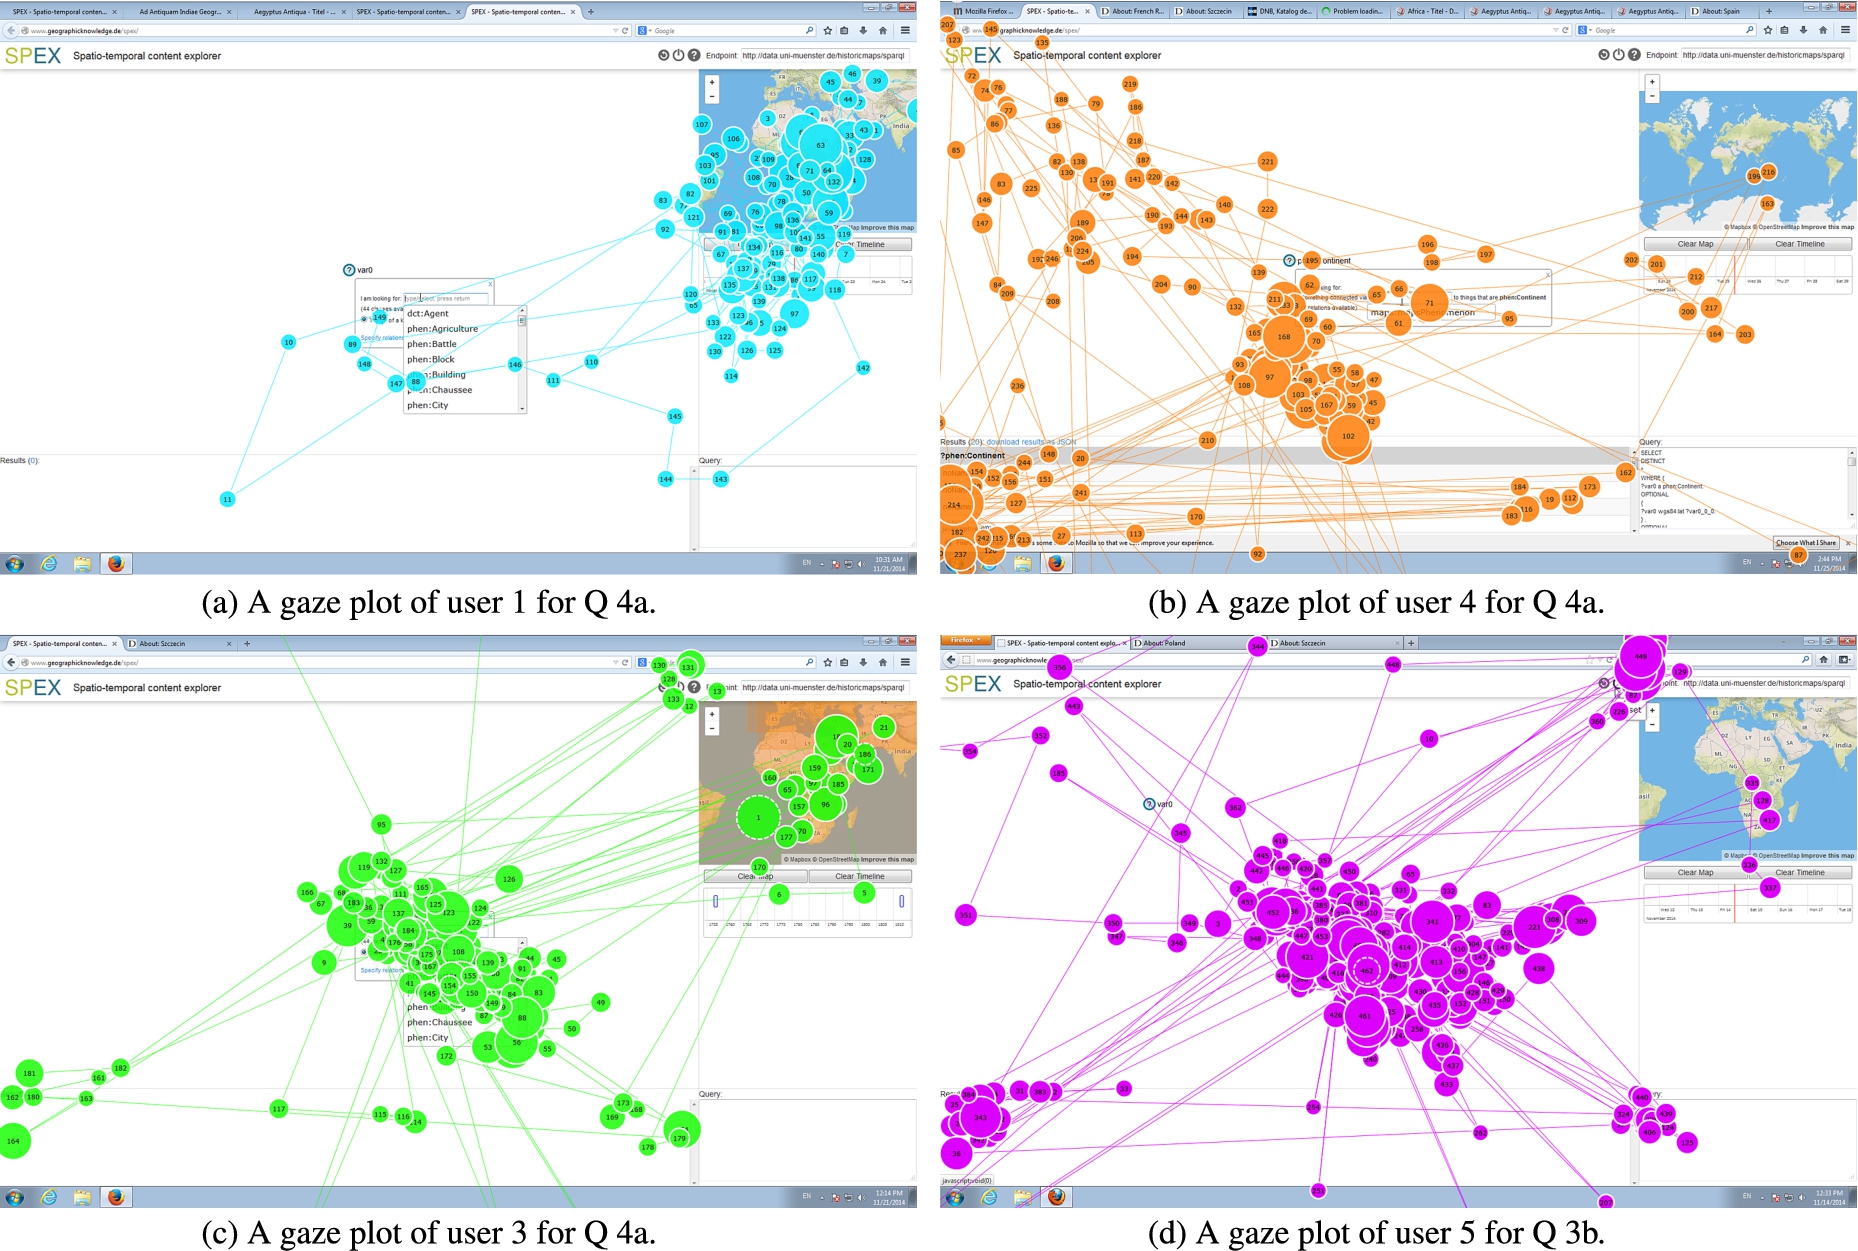
Gaze plots of different users for questions Q 3b and Q 4a.
If we take a look at the gaze plots (Fig. 10) and the corresponding fixation times (Table 4), we see different strategies in the way users approached their tasks, which can be put in relation to their respective success: For Q 4a (which can be solved both by using the map window or by a query pattern), user 1 (Fig. 10) used 60% of his time (Table 4) for the map window and 16% for the time window, almost neglecting the query pattern construction, while user 4 (Fig. 10), in contrast, almost neglected map or time windows. User 1 partially solved the task, while user 4 completely failed. User 3 (Fig. 10) made moderate use of map (15%) and time (1%) windows (Table 4) as well as the query pattern construction and successfully solved the task. Figure 10 illustrates how user 5 tried to answer Q 3b with hardly any time exploration (0.15%, Table 4), which is not possible. Thus, the gaze differences between people show not only a different awareness of the possibilities that these windows offer, they also illustrate different strategies and partially reveal the causes for success or failure. However, our results do not allow concluding that usage of time and space windows necessarily leads to more successes.
In analyzing the user test, we furthermore discovered a number of problems with the current space-time interface, and addressing these could greatly improve our result. In particular, the space-time filter functionality (SC), which was very relevant in Q 4a and 5a (compare Table 3), was not used very often and not very successfully compared to space-time exploration. In general, people said that the map window should be more prominent and should be better explained. People found it difficult to decide whether they should treat time and space constraints via filters or via patterns in the query window. They tried out both and were usually exhausted when one option failed and did not try the other option any more. Furthermore, the meaning of the link between map and time objects and results remained unclear. Do the events on the time line represent what is shown in a map or when the map was created (compare Listing 2)? Links to space time literals are currently not shown to the user. Finally, cluttered map and time objects makes map and time windows less useful.
In summary, the preliminary study shows that our design, i.e., the query, exploration and feedback strategies on which it is based, were effectively used in a large number of cases. It also highlights the frequent and purposeful use of map and time windows, as well as the different roles they play in solution strategies. Space-time exploration was rather naturally adopted for answering questions with linked data in almost all relevant cases, while space-time filtering obviously requires more explanation and usability improvement. One way would be to filter nodes automatically when zooming, without requiring a user to set a filter constraint. Successful users seemed to adopt a “balanced” strategy, combining space-time interaction with query construction whenever appropriate. An open question is how such a balanced strategy can be supported. The reasons for usability problems were in general mostly located either outside of the scope of the intended functionality of SPEX (e.g., supporting the understanding of vocabularies and domain models was not a goal of our design), or they were related to implementation choices that are not based on our design principles (compare Section 3). The discovered problems may exist precisely because the principles were not yet implemented with enough consequence: For example, the syntactical choice between class and instance based queries was driven by our understanding of RDF but contradicts principle 3.1, because it is neither explained nor even necessary. The missing semantic link between results and map/time objects and missing exploration of result name spaces contradict principle 3.5. And showing a menu option also after it was selected contradicts the principle of progressive disclosure of options (Compare Section 3).
Overall, users said in the interviews that the tool offers an interesting way of searching. Especially the time window was considered a useful part. This fits with our observations that users frequently went through query and exploration cycles to approach a valid solution, even if they failed in the end. These cycles were exactly enabled by our design principles. For these reasons, we conclude that the study supports the general functioning of our design principles and the way they integrate space and time, even though it highlights also clear opportunities for improvement of the tool.
Application to other sources of spatio-temporal linked data
In order to evaluate SPEX beyond the dataset of our study and to demonstrate its versatility, it has been applied to two other use cases. In the first case the data is generated by the crowdsourcing platform Ushahidi29
In order to generate RDF, we extracted objects and linked them to OSM data as part of preprocessing the unstructured reports.
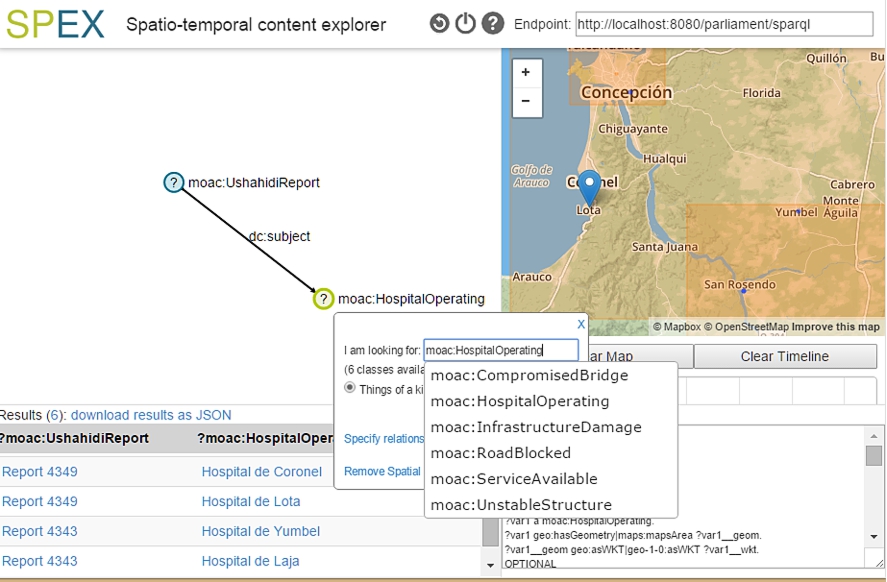
Finding operational hospitals inside an area with SPEX using data about Chile from the crowdsourcing platform Ushahidi.
The second use case is about querying large scale topography, including geographical objects and areas of the landscape such as roads, waterways, buildings, parcels and green spaces. We currently apply SPEX on an RDF version of the openly accessible dataset BGT31
Basisregistratie Grootschalige Topografie, https://www.pdok.nl/nl/producten/pdok-downloads/download-basisregistratie-grootschalige-topografie.
In current linked data retrieval systems, query and exploration are often not tightly integrated and do not handle space and time in both query and exploration. This prevents users unfamiliar with a given repository from taking advantage of the self-explanatory power of linked data and the intuitive retrieval possibilities of maps and time sliders in order to find out about interesting repository content. In this paper, we have proposed design principles for exploratory querying of SPARQL endpoints in space and time, used them to compare existing tools, implemented them in terms of the SPEX tool, and tested them in a preliminary user study. The latter was based on a number of questions about a historical maps repository which require complex query construction and interaction with space-time interfaces.
Even though our study is too limited to draw strong conclusions, results are encouraging and show that the tightly closed query and exploration loops of our design enable novices on linked data to pose and correctly answer complex queries about a repository they would not be able to answer otherwise. Modeless design and immediate feedback of query on exploration and vice versa enable users to iteratively explore query functionality, data content and vocabulary meaning, as well as to find alternative solution paths for a given question. Our analysis revealed diverse solution strategies, where successful answers were found both by query patterns and space-time windows. Space and time windows were mostly used for exploratory purposes, seldom for query purposes.
However, we also found that successful question answering requires a simplification of the space-time filtering interface, a better understanding of vocabularies and data models, improved usability of context menus, and a better conceptual linking of maps/time sliders with other displays. In the future, we plan to address these issues by corresponding developments as indicated in this paper and to test them in a larger user study. Furthermore, a particular technical challenge lies in making SPEX scale up to larger datasets. Since exploratory querying requires a high degree of interactivity, SPEX currently fires many queries silently in the background. Making this interactive behavior scalable requires server side support for spatio-temporal queries as well as strategies for fast query answering.
Footnotes
Acknowledgements
This work has been funded by the German Research Foundation (DFG) through the Linked Data for eScience Services (LIFE) project (KU 1368/11-1). We thank our project partners, the Münster University Library (ULB), for their constant support of this work. Furthermore, we thank all participants of our user test for letting us peek over their shoulders.