
Abstract
PURPOSE:
The WeeFIM is a tool commonly used in pediatric rehabilitation settings to measure objective patient progress while receiving comprehensive therapy services on inpatient rehabilitation units. This Quality Improvement (QI) project aimed for 95% of inpatients to have complete, on-time documented and displayed WeeFIM scores upon admission and discharge by 12/2017.
METHODS:
An interdisciplinary team examined historic WeeFIM completion rates. Using Plan-Do-Study-Act cycles, a unified flowsheet was developed in the electronic health record (EHR) to revamp workflow and identify opportunities for improvement, data accuracy, and finally sustainability. Progress was monitored in real time via an automated data visualization tool which monitored score timeliness and completeness.
RESULTS:
On-time admission completion rates increased from 0% to 95% during the intervention period. On-time discharge completion rates increased from 0% to 89% during the intervention period. This change has been sustained over two years with on-time admission and discharge scores averaging 79.4% and 77.9% respectively, and 96.4% of scores completed.
CONCLUSION:
Changes in the completion rate of WeeFIMs are sustainable, evidenced by ongoing maintenance of our initial gains over the course of multiple months. The incorporation of WeeFIM documentation into the workflow increased on-time and overall completion rates. The success of this project shows that integrating new tasks into provider workflows helps drive completion.
Introduction
The standardized Functional Independence Measure for Children (WeeFIM) tool measures functional rehabilitation outcomes of pediatric patients [1]. It provides criterion-based assessments in 18 different domains, spanning self-care, transfers, locomotion, communication, bowel and bladder management, and social cognition [2]. It utilizes a minimum data set to represent a child’s overall level of functioning [3]. WeeFIM was developed as an adaptation of the adult Functional Independence Measure (FIM) tool [4]. This tool was validated for children with a variety of disabilities which is why it is useful for outcome measurement for the variety of impairment groups that present to our inpatient rehab unit [5]. Each section is rated on a 7 point scale based on assistance needed (total assistance to independence) and every score has age-based normative data [2]. Scores do not increase in a linear fashion as patients age from 6 months onward; rather, some skills are easier to acquire rapidly at a younger age while others are achieved gradually at a much older age [4]. WeeFIM data are reported nationally to the Uniform Data System for Medical Rehabilitation for tracking functional outcomes [2]. The WeeFIM tool is one of the few tools that is suited for reporting functional status before and after rehabilitation [3].
The WeeFIM tool has excellent test-retest and inter-rater reliability and can be used for children from 6 months to 18 years old [6]. It is commonly used in pediatric rehabilitation settings to measure objective patient progress while receiving comprehensive therapy services on inpatient rehabilitation units. The WeeFIM tool has been the focus of improvement projects at other institutions focused around correct and timely completion of the data. However, the specific interventions or pre/post intervention completion rates were not outlined in the literature [7].
WeeFIM efficiency is measured as the change in raw score from discharge minus admission divided by the length of stay in rehabilitation [8]. Average WeeFIM scores at the time of discharge for patients with brain injuries were presented, though no one else has previously reported tracking of individual patient efficiency scores in a real time dashboard [7]. Capturing comprehensive WeeFIM data allows quantifying rehabilitation unit outcomes, which helps increase the value of the care provided to patients and referring providers.
The approach to WeeFIM completion, in which each domain is completed by an expert in their related area, caused unique challenges with timely completion. Due to variability in each discipline’s documentation style and location, scores were difficult to aggregate. This method also left uncertainty around data accuracy and reliability since a multitude of providers were assessing domains with varying degrees of clinical experience. Without a unified score document, experts in each discipline struggled to review accuracy of scoring for each patient. Improved value and quality of care depends on complete and updated data to guide interventions and improvement work. An evidence-based adult rehabilitation unit improvement project relating to FIM scores supported development of a unified documentation template to assist with score completion [9]. Furthermore, accurate documentation of FIM scores has been refined in a quality improvement project targeting nursing scoring accuracy. Also, it was found that having a supervisor provide daily score checks was an optimal approach to improve acceptance by frontline staff and improve score reliability [10].
The total baseline WeeFIM completion rate, where all scores were documented in a single flowsheet location, was 0% prior to intervention. However, one discipline had baseline rates as high as 80% for their individual domain documentation. As disciplines were not using the same electronic documentation location, each provider documented in a discipline-specific location and often one or more scores were in a progress note although not entered into the WeeFIM score section of a patient chart. To address these issues with completion and documentation, a quality improvement initiative was designed using as a framework the Institute for Healthcare Improvement’s (IHI) Model for Improvement [11]. This simple, focused framework allowed the team to clearly describe aims and identify the key drivers behind their efforts which were translated into PDSA (Plan, Do, Study, Act) cycles [12].
The primary aim was that by December 2017, 95% of inpatients would have complete, documented and displayed WeeFIM scores upon admission and discharge. In addition, this would create the capacity for future weekly scoring throughout their stay with a monthly dashboard and quarterly report which included patient progress rates and variances. This goal was set for a six-month timeframe. Improvement goals above the baseline discipline-specific rates were established. The team planned for improvements to be sustained beyond the six month intervention period.
Methods
Context
This quality improvement project was performed at a 500 + bed urban, academic quaternary care facility in the mid-Atlantic region. There was an average daily census of 13–14 patients on the inpatient unit with approximately 175 admissions per year. The baseline data period reviewed 114 patients. The primary intervention period had 207 admissions. They were referred from a broad spectrum of disciplines and included a wide variety of conditions of variable severity throughout the acute care hospital at the institution as well as some referrals from outside hospitals. All patients on the acute inpatient rehab service were included and were grouped according to the WeeFIM impairment categories. Fifteen of the seventeen WeeFIM impairment groups were represented in the sample (no data from burns or failure to thrive/malnutrition groups) [2].
The multidisciplinary improvement team included Occupational Therapy (OT), Physical Therapy (PT), Speech Language Pathology (SLP), Registered Nursing (RN), Nurse Practitioners (NP), and Medical Doctors (MD). There was support from an improvement advisor and data analyst for the first six months as part of an internal project grant received from the Office of Clinical Quality Improvement. The group met biweekly for six months, then monthly, and then quarterly once a sustained state was reached.
Intervention
The team first looked at historic completion and baseline data prior to beginning PDSA cycle 1 and mapped each discipline’s process for completing WeeFIM scores. The team developed a SMART (Specific, Measurable, Achievable, Realistic, Timely) Aim to set a goal for completion, and completed a driver diagram to understand drivers of behavior related to completing and documenting WeeFIM scores. The driver diagram and process map allowed the team to identify areas for improvement within the existing process and develop interventions to address those areas [13–16]. A single unified documentation flowsheet tool was built to streamline and standardize efforts across disciplines. The team utilized an impact effort analysis tool which prioritized and strategized interventions and started PDSA cycles to test each intervention and understand its impact on the aim of the project (Table 1) [17].
PDSA cycle and focus by practice discipline
PDSA cycle and focus by practice discipline
The first PDSA cycle (PDSA 1) focused on acquainting each discipline with the new, singular unified flowsheet in the electronic health record (EHR) and completion of WeeFIM scores for every patient (Table 1). Each group found a unique approach to improve their process and revamped their workflow to integrate WeeFIM documentation into their daily work which was key to the project’s success. Building reminders into daily processes was integral to sustaining completion rates at the goal rates. The project leadership met to share ideas and successes. Each discipline worked with their team to identify ways to improve what worked for their individual discipline and within their unique workflow.
PDSA 2 focused on data accuracy (Table 1). A team of discipline-specific experts reviewed all patient WeeFIM scores for both admission and discharge over 2 months to ensure inter-rater reliability by domain. It was important that all individual data points were agreed upon by experts in the individual domain areas. These content area experts had been credentialed for several years and were supervisors in their discipline. All audits were performed by WeeFIM credentialed providers in each discipline and completed credentialing of additional providers. Credentialing was done initially and then on a maintenance cycle through the Uniform Data System for Medical Rehabilitation examination. Content experts independently reviewed scores both by observations of therapy sessions and by chart review and then provided education to staff in areas where discrepancies were noted. To improve inter-rater reliability, a subset of scores for each rater was checked by a second expert and any discrepancies were reviewed with the working group to determine final WeeFIM level.
Finally, PDSA 3 focused on sustainability of WeeFIM score completion and accuracy (Table 1). This included reminders for low performing disciplines with low completion scores. Data were reviewed by the leadership team and any areas of improvement were addressed. Best practices continued to be shared with the team so that disciplines could continue to spread successful interventions.
In order to monitor progress on project measures, the team developed a data visualization tool (Qlikview®) (Qlik-Tech, Radnor, PA). This Qlikview® dashboard allowed real time tracking of information, including WeeFIM completion metrics, unit-based metrics, efficiency metrics, census (number of patients in the unit), patient diagnoses, clinical program outcomes as well as discharge location across all patients across the unit, and by each individual patient as well as for immediate follow up. The monitoring dashboard was broken down into four sections. A division dashboard was a summary page of all high level measures to quickly summarize key measures such as census, impairment group distribution, length of stay, and discipline progress on completion and efficiency metrics. The second section was dedicated to in-depth completion metrics to ensure timely completion of WeeFIM scores, broken out by discipline and WeeFIM domain. The third dashboard section contained the efficiency metrics to review overall efficiency, by impairment group and domain, which allowed review of aggregated level WeeFIM progress that patients within each of these groups achieved during their admission. The final section contained patient detail tables to allow for review of individual patient WeeFIM scores, patient level efficiency scores, individual patient score completion status, and aggregated impairment group based age, length of stay, and score information by domain.
Measures
WeeFIM completion rates for admission and discharge were measured to track on-time completion of scores. “On-time” for admission was defined as within 24 hours after the patient arrived on the unit and discharge was defined as within 2 days before the patient left the unit. The process measures included the percent of patients with an admission WeeFIM score (on-time and completed), the percent with a discharge score (on-time and completed), and the percent with a complete WeeFIM score in all domains (on-time and completed). These were measured by domain and discipline as well as in aggregate.
Outcome metrics were admission to discharge scores, or WeeFIM efficiency. WeeFIM efficiency gains were measured by discipline and individual WeeFIM domain as the change in raw WeeFIM score between discharge and admission raw values as well as the change in raw score divided by the length of stay in the rehabilitation unit. Data were sorted by impairment group based on classification by the rehabilitation medicine physician designation. Also, overall completion of WeeFIM scores regardless of time entered was reviewed to help better understand pre-post WeeFIM scores and report data to outside entities. This will help inform future quality improvement work for the inpatient rehabilitation unit.
Balancing metrics included an analysis of documentation burden for clinicians through a feedback meeting with each discipline supervisor and quantitative analysis of time spent on the flowsheet documentation.
Analysis
All metrics were summarized and built through the utilization of a data visualization application, Qlikview® (Qlik-Tech, Radnor, PA).
WeeFIM completion rates for admission and discharge were tracked using statistical process control charts (SPC) in order to distinguish between common cause (variability that is inherent in a process) and special cause variation (change that occurs due to an attributable cause). Each metric would be monitored for special causes (including points outside the +/–3 standard deviations of the mean control limits, trends and non-random variation) [18]. Impairment groups were assigned by physicians at the time of admission and automatically captured by EHR smart data elements (SDEs). WeeFIM domain values were captured with a singular EHR flowsheet that every discipline could access. This unified document allowed entry of discrete data points in the electronic medical record. WeeFIM efficiency summaries were tracked using histograms for comparison in the data visualization application.
Discipline-specific completion was reviewed at team meetings and summary aggregated data was reviewed by the team leaders weekly. Documentation compliance by completion rates and outcome improvements made by individual patients or those with a selected diagnosis were tracked with efficiency gain monitoring. Areas of possible improvement for each of the disciplines were identified.
Ethical considerations
In accordance with institutional review board standards, this project met criteria for quality improvement and was therefore exempt from review, as no subjects were randomized and no experimental data were collected.
Results
Completion
The baseline WeeFIM on-time completion rate was 0% for the aggregate score with all disciplines completing their individual sections. The composite on-time completion rate for the overall score increased to 95% during the six-month intervention period. On-time completion rates achieved their first 100% in OT, PT, Speech, and Nursing in 3, 3, 2, and 12 months respectively post initiation of the intervention (Fig. 1A). On-time discharge completions rates increased from 0% to 89% for the WeeFIM score as a whole. Disciplines achieved 100% on-time discharge score completion in OT, PT, Speech, and Nursing in 6, 9, 9, and 10 months respectively post initiation of the intervention (Fig. 1A).
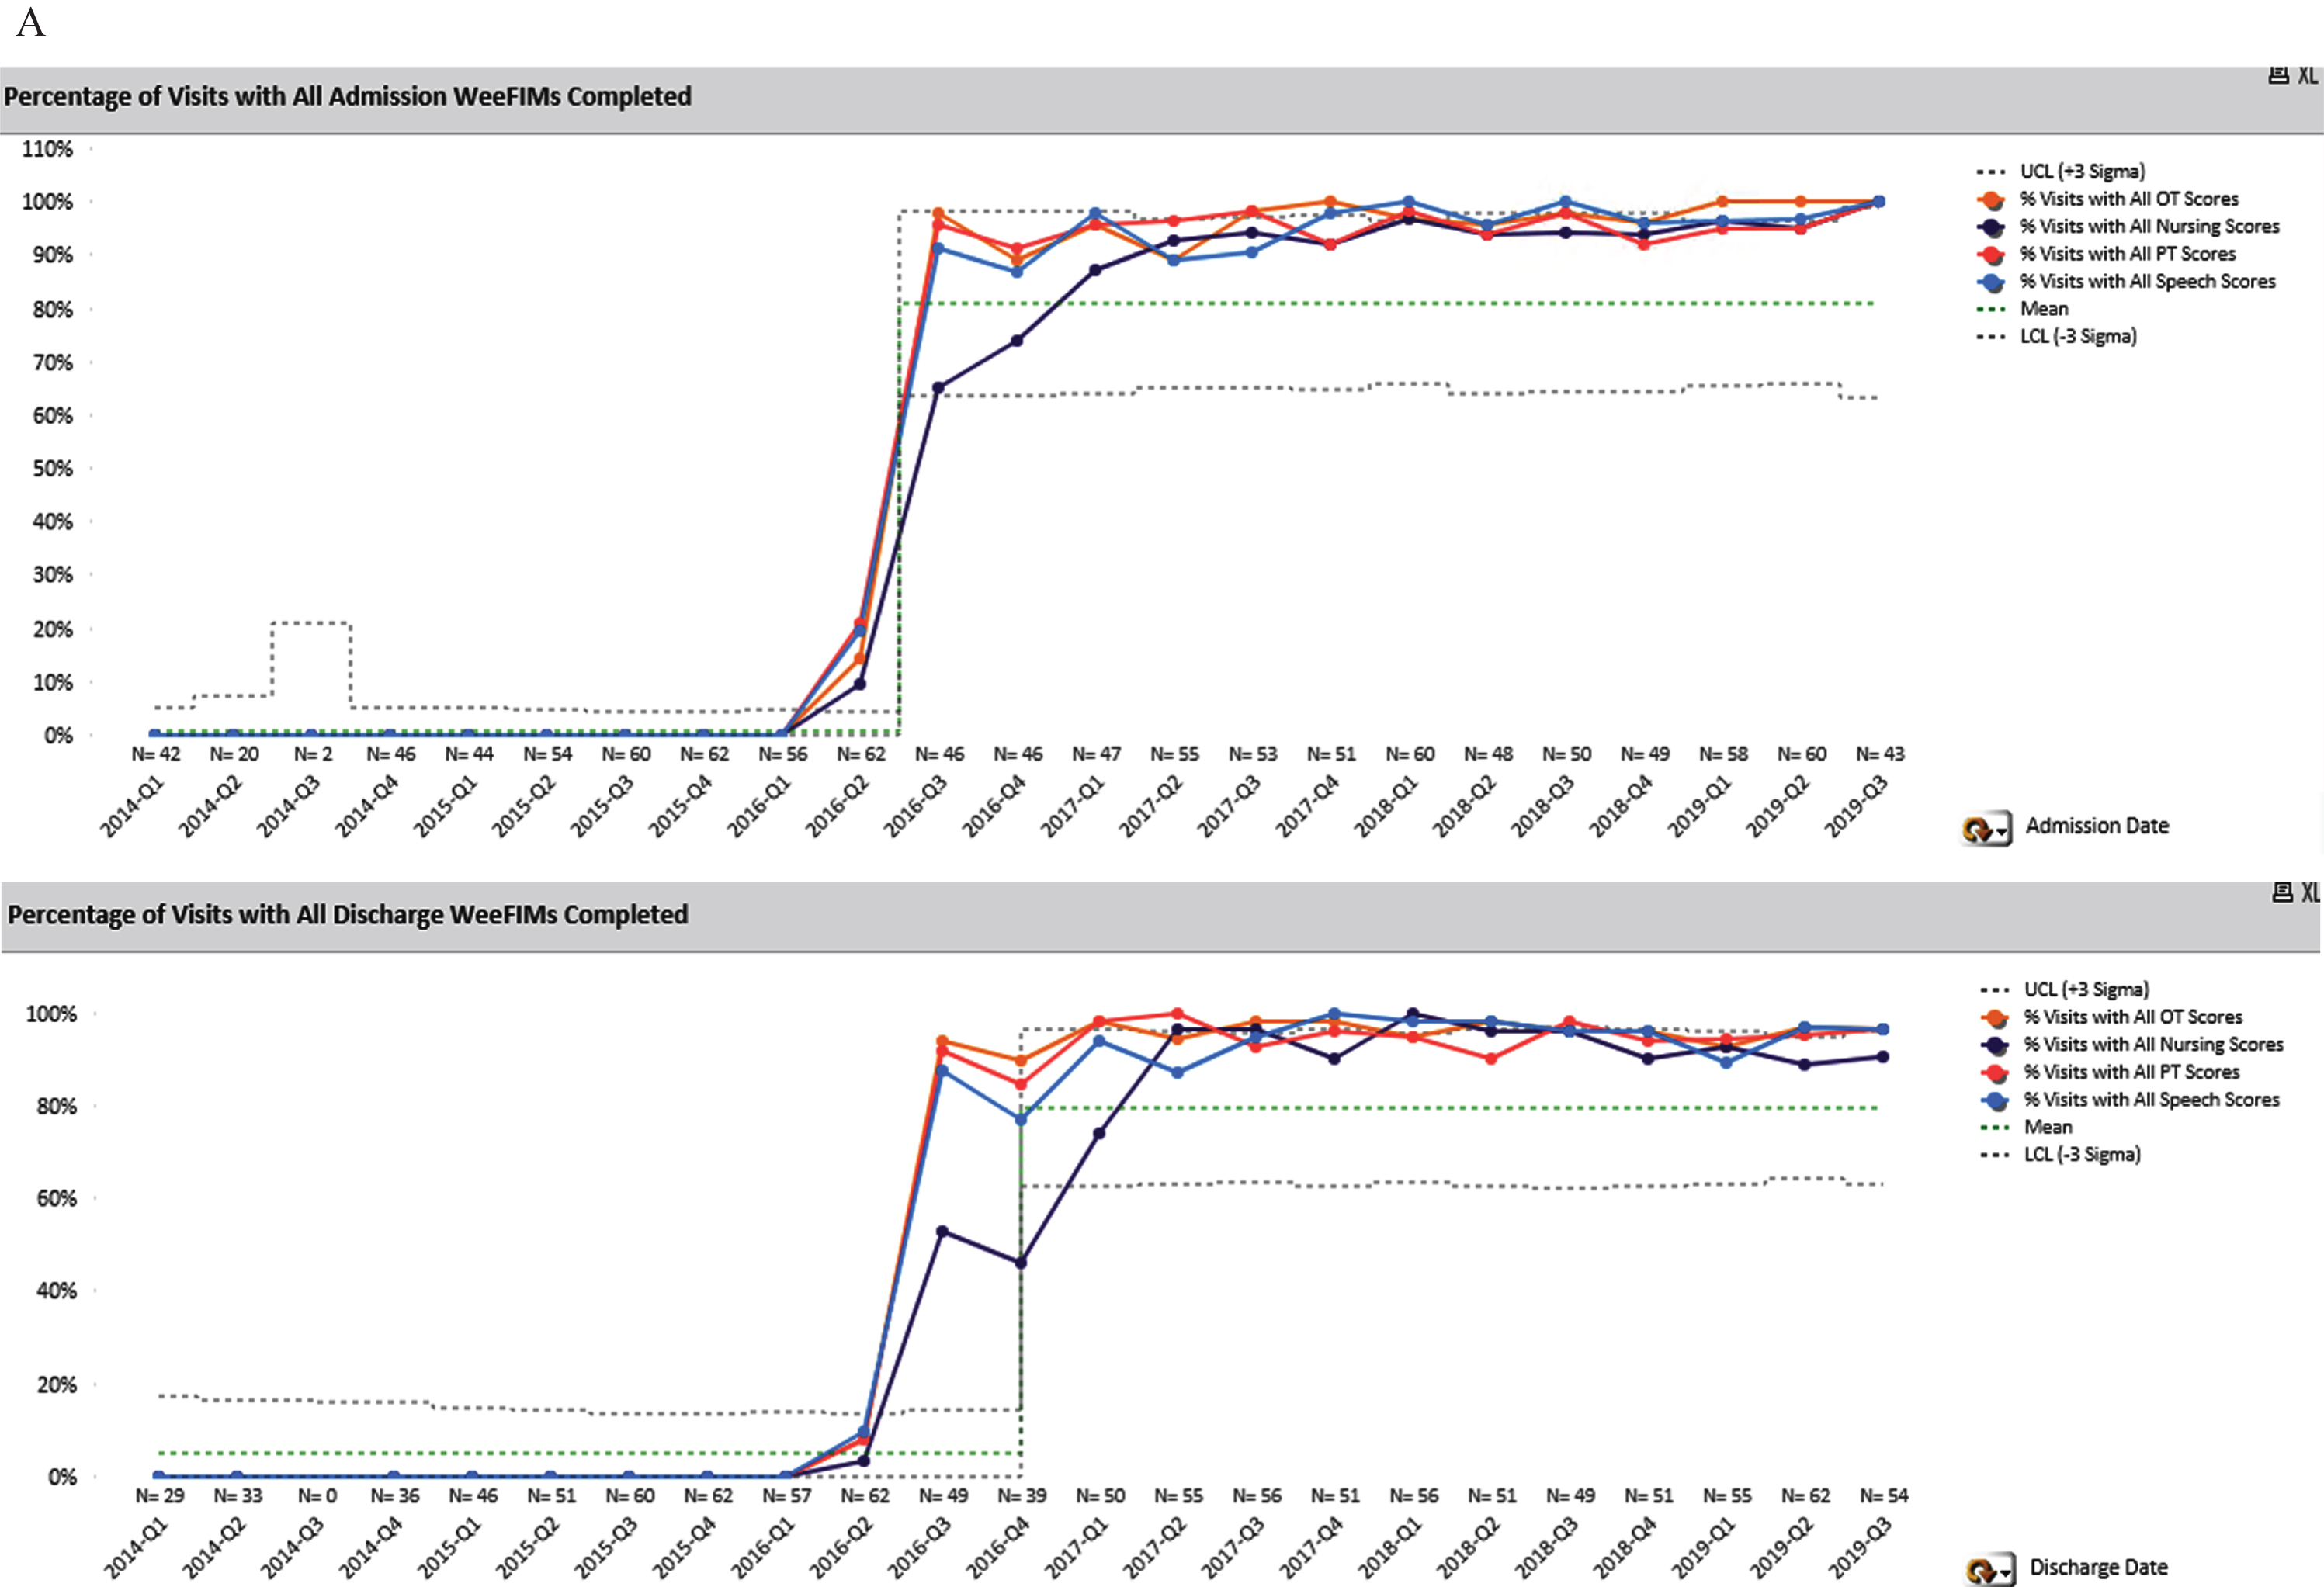
Percentage of visits with admission and discharge WeeFIMs completed by discipline.
Each discipline used different strategies to address any differences in scores between expert reviewers and individual providers (Table 1).
Sustain
Overall on-time completion post intervention increased from 0% to an average of 71% for all admissions and discharges, with a centerline shift during the intervention period (Fig. 1B). During the intervention, scores reached 100%; however after the project completed the intervention period there was some drop-off in score completion. After monitoring this new process for 18 months, there was another process shift in the average WeeFIM entry compliance that indicated this new process has resulted in a new, sustained average for both admission and discharge compliance. This overall average score has remained consistent since the start of 2017. Admission average currently is 79.4% and discharge average is 77.9% for on-time completion. Notably, the overall completion rates when on-time is not considered has been sustained at an average of 96.4% completed scores documented in our unified flowsheet.
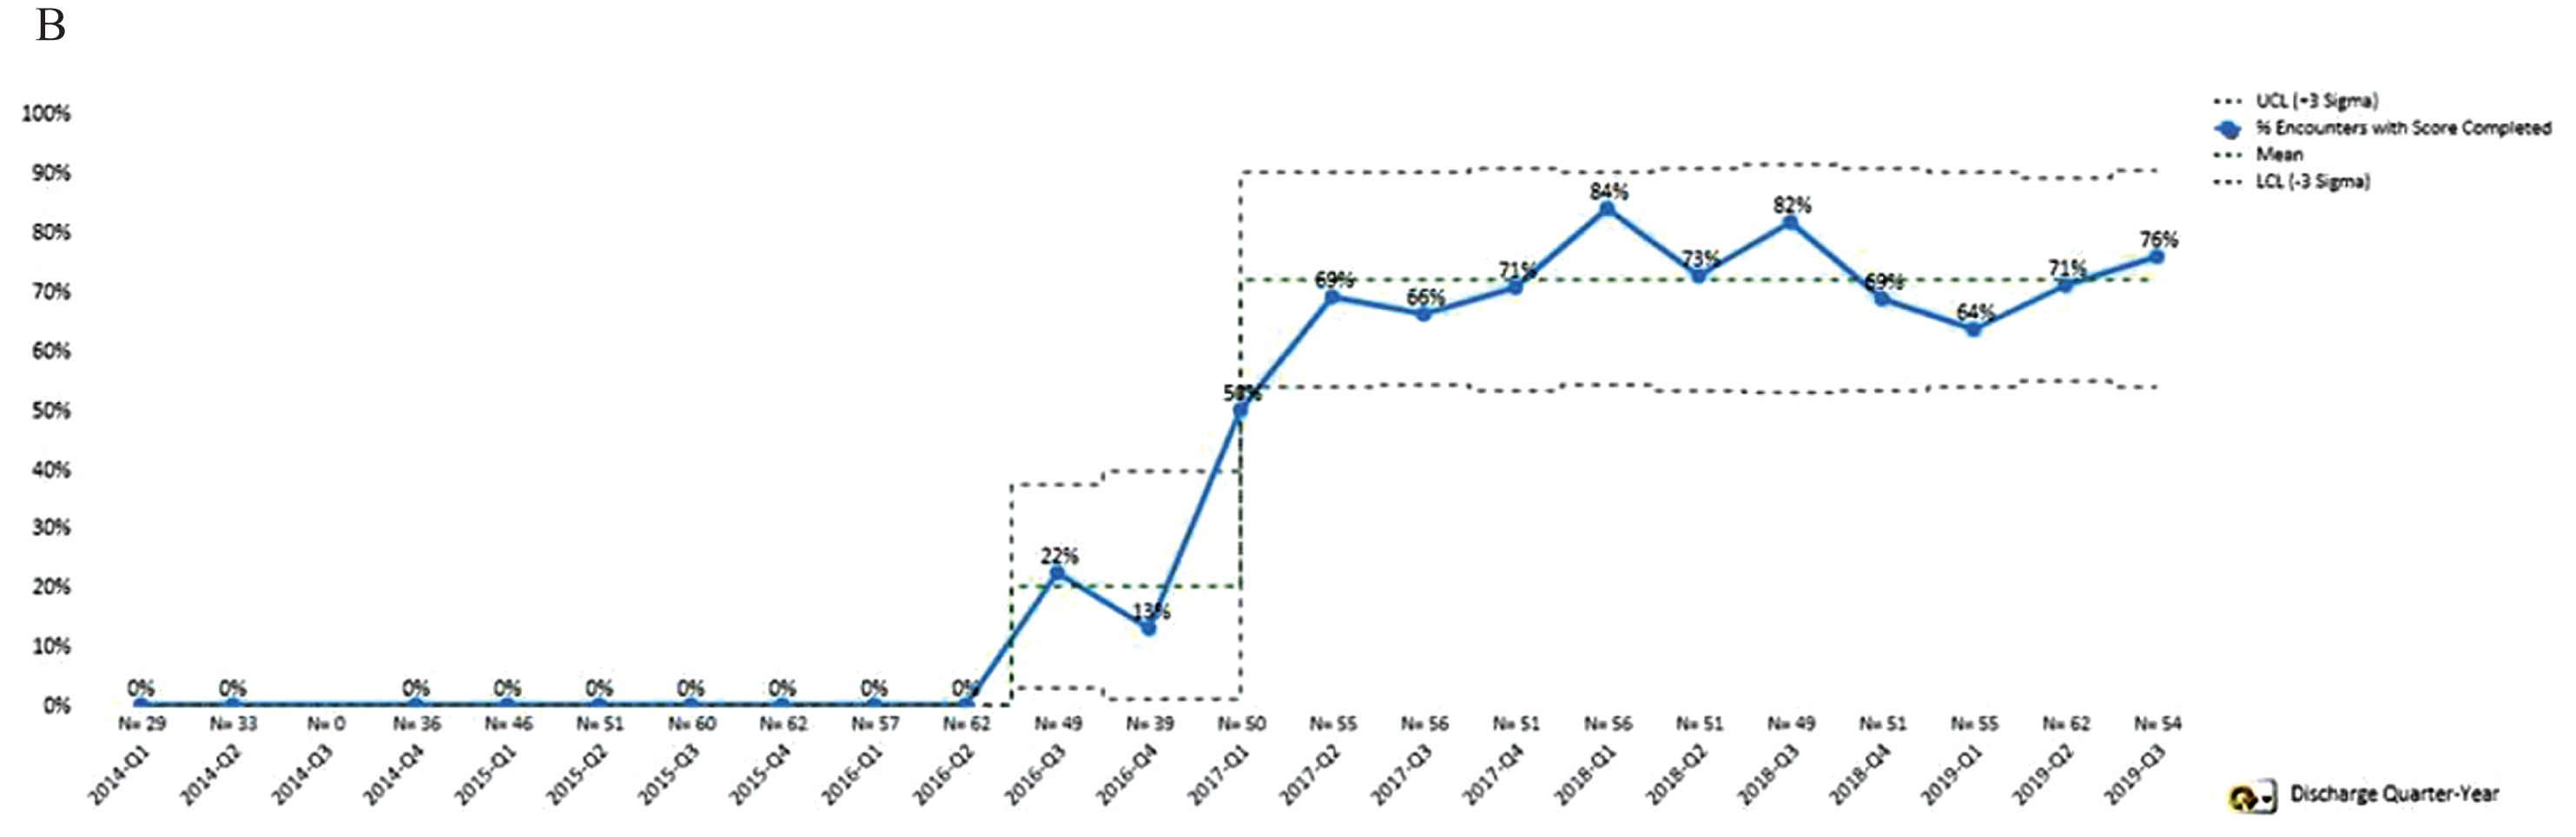
Percentage of visits with all admission and all discharge WeeFIMs completed within required timeframe (all disciplines).
Successful improvement of WeeFIM completion rates and improved overall compliance of the WeeFIM tool by PT, OT, Speech and Nursing staff on the Rehabilitation unit was achieved through an interdisciplinary team approach and development of a centralized dashboard. The Qlikview® dashboard included three levels of information: summary for the discipline, completion of documentation that facilitates process improvement, and efficiency measurements for patients that highlighted outcomes. An increase in completion of the standardized WeeFIM tool on admission and discharge by all disciplines occurred following implementation of the Qlikview® dashboard and discipline-specific workflow improvements. Discharge on-time score completion lagged further behind admission on-time completion improvements.
The Qlikview® dashboard was utilized by all disciplines to monitor WeeFIM tool completion and decrease the variation in documentation across disciplines. Each discipline utilized various methods to assure documentation and completion among their team members (Table 1). Using a single unified flowsheet was essential to capture the WeeFIM scores that were completed by clinicians, since previously they were scattered throughout the patient chart and on different flowsheets. Redesigning workflows to include this flowsheet in evaluation templates and admission checklists drove initial improvements. Continued monitoring of the data and reminders built into daily workflows has helped sustain the improvements in documentation. Reminders also help drive timely completion. The dashboard is also utilized to ensure that all fields have been completed, even if it falls outside the defined “on-time” window.
The biggest barriers to completion continue to be Friday and weekend admissions or discharges, unexpected transfers to acute care, and patients where Speech is not involved when OT has to complete those domain items. Timeliness of WeeFIM completion is challenging when patients are admitted at the end of the day on Friday or on weekends due to lack of covering certified WeeFIM therapists and nurses. In progress is work on training all related staff in performing WeeFIM assessments to decrease the impact of night and weekend admissions on the completion rates and now have a certified nurse present on all shifts to assist with scoring. Also, sometimes there is a gap in communication of needed WeeFIM score completion between weekday and weekend staff. When Speech is not following a patient, OT fills out WeeFIM scores related to expression, comprehension, memory, and problem-solving. This can create confusion, especially if Speech saw a patient early on in their stay. Thus, they filled out the tool at admission but the domains must be completed by OT at the time of discharge.
Improved interdisciplinary compliance with completion of the WeeFIM tool has made it possible to capture outcomes of the pediatric rehabilitation patients on the unit from admission to discharge. By improving this process, the team now has the necessary data to assess efficiency and drive future improvement initiatives related to the care of pediatric rehabilitation patients. These data allow for specific patient population gains to be analyzed as well as opportunities for improvement to be identified by all disciplines involved in the patient’s care. Ongoing education and chart reviews continue to take place and ensure accuracy of WeeFIM scores. All new team members are onboarded to the WeeFIM scoring system to ensure that ongoing completion rates stay high.
Limitations
As with all QI projects, the strategies and approach were tailored to the institution; thus, the same process changes and strategies may not generate similar improvements if applied at another institution. The generalizability of this effort may also be limited by the institution’s well-established foundation of quality improvement efforts which potentially alleviates some more usual limitations in QI projects including buy-in of staff, understanding of improvement concepts and familiarity with the improvement process. Furthermore, the high volume of admissions and discharges on the inpatient rehabilitation unit as well as the complexity of the patients seen in the quaternary care center may have impacted the teams’ ability to obtain WeeFIM scores in a timely fashion that was not accounted for in this QI project. The frequency with which these assessments take place may have impacted the improvement and contributed to the successes in ways that may limit application in other settings using this tool. Similar results may not necessarily be achieved if these strategies are applied in a unit with differing volumes, a non-urban center, or differing levels of complexity. They may also not translate well to a setting where a single evaluator completes a WeeFIM measure. Finally, it is not clear if these strategies would bring similar success if applied to a different outcome measure tool.
Conclusions
It was demonstrated that the changes in the completion rate of WeeFIMs are sustainable, evidenced by ongoing maintenance of the gains over the course of multiple months. The incorporation of this practice into the workflow throughout the unit will ensure that increased completion rates remain. Further, the success of this project shows that changes to workflow, such as using a new documentation flowsheet, can be integrated into provider responsibilities easily by using similar visual aids and reminders which may differ by discipline. Now that WeeFIM data entry is consistent, the meaningfulness of the aggregate scores can be interpreted. This information can be utilized to improve clinical predictions and outcomes based on patient impairment group. Further, following patient progress in real time with the use of WeeFIMs throughout the admission may result in a potential reduction in patient length of stay by allowing clear identification of patients who are no longer making functional gains with inpatient rehabilitation stays.
Footnotes
Acknowledgments
We would like to thank our colleagues for their ongoing support and contributions to this improvement work, especially Danielle Flynn, Amy Colin, and Ryan Brown. Additionally, we would like to thank Dr. Kathy Shaw and Brenna Aredas for their help with manuscript revisions and the Department of Pediatrics for their ongoing support of continued improvement.
Conflict of interest
The authors have no conflict of interest to report.