
Abstract
Background:
Multiple system atrophy (MSA) and Parkinson’s disease (PD) have overlapping symptoms, making diagnosis challenging. Short-chain fatty acids (SCFAs) are produced exclusively by gut microbiota and were reduced in feces of MSA patients. However, plasma SCFA concentrations in MSA patients have not been investigated.
Objective:
We aimed to investigate the plasma SCFAs in MSA patients and to identify the potential differential diagnostic ability.
Methods:
Plasma SCFA were measured in 25 MSA patients, 46 healthy controls, and 46 PD patients using gas chromatography-mass spectrometry. Demographic and clinical characteristics of the participants were evaluated.
Results:
Acetic acid concentration was lower in MSA patients than in healthy controls. Acetic acid and propionic acid concentrations were lower in MSA and MSA with predominant parkinsonism (MSA-P) patients than in PD patients. A receiver operating characteristic curve (ROC) analysis revealed reduced acetic acid concentration discriminated MSA patients from healthy controls with 76% specificity but only 57% sensitivity and an area under the curve (AUC) of 0.68 (95% confidence interval (CI): 0.55–0.81). Combined acetic acid and propionic acid concentrations discriminated MSA patients from PD patients with an AUC of 0.82 (95% CI: 0.71–0.93), 84% specificity and 76% sensitivity. Especially, with combined acetic acid and propionic acid concentrations, MSA-P patients were separated from PD patients with an AUC of 0.89 (95% CI: 0.80–0.97), 91% specificity and 80% sensitivity.
Conclusion:
Plasma SCFAs were decreased in MSA patients. The combined acetic acid and propionic acid concentrations may be a potential biomarker for differentiating MSA patients from PD patients.
INTRODUCTION
Multiple system atrophy (MSA) is a sporadic, adult-onset, progressive neurodegenerative disease characterized by diverse combinations of parkinsonian features, cerebellar ataxia, autonomic failure, and pyramidal features. Clinically, MSA is divided into two subtypes: MSA with predominant parkinsonism (MSA-P) and MSA with predominant cerebellar ataxia (MSA-C) [1]. The typical neuropathology of MSA is glial cytoplasmic inclusions (GCIs), mainly composed of α-synuclein [2]. However, the explicit etiology and pathogenic mechanisms remain unclear. MSA has many overlapping symptoms with idiopathic Parkinson’s disease (PD). Particularly in the early stage, it is often difficult to accurately differentiate MSA, especially MSA-P, from PD [3]. However, patients with MSA generally have an inefficient or transient response to levodopa and much faster disease progression [4]. There is not yet a specific therapy for MSA, and only symptomatic treatment is available, which is quite unsatisfied [5]. Thus, there is a clear need to identify specific biomarkers that can help clinicians establish a more timely and accurate differential diagnosis among patients suspected to have MSA.
The gut-brain axis incorporates bidirectional communication between the central and enteric nervous systems and endocrine systems as well as regulation of immune responses in the gut and brain, influenced by the activity of gut microbiota [6]. Dysfunction of the gut-brain axis may be an important factor contributing to many movement disorders, such as MSA and PD [7, 8]. Previous research has suggested that the gut microbiota and intestinal inflammation as environmental factors play an important role in the pathogenic mechanisms of MSA [9]. Five studies exploring the relationship between gut microbiota and MSA, found that gut microbiota dysbiosis existed in patients with MSA [7, 9–12]. In addition to MSA, gut microbiota dysbiosis and alteration of microbial metabolites in PD have been increasingly reported in various studies across different populations [13–18]. However, the pathogenesis of microbial metabolic patterns might be distinct between MSA and PD based on the different gut microbial gene markers identified recently [16]. Short-chain fatty acids (SCFAs) are mainly produced through fermentation of dietary fiber by the colonic microbiota [19]. SCFAs are important in modulating microbiota homeostasis, regulating immune system and maintaining tight junctions in the intestinal wall [20]. It has even been demonstrated that the presence of SCFA-producing bacteria in the intestine can enhance the blood-brain barrier (BBB) by promoting BBB tight junction protein expression and tissue enhancement [21]. SCFAs are absorbed in the gut and transported to the liver via the portal venous system, and some SCFAs enter systemic circulation [19]. However, only one study reported that the levels of SCFAs, including butyric acid, acetic acid and propionic acid, were decreased in the feces of patients with MSA [12]. Although the alteration in the blood microbiota has been detected in Chinese MSA patients, the levels of SCFAs in the blood have not yet been detected [11].
Recently, only one study reported that circulating SCFAs were associated with PD, disease severity and antiparkinsonian medications [22]. However, compared with fecal SCFAs, plasma SCFAs may better represent the fraction of SCFAs that enter the host bloodstream and play a potential role in the pathogenesis of MSA. Here, we measured the concentration of plasma SCFAs to compare the SCFAs in the blood of MSA patients to those of healthy controls in mainland China. Additionally, patients with PD were recruited as disease controls, to explore the possible use of plasma SCFAs as potential biomarkers in the differential diagnosis of MSA patients from PD patients.
MATERIALS AND METHODS
Subjects
Patients with MSA (n = 25; 9 males, 16 females; mean age 61.60±6.81 years), healthy controls (n = 46; 14 males, 32 females; mean age 64.08±7.87 years) and PD patients (n = 46; 22 males, 24 females; mean age 64.67±7.94 years) were recruited from the movement disorder clinic at the Department of Neurology, Ruijin Hospital, Shanghai Jiao Tong University School of Medicine.
Patients were diagnosed with probable or possible MSA according to the second consensus criteria for MSA by senior movement disorder specialists [23]. PD patients were diagnosed according to the United Kingdom Parkinson’s Disease Society Brain Bank Clinical Diagnostic criteria [24]. The other inclusion criteria were as follows: 1) voluntary agreement to participate in the study; 2) no use of antibiotics for 3 months; and 3) no use of immune-related drugs such as steroids for 3 months.
The exclusion criteria were as follows: 1) secondary parkinsonism, Alzheimer’s disease, or other central nervous system diseases; 2) celiac disease; 3) lactulose intolerance; 4) chronic pancreatitis; () other gastrointestinal tract absorption disorders; 6) history of gastrointestinal surgery (except appendectomy); 7) inflammatory bowel disease (Crohn’s disease, ulcerative colitis); 8) history of surgical or medical treatment for cancer within the last 3 years; 9) illiteracy; and 10) investigator judgment that candidates were inappropriate for participation in the study.
All subjects consented to cooperate with this study, and written informed consent was obtained from all subjects in the study. This study protocol was approved by the Ethics Committee of Ruijin Hospital, Shanghai Jiao Tong University School of Medicine.
Clinical and nutritional evaluation
Demographic data (age, gender, and BMI (kg/m2)) from all subjects and clinical features of MSA patients and PD patients, including age of onset, disease duration, Hoehn and Yahr stage, anti-PD medications, levodopa equivalent daily dosage (LEDD), wheel use, urinary catheterization, constipation condition, and nutritional evaluations, were recorded in our study. Patients with MSA were evaluated by Unified Multiple System Atrophy Rating Scale (UMSARS) and patients with PD were assessed using International Parkinson and Movement Disorder Society-Unified Parkinson’s Disease Rating Scale (MDS-UPDRS). Non-motor symptoms, autonomic symptoms and quality of daily life were evaluated using the Non-Motor Symptoms Questionnaire for Parkinson’s Disease (NMS-Quest), the Scale for outcomes in Parkinson’s Disease-Autonomic (SCOPA-AUT) and 39-item Parkinson’s Disease Questionnaire (PDQ-39), respectively. Levodopa equivalent doses (LEDs) were calculated using a previously described method [25]. Constipation was assessed using the Wexner constipation score and Rome III criteria, and nutritional evaluations were performed using a food frequency questionnaire (FFQ).
SCFA analysis
We measured the concentrations of acetic acid, propionic acid, isobutyric acid, butyric acid, isovaleric acid, valeric acid and caproic acid for SCFA analysis. Blood samples was collected from all subjects. All samples were collected in tubes containing ethylenediaminetetraacetic acid (1 mg/mL) and glutathione (1 mg/mL) and immediately centrifuged (3000 rpm for 10 min). Plasma was used for SCFA analysis. Plasma samples were thawed on ice at 4°C and mixed thoroughly before preparation. Plasma metabolites were extracted by adding 50μL of 50% sulfuric acid and 200μL of diethyl ether (containing 0.5μg/mL internal standard) to 100μL of plasma sample. After mixing for 1 min, the samples were centrifuged at 12000 rpm and 4°C for 20 min and incubated for 30 min at 4°C, and the supernatant was transferred to a new centrifuge tube. SCFA analysis was performed using 7890A-5975C gas chromatography-mass spectrometry (GC-MS, Agilent, USA). Supernatant was separated using a capillary column FFAP 30 m×0.25 mm×0.25μm (Agilent, USA). The injection volume was 1μL per sample and split mode was set at a ratio of 5:1. The temperature program was as follows: the initial oven temperature was held at 100° for 1 min, elevated to 160° at a rate of 5°/min, increased to 240° at a rate of 40°/min, and finally held at 240° for 10 min. The flow rate of the carrier gas (Helium) was set at 1 mL/min through the column. The temperatures of the inlet, transfer interface, and electron impact ion source were 250, 270, and 230°, respectively. The mass range (m/z 20–350) in full-scan mode for electron impact ionization (70 eV) was applied. The peak area was used to calculate SCFA concentrations. Raw GC-MS data were processed using MassHunter software (Agilent Tech., USA) for peak integration, calibration, and quantitative analysis for SCFAs.
Statistical analysis
Data are presented as mean±standard deviation (SD) or frequency (percentage). Differences between the 2 groups were analyzed by the Mann-Whitney U test for numerical data or chi-square test for categorical data. A general linear regression analysis was used to adjust potential confounders for plasma SCFAs, and p-values for multiple testing were corrected by Benjamini-Hochberg method for the false discovery rate (FDR). Logistic regression analysis was used to determine the combination of plasma SCFAs for differential diagnosis, and the constructed equations was as follows [26]:
The [P = Disease] was the prediction probability of Parkinson’s disease with the combination of plasma acetic acid and propionic acid concentrations. The a, b were coefficients, [acetic acid] and [propionic acid] were the plasma concentrations of acetic acid and propionic acid, respectively. Receiver operating characteristic curve (ROC) was used to evaluate the sensitivity, specificity of plasma SCFAs in identification of diseases according to the results of the logistic regression analysis. Correlation between SCFAs and clinical features of MSA was conducted using Spearman correlation analysis. Statistical analysis was performed using SPSS software (version 22.0; SPSS Inc., Chicago, IL), and the significance levels, including p-value and FDR-P were set at 0.05 (2-tailed).
RESULTS
Basic demographic and clinical characteristics
A total of 25 patients with MSA, 46 healthy controls and 46 patients with PD were included in the study. The basic demographic and clinical characteristics of all study subjects are described in Table 1. The results of dietary intake patterns of the participants over the past year based on the FFQ are also summarized. Although BMI of the patients with MSA was higher than that of the healthy controls and patients with PD (p = 0.003 for MSA patients vs healthy controls, p = 0.026 for MSA patients vs PD patients), the total calories did not differ among the groups. Yogurt intake was higher in the MSA patients than in the healthy controls (p = 0.002), and yogurt intake was higher in the MSA-P patients than in the PD patients (p = 0.029). Both the frequency of constipation and the degree of constipation (Wexner score) in patients with MSA were higher than those in healthy controls (p < 0.001). Compared with PD patients, though disease duration and LEDD of patients with MSA were lower (p < 0.001), MSA patients suffered higher Hoehn and Yahr stage (p < 0.001), more severe autonomic symptoms (p = 0.001), and worse quality of life (p < 0.001). In addition, more MSA patients depended on wheel use (p < 0.001) and urinary catheterization (p = 0.024), as it is similar in MSA-P patients. In the MSA patients’ subgroups, Wexner score, LEDD and frequency of levodopa intake in MSA-P patients were higher than those of MSA-C patients, while PDQ-39 score was lower in MSA-P patients than MSA-C patients (all p < 0.05).
Characteristics of the participants in the study
Data were shown as mean±SD or frequency (percentage). Differences between groups were assessed using the chi-square test for categorical data and Mann-Whitney U test for numerical data. ap-value, where differences in the characteristics between patients with MSA and HC were detected; bp-value, where differences in the characteristics between patients with MSA and patients with PD were detected; cp-value, where differences in the characteristics between patients with MSA-P and patients with PD were detected; dp-value, where differences in the characteristics between patients with MSA-P and patients with MSA-C were detected. MSA, multiple system atrophy; MSA-P, multiple system atrophy with predominant parkinsonism; MSA-C, multiple system atrophy with predominant cerebellar ataxia; HC, healthy controls; PD, Parkinson’s disease; BMI, Body Mass Index; UMSARS, Unified Multiple System Atrophy Rating Scale; MDS-UPDRS, International Parkinson and Movement Disorder Society-Unified Parkinson’s Disease Rating Scale; NMS, non-motor symptom; SCOPA-AUT, Scale for outcomes in Parkinson’s Disease-Autonomic; PDQ-39, 39-item Parkinson’s Disease Questionnaire; LEDD, levodopa equivalent daily dosage; COMT, catechol-O-methyltransferase; MAO-B, monoamine oxidase B.
Comparisons of plasma concentrations of SCFAs
In comparisons of plasma concentrations of SCFAs (Table 2), only the acetic acid concentration was lower in MSA patients than in the healthy controls (29.58±12.73 vs 39.88±16.46μmol/L; p = 0.013). Compared with that in the PD patients, the acetic acid concentration was lower in MSA patients (29.58±12.73 vs 40.13±10.72μmol/L; P = 0.001) (Fig. 1A). The propionic acid concentration was much lower in MSA patients than in PD patients (3.95±1.28 vs 5.27±1.89μmol/L; p = 0.001), while the propionic acid concentration of the PD patients was higher than that in healthy controls (5.27±1.89 vs 4.35±1.28μmol/L; p = 0.014) (Fig. 1B). In the comparison of different disease groups, the acetic acid concentration was lower in MSA-P patients than in PD patients (28.01±9.74 vs 40.13±10.72μmol/L; p = 0.002) (Fig. 1C). The propionic acid concentration was also lower in MSA-P patients than in PD patients (3.64±0.85 vs 5.27±1.89μmol/L; p = 0.002) (Fig. 1D). Additionally, the isovaleric acid concentration was lower in MSA-P patients than in MSA-C patients (0.49±0.14 vs 0.74±0.31μmol/L; p = 0.016). After correction for covariates (i.e., gender, age, BMI, FFQ, constipation, Wexner score, and yogurt consumption), the acetic acid concentration was significantly lower in patients with MSA than in healthy controls (B = –10.30, FDR-P = 0.024). Both acetic acid and propionic acid concentrations were significantly lower in patients with MSA than in PD patients after correction for confounders (i.e., gender, age, BMI, FFQ, constipation, Wexner score, yogurt consumption, age of onset, disease duration, and LEDD). (B = –10.55, FDR-P = 0.001 for acetic acid; B = –1.32, FDR-P = 0.006 for propionic acid). Additionally, both acetic acid and propionic acid concentrations were significantly lower in patients with MSA-P than in PD patients (B = –12.13, FDR-P = 0.003 for acetic acid; B = –1.63, FDR-P = 0.016 for propionic acid) (Supplementary Table 1).
Comparisons of the plasma concentrations of SCFAs in different subgroups
Data were shown as mean±SD, and the differences between groups were assessed using the Mann-Whitney U test. ap-value, where differences in plasma concentrations of SCFAs between patients with MSA and HC were detected; bp-value, where differences in plasma concentrations of SCFAs between patients with MSA and patients with PD were detected; cp-value, where differences in plasma concentrations of SCFAs between patients with MSA-P and patients with PD were detected; dp-value, where differences in plasma concentrations of SCFAs between patients with MSA-P and patients with MSA-C were detected. SCFA, short-chain fatty acid; MSA, multiple system atrophy; MSA-P, multiple system atrophy with predominant parkinsonism; MSA-C, multiple system atrophy with predominant cerebellar ataxia; HC, healthy controls; PD, Parkinson’s disease.
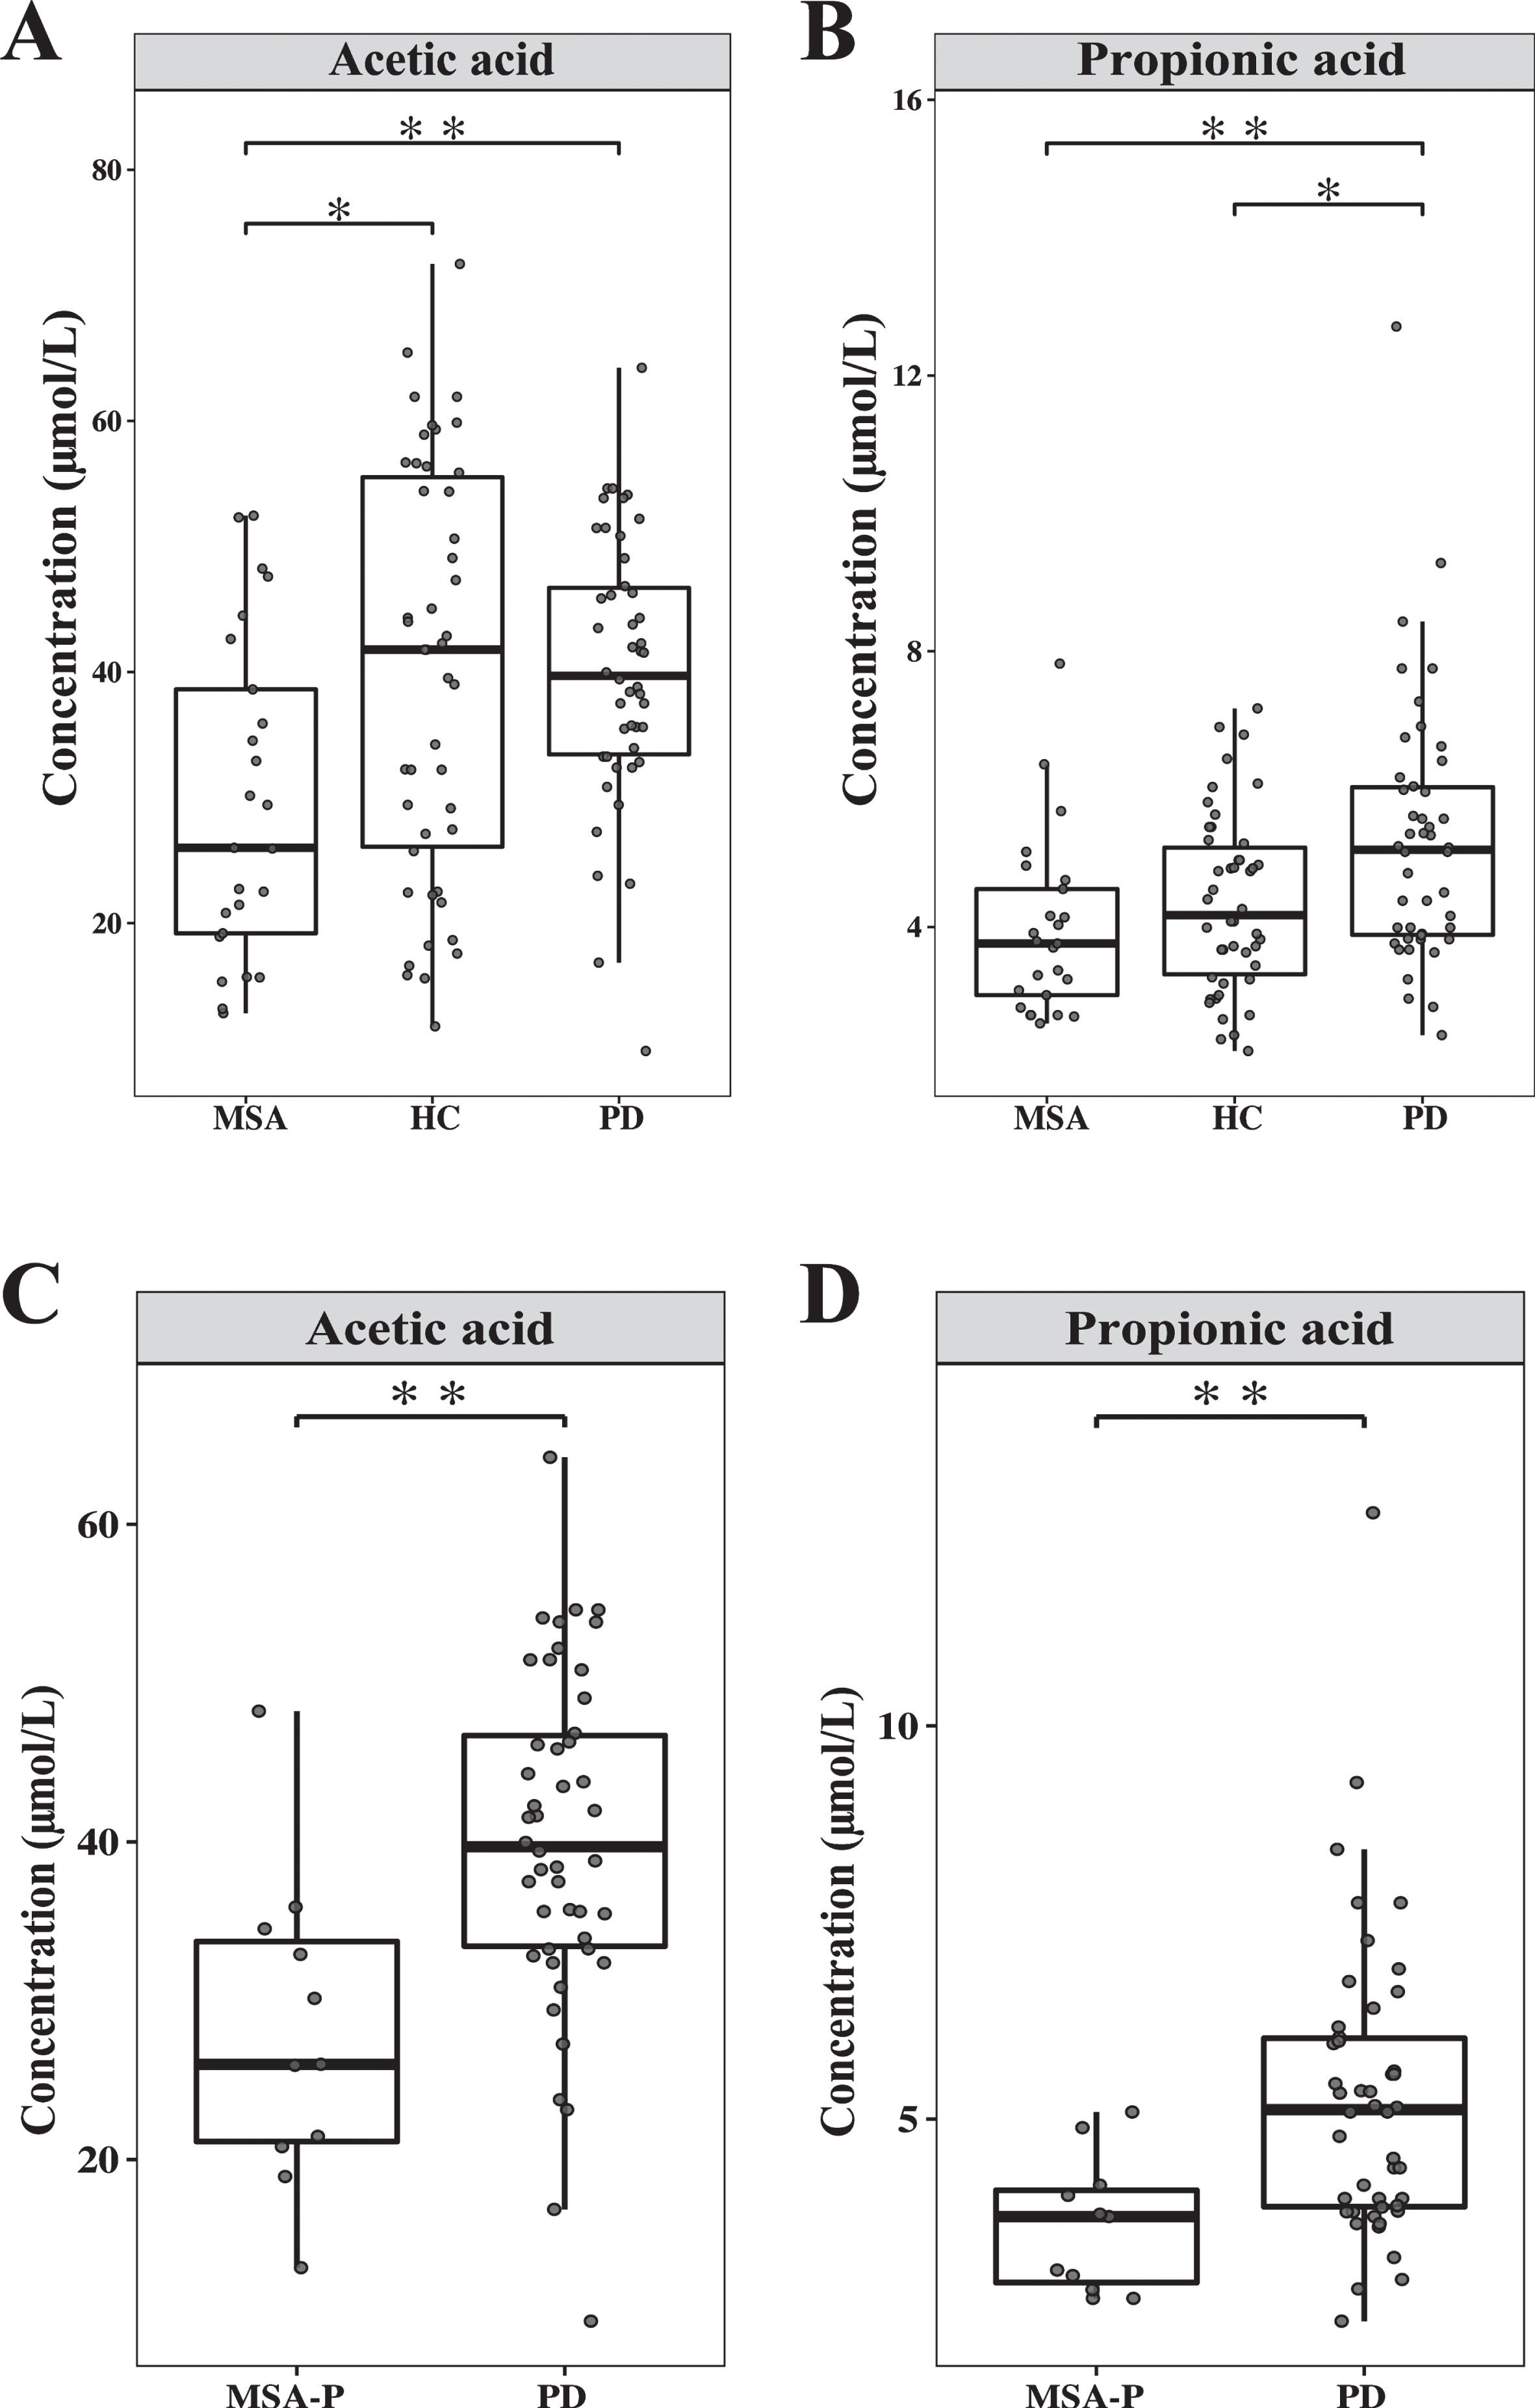
Comparison of the plasma concentrations of SCFAs in MSA patients, PD patients, and healthy controls. A) Acetic acid concentration was detected in MSA patients, PD patients, and healthy controls. B) Propionic acid concentration was detected in MSA patients, PD patients, and healthy controls. C) Acetic acid concentration was detected in MSA-P patients and PD patients. D) Propionic acid concentration was detected in MSA-P patients and PD patients. The whiskers show the lowest and highest values within the IQR from the first and third quartiles. All data points were shown. *p < 0.05, **p < 0.01, the Mann-Whitney U test. SCFA, short-chain fatty acid; MSA, multiple system atrophy; PD, Parkinson’s disease; HC, healthy controls; MSA-P, multiple system atrophy with predominant parkinsonism.
Identification of MSA patients
Based on the ROC analysis, identification of MSA patients based on the difference in acetic acid concentration had 76% specificity and 57% sensitivity with an AUC of 0.68 (95% CI: 0.55–0.81) (Fig. 2A). In distinguishing MSA patients from patients with PD (Fig. 2B), this classifier based on the difference in acetic acid concentration had 60% specificity and 87% sensitivity with an AUC of 0.73 (95% CI: 0.60–0.87). With only propionic acid concentration, the patients with MSA could be separated from PD patients with an AUC of 0.74 (95% CI: 0.61–0.86), providing 56% specificity and 83% sensitivity. By combining acetic acid and propionic acid concentrations, a higher AUC of 0.82 was obtained (95% CI: 0.71–0.93) with 84% specificity and 76% sensitivity. In particular, MSA-P patients could be separated from PD patients with an AUC of 0.81 (95% CI: 0.66–0.96) based on acetic acid with 91% specificity and 63% sensitivity (Fig. 2C). With only propionic acid, MSA-P patients could be separated from PD patients with an AUC of 0.80 (95% CI: 0.67–0.93) with 64% specificity and 83% sensitivity. By combining acetic acid and propionic acid concentrations, MSA-P patients could be separated from PD patients with a higher AUC of 0.89 (95% CI: 0.80–0.97) with 91% specificity and 80% sensitivity.
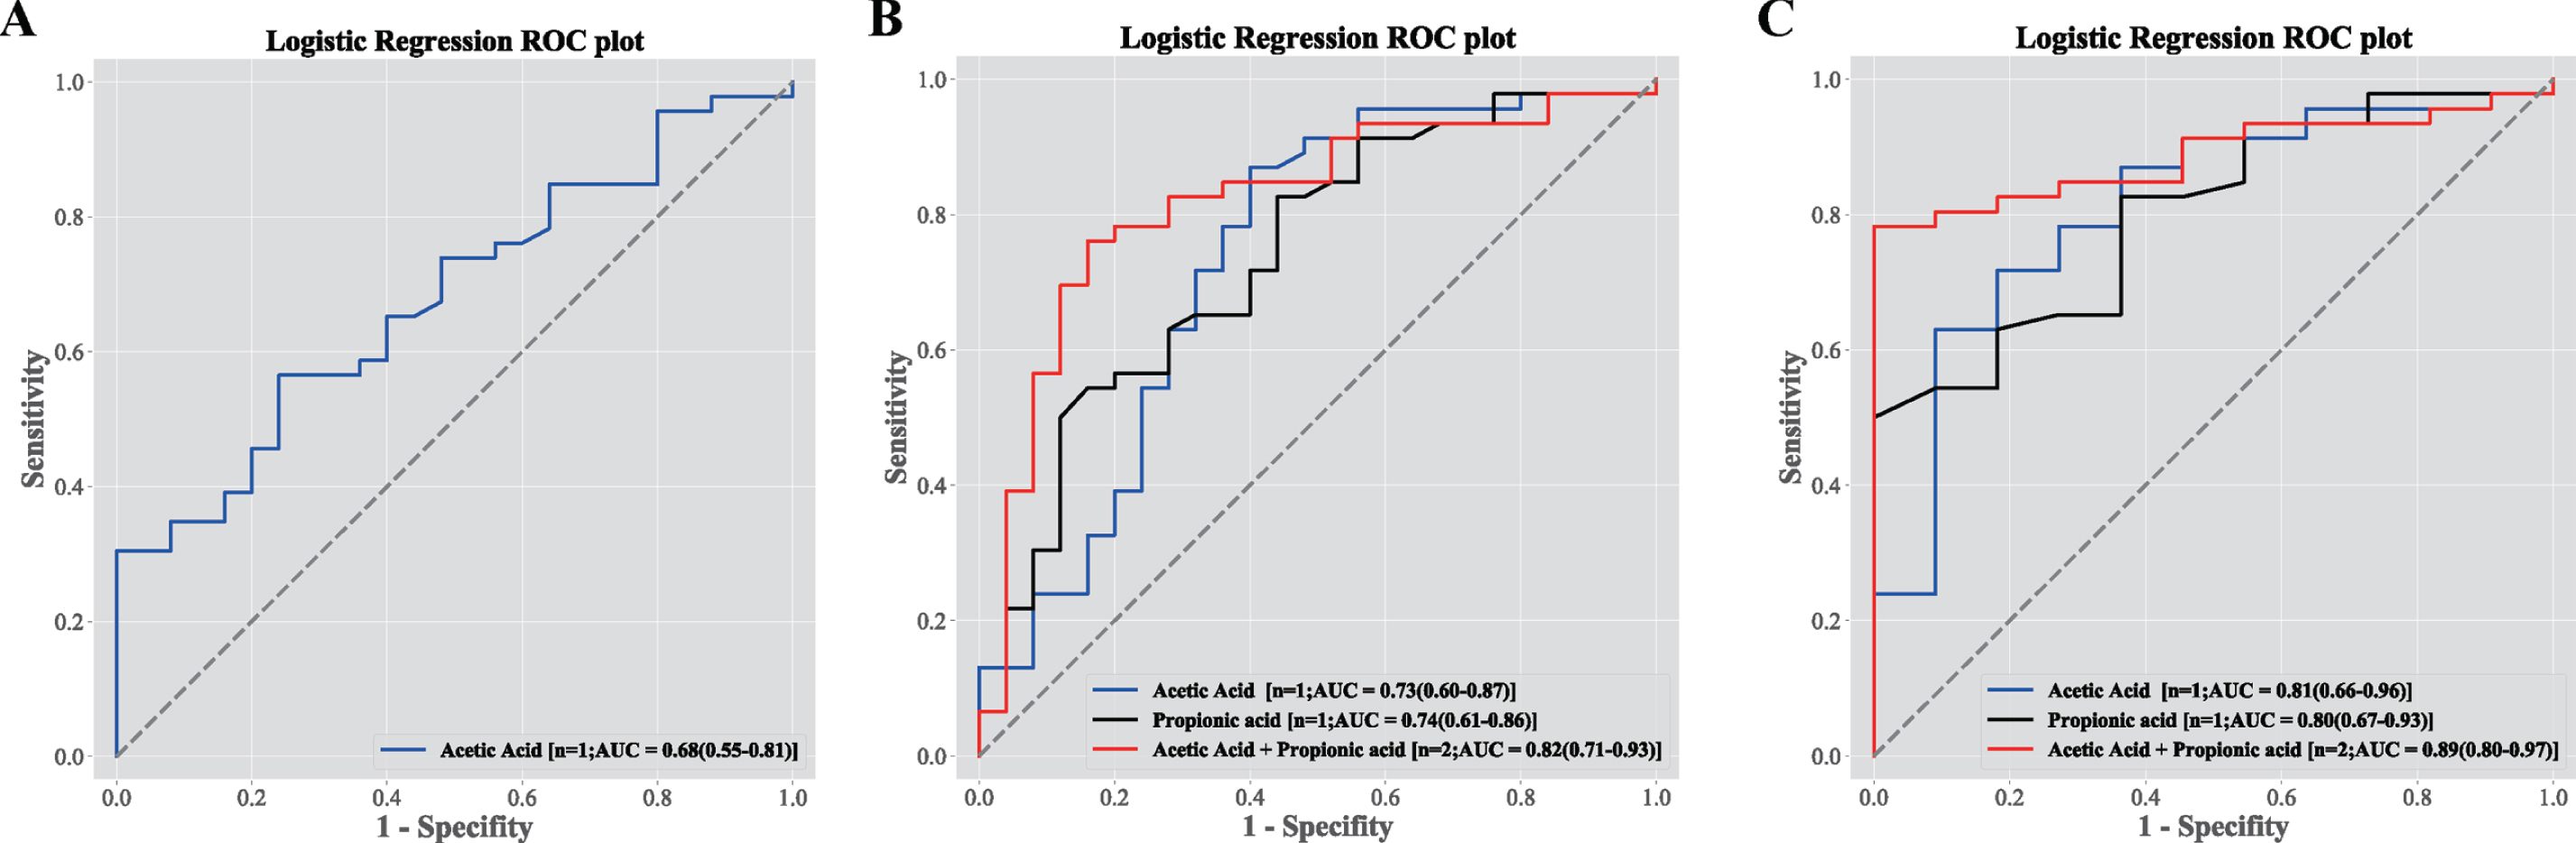
Differential plasma concentrations of SCFAs performed as ROC curves of discriminators of study group membership. A) The ROC curve analysis of acetic acid distinguished between MSA and HC from the logistic regression classifier. The AUC and 95% CI were shown for 25 MSA patients and 46 healthy controls. B) The different models of the ROC curve analysis distinguished between MSA and PD patients from the logistic regression classifier, for acetic acid (blue), propionic acid (black) and acetic acid+propionic acid (red). The AUC and 95% CI were shown for 25 MSA patients and 46 PD patients. C) The different models of the ROC curve analysis distinguished between MSA-P and PD patients from the logistic regression classifier, for acetic acid (blue), propionic acid (black) and acetic acid+propionic acid (red). The AUC and 95% CI were shown for 11 MSA-P patients and 46 PD patients. ROC, receiver operating characteristic; AUC, area under the receiver operating characteristic curve; CI, confidence interval; MSA, multiple system atrophy; HC, healthy controls; PD, Parkinson’s disease; MSA-P, multiple system atrophy with predominant parkinsonism.
Clinical correlation analysis in MSA patients
In the clinical correlation analysis (Supplementary Table 2), a positive correlation between BMI and propionic acid concentration (R = 0.482, p =0.015) (Fig. 3A) and a negative correlation between Wexner score and isovaleric acid concentration (R = –0.444, p = 0.026) (Fig. 3B) were identified. In the comparisons of MSA subgroups, lower propionic acid concentration was observed in MSA patients who suffered autonomic symptoms (UMSARS III score) (3.61±0.96 vs 5.06±1.60μmol/L, p =0.025) (Fig. 3C). Besides, the isobutyric acid concentration were lower in MSA patients who used dopamine agonists (0.81±0.21 vs 1.02±0.21μmol/L, p = 0.042), and isovaleric acid concentration were lower in MSA patients with constipation (0.54±0.17 vs 0.82±0.37μmol/L, p = 0.043) (Supplementary Table 3).
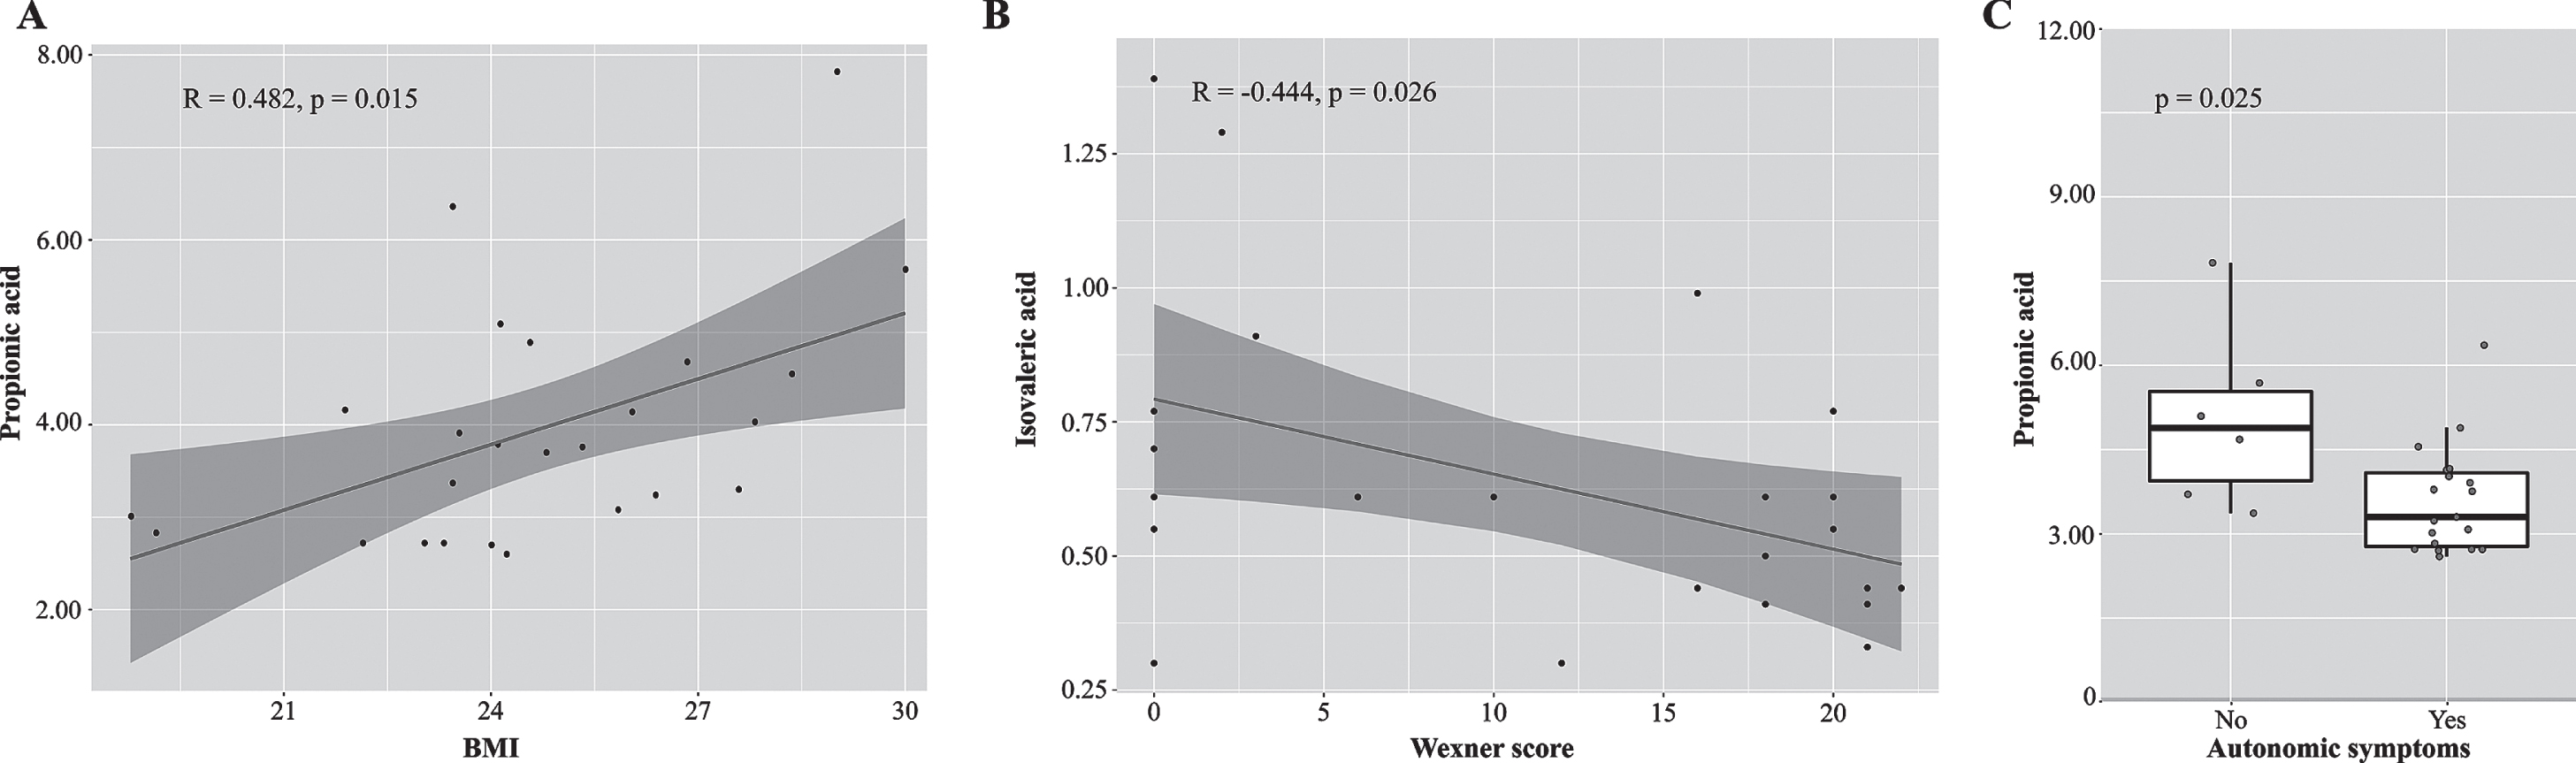
Clinical characteristics significantly correlated with SCFAs in MSA patients. A) Scatterplots show positive correlation between BMI and propionic acid concentration in MSA patients. B) A negative correlation between Wexner score and isovaleric acid concentration in MSA patients. C. MSA patients who suffered autonomic symptoms (UMSARS III score) had lower concentrations of propionic acid concentration. See Supplementary Tables 2 and 3 for the detailed data. SCFA, short-chain fatty acid; MSA, Multiple system atrophy; BMI, Body Mass Index; UMSARS, Unified Multiple System Atrophy Rating Scale.
DISCUSSION
In this study, we found that the concentration of acetic acid was lower in patients with MSA than in healthy controls. Moreover, lower concentrations of acetic acid and propionic acid were also found in patients with MSA and in the patients with MSA-P than in patients with PD. Based on ROC analysis, the combined acetic acid and propionic acid concentration could discriminate patients with MSA from PD and distinguish MSA-P patients from PD patients, suggesting that the combination of acetic acid and propionic acid may be a potential diagnostic biomarker of MSA. In particular, dietary habits were recorded and analyzed, and the SCFA concentrations were not biased by dietary habits, which is another important advantage that may largely mitigate the impact of diet on the results.
This is the first study to detect plasma SCFAs in patients with MSA. In 2019, Mori et al. reported that the plasma fatty acids in the MSA patients, which were mainly characterized by elevation of long-chain fatty acids and neurosteroids, but the SCFAs concentrations were not detected [27]. Recently, one study reported that the plasma SCFA concentrations did not differ between patients with PD and controls in unadjusted comparison. While after corrected with covariates, increased plasma acetic acid concentration were detected in PD patients and associated with disease severity and antiparkinsonian medications [22]. To explain the decrease of SCFAs in the blood of MSA patients, we assumed the following hypothesis. First, it is possible that there might be fewer SCFA-producing bacteria in the blood, based on the results that a lower abundance of Leucobacter was detected in patients with MSA [11]. Second, SCFAs are mainly produced by fermentation of dietary fiber by the colonic microbiota [19]. The production of SCFAs in the feces of patients with MSA might be decreased, as one study reported that butyric acid, acetic acid and propionic acid were decreased using 1H nuclear magnetic resonance spectroscopy [12]. With less SCFAs in feces, the SCFAs in blood might also be reduced. Additionally, one study found that the SCFA-producing bacteria in the feces, such as Bifidobacterium, decreased in MSA patients in a Chinese study [10]. The consistent finding (across two studies) of lower SCFA levels may indicate impaired function or health of the microbes. In contrast, some studies reported that the SCFA-producing microbiota, such as Akkermansia and Lactobacillus [11], increased in MSA patients; however, the total concentrations of SCFAs were not detected in these studies. In addition, a positive correlation between BMI and propionic acid concentration, and a negative correlation between degree of constipation (Wexner score) and isovaleric acid concentration were identified. MSA patients with autonomic symptoms had lower propionic acid concentration. These findings demonstrated that the levels of plasma SCFAs might be associated with MSA. Previous studies have provided the evidence that SCFAs play an important role in gut-brain axis, and show a variety of neuroprotective effects [28–30], indicating that SCFAs may be a potential treatment to a wide range of neurological disorders. Therefore, the supplementary of acetic acid and propionic acid might be the available treatment modalities for MSA in the future.
MSA patients share many similar symptoms with PD patients, such as progressive gait imbalance, slurred speech, and cognitive impairment, so misdiagnosis of MSA is common in clinical situations. Particularly MSA-P is confusing with PD, especially at an early stage. Considering the differential plasma SCFA concentrations between MSA patients and PD patients, the microbiota might provide clues for differential diagnosis. Convincing evidence exists that SCFAs produced by the intestinal microbiota are involved in gastrointestinal physiology, immune function, host metabolism, and even in the development and homeostasis of the gut-brain axis [28]. Gut microbiome changes in PD and MSA often parallelly associated gastrointestinal (GI) hyperpermeability and constipation. Interestingly, such GI changes can begin years before gait/motor symptoms, suggesting that specific microbial signatures may yield predictive biomarkers for early PD or MSA diagnosis [31, 32]. Both PD and MSA are classified as synucleinopathies, associated with intestinal microbiota dysbiosis. However, the altered gut microbiota profiles in patients with MSA were not quite consistent with that in patients with PD. The most significant changes within PD highlighted a reduction in the bacterial family Prevotellaceae and in butyrate-producing bacterial genera such as Roseburia and Faecalibacteria and an increase in the genera Akkermansia. For MSA patients, increased Bacteroidetes and Proteobacteria (pro-inflammatory bacteria) and a reduction in butyrate-producing bacteria (anti-inflammatory) were detected [9, 12]. In addition, the relative abundance of Gram-negative LPS-producing bacteria, Rikenellaceae and Porphyromonadaceae, were higher in the feces of MSA patients, while no difference of them was found in PD patients. These bacterial groups produce different LPS strains, which may be related to specific immune activation pathways that may promote disease-specific neuroinflammatory processes [9]. One study reported that two inflammatory biomarkers, DNER and β-NGF, could significantly differentiate MSA patients from PD patients [33]. However, there was no study comparing the intestinal inflammation and permeability of MSA patients with PD patients. Moreover, a reduction in the SCFA-producing bacteria Leucobacter was detected in the blood of patients with MSA [11]. For PD patients, SCFA-producing bacteria were not changed in the blood [34]. Recently, our group found that a set of 25 gene markers could successfully distinguish PD patients from MSA patients and from MSA-P patients [16]. Compared with the identified gut microbiota gene markers, the biomarker from the combined concentration of acetic acid and propionic acid could differentiate MSA from PD with similar AUC, sensitivity and specificity; the biomarker established from plasma SCFAs could better distinguish MSA-P from PD with a higher AUC (0.89 vs 0.793), a similar sensitivity (0.80 vs 0.88) and a higher specificity (0.91 vs 0.70). Above all, all these suggested that the combined acetic acid and propionic acid concentration may be a potential diagnostic biomarker of MSA.
However, several limitations need to be considered in our study. First, the sample size in our study was small due to the low morbidity and rapidly progressive process of MSA. Thus, a larger sample size and independent validation cohort is proposed in the future. Additionally, the patients involved in our study were at an advanced stage of disease, and whether the change in SCFAs was the initiating stimulator of MSA pathogenesis remained unclear. Therefore, it is indispensable to investigate SCFAs in de novo MSA and PD patients. Importantly, we studied only plasma SCFAs in this project, and it is necessary to detect the SCFA concentration along with microbiota in the blood and feces simultaneously.
In summary, plasma SCFA levels were decreased in MSA patients and associated with clinical features. In particular, plasma SCFAs with differential concentrations between MSA patients and PD patients might be utilized as novel biomarkers, contributing to clinical diagnosis. Major challenges remain in MSA pathogenesis interpretation, precise diagnosis, and efficient treatment. Further understanding of the roles of gut microbiota and metabolites in MSA may shed light on its pathogenesis.
Footnotes
ACKNOWLEDGMENTS
This work was supported by grants from the National Natural Science Foundation of China (Grant Nos. 81870998, 81901283, and 81801254), the Key Field Research and Development Program of Guangdong Province (Grant No. 2018B030337001), and the Clinical Research Plan of SHDC (Grant No. SHDC2020CR3012A).
CONFLICT OF INTEREST
The authors have no conflict of interest to report.