
Abstract
A sudden increase in electrical activity in the brain is a defining feature of one of the severe neurological diseases known as epilepsy. This abnormality appears as a seizure, and identifying seizures is an important field of research. An essential technique for examining the features of neurological issues brain activities, and epileptic seizures is electroencephalography (EEG). In EEG data, analyzing epileptic irregularities visually requires a lot of time from neurologists. For accurate detection of epileptic seizures, numerous scientific techniques have been used with EEG data, and most of these techniques have produced promising results. For EEG signal classification with a high classification accuracy rate, the present research proposes an enhanced machine learning-based epileptic seizure detection model. The present research provides a hybrid Improved Adaptive Neuro-Fuzzy Inference System (IANFIS)-Light Gradient Boosting Machine (LightGBM) technique for automatically detecting and diagnosing epilepsy from EEG data. The experimental findings were supported by EEG records made available by the German University of Bonn and scalp EEG data acquired at Children’s Hospital Boston. The suggested IANFIS-LightGBM, according to the results, offers the most significant classification accuracy ratings in both situations.
Keywords
Introduction
A neurological condition called epilepsy can result in unprovoked seizures [1]. More than 50 million people have experienced epileptic attacks, according to data provided by the World Health Organization (WHO) [2]. Patients with epilepsy frequently experience unconsciousness and violent convulsions that put them at risk for severe physical harm [3]. The need for early diagnosis of this condition is a severe health issue [4]. Possibilities for treatment and the epileptic patient’s quality of life can both be improved by the ability to detect the occurrence of seizures [5]. Mediation systems can be implemented for individuals for whom surgery or medication has no effect because of the capacity to identify seizures [6]. The proper medicine may help 70% of patients with epilepsy regulate their condition [7]. Pre-surgical exams are frequently conducted to determine the exact location of the problem [8]. This is achieved by combining physical examination, neuroimaging, electroencephalogram (EEG), history taking, and other approaches [9]. These investigations are insufficient in some instances. Hence it is typically advised to use intracranial EEG to concentrate on the areas of the brain that are prone to epilepsy (ictal activity) [10]. When using intracranial electrodes to detect enough seizures, a more extended hospital stay isfrequently required [11]. The patient is advised to have surgery if an epileptic episode is found [12]. About 80% of epileptic patients’ treatments in clear-cut lesion scenarios detected on neuroimaging involved surgery [13].
EEG signals provide information about the brain’s electrical activity and are a standard test for detecting epilepsy [14]. The brain condition is described with the help of EEG signals, which can also be used to study brain function [15]. Doctors can detect abnormalities in epileptiform seizures using the EEG signals, including seizure signals, inter-ictal (between seizures), and ictal (during a seizure) abnormalities [16]. Some brain activities can occasionally be interrupted by excessive electrical discharge [17]. For these reasons, these patients must have prompt, accurate, and early epilepsy diagnoses. It permits a decrease in the danger of complications from seizure-related issues. The evaluation of the physiological state of a human being’s brain during an epileptic seizure using EEG signals enables the identification of anomalies in neurons [18]. Traditionally, the visual interpretation of professionals (doctors) has been used to identify EEG signals. However, this process takes time and might occasionally result in mistakes people make [19]. As a result, an important issue arises regarding the automation of identifying an epileptic seizure using EEG readings. To detect seizures, the primary issue is distinctive feature extraction from EEG signals [20]. The recognition of EEG signal features establishes the designed model’s correctness.
The present research offers a detection method to detect epileptic seizures utilizing IANFIS and LightGBM named IANFIS – LightGBM to address these issues and improve classification performance. Finding epilepsy-related seizures is the primary goal of this research. Intercession systems can be carried out for patients for whom surgery or medication has had no effect, thanks to the seizure detection capability. The systems mentioned above’ complex structures mainly consist of phases for feature extraction and categorization. These two techniques are integrated into the body of the research to distinguish seizures from EEG signals.
This paper proposes an improved hybrid machine learning approach, IANFIS-LightGBM, for epilepsy disease detection. To identify and diagnose epilepsy disease, the features from decomposed coefficients kurtosis (K), skewness (S), complexity feature (CF), mobility feature (MF), activity feature (AF), entropy (E), weight feature (W), and bias (B) are extracted from EEG signals and classified as either non-focal or focal signals. Using the IANFIS classifier to detect focal signals and the LightGBM classification technique to determine their severity levels, respectively. The LightGBM hyperparameters are optimized using the Bayesian Hyper-Parameter Optimization (BHO) algorithm.
The following are the primary contributions of this research, Using the IANFIS classifier to detect focal signals and the LightGBM classification technique to determine their severity levels, respectively. First, noise-causing signals are removed from the signals while maintaining the signals within the required frequency range using the median filter. To increase the classification accuracy after pre-processing, signal splitting is carried out. The time series of EEG signals is divided into small segments called epochs. Each raw EEG signal was decomposed into several sub-bands by employing the continuous wavelet transform (CWT) method. Then the features from decomposed coefficients as kurtosis (K), skewness (S), complexity feature (CF), mobility feature (MF), activity feature (AF), entropy (E), weight feature (W), and bias (B), are extracted for EEG signal’s classification. For epileptic condition detection and diagnosis, the IANFIS is used to classify EEG signals into either non-focal or focal signals. After classification, LightGBM is used to diagnose the focal signal’s severity levels. For optimizing the LightGBM hyper-parameters, Bayesian Hyper-Parameter Optimization (BHO) is used.
The remaining portions of this research are organized as follows: Section 2 provides examples of relevant earlier research used to identify epileptic EEG patterns. A thorough explanation of the proposed enhanced hybrid machine learning is examined in Section 3. The simulation results are shown in Section 4. The research concludes in Section 5.
Related prior works
For the detection of epileptic seizures, the previous approaches are covered in this section. The goal is to critically evaluate the proposed works and identify their drawbacks. For EEG signal classification, the valuable features are extracted using various signal processing techniques. However, differentiating between non-seizure and seizure EEG records is challenging due to the complex structure of EEGsignals.
Slimen et al. [21] provide a reliable automatic seizure detection system for establishing an accessible identification of these disorders. There are three steps in the proposed process: (i) The multi-scale principal component analysis (MSPCA) and Savitzky-Golay filter are used for removing the noise in EEG data, (ii) For feature extraction, an effective decomposition technique is used, and the non-linearities in the dataset are reduced by using discrete wavelet transform (DWT), and (iii) Machine learning based support vector machine (SVM) is used for assigning the feature vector to the relevant class.
Using EEG, Shen et al. [22] investigated a real-time approach for detecting epileptic seizures. In different sub-frequency bands, features are extracted using the algorithms of eight eigenvalues and DWT. After that, the EEG signal classification is performed by using a support vector machine. Finally, real-time seizure onset detection is detected using the RUSBoosted tree Ensemble method.
Amin et al. [23] present a new CAD system for epileptic seizure signal classification. The epileptic seizure signals from the normal signal are differentiated by using DWT. The proposed CAD approach consists of three phases. In the first phase, DWT decomposes the EEG signals into approximate and detailed coefficients, and non-significant coefficients are discarded by threshold requirements; consequently, there are fewer essential wavelet coefficients. Using arithmetic coding, the second stage computes the compression ratio by converting significant wavelet coefficients to bit streams. The compression feature set is standardized in the last phase, after which machine-learning classifiers distinguish signals with seizure activity from ones without it.
A unique red colobus monkey optimization with kernel extreme learning machine (RCMO-KELM) technique was created by Hamza et al. [24] for epileptic seizure detection and categorization. The actual EEG signals are extracted using the suggested RCMO-KELM technique for their frequency, time, and chaotic domain properties. Furthermore, the pre-processing of the EEG signals uses the min-max normalization approach. Additionally, the EEG data is used combined with the KELM model to identify and categorize epileptic seizures. Additionally, the RCMO approach was used to fine-tune the KELM technique’s parameters so that the overall detection results could be significantly improved.
For epilepsy identification, a novel classification method was developed by Mishra et al. [25] using a Moth Flame Optimization-based Extreme Learning Machine (DM-ELM) and DWT to categorize EEG brain signals. A popular technique for machine learning is known as neural networks (NN) based ELM. To attain the maximum accuracy and lowest error rate, the model is extensively trained.
For seizure detection, an effective classification method in EEG signals was developed by Bhandari et al. [26]. Signal pre-processing is the initial stage of the proposed approach. The signal decomposition is also done using a combined DWT and Empirical Mode Decomposition (EMD) structure. The Jaya-Cat Swarm Optimization (J-CSO) algorithm is used for weight optimization; it is a hybrid meta-heuristic algorithm.
With the help of CHB-MIT data, the alternative DL models for patient-specific seizure detection were developed by Poorani et al. [27], and they outperformed previous DL models in terms of performance. A one-dimensional CNN is the focus of the first model, and the second model concentrates on a hybrid CNN-LSTM architecture. The second hybrid model offers superior results compared to the one-dimensional CNN model. In the second hybrid model, the LSTM model recognizes epileptic seizures, while the CNN model extracts valuable characteristics.
Using the adaptive short-time Fourier transform-based synchrosqueezing transform (adaptive FSST) and sparse common spatial pattern (sCSP), Amiri et al. [28] introduced a unique approach for automated seizure diagnosis from the EEG data to distinguish between seizure states and choose the best channels, the sCSP is used. The chosen channels are imported into adaptive FSST to decrease noise and interference. For the periodic component of seizures, the EEG signal decomposition technique is adapted; it is possible to improve seizure detection.
Hybrid Cross Layer Attention Convolutional Bidirectional Gated Recurrent Unit (HCLA_CBiGRU), a deep learning model proposed by Natu et al. [29], In EEG signals, the spatial and temporal features are identified by integrating RNN and CNN. Combining publically accessible datasets and using a preprocessing procedure to reduce noise and artifacts resulted in the creation of a combinational EEG dataset. The learned features were analyzed using visualization techniques, demonstrating the model’s capacity to capture distinctive seizure-relatedtraits.
An automated seizure detection technique is presented by Zhang et al. [30]. The bidirectional gated recurrent unit (Bi-GRU) neural network is used for detection. First, wavelet transformations are used to filter and pre-process EEG records. Following that, a calculation of and input into the Bi-GRU network of the relative intensities of broadcasts in several specific frequency bands. To determine whether the tested EEG is associated with a seizure or not, The Bi-GRU network’s outputs are then processed further.
Unsupervised learning (UL) and supervised learning (SL) modules were combined to create a hybrid system by Guo et al. [31], where data labeling effort may be significantly reduced by the UL module. Amplitude-integrated EEG (aEEG) extraction, isolation forest-based anomaly identification, adaptive segmentation, and silhouette coefficient-based anomaly detection assessment are all combined by UL for preliminary seizure screening. The indeterminate subjects (possible seizure candidates) and determinate subjects (seizure-free segments and seizure segments) are identified by the UL module. After that, the SL uses an Easy Ensemble method to conduct more reliable seizure detection for uncertain cases. As a class-imbalance learning technique, EasyEnsemble may help reduce the seizure-free phase’s generalization error.
As listed in Table 1, several methods have been used to identify seizures. The existing techniques produce better results, but it has several challenges, as described in the table. To overcome these challenges, we propose a reliable and effective machine learning-based model for detecting and classifying epileptic seizures. The training speed is high compared to previous techniques. Our machine learning based approach helps to reduce memory consumption during training. The proposed approach provides feature importance scores that can help interpret model predictions and understand which features are most influential. Deep learning models are often criticized for their lack of interpretability. LightGBM models are typically much smaller, making them easier to deploy in resource-constrained environments. IANFIS has built-in regularization techniques and is generally less prone to over-fitting than deep learning models. For epileptic seizure detection, our proposed machine learning based approach is mainly preferred for tasks with limited data, speed requirements, and ease of use. In this research, we have used the BHO hyperparameter optimization approach for optimizing the parameters of the LightGBM model; optimizing the hyperparameter can lead to more efficient use of computational resources, such as CPU, GPU, memory, and storage. This can result in faster model training and lower resource costs; this can lead to significantly improved model performance regarding F1-score, recall, precision, accuracy, or other relevant performance metrics; by fine-tuning hyper-parameters, models are less likely to overfit or under-fit the training data. The main novelty of the proposed research is we have used improved machine learning techniques for epileptic Seizure detection and severity diagnosis. For epileptic seizure classification, we have employed an improved ANFIS classifier. The ANFIS classifier is improved by using the BSO algorithm.
Characteristics and difficulties of previous seizure detection models
Characteristics and difficulties of previous seizure detection models
An enhanced system is recommended for automatically detecting an epileptic patient’s seizure status in this research, and input EEG data are divided into interictal and ictal groups. The structure of the proposed approach is given in Fig. 1. There are six main steps: (1) EEG signal records are compiled into a dataset called an EEG dataset; (2) removing artifacts from the input dataset through pre-processing; (3) Long EEG recordings are divided into short epochs using signal splitting; (4) Decomposed signal sub-bands are used in feature extraction to extract spectral and temporal data; (5) From the extracted feature vector, classifier construction creates a classifier using conventional machine learning algorithms; (6) An improved machine learning approach is used for diagnosing the severity of non-focal EEG signals and (6) classifier evaluation, where precision, specificity, sensitivity, and accuracy are used to evaluate the developed classification models. The following subsections give a comprehensive explanation of each phase.
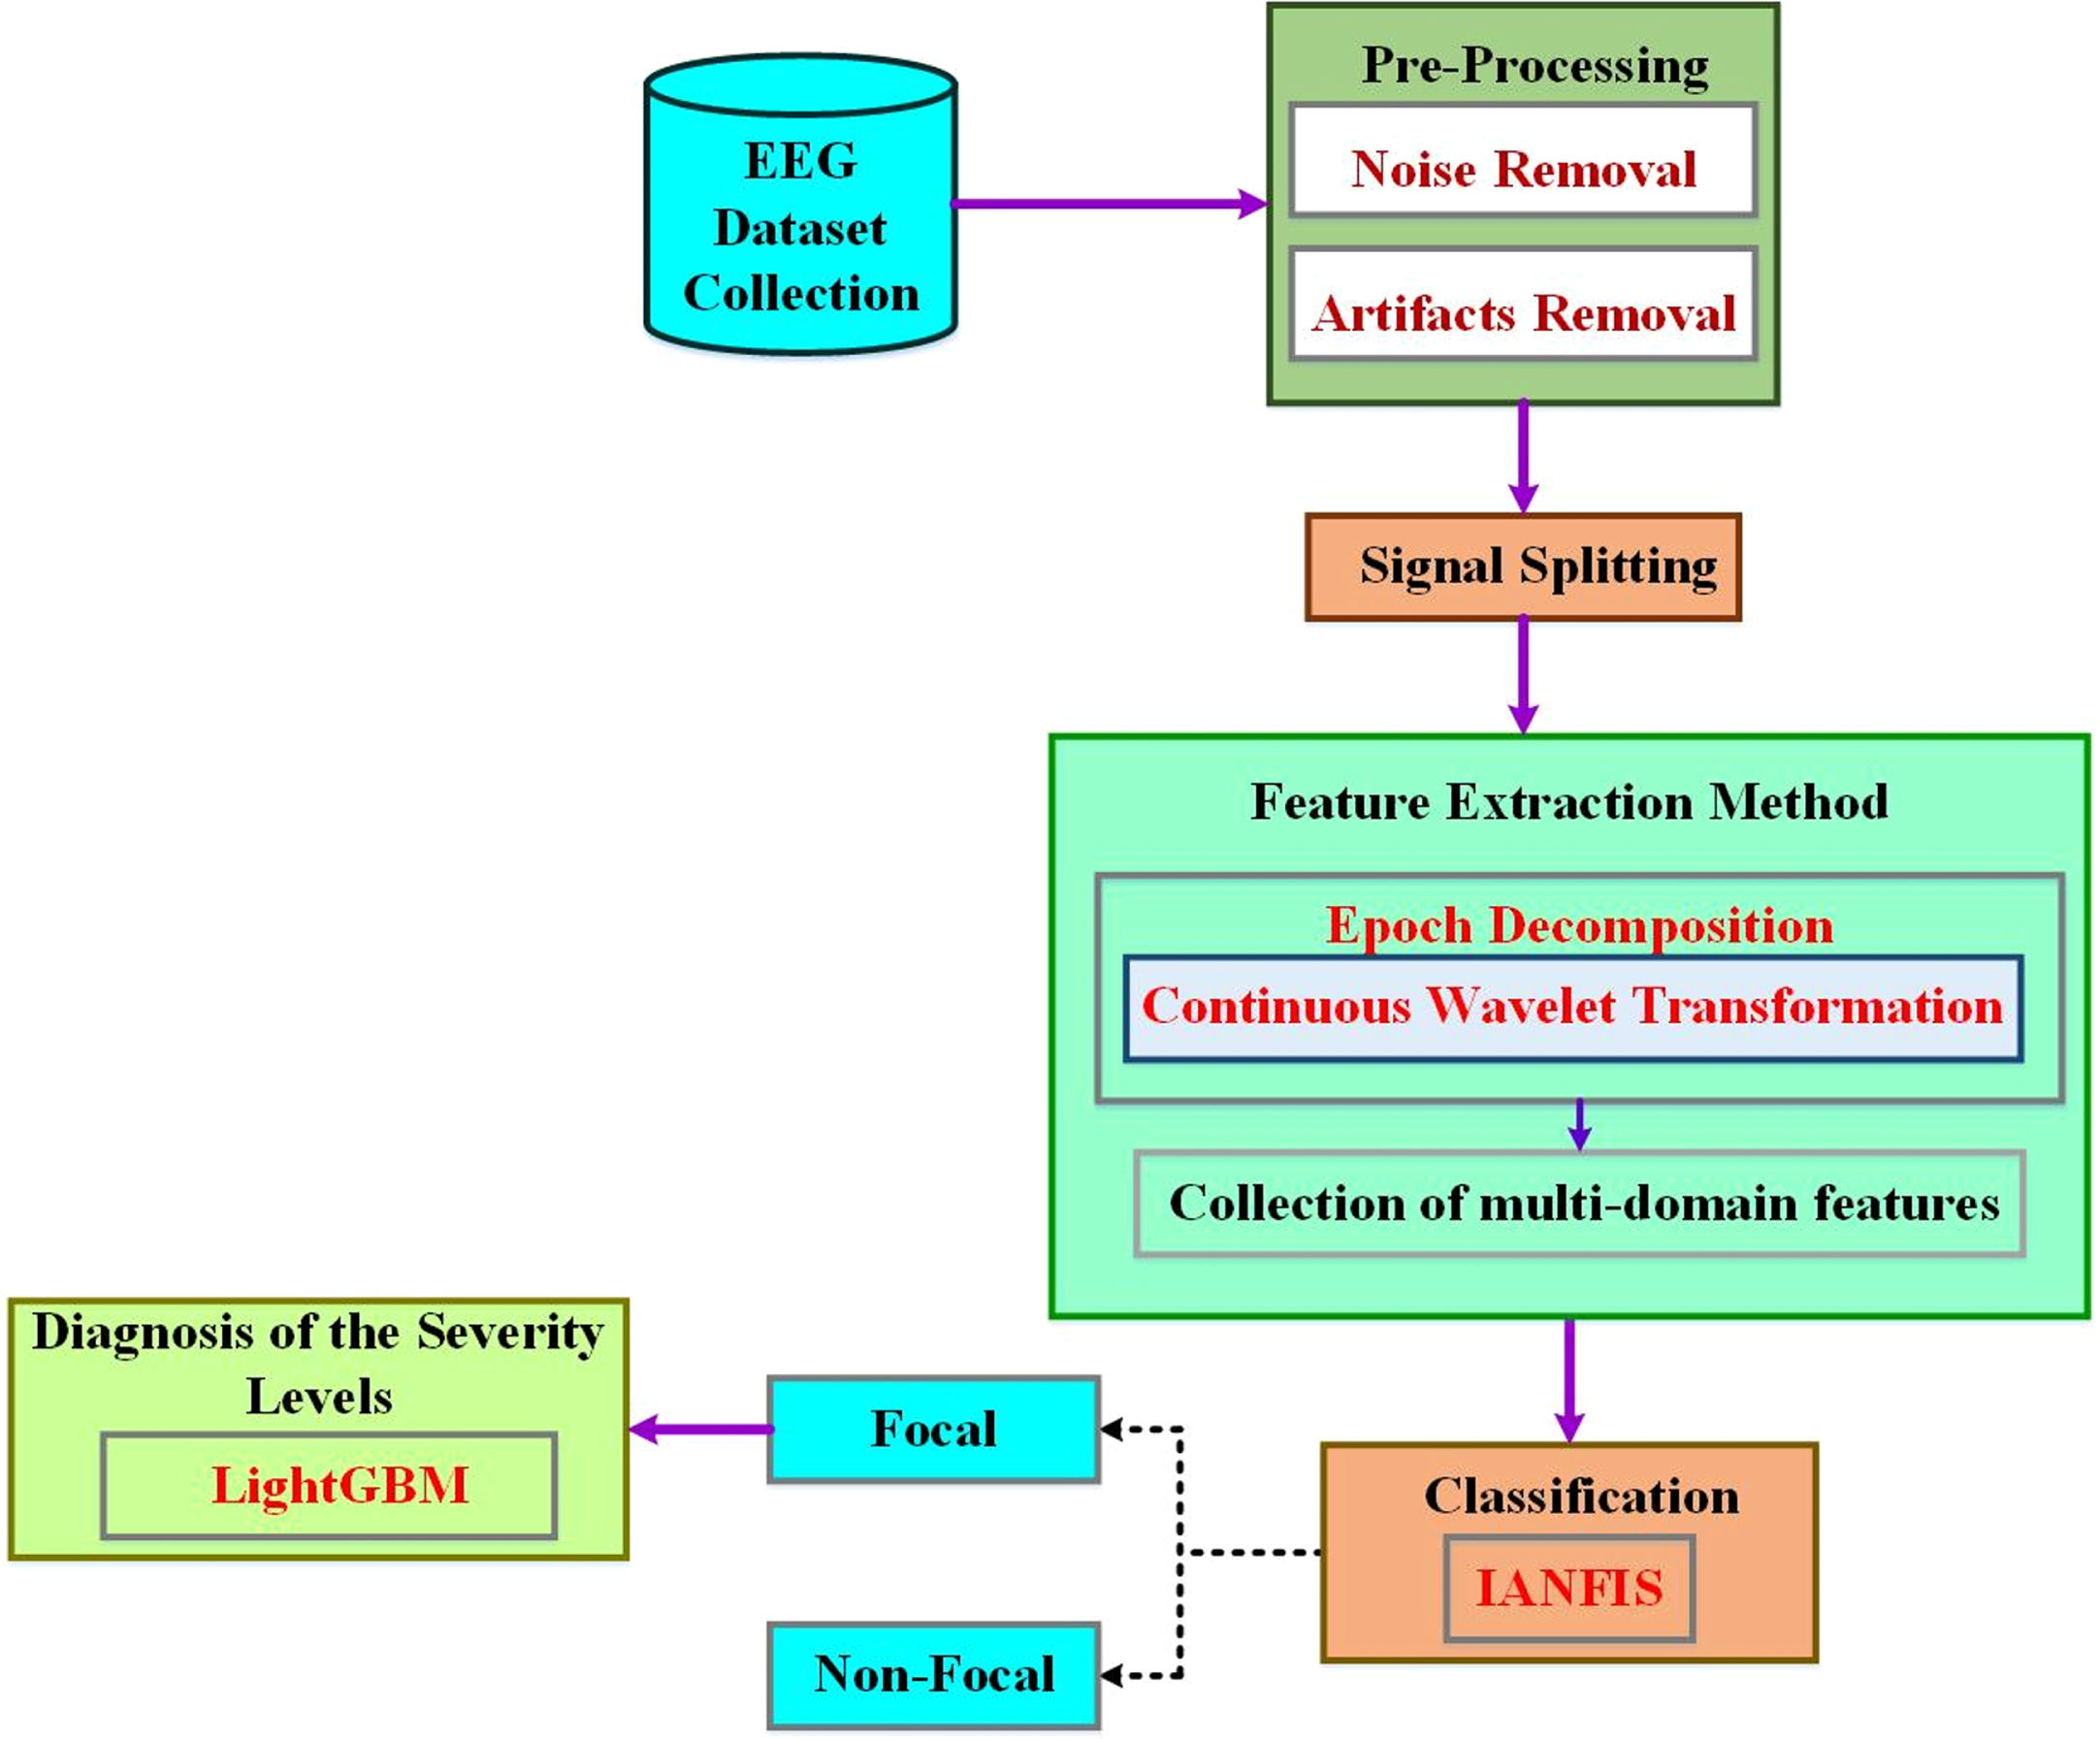
Schematic diagram of the proposed enhanced machine learning approach.
Due to the complexity of EEG data, it is challenging to detect epileptic seizures precisely. Using EEG signals, this research developed a detection method for effective epileptic seizure that integrates IANFIS and LightGBM for epileptic seizure detection. First, each raw EEG signal was decomposed into several sub-bands using the CWT approach. Then, a collection of multi-domain features was retrieved from both the raw signals and the decomposed components. Afterward, these features are chosen based on the extracted attributes’ importance. The seizure-free and seizure-related EEG signals are discriminated by using IANFIS in the proposed classification approach. The BSO algorithm is used to improve the performance of the ANFIS classifier. The focused signal’s severity levels are identified using the LightGBM classification strategy, and the hyper-parameters of the LightGBM classifier are optimized using Bayesian hyper-parameter optimization. This is the first time IANFIS and LightGBM have been combined to detect epileptic seizures. The extensive experimental results demonstrate that (1) The IANFIS-LightGBM model can significantly improve the epileptic seizure detection performance in EEG signals than the existing classification approaches (2) By decomposing raw EEG signals into smaller components, it is possible to extract characteristics to represent raw EEG signals more effectively and (3) A multi-domain feature’s value to classification performance varies depending on the feature, and many different domains contribute the most significant features.
EEG recordings of multi-channel and single-channel are examined as forms of EEG signals in the first step. The Bonn and CHB-MIT datasets, two benchmark datasets, are used. In contrast to the Bonn dataset, the long ictal and interictal EEG recordings are present in the CHB-MIT dataset, which includes interictal, ictal, and normal EEGsignals.
Bonn dataset
The freely accessible Bonn dataset was produced as a reference by the University of Bonn’s German epilepsy department. Five single-channel EEG signal subsets are included in this dataset: A, B, C, D, and E. Normal EEG signals are present in the A and B subsets, interictal EEG recordings are present in the C and D subsets, and ictal EEG recordings are present in the ictal EEG recordings gathered while the patient was having seizures. The sample rate for these recordings is 173.61 Hz. One subset of this dataset has 100 signals with a duration of 23.6 seconds apiece. The first column displays the names of the EEG subsets, the Health State indicates if the patient is having seizures, and the Electrode Placement shows on the scalp are the EEG monitoring electrodes. The EEG Recording provides the duration of the EEG signals in seconds.
The Bonn EEG dataset consists of EEG recordings from five patients with epilepsy. Each patient’s EEG data is divided into an “interictal” set and a “preictal” set. The interictal set contains EEG recordings captured during non-seizure (baseline) activity, while the preictal set contains EEG recordings leading up to a seizure event.
Each set is divided into five segments, resulting in ten segments per patient (five interictal and five preictal). Therefore, in the Bonn EEG dataset, we have 50 segments (10 segments for each of the 5 patients).
CHB-MIT dataset
Benchmarks for EEG data are available openly in the CHB-MIT and Bonn datasets. With various demographics, 24 patients’ EEG records are included in it. This information was gathered using the electrode implantation system of 10–20 and comprises multi-channel scalp EEG recordings. It offers epileptic patients long ictal and interictal recordings for several hours. The dataset’s sampling frequency is 256 Hz. The entire dataset, which consists of five cases, is only partially used for evaluation during this research because the Bonn dataset was only obtained from five patients. The patient’s personal information is displayed via the patient’s age, gender, and ID. For the patient’s total, ictal, and interictal states, Non-seizure (NS) and Seizure (S) EEG represent the total length of EEG recordings in seconds.
The CHB-MIT EEG dataset contains EEG recordings from multiple pediatric patients with epilepsy. The dataset includes recordings from 24 patients with varying numbers of recording sessions.
Each patient’s data may consist of multiple sessions, and each session may contain varying durations of EEG recordings.
The correspondence between each patient and the number of available segments can vary based on the specific recordings and preprocessing. Some patients may have more recordings than others.
The CHB-MIT dataset has no fixed or standardized numbers of segments per patient, as it depends on the duration and number of recording sessions available for each patient. In this research, we set up a 22-electrode placement system known as the 10–20 system for both datasets. In this system, electrodes are placed at specific locations on the scalp, including electrodes located in various head regions, including frontal, temporal, parietal, and occipitalregions.
Pre-processing
The artifacts that degrade the original recordings are eliminated in the second phase, which leaves the gathered EEG signals noise-free. The most common causes of artifacts are body limb movements (ECG), heart muscles contracting (EMG), and eye blinking (EOG). Actual recordings contain these artifacts and background noise caused by electrode movement, which must be removed. The noise-causing signals are eliminated using the proposed methodology’s median filter. In the desired frequency range, the pre-processing process is used for retaining the signals. Within the specified frequency range (0.5–60 Hz), the signal’s frequency components are used, set up to be a passband of the fourth order.
Where the median filter is represented as MF, it is applied to a a (t) signal in the I to J frequency band for producing filtered b (t) i-j EEG signals.
To enable better interpretation, splitting the time series of the EEG signal into small segments is the third step. The present research objectively compares EEG segment sizes for epoch generations to establish the best size, as shown in Algorithm 1. With and without a 50% overlap, segments from 1 to 5 seconds are examined in this analysis. With 50% overlap, EEG epochs of four seconds perform best regarding precision, specificity, sensitivity, and accuracy. As a result, minor EEG epochs are generated using this size in the proposed method. The CHB-MIT and Bonn datasets show examples of EEG segments in Figs. 2 and 3, respectively. In Bonn data subsets, epochs are denoted by C, D, and E in Fig. 2. In the CHB-MIT dataset, EEG segments of seizure and non-seizure are denoted by NS and S in Fig. 3, respectively.
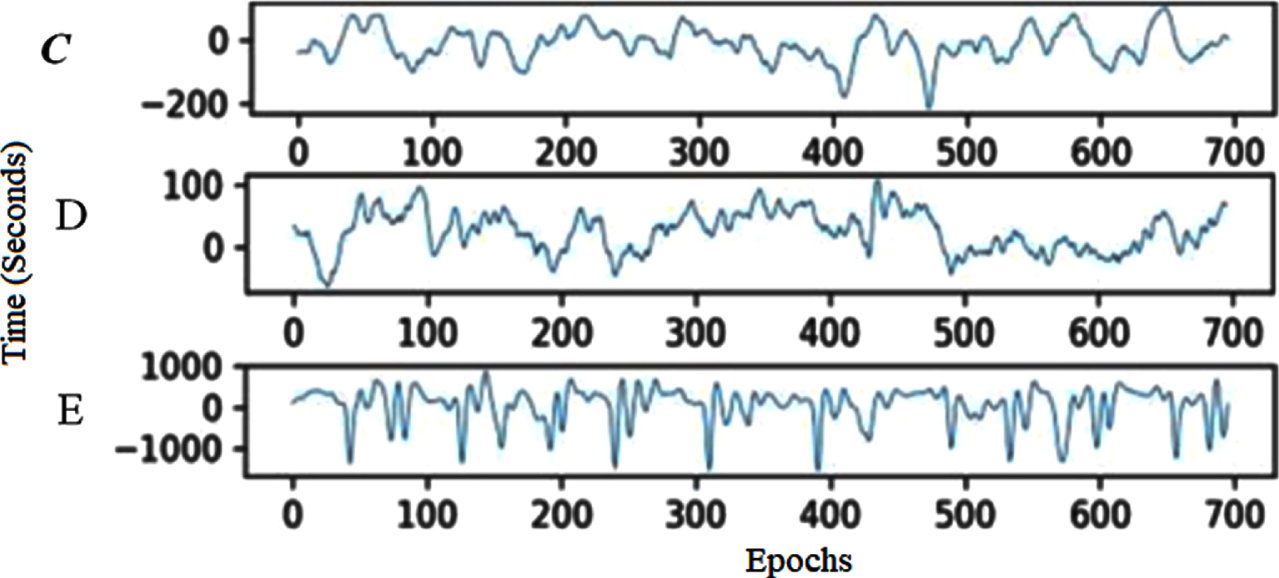
EEG recording segments from the Bonn subset.
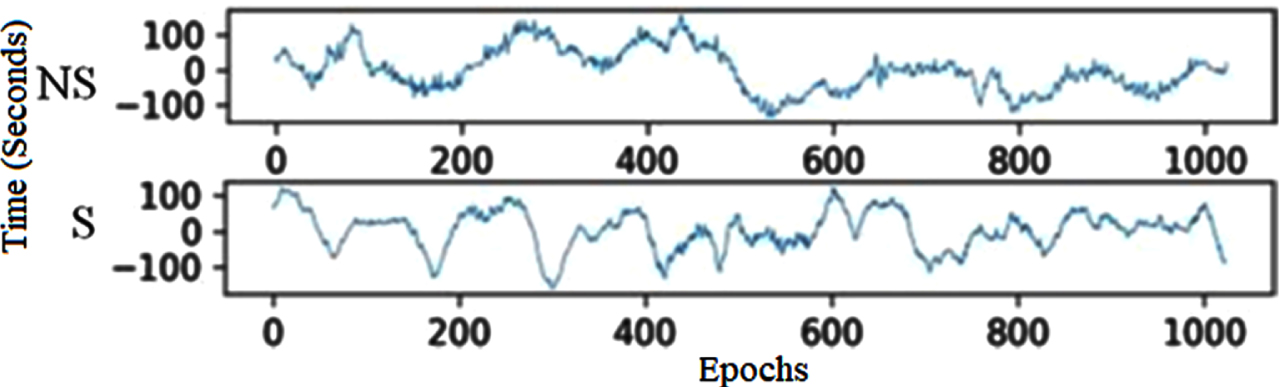
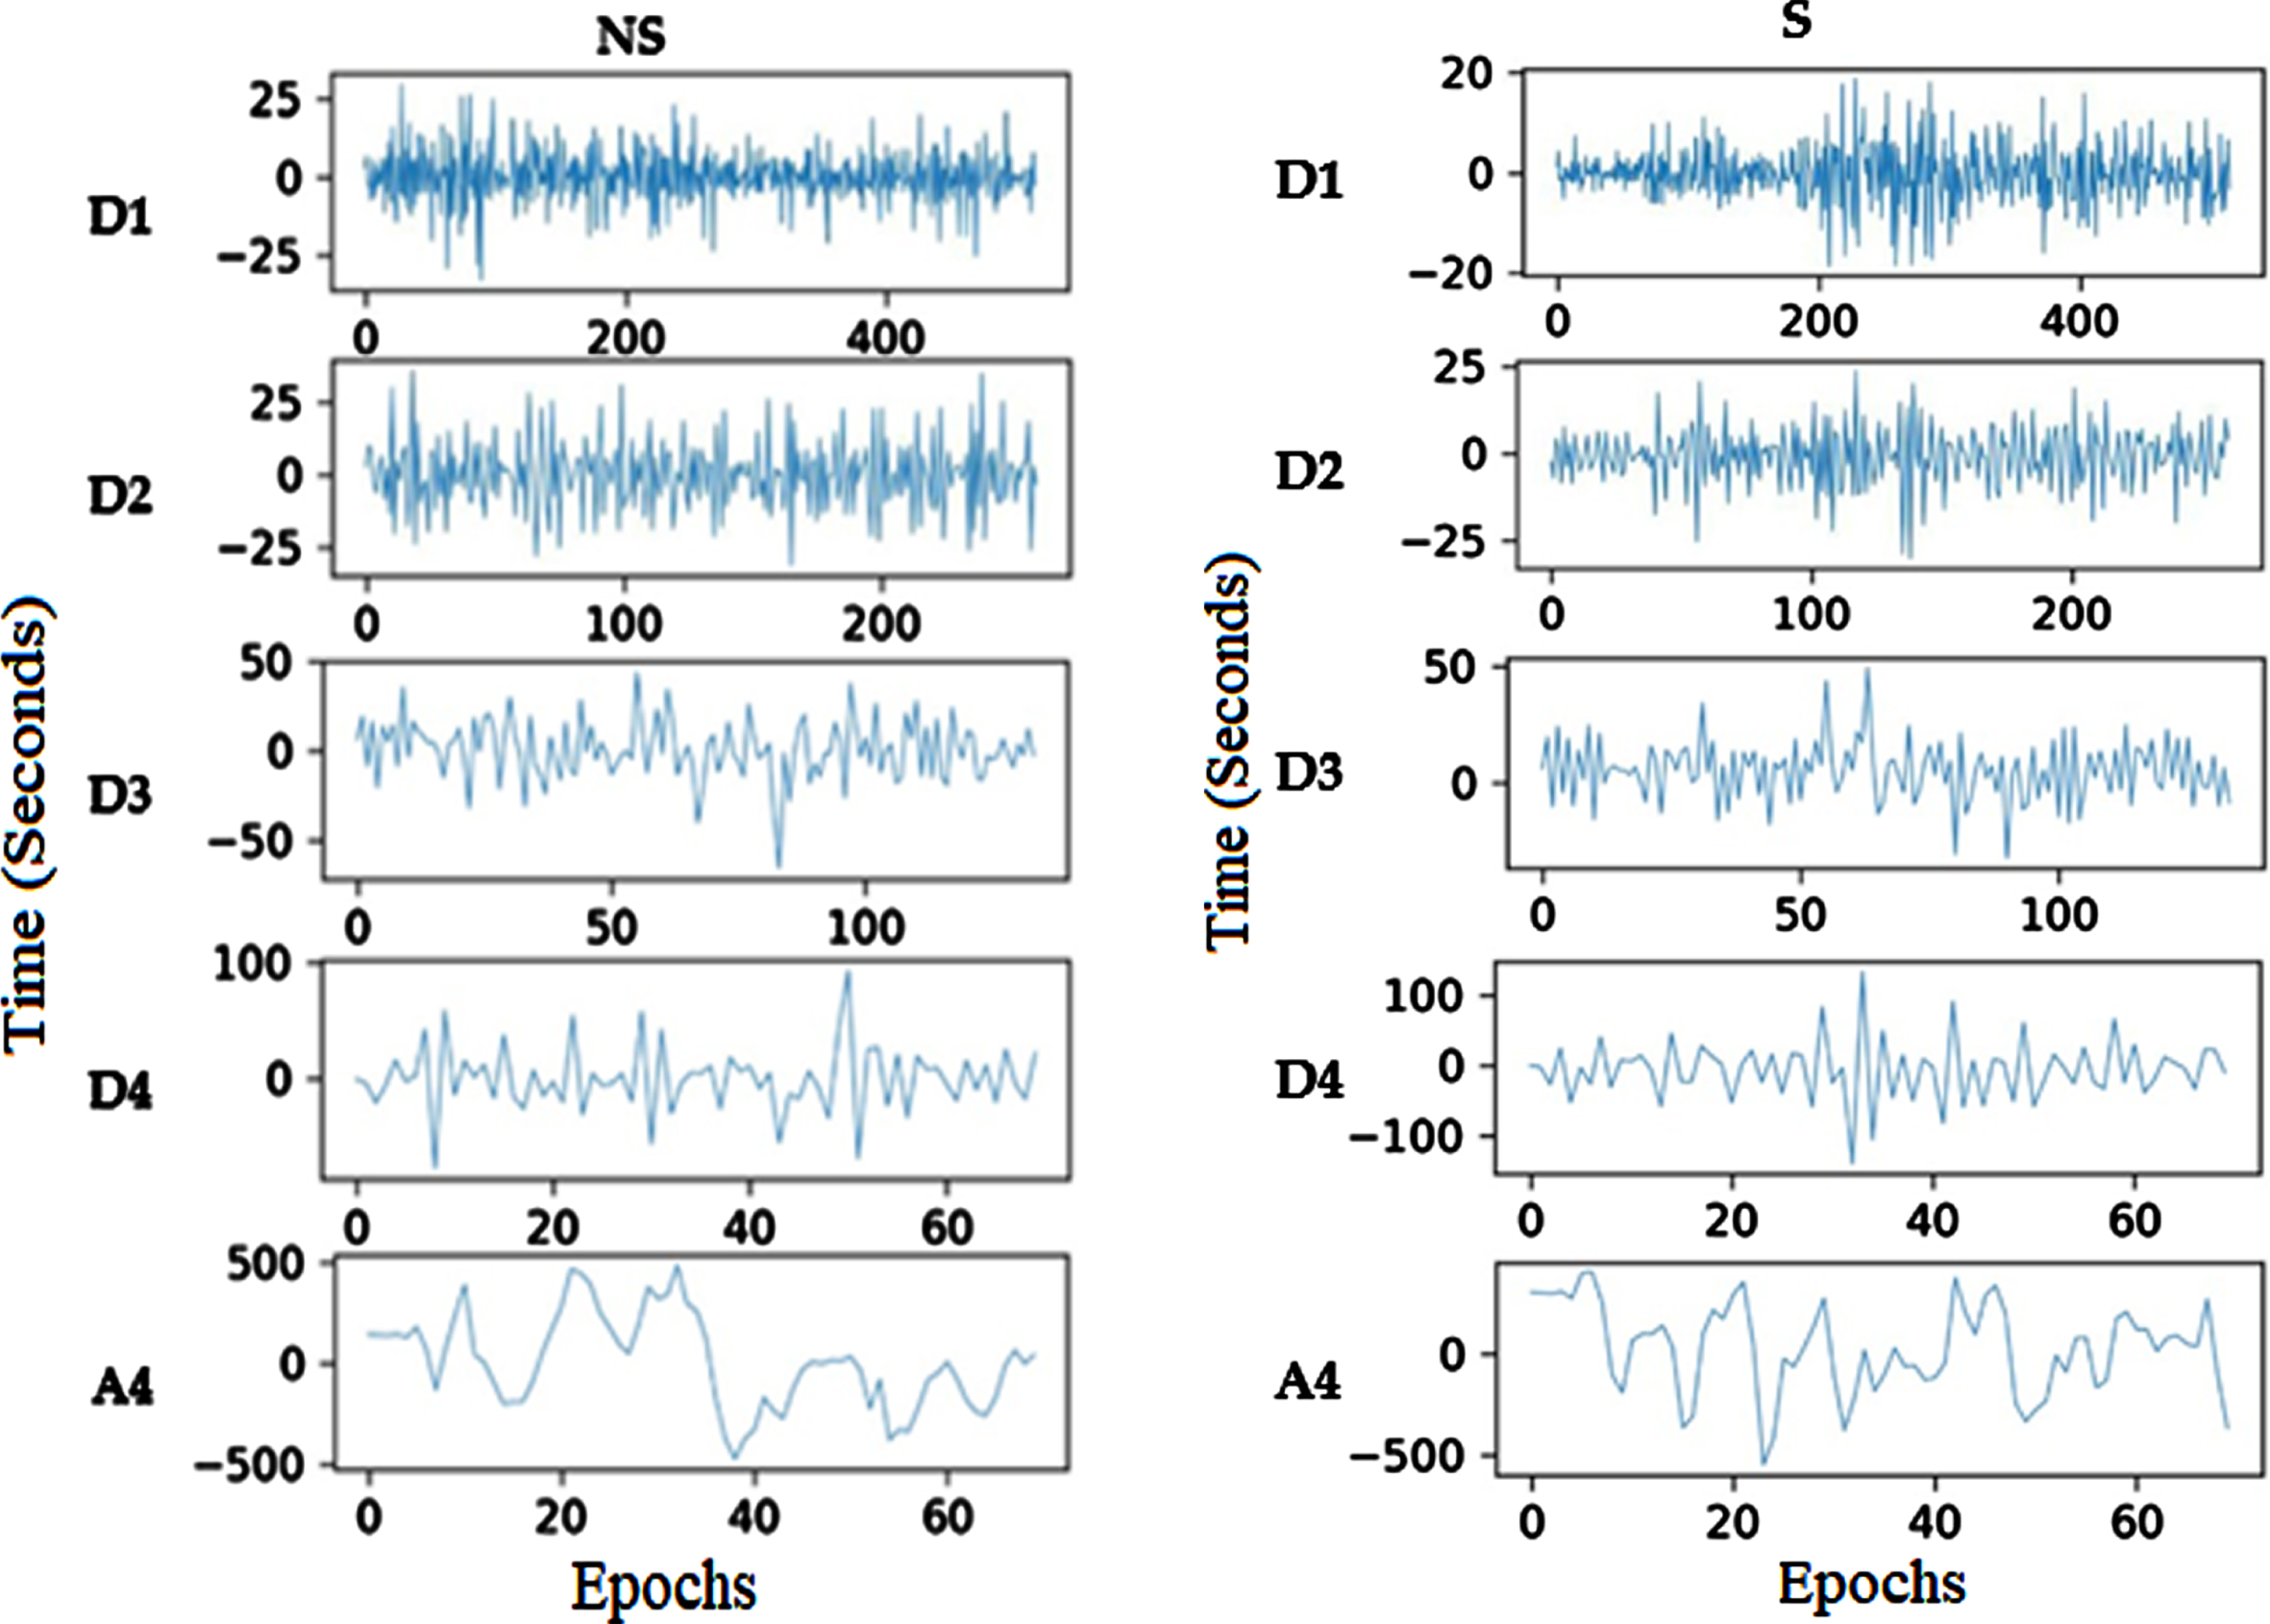
CHB-MIT EEG recordings of non-seizure and seizure segments.
In signal processing, applying the CWT approach for decomposing the EEG epochs into sub-bands. The CWT scaling function is,
Whereas the wavelet’s width can be changed using the scaling factors. In the frequency domain, it is also employed to depict the wavelet function’s position. The translation factor is represented by ′τ′ the functional variable’s location and is controlled using this factor. The signal x(t)’s CWT is,
The EEG signal’s decomposition coefficients create extreme values during the CWT decomposition process, indicating the EEG signal’s peak minimum and maximum. The Bonn and CHB-MIT dataset’s decomposed signal coefficients are shown in Figs. 4 and 5, respectively.
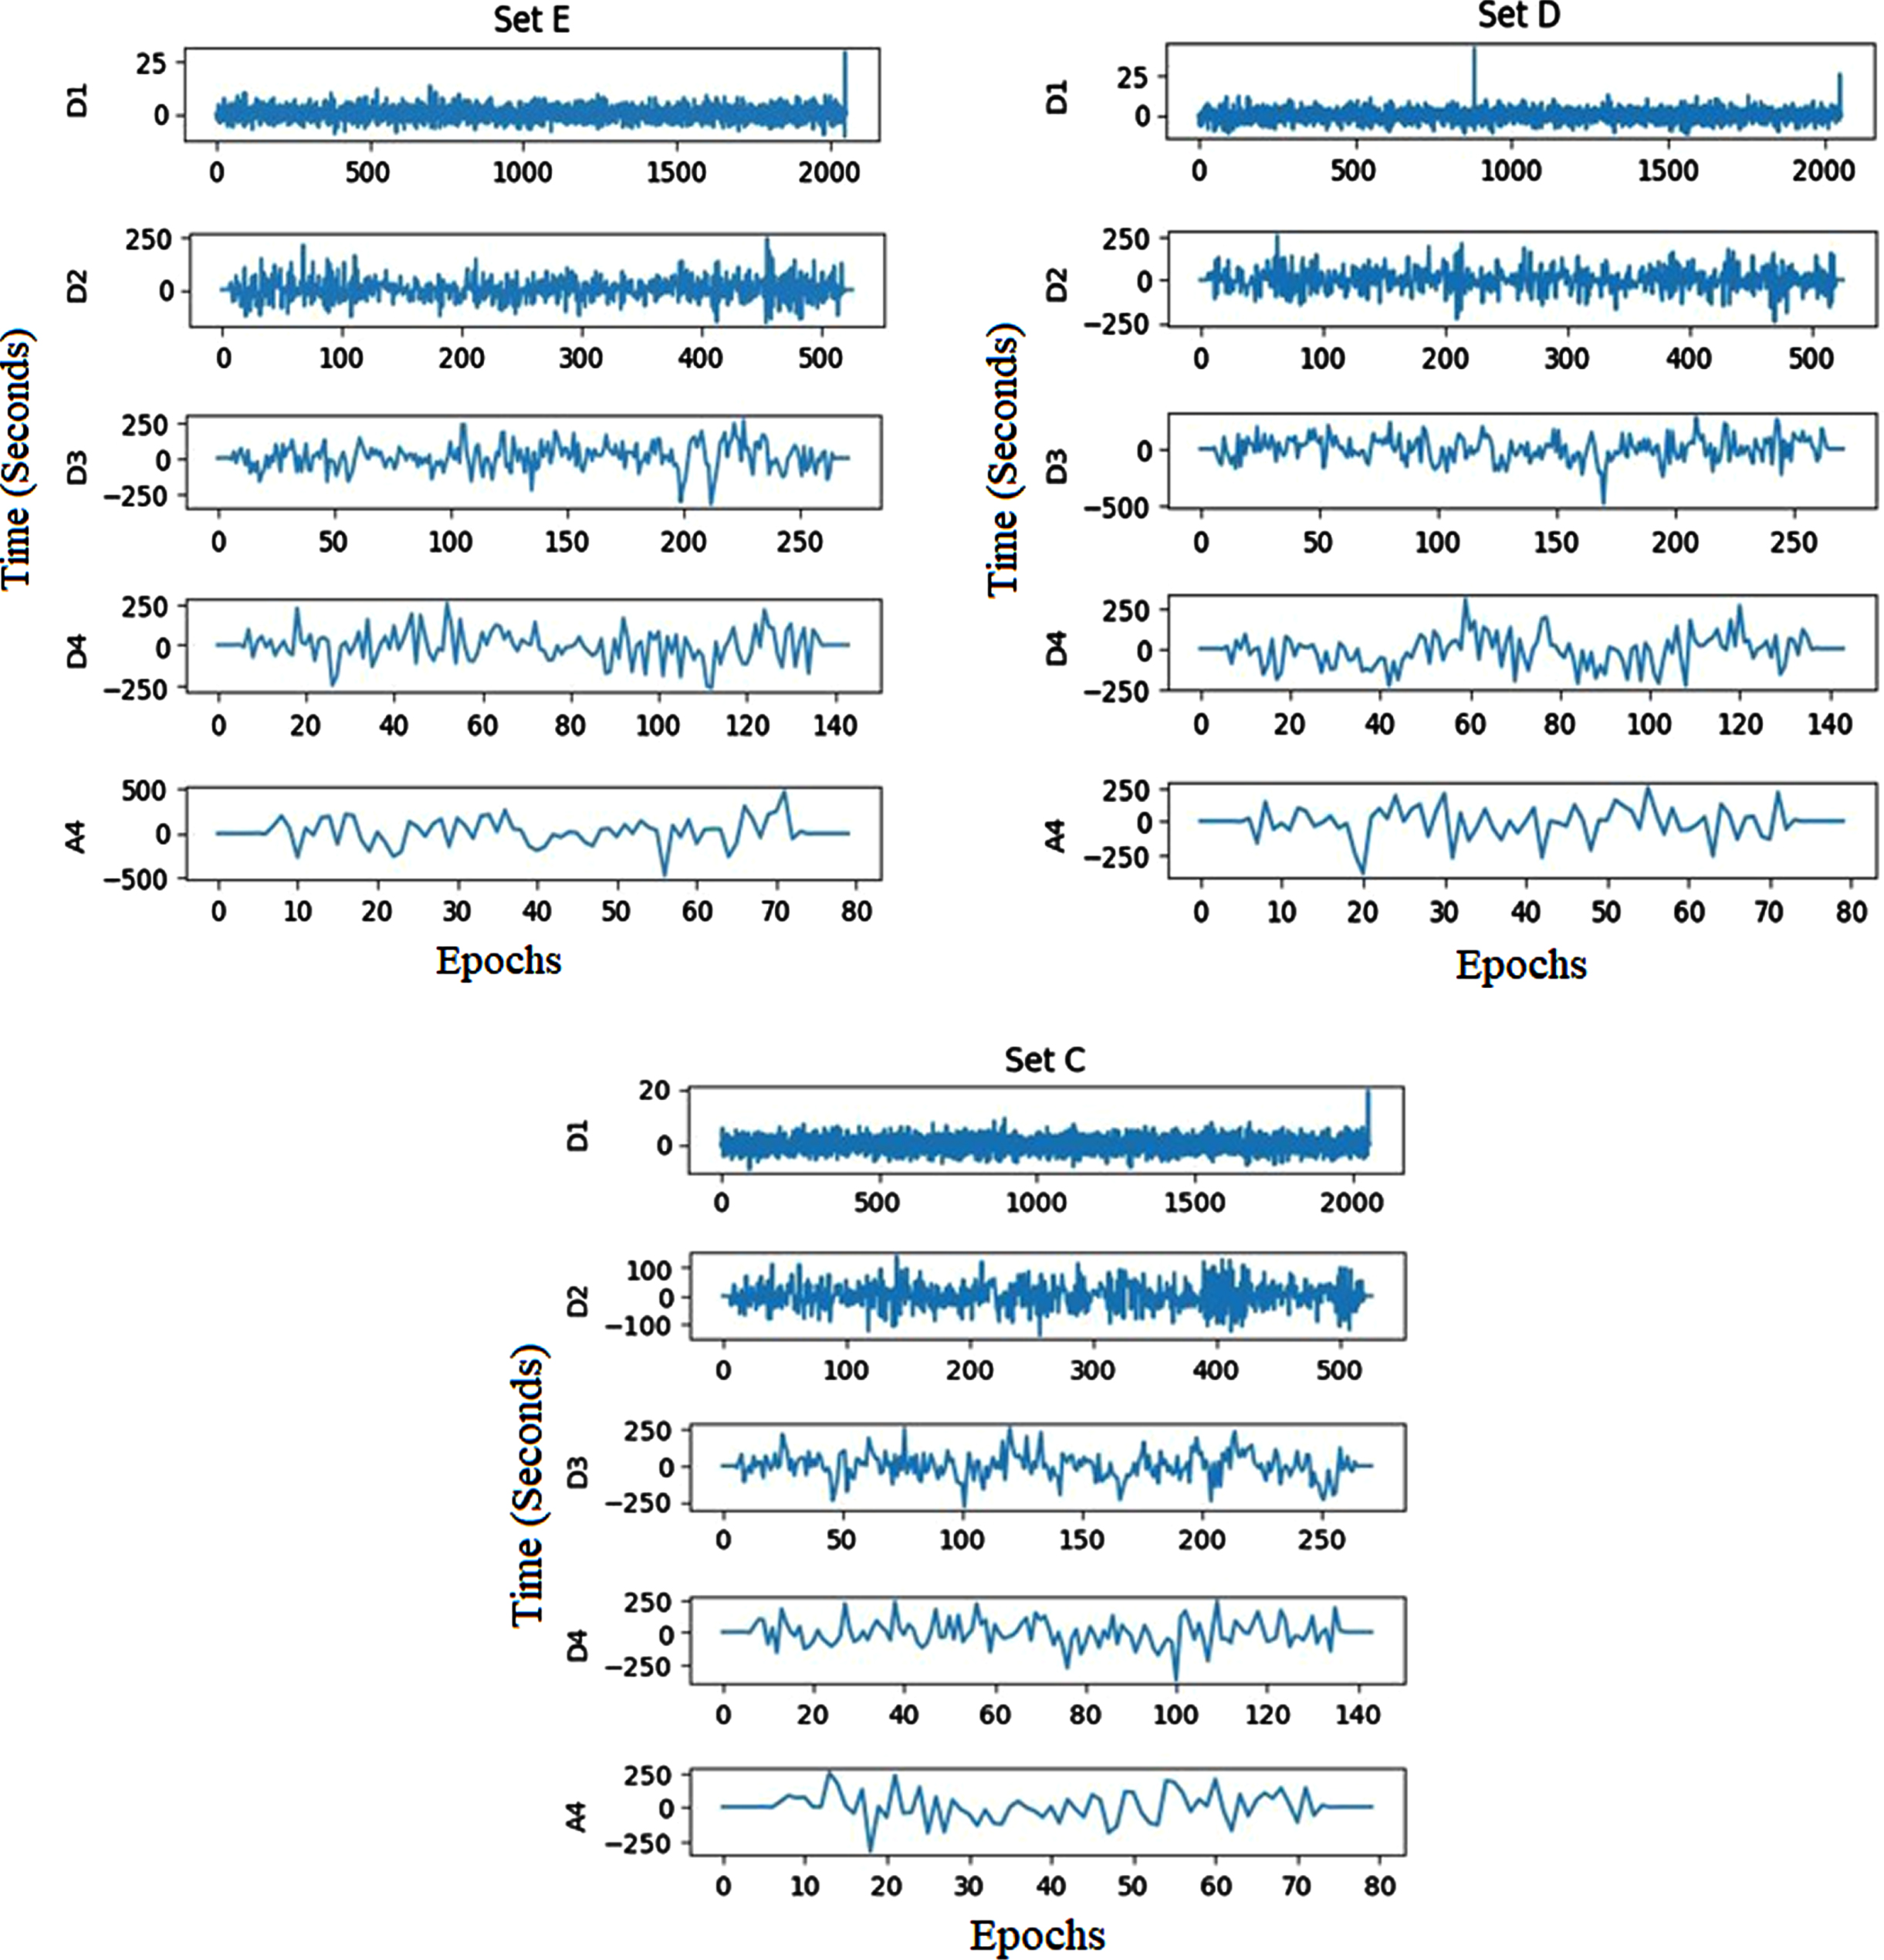
Bonn dataset’s decomposed sub-bands.
CHB-MIT recordings’ decomposed sub-bands.
To identify and diagnose epilepsy disease, the features from decomposed coefficients kurtosis (K), skewness (S), complexity feature (CF), mobility feature (MF), activity feature (AF), entropy (E), weight feature (W), and bias (B) are extracted from EEG signals and classified as either non-focal or focal signals.
Bias (B)
The following equation is used for extracting the real differentiation over the signal value and its predicted value.,
The signal value is represented as x
i
for a separate time slot, and the predicted value is
In the EEG signal’s ROI region, depending on the weight, this characteristic distinguishes between the non-focal and focal EEG signals to be determined. Utilizing the bias value of the signal, the weight feature may be retrieved and is represented as,
The following equation gives the information’s statistical measurement contained in the ROI region of the EEG signal.
Whereas ROI P i is a metric for expressing the percentage of each signal point.
EEG signals’ activity characteristic allows for the measurement of their level of activity,
In non-focal EEG signals, the activity feature’s value is low. In focal EEG signals, the activity feature’s value is high.
The mobility feature of the EEG signal is used to extract the abrupt changes.
For a focal EEG signal, the mobility feature’s value is high. For non-focal EEG signals, the mobility feature’s value is low.
Comparing the patterns of the two EEG signals, the focal EEG signal is more complex,
For EEG signal, skewness describes the third-order statistical property
For EEG signal, kurtosis describes the fourth-order statistical feature, and it can be expressed as,
The traditional existing classification techniques have a low classification rate and are not suited for further severity diagnosis. This paper uses an improved IANFIS classification strategy to distinguish between the non-focal and focal EEG signals. The ANFIS classifier is improved using an effective BSO algorithm.
Standard ANFIS:
Many alternative models, including statistical models, decision trees, SVMs and their modifications, ANNs, fuzzy-based models, and ensemble learning, have been utilized to create classification algorithms in recent years. ANFIS, a method first presented in 1993, is the outcome of integrating fuzzy logic and neural networks. Due to the fact that fuzzy logic closely resembles human reasoning, it offers greater advantages over neural networks. The network in ANFIS can have data inputs and labels added to it, similar to ANN. From a dataset, the membership function parameters in ANFIS serve as a description of the system behavior. The settings of the system are adjusted using a predetermined error condition. Figure 5 shows the structure of the ANFIS classifier system. The ANFIS method’s structure and specifics are covered in the paragraphs that follow.
ANFIS Architecture
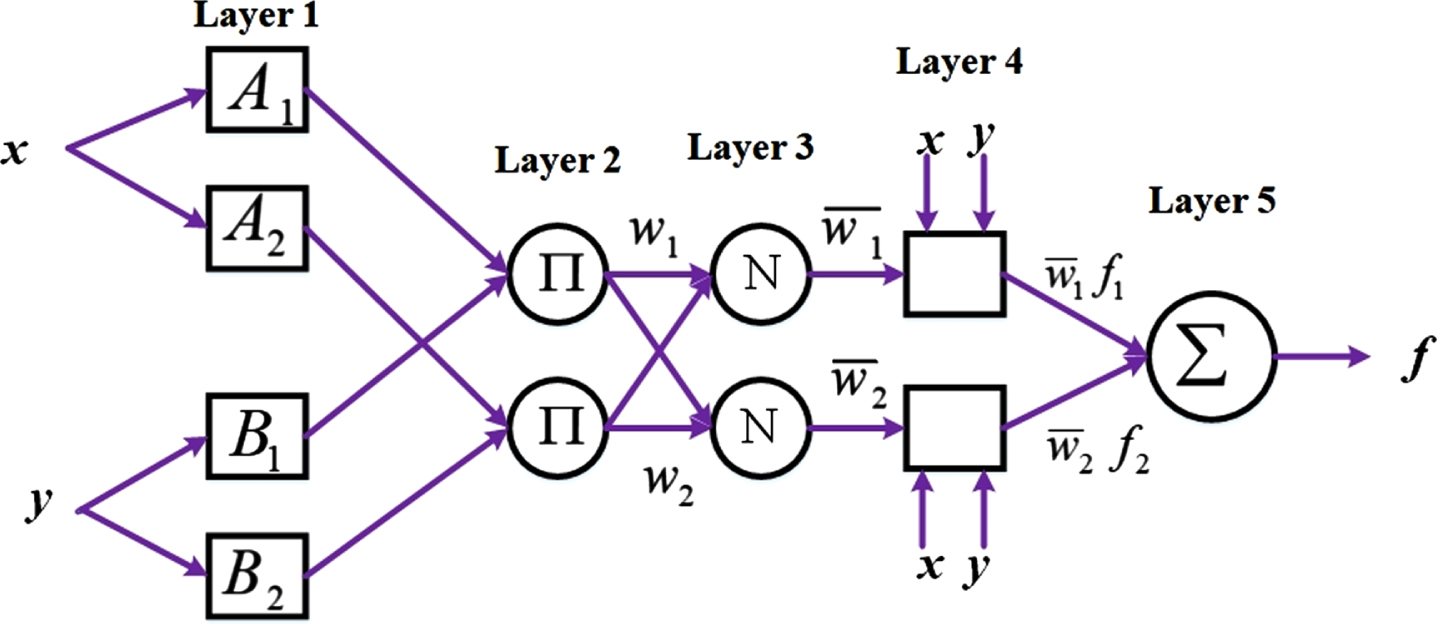
The adaptable framework, which uses the Sugeno fuzzy method ANFIS, supports learning and adaptation. To present the ANFIS design, IF-THEN rules are utilized in a first-order fuzzy Sugeno framework model [32].
Rule 1: if x is A1 and y is, B1 then f1 = p1x + q1y + r1
Rule 2: if x is A2 and y is, B2 then f1 = p1x + q1y + r1
Where x and y specify the inputs, the design parameters A and B are identified in training, and the fuzzy rule’s outputs are described f1. Adaptive nodes are squares in Figure 5, while fixed nodes are shown as circles. Based on this assumption, the individual layers are labeled as follows.
Layer 1: Every node i in layer 1 has an adaptive node function [32].
Where the input for node i is x, The function of membership for H is μA
i
. The following equation is the membership function selection,
Where the primary set of parameters is a i b i and c i , and the input is denoted as x [32]
Layer 2: Layers 2 and 3 depict the fixed nodes. They are designated M in Layer 2 and work as a simple multiplier. The Layer 2 output is as follows:
Layer 3: The nodes normalize the firing strength of layer 2 and indicate it as N and represented as below [45]:
Layer 4: With normalized firing strength, a first-order polynomial is produced as the output of Layer 4, where nodes are adaptive. The results are displayed as follows:
The output of layer 3 is represented as
Layer 5: A single fixed node is present in layer 5, identified as S. The node sums up all incoming signals. Following is a representation of the output as a whole:
Optimized ANFIS classifier: As was already said, fuzzy c-means clustering (FCM) is perhaps the most effective method for operating ANFIS’s fuzzy inference system. Backpropagation and hybrid approaches can be utilized to train ANFIS [32]. These techniques directly impact the FIS’s training phase membership functions, inputs, and outputs. Here, we improved ANFIS performance using a variety of optimization strategies. The recommended ANFIS starts by assembling all of the parameters for the membership functions into a vector, and then the optimum values are selected by using the BS optimizer to reduce a selected cost function. The following describes the cost function:
The total number of ANFIS inputs is N, the error is shown by e i , input values are shown by x i , the ANFIS parameter is represented as θ, the number of data instances are depicted as n, and ANFIS output is depicted as y i . Finally, the error is minimized by using BS (Breeding swarms optimization), PSO (Particle swarm optimization), and GOA (Grasshopper optimization algorithm). Instead of using the backpropagation method for network training, the GOA [33], PSO [34], and BSO [35] optimization algorithms are employed individually in this section. In their reference paper, the GOA and PSO algorithms are described, and the BSO algorithm is described below.
Design of ANFIS for classifying epileptic signals.
Breeding Swarm Optimization (BSO) algorithm.
The hybrid genetic algorithm (GOA)-PSO algorithm, known as the BSO algorithm, is presented in this section. PSO [34] and GOA [33] algorithms have benefits and downsides. During the crossover or mutation phase of the GOA, if a particle is not selected, the pertinent knowledge of the particle is lost. A region of the search space is more efficiently memorized by a PSO particle (a memory to remember prior experience). As a result, the PSO and GOA algorithms’ strengths are integrated into the BS) algorithm [35]. The method coupled the phases of genetic mutation, crossover, and selection in GOA with particle position update and standard velocity in PSO. The global search is facilitated by the GOA section of the BSO algorithm, and the local search is performed using the PSO algorithm [35]. The following are the steps to implement this algorithm [35]: Step 1: Create a population at random. Step 2: Determine each particle’s fitness using the cost function. Step 3: Using the roulette wheel technique to choose the optimal P particles Step 4: Create a new population using the results of step 3 of GOA and PSO in parallel. Step 5: To achieve convergence, move on to step 2.
An “Early” or an “Advanced” diagnosis can be made for the identified focal EEG signal. The ‘Early’ severity level is treatable with the proper medication and dosage schedule at regular intervals. The patient needs emergency surgery to prevent serious health problems, even though the severity level is “Advanced” and can be treated with medications. The LightGBM is used to automatically diagnose the focal EEG signal’s severity level as either “Early” or “Advanced” in this research.
When compared to non-focal EEG data, focal EEG signals feature dense samples and higher peaks. The severity levels are automatically classified by applying these properties in this approach. The most significant and lowest coefficient value CWT coefficients can be used to find the focal EEG signal’s peak minima and maxima. High CWT coefficient values represent Peak maxima, and low CWT coefficient values represent peak minima. The threshold value is calculated by averaging the absolute peak maxima value and peak minima value. The number of samples in total that are above the threshold is then calculated. The peak and sample counts for the signals of the “Early” and “Advanced” cases are calculated from the known dataset and used in the lightGBM classifier’s training mode.
From the classified focal EEG test data, it is now possible to extract the peak and sample counts. According to the training patterns, they can be classified using the LightGBM classifier’s classification mode. The LightGBM classifier produces a binary value; a low binary value represents the ‘Early’ stage, and A high binary value indicates the ‘Advanced’ stage.
This research divides the 750 EEG signals that comprise the focal dataset into “Early” and “Advanced” sub-datasets. Out of 750 focal signals, the ‘Early’ stage is represented by 600 EEG signals, and 150 EEG signals represent the ‘Advance’ stage. 50 “Early” stage and 50 “Advance” stage focal signals make up the training dataset used in this research. From both “Advance” and “Early” focal signals, the peak and sample counts are employed in the training mode of LightGBM.
Based on the decision tree method, a Gradient Boosting Decision Tree (GBDT) structure is utilized for the LightGBM approach. The GBDT approach can discretize continuous features, but it only uses first-order derivative data when optimizing the loss function. Due to the algorithm’s requirement that each tree learns all the preceding tree’s residuals, only a regression tree can be the decision tree in GBDT. Furthermore, the expansion of data volume poses a challenge to the efficiency and accuracy of GBDT. The model complexity is evaluated by L2 regularization of the parameters; the effectiveness and precision of diagnosis can thus be increased. However, the layer-by-layer greedy training strategy causes the leaf growth mode to expand. LightGBM then used the decision tree approach based on histograms. With multi-thread optimization and depth limiting in LightGBM, the excessive XGBoost memory consumption is helped by the leaf growth approach, which can handle massive data more effectively and with a lower rate of missed detection.
This approach measures the variance across the prediction
Then, LightGBM utilized a regression tree, namely w
q
(x) , q∈ { 1, 2, . . . , }, the leaf nodes are represented as J, the tree’s decision rule is represented as q, sample weight is represented as w; it is possible to express the objective function as
The steepest descent approach, which considers the loss function gradient, is used in conventional GBDT. The goal function is readily approximated in LightGBM using Newton’s technique:
Where second-order and first-order loss functions are represented as h
i
and g
i
, respectively.
Equation (11), which uses I
j
to represent the leaf j sample set, can be changed into the following form:
Quadratic programming can be used to determine each leaf node’s ideal weight and the LT limit given the tree structure q(x):
The formula for gain calculation is:
LightGBM uses optimization of multi-threaded to improve effectiveness and reduce processing time. It leverages the maximum tree depth to prune trees and prevent over-fitting.
The learning rate, number of leaves, and other vital factors that impact how well the LightGBM model performs must be manually modified; they cannot be obtained through training. Hyper-parameters were used to describe these parameters. Random searching, Grid searching, and other conventional techniques are used for hyper-parameter optimization. Grid searching uses a lot of memory, even if it offers parallel computation. The approximation of the function, the optimal solution, is obtained by random searching through random sampling, which can’t ensure an ideal answer and is simpler to jump out of the global optima.
The objective function’s historical evaluation results serve as the foundation for Bayesian optimization; the probability model is formed by using these results, determining the ideal parameter θ by scoring probability mapped from the hyper-parameters for the objective function. There are three options for choosing a probability model: Tree-structured Parzen Estimator (TPE), random forest regression, and the Gaussian process. It was discovered that the TPE approach could produce more excellent performance. The parameters of the LightGBM are optimized using the Bayesian Tree-structured Parzen estimation technique.
In the machine learning algorithm, hyperparameters are represented as θ ={ θ1, θ2, . . . . θ
n
} training is performed by using D
train
a dataset, verification is performed by using a D
valid
dataset, and the two are independently distributed. The verification loss is represented using the equation of L (A, θ, D
valid
, D
train
). The optimization requirement is often addressed via K-fold cross-validation:
LightGBM algorithm requires setting the parameter’s interval range. Continuously trained the model in the parameter optimization process, and the evaluation function evaluates the classification outcome for each parameter combination. In the end, it discovered the optimal set of l parameters. The LightGBM algorithm is modified to incorporate the combination, and the performance on classification is enhanced.
A robust machine learning technique with several hyper-parameters is called LightGBM. The hyper-parameters are successfully optimized using Bayesian hyper-parameter optimization.
For assessing the severity of the epileptic disorder, the Python program is used to simulate the prescribed EEG signal classifications. The EEG signals are automatically classified using CHB-MIT and Bonn datasets in this research. For effective detection of an epileptic seizure, enhanced machine learning-based IANFIS-LightGBM is proposed. The IANFIS classifier detects focal signals, and the LightGBM classification technique determines the severity levels in the focal signals. The suggested approach is employed in numerous clinical diagnoses. The accuracy, specificity, sensitivity, and classification rate of the suggested approach for the epilepsy disease detection and diagnosis system are examined.
Evaluation metrics
The proposed EEG signal categorization system’s accuracy, sensitivity, and performance assessment metrics are computed.
whereas True Positive (TP) is a metric that indicates how many accurately detected focal EEG signals there are, True Negative (TN) is a metric that indicates how many non-focal EEG signals have been successfully recognized, False Positive (FP) is a measure of how many focal EEG signals were wrongly recognized and False Negative (FN) is a calculation of the number of non-focal EEG signals that were mistakenly recognized.
To update the classifier’s parameters, the BHO algorithm is used. During training, it could be able to handle noise and sparse gradients. Reaching the global minimum is quicker and more effective when the default hyper-parameters are used. To create and implement the DL systems, we used TensorFlow on the DL models and Python 3.6 with the Keras API on the front end. Additionally, performance indicators, including sensitivity, specificity, precision, and accuracy, were computed using the Scikit-Learn Python module. Using an Intel(R) Core (i9) CPU running Windows 11, an NVIDIA Quadro RTX 6000 graphics card, and 64 GB of RAM, computations were completed. The optimized hyperparameter in the proposed system during training is given inTable 2.
The optimized hyper-parameters in the proposed system
The optimized hyper-parameters in the proposed system
The EEG signals have an extremely complicated structure and are high-order non-stationary, and non-linear. The researchers attempt to derive fundamental distinguishing characteristics from such signals and use these features for categorization. Sometimes, it’s challenging to analyze the signals. These procedures need much effort and time. Therefore, it is crucial to accurately and quickly identify these signals. For EEG signal classification, an IANFIS-LightGBM is developed in this research.
Benchmark EEG datasets were used in two experiments to assess the proposed model. To evaluate the proposed enhanced hybrid machine learning algorithm, the first series of experiments uses the single-channel Bonn EEG dataset. In contrast, Using the multi-channel CHB-MIT EEG dataset, the second experimental set is used.
The single-channel Bonn dataset provides 2700 EEG epochs for testing, with 900 epochs in each of the three subsets (C, D, and E). The multi-channel CHB-MIT dataset, in contrast, contains 787×23 EEG epochs for each subset (NS, S), totaling 1574×23 (where 23 denotes the number of channels). A 70/30 data split divides the dataset into training and testing subsets for each classification scenario. Building classifier models requires 70% of the training subset, while classifier performance is assessed using 30% of the testing subset. For training and testing of classification cases, the total number of EEG segments used is shown in Table 3. The experiments were conducted using Python. K-fold cross validation is used for data splitting the dataset in training and testing. In the following subsections, the results arediscussed.
Data division into subsets for training and testing
Data division into subsets for training and testing
The IANFIS technique is used to categorize the multi-channel and single-channel EEG records. For experiment analysis, IANFIS uses the standard BONN and CHB-MIT datasets. According to the Bonn and CHB-MIT datasets, Table 4 shows the classification outcomes of epileptic seizure detection utilizing a proposed enhanced machine learning approach.
Experimental results of the proposed approach
Experimental results of the proposed approach
Our suggested strategy performed less accurately in classification for the CHB-MIT dataset than for the Bonn dataset. The multi-channel signals are more complicated and include more information when compared to single-channel signals. While multi-channel EEG data provide additional details about epileptic seizures, some channels may be unnecessary and redundant. Consequently, it can result in a decline in detection efficiency.
For epileptic seizure identification, the dataset’s size impacted the proposed approach’s execution time. The Bonn dataset’s execution time ranged between 10.2 and 85.1 seconds, while the CHB-MIT dataset’s execution time was 772.0 seconds, demonstrating the efficiency of the epileptic seizure detection model. The detection performance of the proposed IANFIS-LightGBM was generally promising, and the detection accuracies in the CHB-MIT and Bonn datasets were more significant than and equal to 99.00% in every case. EEG data are categorized into seizure and normal classes using the suggested IANFIS classifier. The outcomes show that the suggested machine learning framework performs well and has good learning convergence. The value of the loss function (The figure’s bottom shows curves) and the value of accuracy (the top of the figure displays curves), as determined by the training data, is shown in Figure 7.
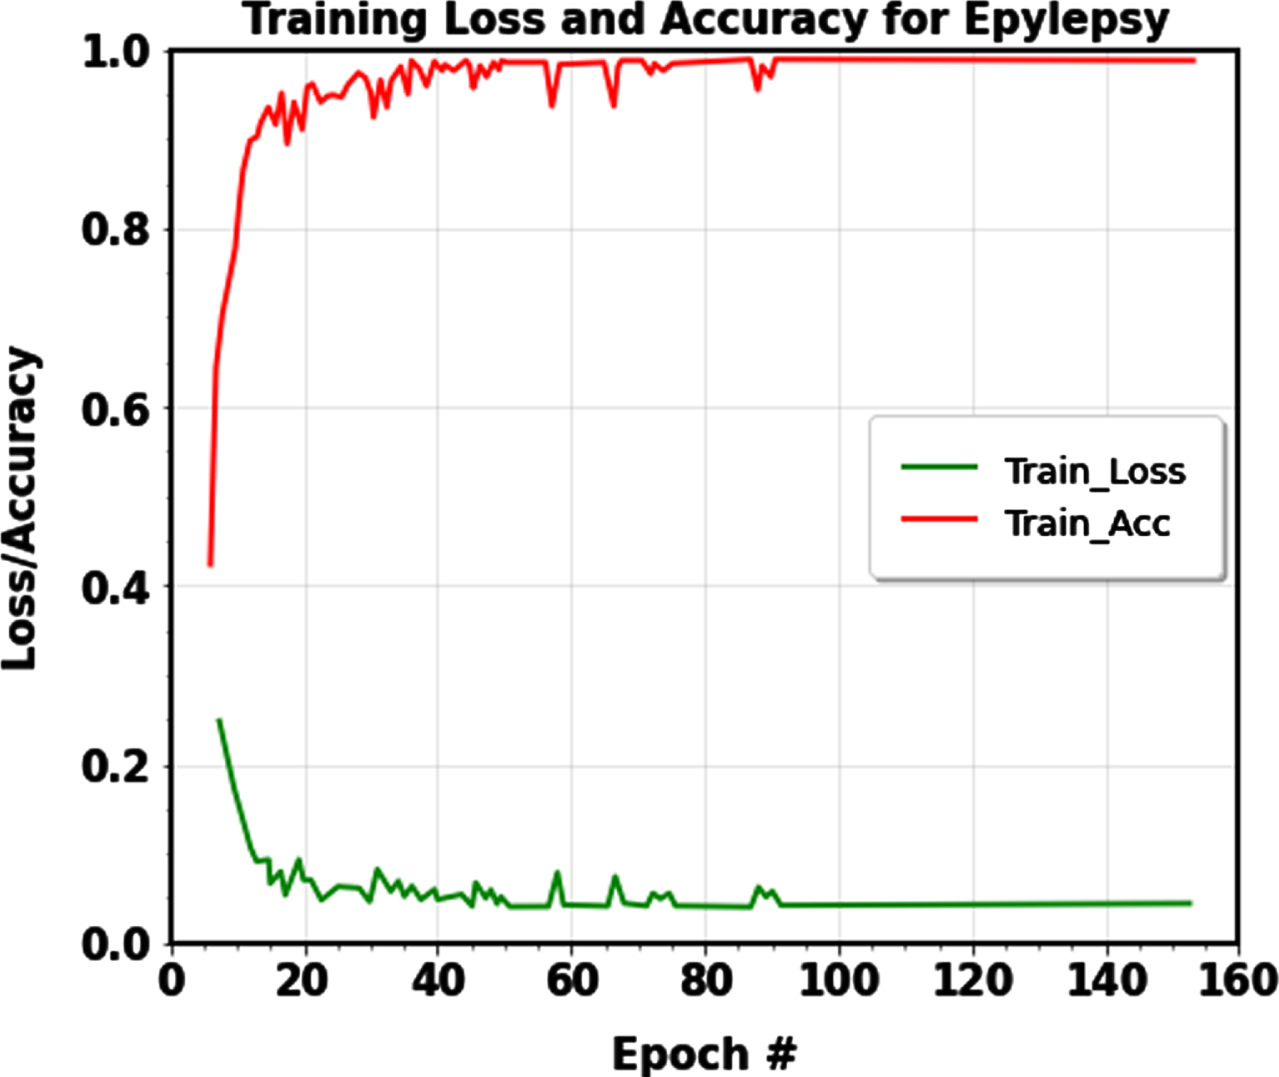
Training accuracy and Training loss curve of the proposed machine learning model for classification.
Applying the LightGBM classification approach to diagnose the focal signals makes it possible to determine the severity level for the categorized focal EEG signals. For the ‘Early’ stage, the suggested approach successfully diagnoses focal EEG signals, with a classification rate (CR) of 99.72%. Additionally, the suggested system successfully recognizes “Advanced” stage EEG signals with a classification rate of 99.60%. This results in a 99.66% average classification rate for the proposed severity level determination system of focal EEG signal. Table 5 shows the “Early” and “Advanced” stages of the focal EEG signals classification rate, confirmed by a qualified radiologist or physician.
Identification of focal EEG signals using CR
Identification of focal EEG signals using CR
The CHB-MIT EEG and the Bonn datasets were used to evaluate our suggested methodology’s categorization effectiveness with some existing approaches. Table 6 lists the categorization accuracy for each categorization instance for the proposed method and the existing used approaches. The experimental findings showed that, when compared to the existing approaches, the suggested method consistently produced the best detection accuracies.
Performance comparison analysis
Performance comparison analysis
For the categorization of EEG signals, Ramakrishnan et al. [36] suggested a new epileptic seizure identification approach. This study uses fuzzy rules to choose the sub-band-specific feature subset. A new LDAG-SVM is employed for categorization purposes to identify epileptic seizures. The Bonn and CHB-MIT datasets achieve 95% and 98% accuracy, respectively.
Qureshi et al. [37] developed a Fuzzy Rough Nearest Neighbor (FRNN) classifier for EEG signal classification. Bonn and CHB-MIT datasets were used for the experiment analysis, and an overall accuracy of 99.4% was achieved for the Bonn dataset. For effective feature extraction from EEG signals, Kumar et al. [38] examined a hybrid of integrating Hilbert transform (HT) and variational mode decomposition (VMD). For detecting epilepsy seizures, the stacked neural network (NN) method is used. This approach achieves an accuracy of 99.02% for the Bonn dataset and 92.79% accuracy for the CHB-MIT dataset.
Li et al. [39] developed a CE-stSENet for seizure detection approach to handle the issue of the finite data distribution and serious over-fitting issues for identifying seizures. The Bonn and CHB-MIT datasets had overall accuracy values of 97.92% and 95.56%.
A SEA-based DNN was created by Akyol et al. [40] to detect EEG seizures, gaining 97.17% accuracy. A successful machine-learning approach for the detection of seizures was provided by Shen et al. [22]. In this study, seizure detection accuracy was 96.38%. SVM is utilized for EEG signal categorization.
In this study, an automatic seizure-detection strategy was suggested by Mahjoub et al. [41]. To extract valuable features, multivariate empirical mode decomposition (MEMD) was utilized. An SVM is then used to carry out the categorization procedure, which yielded a 95.02% accuracy utilizing the Bonn dataset. Hassan et al. [42] suggested 1DCNN-SVM for seizure identification; it obtains 97.17% on the CHB-MIT dataset using one-dimensional CNN for feature extraction and SVM classifier for EEG signal recognition. Jiang et al.’s [43] use of the SVM classifier to categorize EEG signals produced 99% and 99.23% accuracy on the Bonn and CHB-MIT datasets.
While contrasted to the previous ML and DL approaches, the proposed IANFIS-LightGBM methods obtain improved outcomes, and it attains an overall 99.80% and 99.74% accuracy in Bonn and CHBMIT datasets. It categorizes EEG signals into ictal and interictal lessons employing IANFIS. By locating the focal signals using LightGBM, which has a reasonable classification rate of 99.60%, the focal EEG signal’s severity level is analyzed effectively. Compared to existing techniques, the suggested IANFIS-LightGBM with CWT-based signal decomposition and efficient feature extraction performs better in enhanced categorization accuracy with shorter execution times.
The primary advantages of the proposed IANFIS-LightGBM model are that it prevents overfitting and has no detrimental effects on network efficiency due to the detection process. The suggested model successfully extracts traits that correspond to the diseases’ inter-scale variability, enhancing the categorization’s effectiveness. The proposed machine learning-based categorization method for categorizing EEG signals outperforms existing methods, with 99.53% specificity, 99.26% sensitivity, and 99.74% accuracy for the CHB-MIT dataset and 99.77% specificity, 99.33% sensitivity, and 99.80% accuracy for the Bonn dataset. Due to the suggested upgraded machine learning model’s encouraging accuracy in categorizing, the epileptic seizure EEG signals are automatically identified and pre-screened.
I have proved the convergence of the proposed system by selecting a suitable machine learning model for EEG signal detection and severity diagnosis, defining the problems related to previous techniques and also given the details of how our proposed system solves those difficulties, observing the model’s performance using loss and evaluation metrics. We have done experiments with different hyper-parameters and optimization algorithms to optimize the model’s convergence. Plotting curves on learning show training and validation performance over epochs; a typical convergence plot will show a decreasing training loss and an improving accuracy loss.
Data preprocessing techniques like noise removal and artifact removal techniques can help mitigate the problem of uncertainty in the dataset. We have used the Bayesian method for hyperparameter optimization, and it can solve the uncertainty in the dataset posterior distributions that express uncertainty in model parameters. K-fold cross-validation is used for dataset splitting, this can help you gauge the stability and generalization performance of your models.
We used less number of signals for testing because we have used a small dataset for evaluation; this is the main drawback of the proposed research. In the future, we use a proper data augmentation approach to increase the size of the data set.
The proposed machine learning based classifier system produces a more significant number of false positives and negatives, it sometimes leads to misclassifying non-seizure events as seizures and missing actual seizures (false negatives) can be life-threatening, as it may delay intervention and treatment. In the future, we use an effective hybrid machine learning classifier for classification.
Cost-benefit analysis
The results of this research imply that patient income may affect equal access to the advantages of detecting devices since those who used the devices tended to have higher incomes, while those who weren’t using them were likely to have lower incomes. Higher percentages of device adoption among those with higher incomes may indicate that the present cost of detection devices prevents equal community utilization; the average household income of people with active epilepsy is less than $25,000 annually for almost half of them [1]. Even if 82.5% of patients are willing to invest over $100 on a wearable seizure detection device, only 42.8% are willing to pay more than $200; according to research, patients consider a suitable price range for seizure detection devices to be between $200 and $300 [2]. These estimates, however, only consider one-time equipment expenses, with households making $25,000 a year likely unable to afford further subscription payments. The relative appeal of phone and camera devices in comparison to those for muscle contraction, mattress, and motion detection devices could be explained by the relative cost differences between the two categories. Higher device use among those who have tried more ASMs might point to utilization among a particularly vulnerable segment of the epileptic population whose seizures have not been successfully controlled despite using multiple ASMs. To ensure that all persons with epilepsy have the benefits of seizure detection technology accessible to everybody, the community should prioritize cost-saving or payer reimbursement measures.
Patients frequently inquire whether using seizure detection devices can lessen anxiety or enhance HR-QOL while interacting with professionals. To assist patients in understanding the characteristics of other community members who tend to benefit from using seizure detection devices, we present large-scale data in this research on the characteristics of seizure detection equipment users. Although seizure detection equipment users do not show appreciable changes in overall HR-QOL compared to non-users, we give early evidence that these devices significantly reduce anxiety for most people with severe epilepsy. We hope that this information will assist patients and clinicians in analyzing the costs and benefits of including devices in each patient’s unique treatment plan.
Possible consequences
Consider the potential clinical consequences of false positives and negatives in seizure detection. False alarms may cause anxiety or inconvenience for patients, while missed seizures can have profound health implications. To solve this problem, we will use a hybrid machine learning system. Assess the risks of data breaches, unauthorized access to patient information, and other privacy and security concerns. Implement robust security measures to mitigate these risks in the future.
Computational complexity of proposed system
It is highlighted that while designing a framework for epilepsy diagnosis, computational efficiency is a crucial consideration. In various phases, the computational complexity of the proposed framework is displayed in Table 7. We can observe that the phase epileptic seizure detection complexity is significantly smaller, indicating that it can provide us with a very rapid reaction when the EEG input is arriving continually. Greater computational complexity is present during the epilepsy diagnosing phase. Compared to computation speed, it is sensitive since a precise diagnosis is more significant. An additional advantage is that this step can be carried out offline.
The framework’s various stages of computational complexity
The framework’s various stages of computational complexity
For epileptic seizure detection in one segment, the number of data points is represented as n1. For epilepsy diagnosis, one segment is represented as n2. The size of the first chosen order range is p. To identify epileptic seizures, the number of segments needed is l.
A data segment containing 2560 samples was used to determine the calculation time for our technique. Our approach requires the shortest time, 0.317 seconds, indicating that a real-time epilepsy diagnosis can be made because of its quickness.
The present research provides an automatic method for classifying non-focal and focal EEG signals to identify epileptic conditions. This suggested methodology entails feature extraction, classification using the IANFIS classification algorithm, and CWT decomposition. Following that, using LightGBM, the categorized focal EEG signals are classified as either “Early” or “Advanced,” depending on their severity level. Bayesian hyper-parameter optimization is used in the present research to optimize the LightGBM classifier’s hyper-parameters. The proposed enhanced machine learning-based IANFIS-LightGBM model achieves the average 99.53% specificity, 99.26% sensitivity, and 99.74% accuracy for the CHB-MIT dataset and 99.77% specificity, 99.33% sensitivity, and 99.80% accuracy for the Bonn dataset. The proposed approach achieves an average classification rate of 99.60% for focal EEG signal severity level analysis. Expert radiologists or doctors confirm the categorization rate for focal EEG signal’s “Early” and “Advanced” stages.
The proposed IANFIS-LightGBM may require more computing resources than single-domain feature approaches due to the classifier’s ability to identify epileptic seizures using many retrieved features. Future work might be expanded in three different ways: (1) For epileptic seizure detection, obtaining more valuable features to create models like bi-spectrum features, etc.; (2) more research and comparison of the contributions of several feature categories; (3) using more EEG data to assess the IANFIS-LightGBM’s scalability capabilities including TUH EEG epilepsy corpus, etc.