
Abstract
Casualties and property losses caused by the passenger car and electric bicycle crash accidents increased year by year. Assessment of the relevant risk factors of injury severity in passenger car and electric bicycle crashes could help to mitigate crash severity. This study uses an emerging machine learning method to predict the relationship between the risk factors and bicyclist accident injury severity in passenger car-electric bicycle collision accidents. The model’s performance is compared and evaluated based on accuracy, precision, recall, F1-Score, area under curve (AUC), and receiver operating characteristic curve (ROC). An interpretable machine learning framework Shapley additive explanations (SHAP) is used to further analyze the relationship between risk factors and bicyclist injury severity. It is found that we can adopt the light gradient boosting machine (LightGBM) algorithm after hyper-parameter optimization to get the highest accuracy (94.85%), precision (95.2%), recall (94.9%), F1-Score (95%), and AUC (0.993) based on the accident data of electric bicycles and passenger cars in the China in-depth accident study dataset from 2014 to 2018. The model can be used to assess new accident cases based on the model learning rate. There are some new findings in the aspects of bicyclists’ physical factors and electric vehicle characteristics. The throwing distance of the bicyclist has a positive impact on the injury severity. The bicyclist is more likely to suffer more serious injuries in a crash accident when the bicyclist is male, or shorter. Electric bicycles have a smaller handlebar width. In general, the lower handlebar height is, or lower saddle height is, the more serious the bicyclist’s injury is. Safety training for drivers can help reduce the injury severity in crash accidents and improve traffic safety.
Introduction
The traffic congestion and environmental pollution caused by passenger cars plague people’s lives. The government has issued policies to encourage people to travel with green transportation modes. Now, bicycles have become an important tool of transportation for Chinese people to travel short distances with the advantage of being economical, flexible, and environmentally friendly. In the early 21st century, the electric bicycle became more popular. The electric bicycle requires little riding space compared with motor vehicles, which allows them to shuttle through the congested urban road network more quickly and smoothly. Compared with traditional bicycles, electric bicycles rely on electric motors to provide power, which greatly reduces the physical exertion of the rider and allows electric bicycles to travel faster. 1 Small size, fast speed, many available scenarios and good economy make electric bicycles display great advantages in daily travel.2,3 Motor vehicles and conventional bicycle users are changing their short-distance travel patterns and there are 59 electric bicycles per 100 households in China by 2019. 4
Electric bicycles not only bring convenience to the riders’ lives but also bring serious pressure to the efficiency of mixed traffic and traffic safety. 5 Electric bicycles significantly differ from conventional bicycles both in terms of traffic characteristics and micro-behavioral characteristics.6,7 On the one hand, most of the non-motorized traffic facilities are still used to meet the bicycle traffic demand in urban areas of China, which hardly match the traffic demand for the rapidly growing electric bicycles. On the other hand, the electric bicycles’ steering flexibility make it too easy to sway and discrete in riding to conflict with motor vehicles. 8 Sweden has classified e-bikes as a separate category of road users in accident statistics since 2011. 9 A survey in Austria found that about 4% of electric bicyclists have experienced a crash accident and about one in six respondents have been involved in a near-collision. 10 Similarly, an Australian survey find that more than half of participants have experienced security incidents related to electric bicycles. 11 E-bikes have higher mass and faster speed compared to traditional bicycles, coupled with the complex road traffic environment. China has the largest number of e-bikes and related accidents in the world, traffic accidents involving e-bikes account for about 36.3% of all two-wheeler accidents. 12 At the same time, similar to traditional bicyclists, e-bikes also expose rider to traffic flow, and the consequences of accidents caused by e-bike may be more serious.13,14 A statistical analysis of e-bike accidents found that severe head injuries are the most common injury among e-bike riders and could lead to death. In order to reduce the accident rate and ensure the traffic safety of electric bicyclist, it is necessary to combine the actual traffic accident situation in China to conduct research on the factors of riders’ injuries caused by e-bike accidents.
At present, many scholars have studied e-bike traffic accidents. In terms of electric bicyclists, studies have found a high negative correlation between rider age, female gender, and rider deaths in e-bike accidents.15,16 In terms of motor vehicle drivers, Popovich et al. 6 found that visually difficulty to distinguish e-bikes from traditional bicycles may be a cause of collision accidents based on qualitative interviews with electric bicyclists. Similarly, many studies have analyzed the causal factors of e-bike accidents. Yang et al. 17 found that the four factors of collision object, collision target speed, direction, and sight obstacle are the main factors based on the accident data of e-bikes at intersections using the principal component analysis method. Hertach et al. 18 found that high riding exposure, male, and travel for work or school are high-risk factors for e-bike accidents. Li et al. 19 found that the important factors affecting the severity of traffic accidents are the type of collision, the injured part of the bicyclist, the type of physical isolation on the road, etc. Raslavičius et al. 20 found that reducing the impact of cyclists’ head and neck on the windshield of the car in a crash could effectively reduce the proportion of cyclists suffering serious injury and death. Panicker and Ramadurai 21 used the variable importance factor measurement method to find that the type of collision vehicle, collision type, driver’s age and road visibility have the greatest influence on collision severity of e-bikes. Based on the analysis, previous studies have analyzed the factors contributing to e-bike accidents. However, the analysis of factors is often limited to fewer characteristic factors due to the difficulty of data collection.
On the other hand, most previous studies have used statistical models, for example, the ordered logit model, 22 ordered probit model,23,24 Bayesian regression model, 25 and other methods to predict accident risk. However, the application of statistics to data processing imposes relatively strict assumptions, violating these assumptions will lead to biased estimates and even derive wrong conclusions. The machine learning method is not limited by this problem. The research method based on machine learning has been widely used in the field of road traffic accident research in recent years. Based on weather conditions, accidents and detector data, Parsa et al. 26 used the support vector machine (SVM) and probabilistic neural network (PNN) to detect traffic accidents on a highway in Chicago. Wang et al. 27 compared the driving risk prediction effects of four kinds of integrated learning models for drivers in the Kunshan area. Theofilatos et al. 28 predicted the accident risk of powered two-wheelers (PTW) and the tendency of PTW accident types on urban arterials by using the SVM model. Hadjidimitriou et al. 29 explored the accident severity involving e-bikes using nonlinear machine learning methods based on accident characteristics collected by sensors and other onboard devices at the time of the accident. Panicker and Ramadurai 21 used machine learning methods to predict the injury severity of accidents based on e-bike accidents, the results show that conditional inference forest is better than random forest and ordered probit model in predicting accident injury severity. Montella et al. 30 used classification trees and rules to analyze e-bike accidents in Italy and explored the factors and interdependence of e-bike crashes. Guo et al. 31 used the eXtreme Gradient Boosting (XGBoost) method to analyze the factors related to the injury severity of elderly pedestrians based on the accident data. Zhou et al. 32 verified the effectiveness of the XGBoost method in predicting the injury severity of passenger car drivers and truck drivers based on the data of passenger car and truck collision accidents reported by Canadian police. Wang and Liu 33 analyzed the causes of railway traffic accidents by using the random forest method. Zhu 34 used the random forest to explore the important factors of drivers’ crash behavior and interdependence in e-bike accidents.
In previous studies, the causes and risk prediction factors of e-bike accidents have been analyzed in detail. However, there are few studies to explore the relationship between the risk factors and the rider’s injury severity from the perspective of the passenger car and electric bicycle crash accident. The passenger car has the characteristics of flexibility and high speed, and is one of the main tools of transportation for residents to travel. With the continuous development of social economy, the traffic conflict between passenger cars and electric two-wheelers is gradually intensified. On the other hand, there are many factors affecting the e-bike accident, and the collection of multidimensional accident data is difficult. It is very few studies to conduct a multi-dimensional analysis of the causal factors of passenger-electric bicycle accidents.
The causal factors of passenger car-electric bicycle accidents were analyzed based on the passenger car-electric bicycle accident cases in the China in-depth accident study (CIDAS) dataset from the aspect of human, vehicle, and road environment, integrating six aspects of accident characteristic factors, including accident information, road information, e-bike information, electric bicyclist information, passenger car information and passenger car driver information. The predictive performance of six machine learning models is compared comprehensively based on multiple evaluation indicators. The machine learning method with the best predictive performance was selected to further explore the factors that affect the serious injury of electric bicyclists. Combined with the interpretable machine learning framework analyzes the impact of factors and their interactions on the injury severity of electric bicyclists. It aims to provide a reference for in-depth research on passenger car-electric bicycle accidents, improve the relevant safety regulations, and optimize the safety performance of e-bikes.
Methodology
Light gradient boosting machine
Light gradient boosting machine (LightGBM) combines the gradient-based one-side sampling (GOSS) and exclusive feature bundling (EFB) to solve the efficiency and scalability of applying gradient boosting decision tree (GBDT) to high-dimensional input features and large data volumes. LightGBM is an integrated regression tree approximation of the final model fT based on GBDT with the decision tree as base classifier, there are:
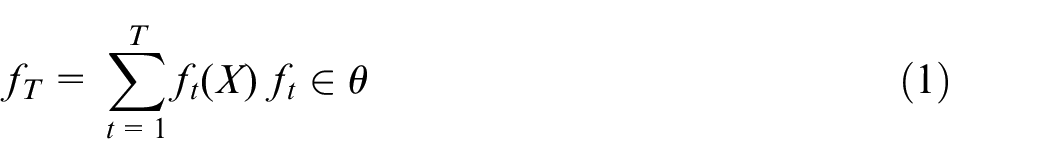
Where fT is the ith decision tree. θ is the set space of all trees.
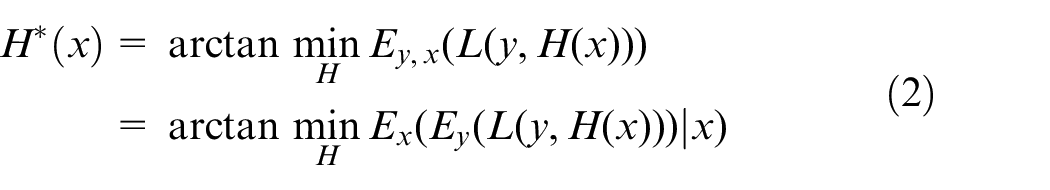
LightGBM learns the mapping function from input space Xs to gradient space G by using a decision tree. Suppose the train set is {x1,…,xn}, where xi is the ith vector in the Xs. Construct the loss function L(y, H(x)), where y is the output and H(x) is the estimation function. Find the function H*(x) that minimizes the expected loss function by the equation (2):
The negative gradient output value of the current model loss function is {g1,…,gn} in each iteration. Where gi is the negative gradient value of the loss function corresponding to xi in the output model. LightGBM uses the GOSS method to split internal nodes, and the weak learner splits with the largest information gain at the split point. Let O be the dataset within a fixed node. The variance gain
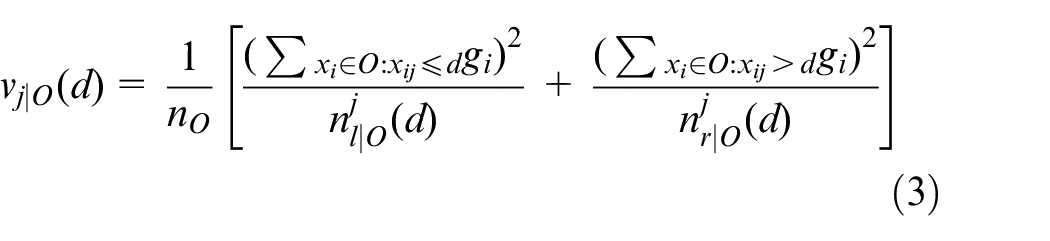
Where
Secondly, the input features of many programs are multidimensional and sparse (Most of the data is missing or zero). EFB can make the data size smaller by using the idea of building a graph to determine the bundled features. And it uses the features as nodes to connect edges between non-exclusive features and find the set of all bundled features. EFB adopts an approximate greedy strategy solution to make the model get a good trade-off in accuracy and training efficiency.
In summary, the LightGBM utilizes GOSS to partition internal nodes according to variance gain and utilizes EFB to reduce the dimensionality of input variables. In addition, LightGBM can resist the multicollinearity problem among related independent variables as a decision tree-based model.
Shapley additive explanations (SHAP)
Lundberg and Lee 35 developed a unified framework SHAP for post-hoc interpretation of machine learning methods. The biggest advantage of SHAP is that it can reflect the influence of each feature in the sample on the prediction results, and it also could point out the positive and negative predictability of its influence degree. The SHAP value is derived from the Shapley value in game theory, which quantifies the marginal effect of a single variable and the interaction between two variables.
The SHAP model generates a predicted value and provides an interpretable prediction for each test sample. The main thought is to calculate the marginal contribution of the features added to the model, known as SHAP values. It is equivalent to the influence of the feature on the sample. The SHAP value is calculated by equation (4) in cooperative game theory:
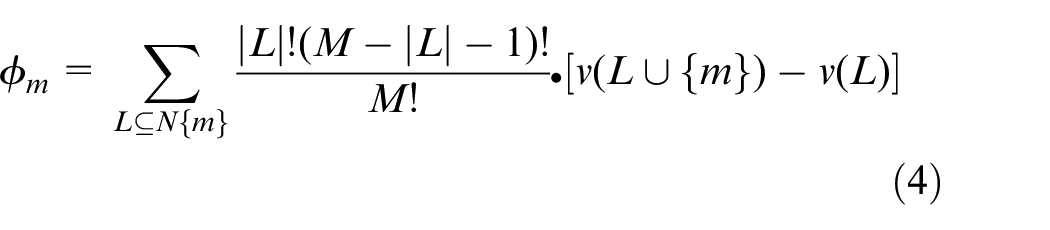
Where φm is the contribution of the mth feature. L is the feature subset; N{m} is the feature set; M is the total number of input features. V(L∪{m}) is the value of the predicted model if the sample only has the eigenvalues of L∪{M}. The v(L) is the value of the model predicted when the sample has only eigenvalues in L. Based on the additive characteristic attribute method, the linear function g is defined by equation (5).
Where g(x) is the value of sample × predicted by the post-interpretation model. φ0 is the average value predicted by the model. The xm is the mth feature sample.
Data preparation
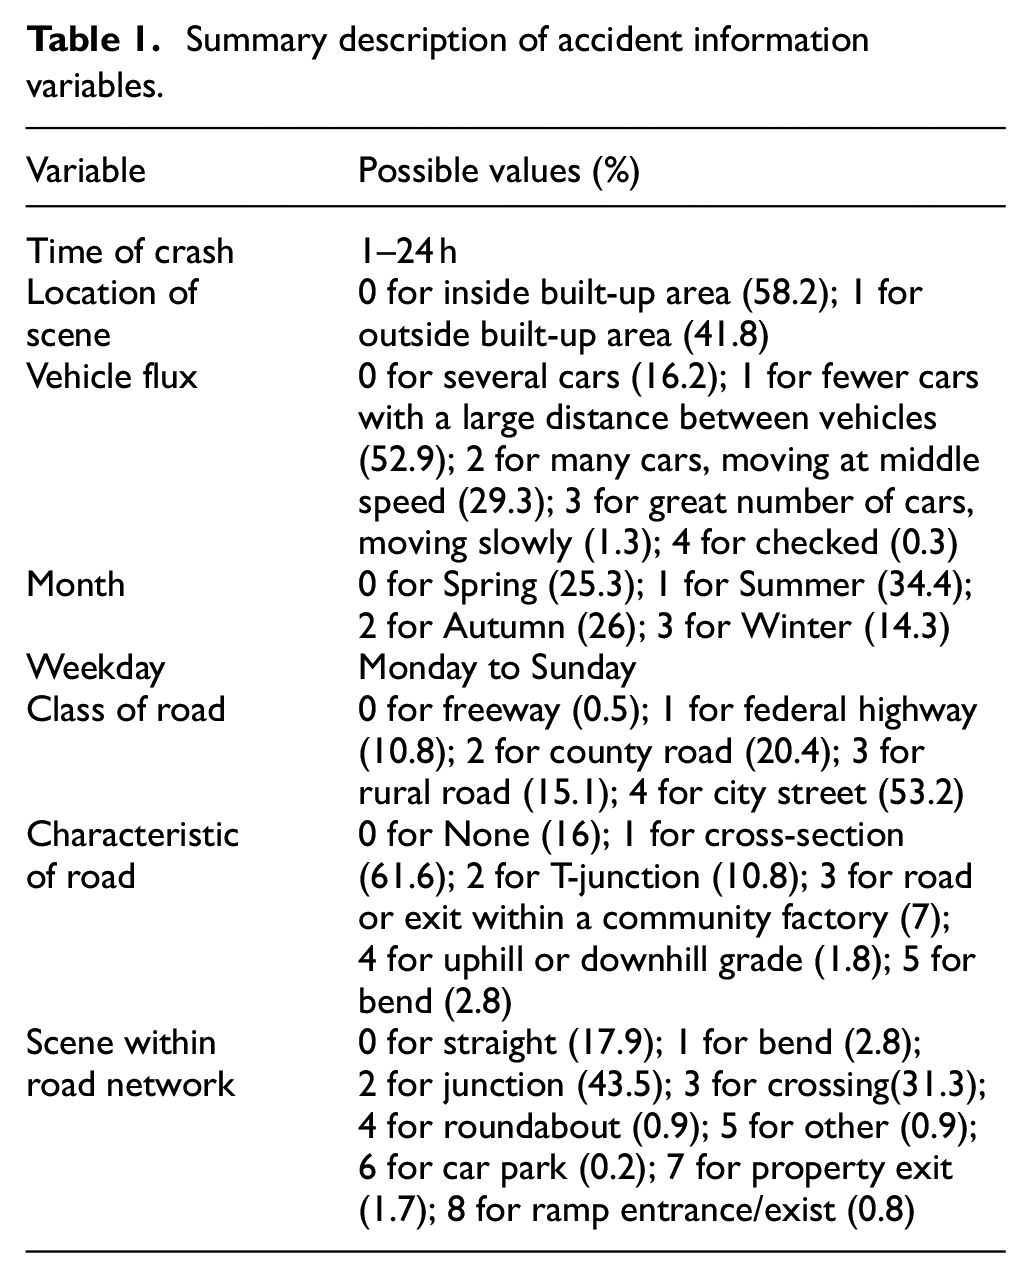
This study used passenger car-electric bicycle accidents that occurred between 2014 and 2018 collected in the CIDAS dataset. Accident participants included only one passenger car and one e-bike, excluding multi-vehicle collision accidents, focusing on the injuries of electric bicyclists. Based on the correlation analysis method, the data with a high correlation between accident feature factors are removed. The high correlation between feature factors is the correlation coefficient greater than 0.5, and the feature is highly correlated with the target variable. A total of 40 characteristic variables were obtained for research analysis after correlation analysis. The accident information includes the time of crash, the location of scene, the vehicle flux, the month, and the week. Road information includes scene within road network, class of road and characteristic of road. The description is shown in Table 1.
Summary description of accident information variables.
E-bike information includes handlebar height, handlebar width, saddle height, biker’s velocity, and pedal (1 for yes; 2 for no), handlebar design (0 for not specified; 1 for straight; 2 for touring; 3 for bullhorn; 4 for horn; 5 for multifunctional; 6 for other). The summary statistics of variables are shown in Table 2.
Summary statistics of variables.
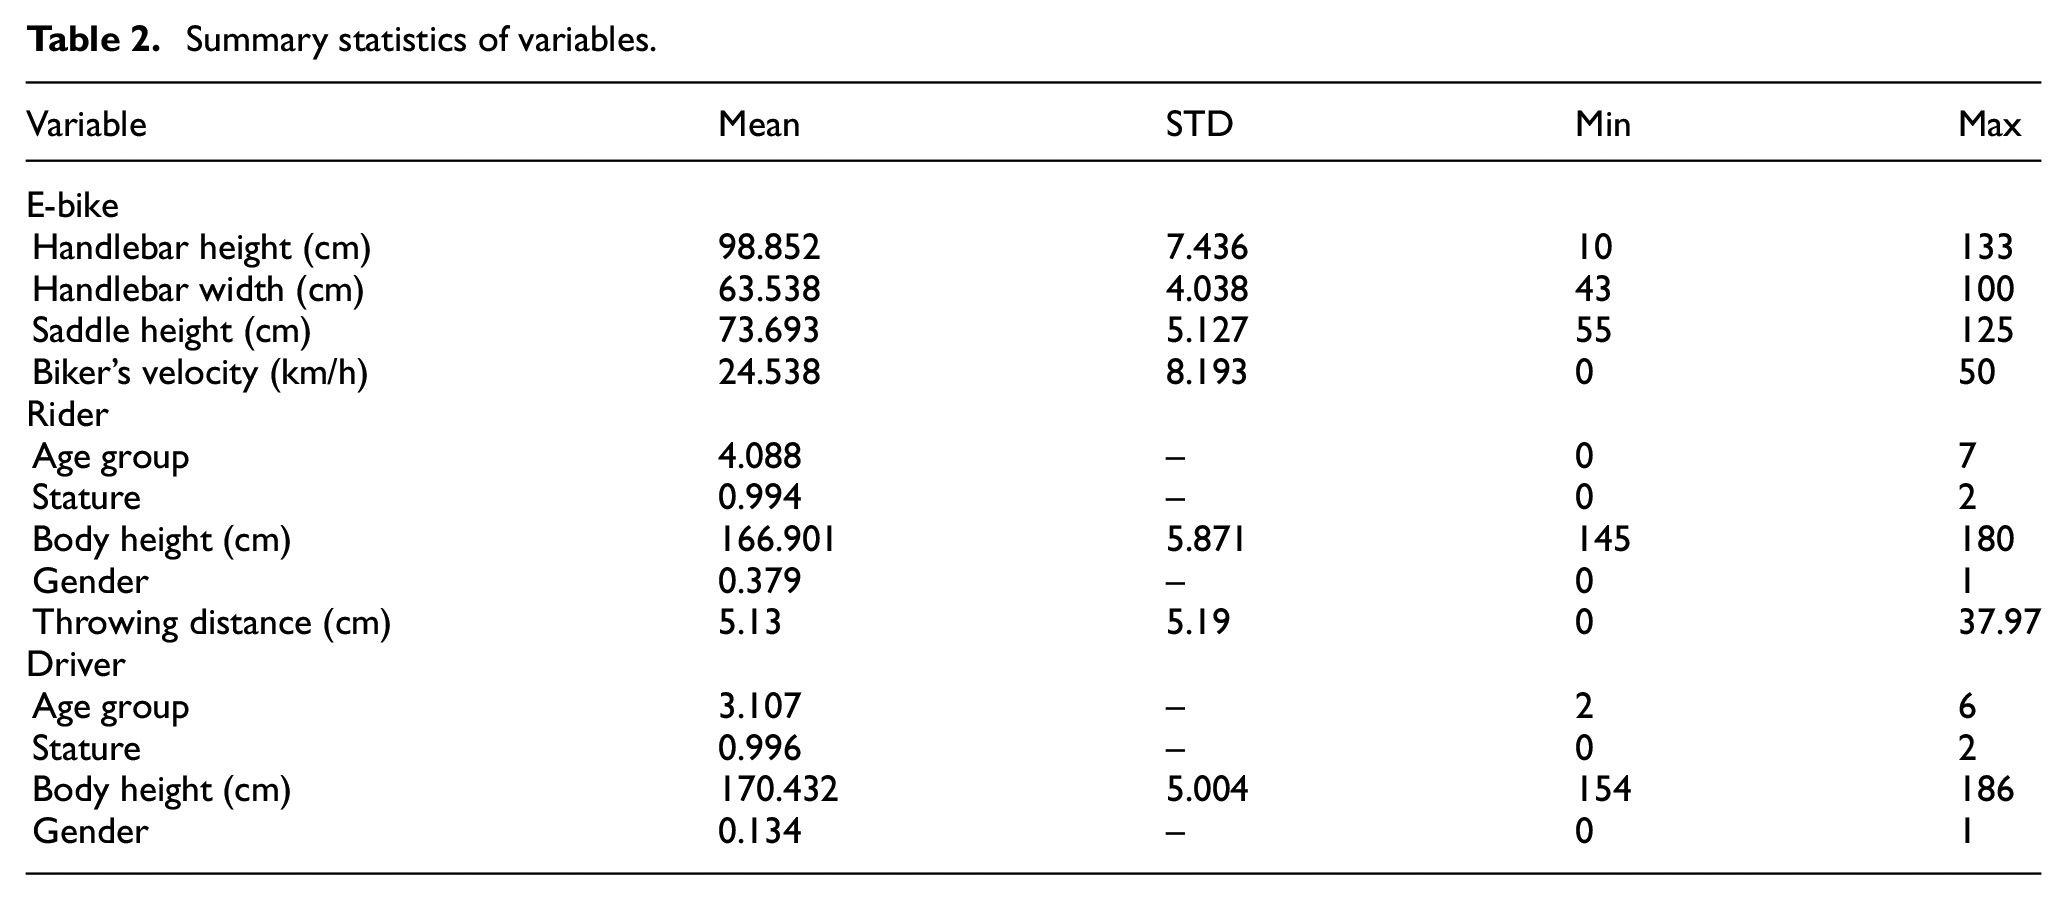
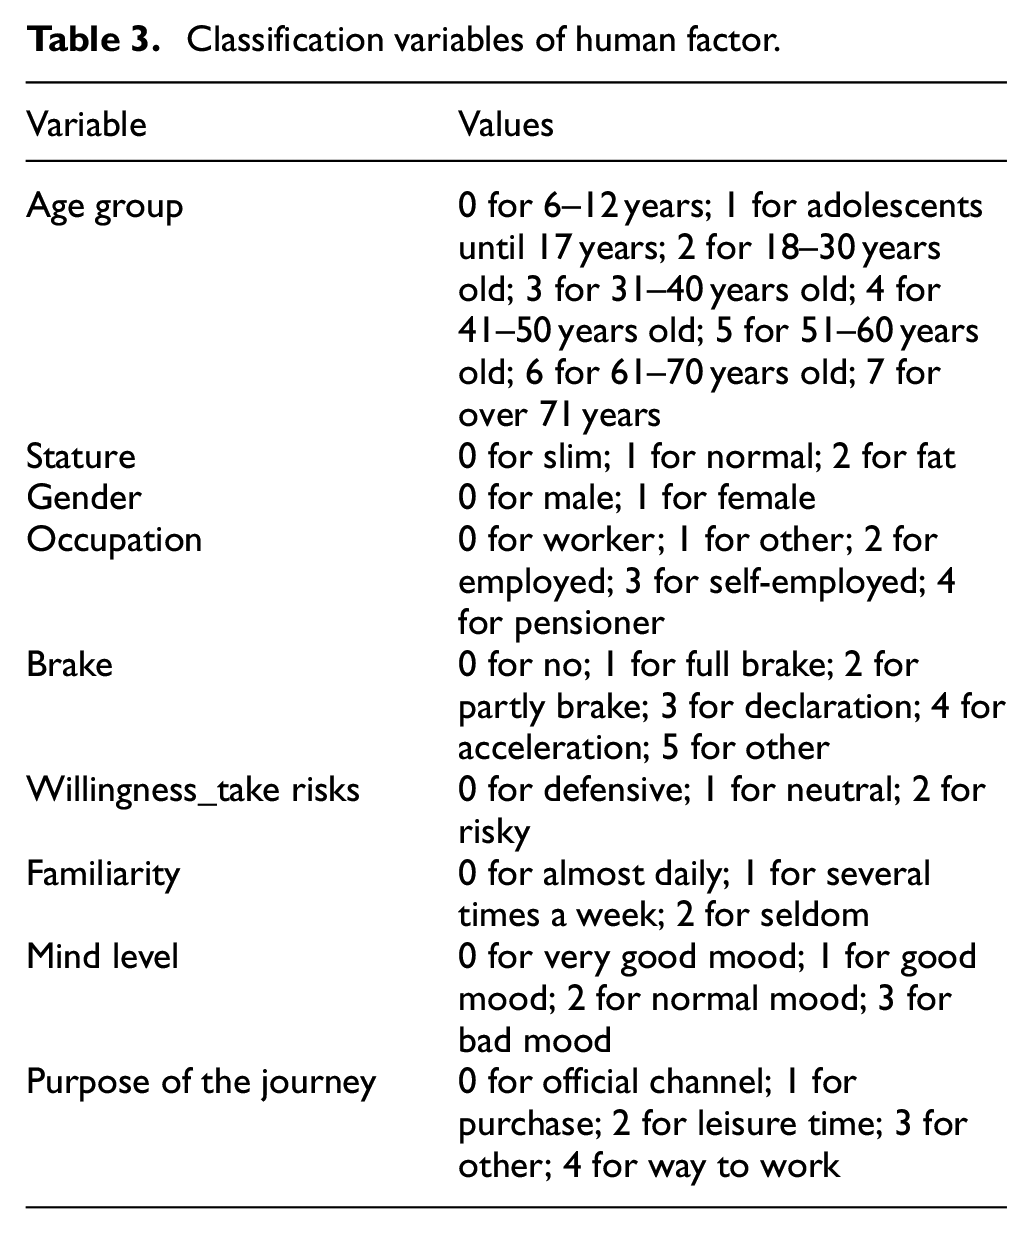
The information of the participants in the accident includes the age group, stature, body height, gender, occupation, whether braking measures were taken before the collision (brake), the mood before the accident (mind level), the purpose of the journey, the familiarity of the accident place (familiarity), and the willingness to take risks (willingness_take risks). The classification variables are shown in Table 3.
Classification variables of human factor.
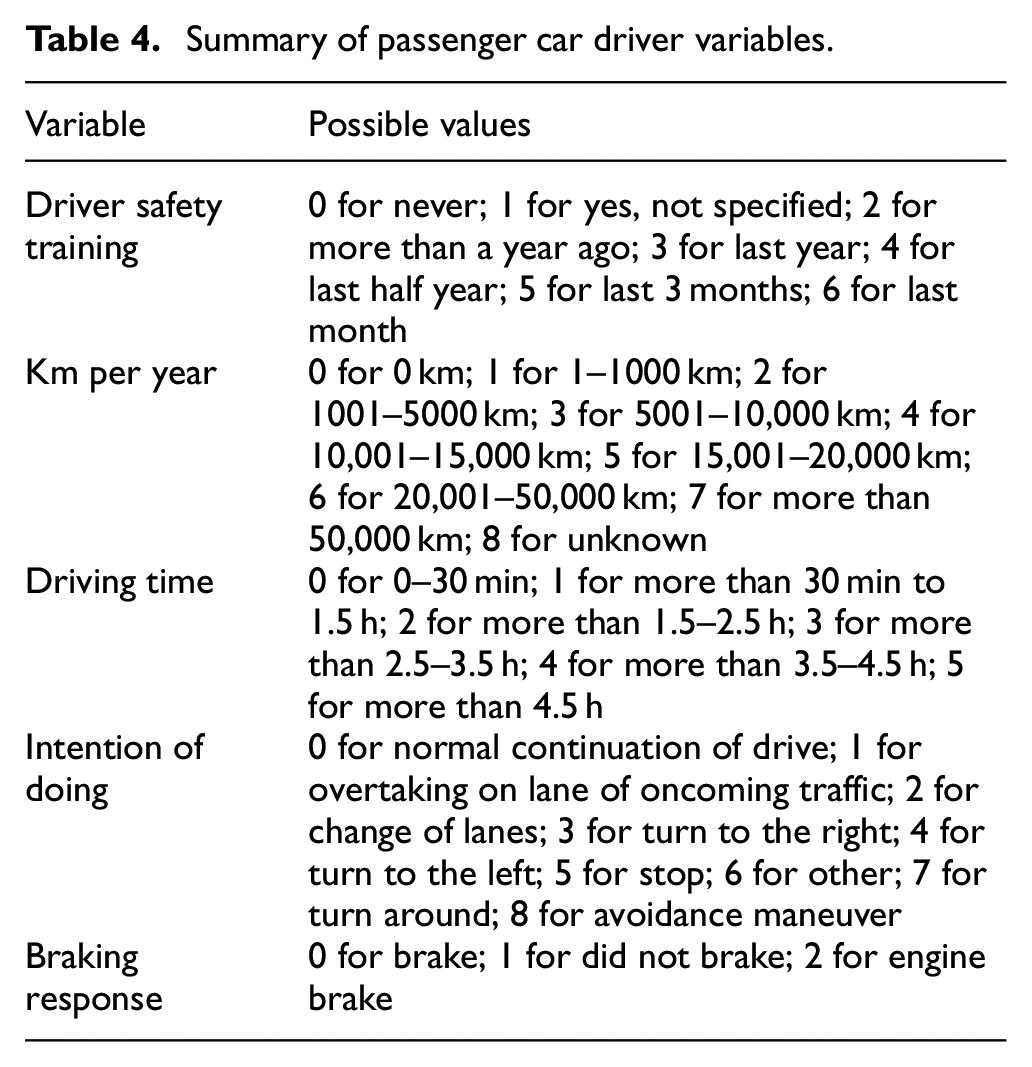
In addition, the electric bicyclist information also includes the throwing distance (shown in Table 2) and whether wear a helmet (0 for yes, 1 for no). Passenger car driver information also includes the frequency of driver safety training, the number of kilometers driven per year (Km per year), the driving time, the driver’s intention of doing before the collision, and whether wears glasses. The passenger car driver variables are shown in Table 4.
Summary of passenger car driver variables.
The information of drivers and bicyclists involved in the accident mainly comes from questionnaires and voice records. The final dataset includes 989 accident cases after removing some data missing cases and misinformation. Accidents that electric bicyclists only suffered property damage (PDO) accounted for 5.8%, accidents that electric bicyclists suffered slight injuries (SI) account for 79.1%, accidents that electric bicyclists suffered serious injuries account for 12.1%, and accidents that electric bicyclists suffered fatalities account for 3.0%. This study combined serious injuries and fatalities into one injury category, because serious injury also causes large accident losses. Modeling is performed with the dependent variables of property damage only, slight injury, serious injury and fatalities (SIAF) for the three injury severity categories of accidents for electric bicyclists.
There is an imbalance proportion of injury severity in the crash accident data, the methods of oversampling and under sampling are usually used to deal with unbalanced data. However, the under sampling technique often leads to the loss of a large part of the data, which leads to a decrease in the model accuracy. Therefore, the over-sampling method was selected in this study. The SMOTE method that developed by Chawla et al. 36 was adopted, which is an improved scheme based on the random oversampling algorithm. To achieve the purpose of class balance in the data, the SMOTE uses k near neighbor (KNN) technology to analyze and simulate the minority class samples and adds artificially simulated new samples to the data set. Additionally, SMOTE could generate larger and less specific decision areas 37 and it is widely used in research.26,38 Python 3.8 and regular SMOTE are used to balance the data in this study.
Modeling was done in the Jupyter lab using Python code. About 80% of the total data was randomly selected as the training data of the model, and 20% as the test data of the model in this study. In addition, 10-fold cross validation was used to test the stability of model performance on the training data. Specifically, The training set data is randomly divided into 10 sub-samples, 9 sub-samples are used to train the model each time, and 1 sub-sample is used for model testing.
Model results
Evaluation indicators of the model
Confusion matrices are regularly utilized to degree the classification performance on test tests. True positive (TP) refers to the positive example that is correctly predicted and it indicates that the true value is positive and is additionally accurately predicted to be positive. True negative (TN) refers to a correctly predicted counterexample and it indicates that the true value is a negative case and is accurately predicted. False-positive (FP) implies that the true value is a negative example, and is wrong predicted to be a positive example. False-negative (FN) means that the positive example is wrong predicted to a negative example.
The accuracy refers to the ratio of correctly predicted samples to the total sample size. In general, the higher the accuracy, the better the classification performance of the model. Its calculation is equation (6).

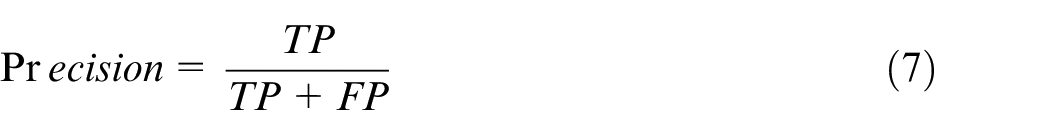
Precision is appropriate when the cost of negative examples being wrongly predicted as positive examples is high. The precision refers to the proportion of the samples whose prediction results are positive examples, and the true situation is also a positive example. High precision means a low false-positive rate or false positive. Its calculation formula is equation (7).
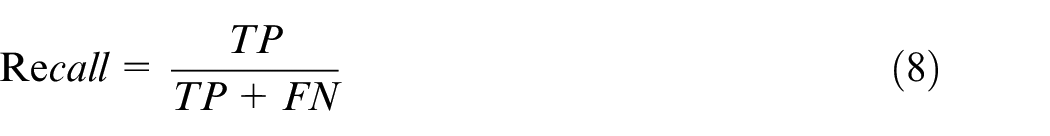
The recall is often used when positive examples are incorrectly predicted to be negative examples. The recall represents the proportion of the positive samples in the predicted results that are also positive in the real situation. High recall means low false negative or false negative. Its calculation formula is equation (8).
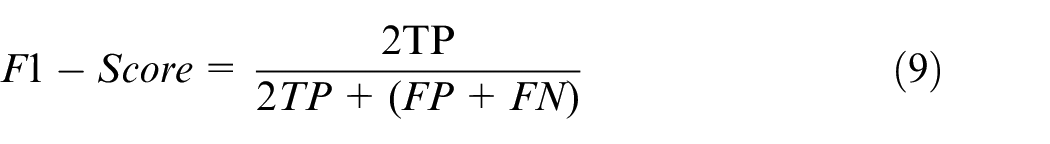
F1-score refers to the weighted average of precision and recall. It takes false negatives and false positives into account, and it is more applicable than accuracy, especially when the class distribution of the dataset is uneven. Its calculation formula is equation (9).
Receiver operating characteristic curve (ROC) uses the parameters in the confusion matrix to gradually increase the classification threshold, and it is calculated by the true positive rate (TPR) and false positive rate (FPR), where: TPR = TP/(TP + FN), and FPR = FP/(FP + TN).
Area under curve (AUC) is defined as the area under the ROC curve, with a value not greater than 1, and its meaning is to take a positive sample and a negative sample in the data set, and the probability that the predicted positive example is in front of the negative example. In other words, AUC gives a measure of the sample quality sorting. The larger the AUC is, the better the classification performance of the model is.
Five commonly used model performance evaluation indicators were used. The value of each evaluation indicator was obtained by calculating the weighted average of each evaluation indicator in each class according to the proportion of the data set occupied by each class for the prediction of the multi-classification problem in this study.
Model comparison
The 10-fold cross validation method was used to verify the applicability of the LightGBM model to the passenger car-electric bicycle crash accident data. The performance of LightGBM was compared with that of logistic regression (LR), KNN, SVM, decision tree (DT), and XGBoost. The performance of each machine learning algorithm was preliminarily evaluated with the accuracy value as the evaluation indicator (see Figure 1). Compared with other machine learning algorithms, the LightGBM algorithm has higher accuracy in classifying and predicting the injury severity of electric bicyclists.
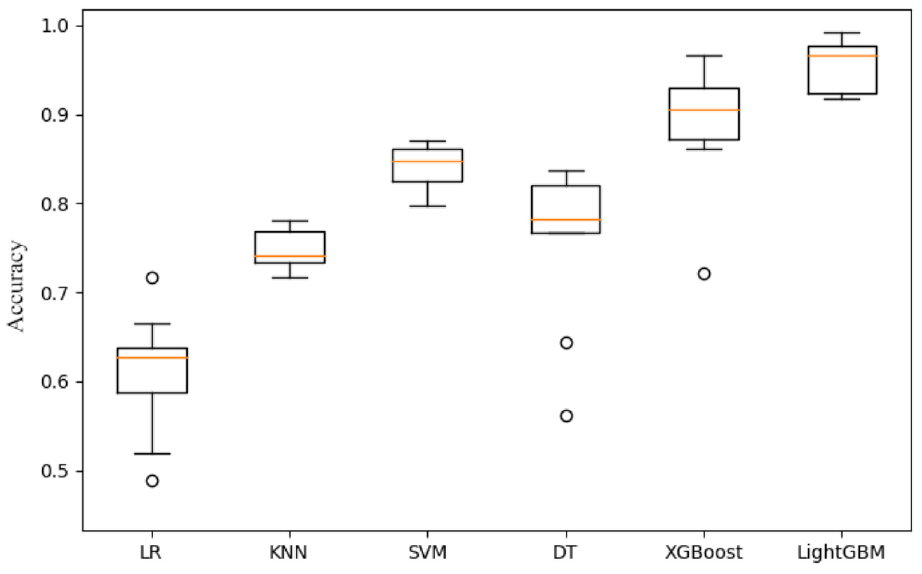
Comparison of machine learning algorithms.
Model parameter
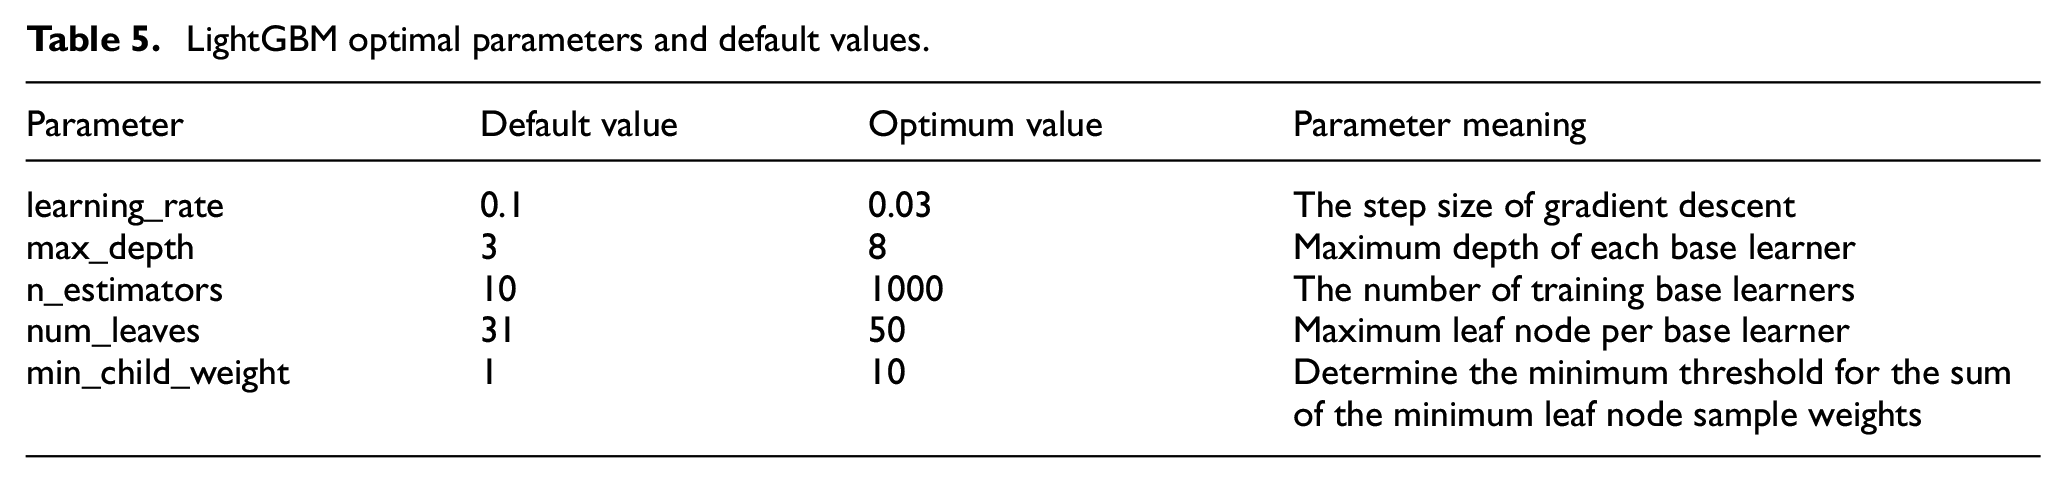
For the LightGBM algorithm, several main hyper-parameters of the model were optimized to maximize model performance in this study. Table 5 lists several key hyper-parameters. Larger n_estimators generally improve prediction accuracy, max depth and min_child_weight are used to prevent overfitting. A smaller learning_rate can improve the predictive performance of the model, and num_leaves is used to control the complexity of the model. This study adopts the grid search method to evaluate model performance on the test set. 39 The main hyper-parameters of the LightGBM model were traversed and optimized, and the hyper-parameter values of the optimal model are obtained and shown in Table 5.
LightGBM optimal parameters and default values.
A total of five evaluation indicators including accuracy, precision, recall, F1-Score, and AUC were used to comprehensively evaluate the classification and prediction performance of the model. The results are shown in Table 6. It is found that the LightGBM model classification accuracy of the injury severity of electric bicyclists is 93.6%, precision is 94.1%, recall is 93.5%, F1-score is 93.8%, AUC value is 0.993. Each value of the evaluation indicator is higher than other machine learning algorithm indicator values.
Model performance comparison.
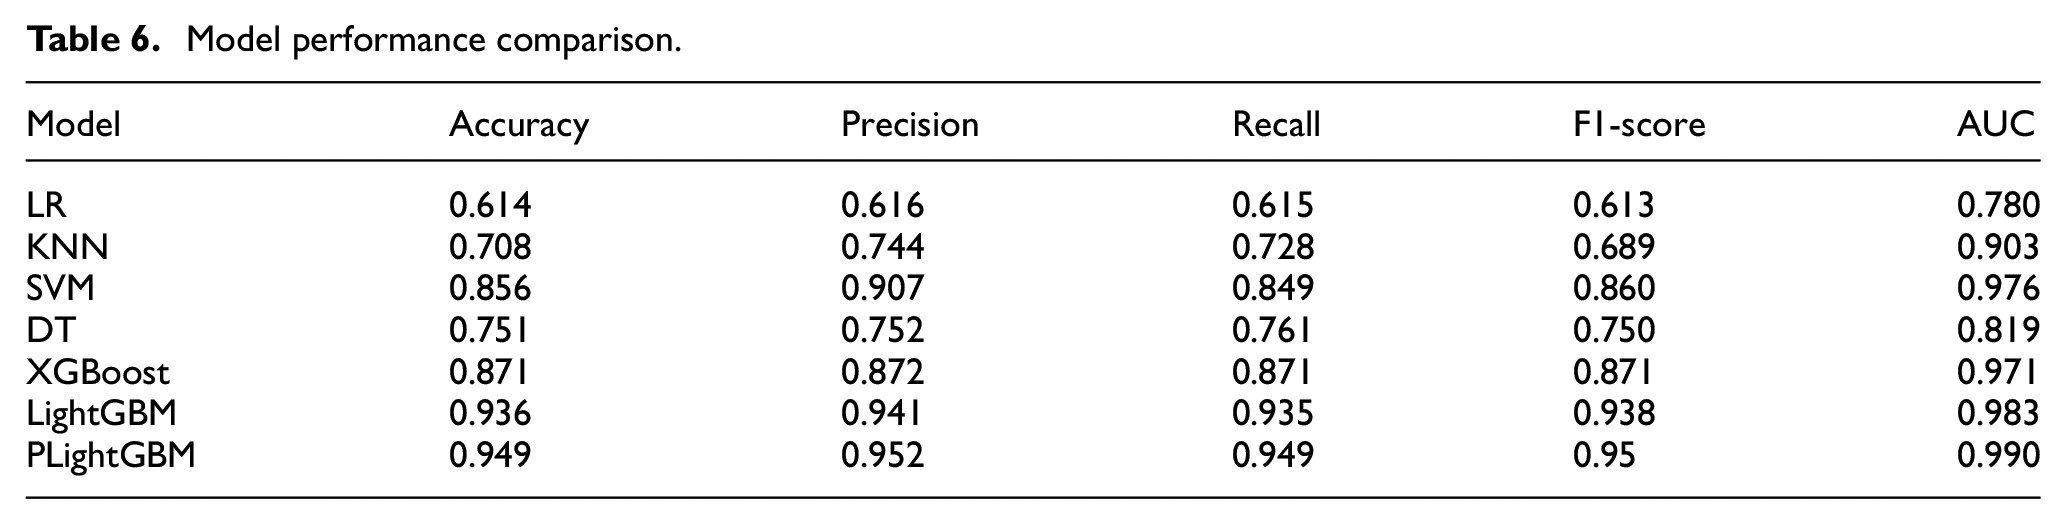
We compared the prediction performance of the rider injury severity before and after the hyper-parameter optimization. The accuracy of the optimal LightGBM model (PLightGBM) is 94.9%, precision is 95.2%, recall is 94.9%, and F1-Score is 95.0%. It is better than the accuracy of LightGBM algorithm 93.6% under the default parameters. The AUC of PLightGBM for the injury severity of electric bicyclists is 99.3%. 0.998 AUC for PDO, 98.9% for SI and 99.3% for SIAF. Based on the comparative analysis of various evaluation indicators, the performance of the PLightGBM model is dominant in this study.
Accuracy focuses on the validity of the prediction results. Accuracy is often used as a direct evaluation indicator for the performance of the model. However, when the distribution of variables in the sample data is not balanced, the accuracy will have certain limitations when the accident of electric bicyclists with only property damage occurs less than other types of injury accidents. ROC was introduced to further analyze the classification and prediction performance of each machine learning algorithm in this study. True positive rate (TPR) and false positive rate (FPR) were used to draw ROC curves of each machine learning algorithm. If the ROC curve of one learner A is completely covered by the ROC curve of another learner B, then the performance of B is better than that of A. If the curves of A and B intersect, it is impossible to conclude which model is better, it is necessary to compare the AUC value based on the area under the ROC curve. The weighted average of three categories of ROC curves under the same machine learning algorithm was taken to obtain the final ROC curve of the algorithm. The ROC curve of each algorithm is shown in Figure 2. The ROC curve of the LightGBM model is closest to the upper left corner compared with other models, and fully wraps the ROC curves of the other algorithms used in this study. Combined with the analysis results in Table 6, it is concluded that the LightGBM algorithm has a good ability to classify and predict the injury severity of the electric bicyclist through the comprehensive evaluation and analysis of each machine learning algorithm.
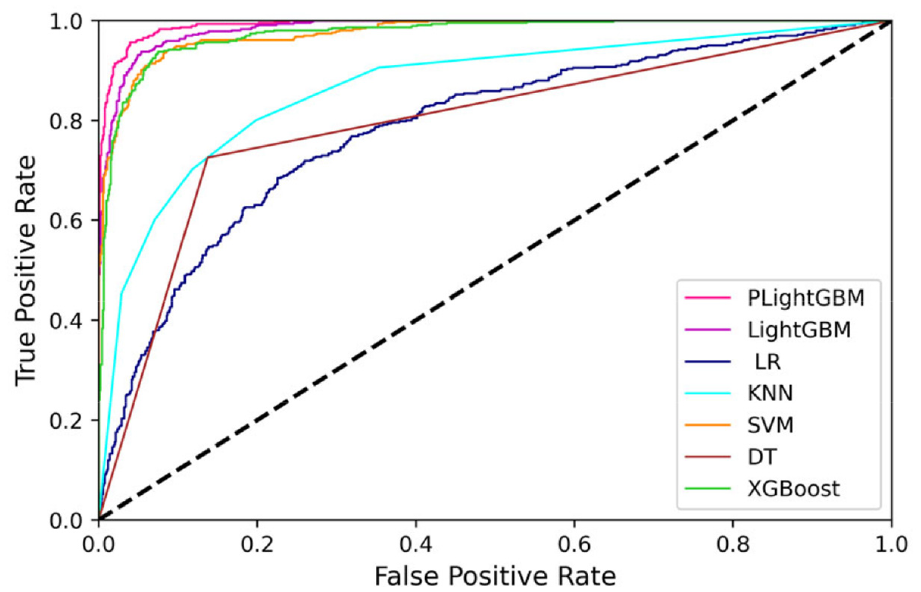
Performance comparison of ROC curves.
Analysis of model performance and generalization ability
To further observe the classification and prediction performance of PLightGBM model on the injury severity of electric bicyclists, the confusion matrix with optimal hyper-parameters is shown in Figure 3 based on the test set data. It can be seen that the electric bicyclist’s accident injury severity prediction model based on the LightGBM algorithm shows a good classification and prediction performance.
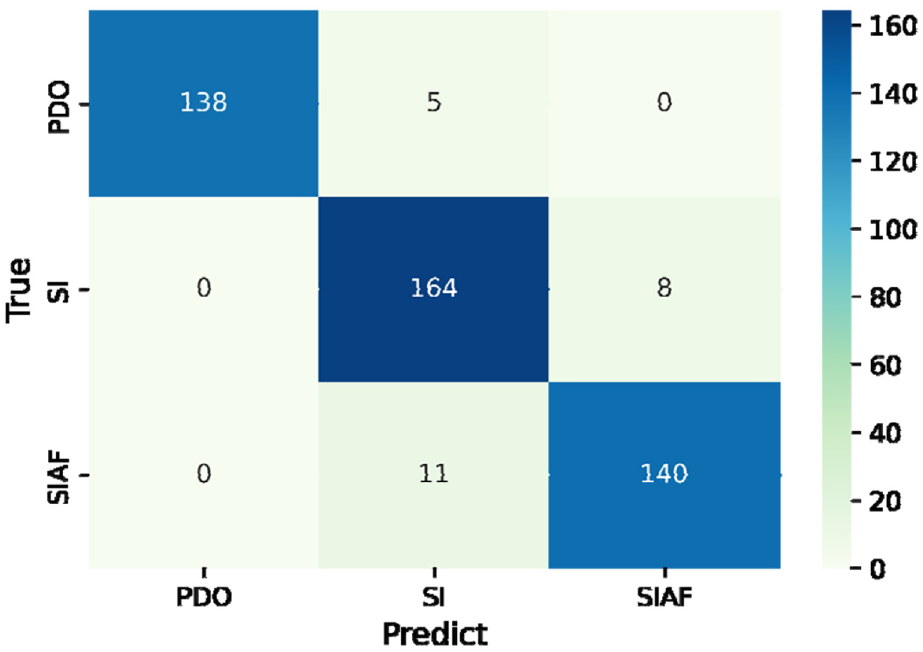
Confusion matrix.
In terms of model performance evaluation, a good model not only needs a good performance on the training set data, but also needs good generalization ability in cross-validation. In order to verify the adaptability of the LightGBM optimal model to new samples, the 10-fold cross validation method was used, and the learning curve is drawn to analyze the convergence of the model in Figure 4, observe the adaptability of the LightGBM model to new samples. It can be seen from the fitting trend in Figure 4 that the cross-validation score of the model is relatively stable with the continuous increase of the sample size. And the model achieves a better fitting effect. It shows that the PLightGBM model has better adaptability to new accident samples.
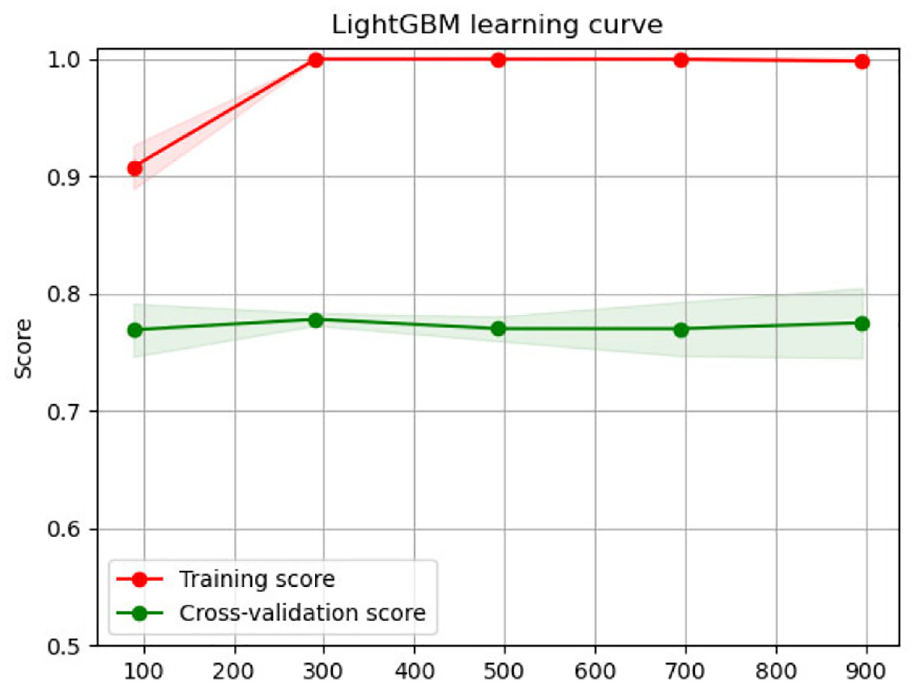
Learning curve of LightGBM.
Results and discussion
Importance of risk factors
An accurate model can capture better the relationship between rider accident injury severity and risk factors. And the interpretation of model results is another important aspect. Factor importance refers to the degree that a factor affects the performance of the model. In addition to identifying important factors, the importance of factors also shows the degree of influence on the output variables. The study conducted two analyses. On the one hand, the importance of the risk factors affecting the injury severity of electric bicyclists was analyzed based on the PLightGBM model. On the other hand, the impact of risk factors and their interactions on the injury severity of various types of riders was analyzed based on the interpretable machine learning framework SHAP. The factor importance of the LightGBM model is obtained by the number of times the training data is split across all trees according to the ith variable. The factor importance score Fi is calculated according to equation (10).

Where wi represents the weight of each feature factor. zi represents the ith factor among all feature factors. Figure 5 shows the top 15 risk factor scores that have a greater impact on e-bike accident injury severity based on the PLightGBM model (The number 1 after the variable represents the characteristic variable belonging to the e-bike, and the number 2 after the variable represents the characteristic variable belonging to the passenger car). The results show that the throwing distance has the greatest importance to the model. However, the feature importance does not reflect the contribution of the characteristic factors to the injury severity of the electric bicyclists.
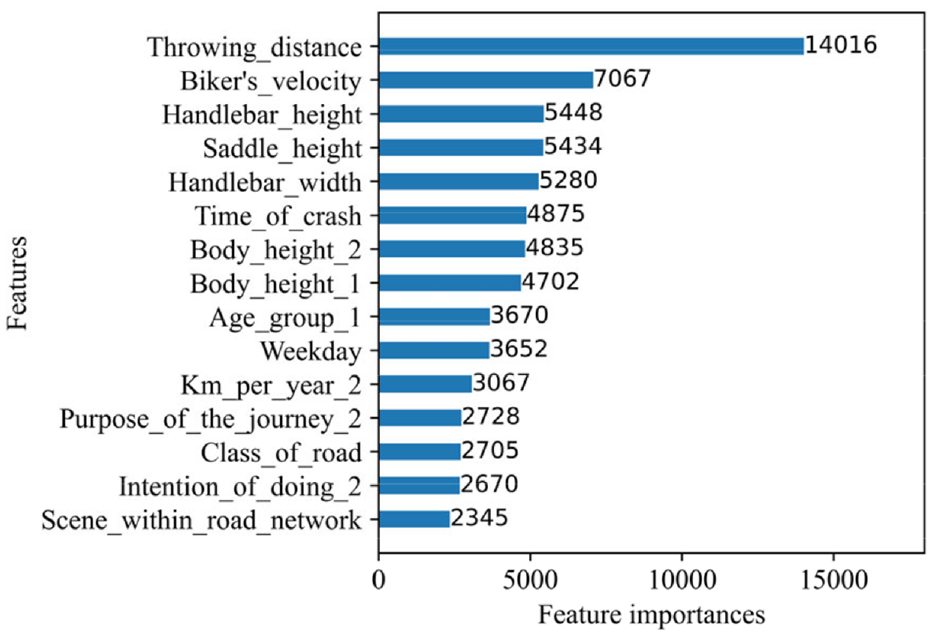
Feature variable importance based on PLightGBM model.
To explain the feature importance and how it affects the injury severity of electric two-wheeler riders, this study uses the SHAP method to interpret the feature importance of the LightGBM model. Figure 6 shows the SHAP trends in the prediction process of three injury severities for riders. The first–third lines represent property damage only, slight injuries, serious injuries and fatalities, respectively. The base value is the base logit value of the injury level in the training dataset. The output value f(x) is the model predicted value. When f(x) is greater than the base value, it means that such injury will occur, otherwise, it means that the injury will not occur. The sample shown in Figure 6 indicates that this sample will result in the only property damage accident. Trends in SHAP values show the impact of factors on cyclist injury. For example, when the driving purpose of the journey is other, the throwing distance of the rider is 437 cm, and the location of scene is inside built-up area, it has a positive impact on the cyclist’s property damage only. When the cyclist does not brake, the driver’s occupation is employed, which means that there is a negative impact on the cyclist’s only property damage.
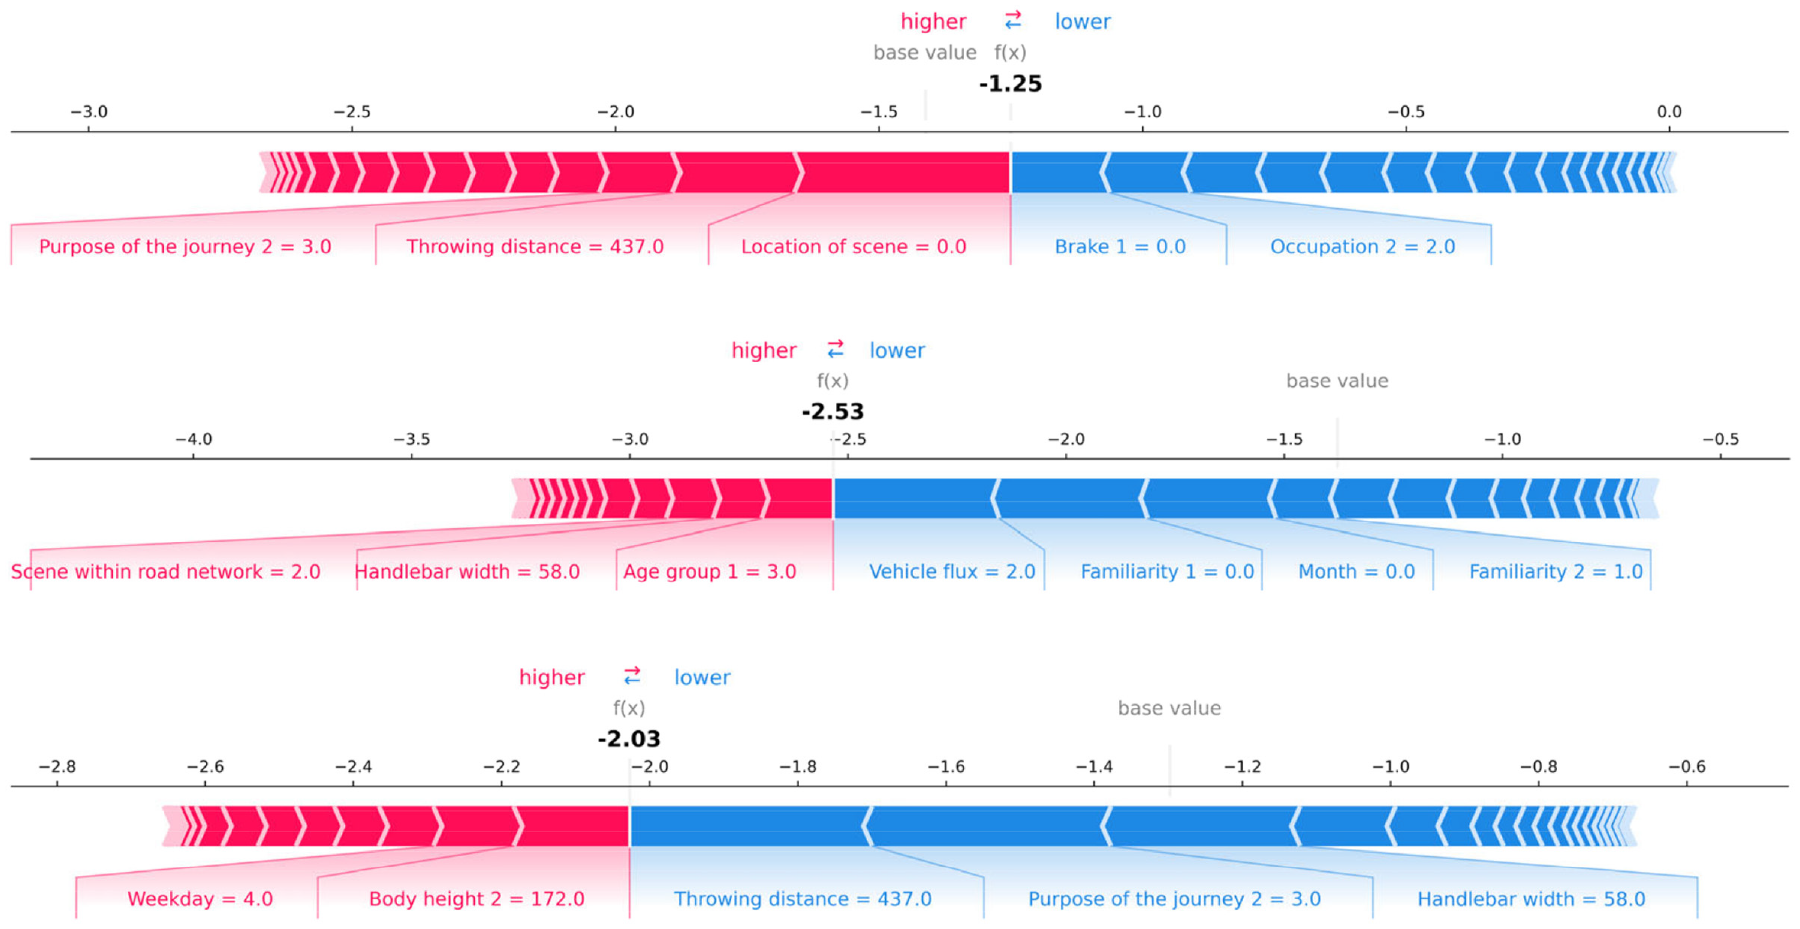
SHAP model modeling prediction progress plots.
Figure 7 shows the SHAP summary plots that the importance of three types of bicyclist accident injury severity based on characteristic factors. Risk factors are ranked from top to bottom according to the importance of SHAP value. The top 15 important risk factors are plotted and displayed. The color bars in each row indicate how each risk factor contributes to the injury severity. Red dots represent high values of risk factors, and blue dots represent low values of risk factors.
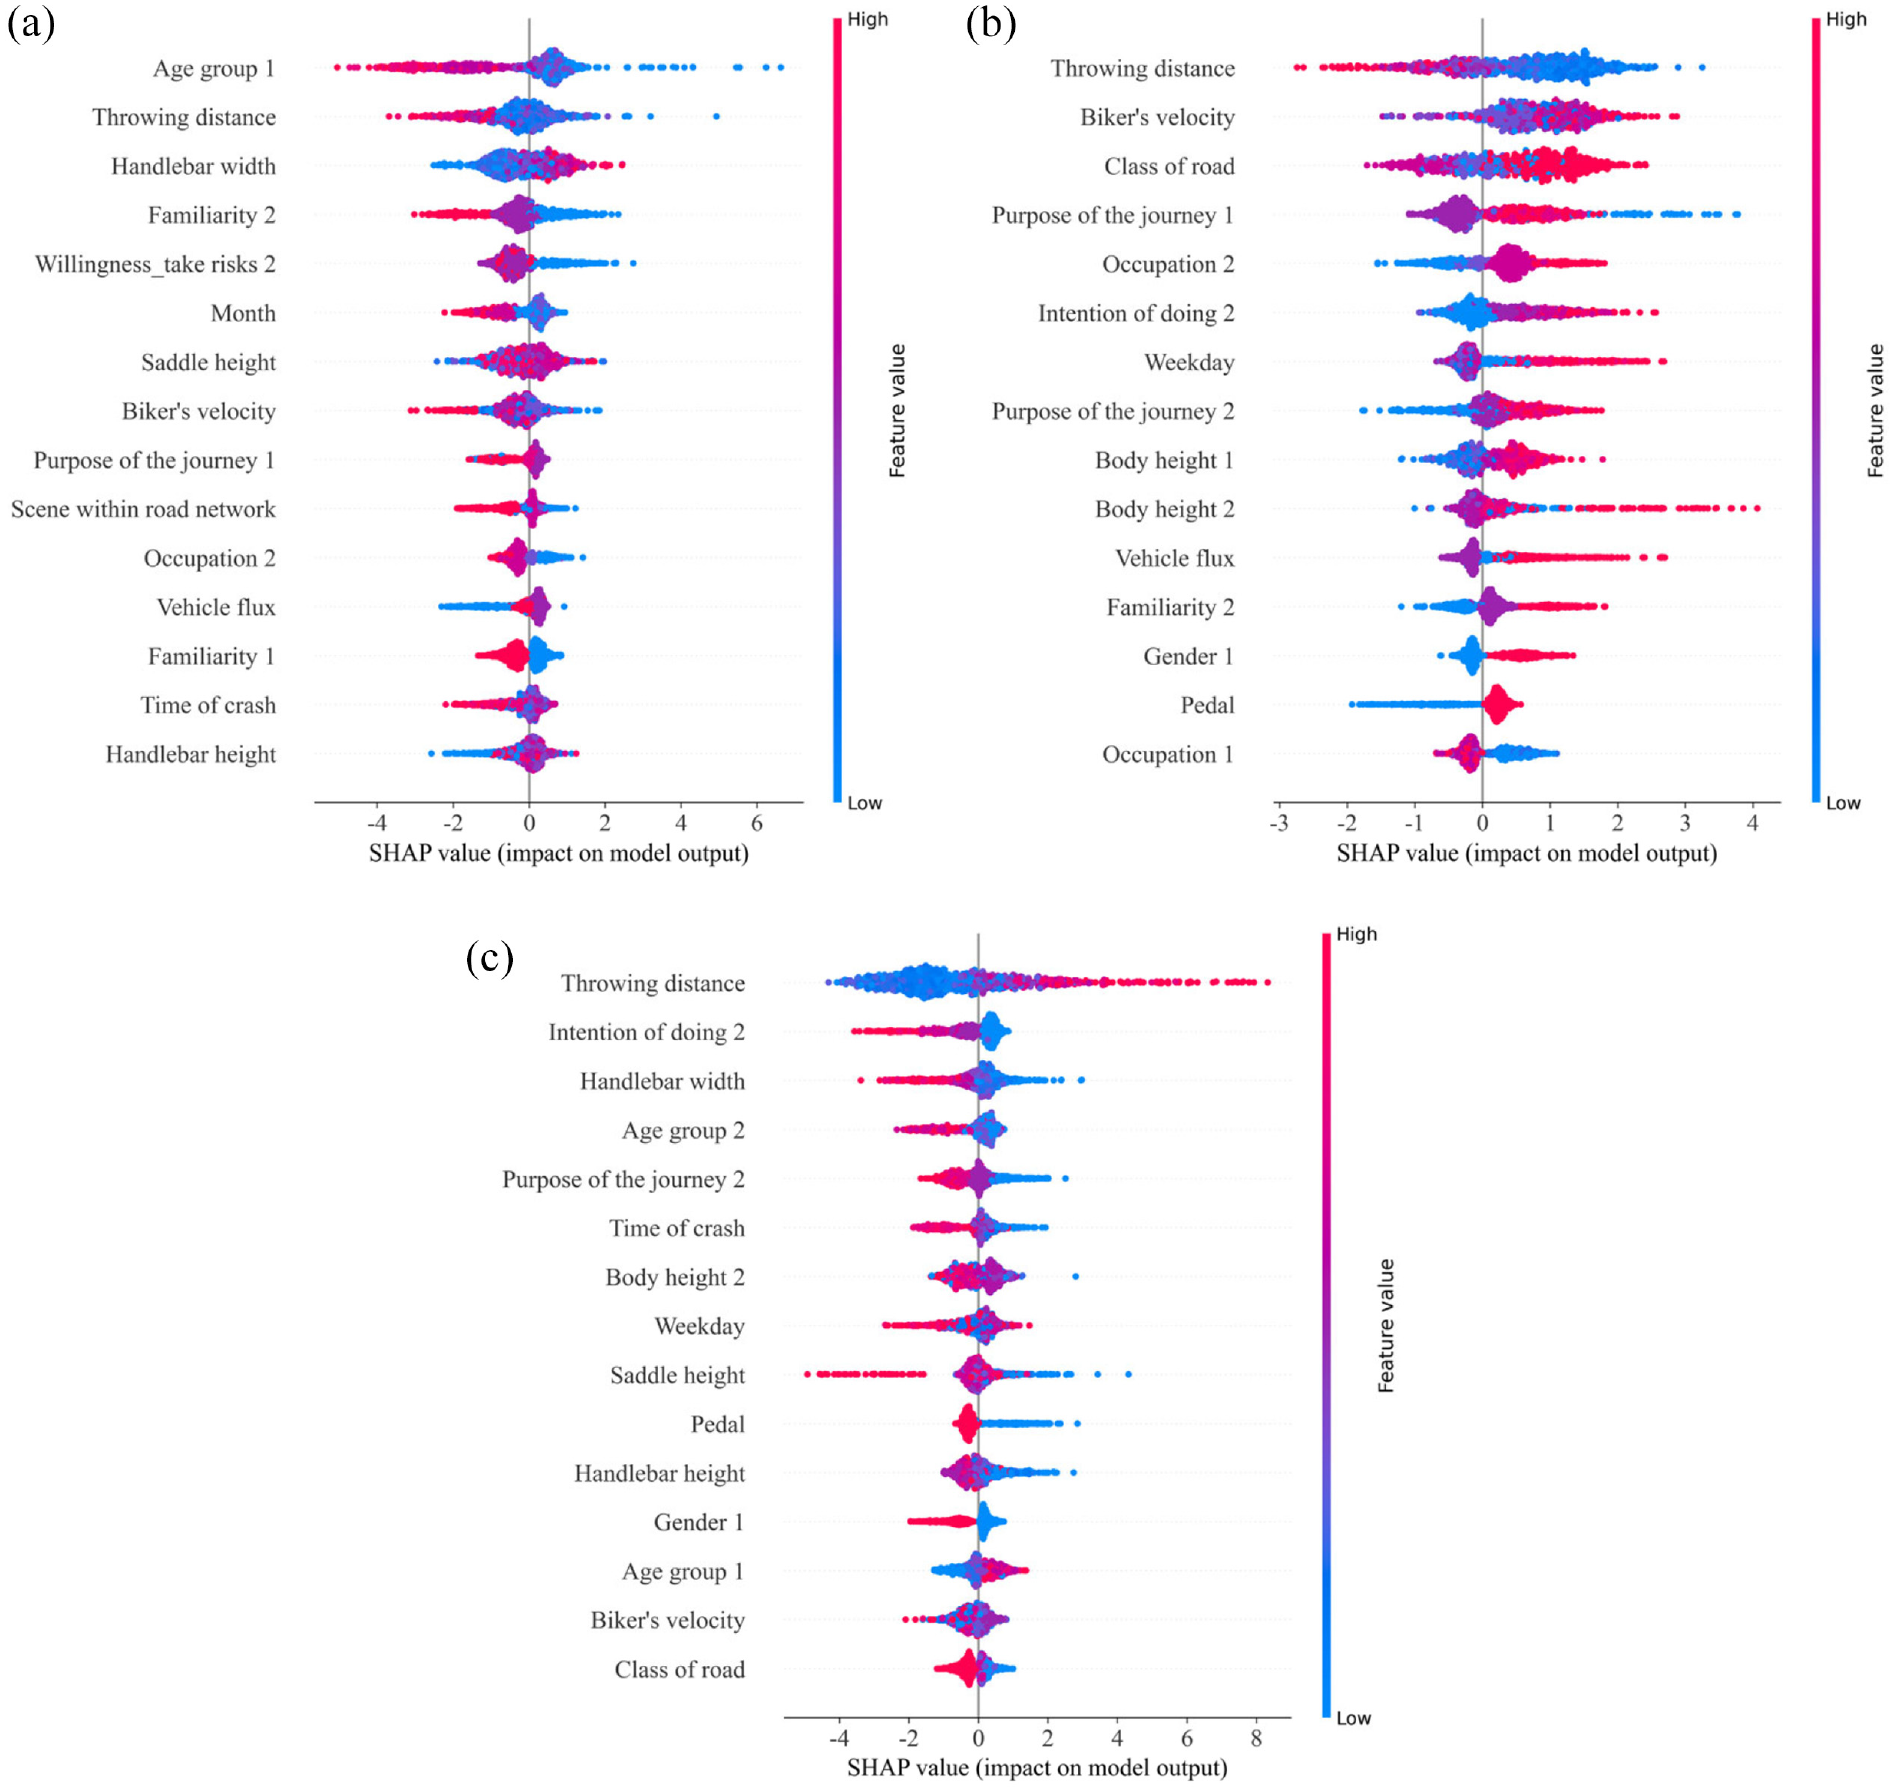
SHAP summary plot. The number 1 after the variable represents the characteristic variable belonging to the e-bike, the number 2 after the variable represents the characteristic variable belonging to the passenger car: (a) PDO, (b) SI, and (c) SIAF.
Figure 7(a) shows the SHAP summary plots of only property damage. The risk factors that have a positive impact on the consequences of only property damage in the accident are that the passenger car driver is more familiar with the surrounding area of the accident. The rider of the e-bike is relatively young and is familiar with the surrounding area of the accident. In terms of the factors of the e-bike, the e-bike travels at a slower speed, and it has a larger handlebar width, it is more likely to be classified as the only property damage accident. The detailed analysis of handlebar width is in section 5.2.
Young drivers can react relatively quickly and better avoid collision accidents in an emergency event. And for older drivers, the driver’s response to the danger in the risk scene is relatively delayed, which is likely to cause a crash accident. Considering the age of the rider, older riders are vulnerable to head injuries and greater physical decline. 40 People are more likely to have traffic accidents in familiar locations. The 45.36% of cases in places the rider pass by almost every day among all accident cases. About 50.76% of cases occurred at locations where riders passed several times a week. The number of cases in which a passenger car driver was involved in a collision in places they pass by almost every day accounted for 27.32%. About 57.39% of accidents occurred at locations that drivers passed several times a week. Research has shown that the driver’s familiarity with the route has an impact on driving behavior. Drivers usually travel faster on familiar routes, which could lead to distraction and greater self-confidence, and are more prone to being involved in collision accidents.41,42 Riders are also prone to collision accidents on familiar routes according to this study.
Figure 7(b) shows the SHAP summary plots of the importance of risk factors for riders with slight injury. Passenger car drivers often make a U-turn and an evasive maneuver before the collision. The rider is a woman, who is taller. The e-bike has a relatively fast speed. When the accident occurs on the weekend and the road type is below the rural road, the rider is more likely to be classified as a slight injury accident.
When the driver is driving the vehicle in a U-turn or taking an evasive maneuver before the collision, and when the vehicle is driving on a road type of country road and below, the speed of the passenger car is generally lower, causing slight injuries to the rider in the event of a crash accident. Riders tend to take risky driving behaviors, which can easily cause injury incidents. And research has shown that there is a high correlation between mood and driving comfort and safety. 43 A bad mood may cause unsafe riding factors such as aggressive riding or distraction, which may easily lead to crashes.
Figure 7(c) shows the SHAP summary plots of the risk factors for riders with serious injury and fatalities. The driver is relatively young, and his driving intention before the collision is general continuous driving or borrowing the opposite lane to overtake. The rider is male. When the handlebar width of the e-bike is small, the handlebar height and the saddle height are low. Electric bikes have pedals. That makes the riders have a greater likelihood of being classified as SIAF.
The speed of passenger car drivers is generally higher in the process of general continuous driving and overtaking. In addition, the electric bicyclist lacks passive protection measures, and the high collision speed is likely to cause SIAF to the bicyclist. Studies have shown that the gender of electric bicyclists has a greater impact on their long-term overspeeding behavior, and male bicyclists are more likely to overspeed than females. 44 And the accident rate of men among electric bicyclists is higher than that of females. 45 When the height of the driver is low, the height of the handlebar is low or the saddle height is low, that results in a lower head position for the bicyclist when colliding with the passenger car. And it is easy to directly collide with the front of the passenger car, causing more head serious injuries, and increasing the probability of bicyclists being seriously injury and fatalities in an accident.
Combined with the risk factors of SHAP (Figure 7) and the LightGBM model (Figure 5) analysis of the rider injury severity types. It can be found that the throwing distance has an important impact on the injury severity of the electric bicyclist. Figure 8 shows the throwing distance distribution of the SHAP value under the different injury severity types of e-bike accidents. Specifically, the rider has a greater probability of suffering PDO or SI when throwing a short distance. Electric bicyclists are more likely to suffer serious or even fatal injuries as throwing distance increases. This is consistent with cognition. The importance of other risk factors is different in the three SHAP models. This shows that in the case of different degrees of electric bicyclist injury, the impact of risk factors on accidents is different.
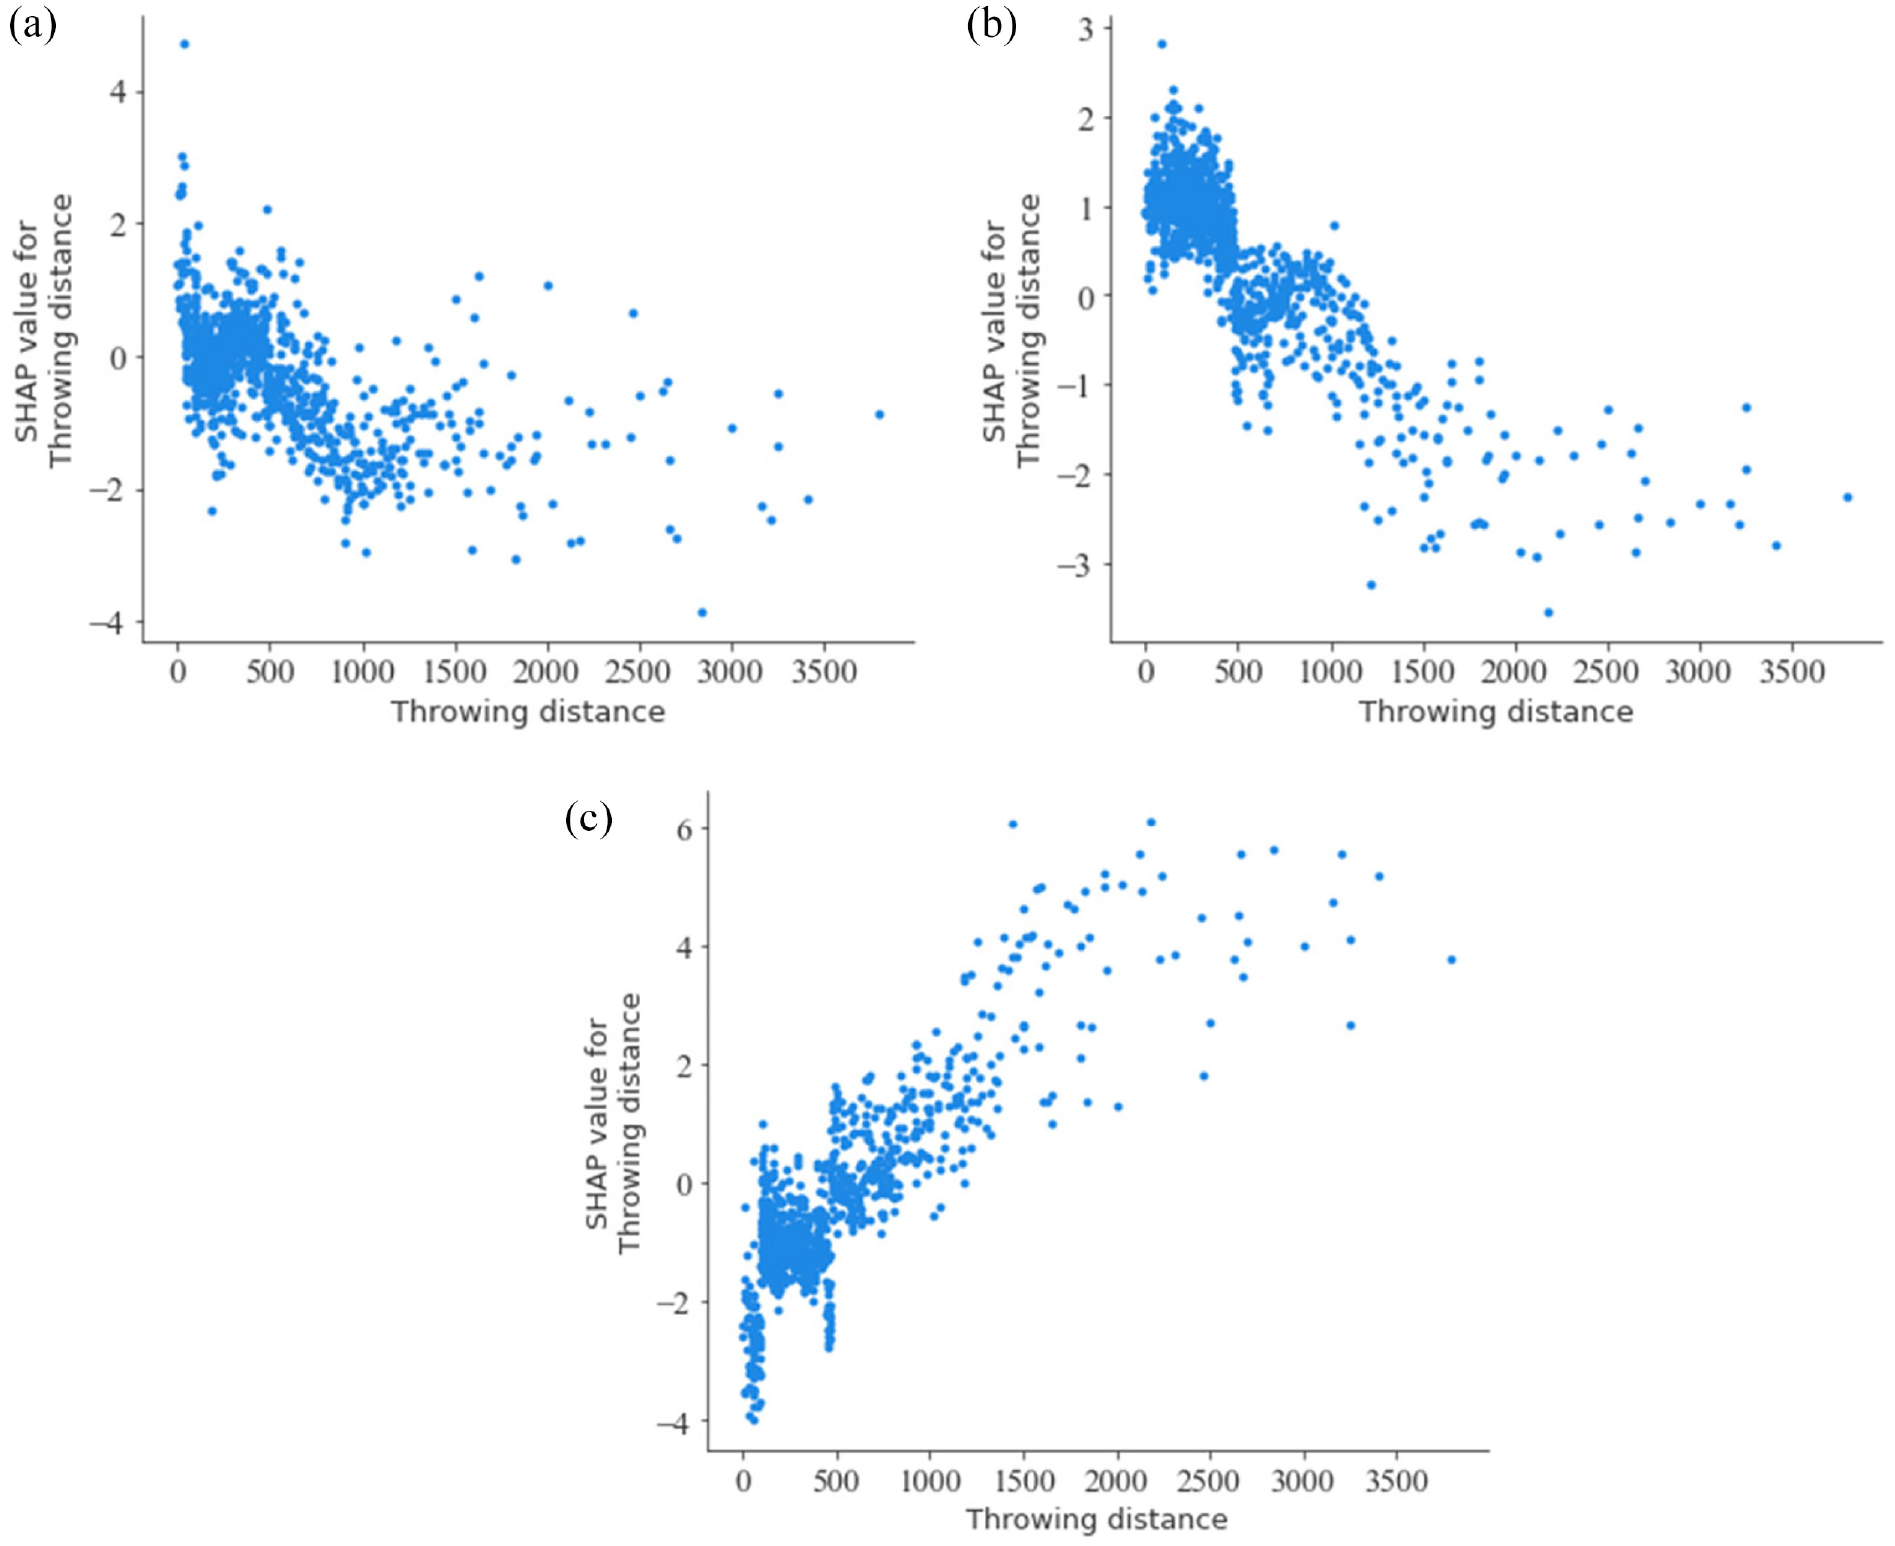
SHAP main effects plots of throwing distance: (a) PDO, (b) SI, and (c) SIAF.
The influence of risk factors
The SHAP summary plot in Figure 7 shows the qualitative relationship between rider injury severity and accident factors. Figure 8 shows the SHAP dependency plot of some important features to further investigate how feature factors affect the injury of the electric bicyclist. It not only captures the main effects of individual factors but also reflects the impact of the interaction effects between two factors on the injury of the electric bicyclist.
Figure 9(a) to (c) shows the interaction effect of passenger car driver occupation and rider throwing distance on injury severity. The horizontal axis represents the specific value of the factors and the value meaning is shown in Table 3. Occupation has a certain influence on rider speed behavior. 44 The results in Figure 9(b) show that when the passenger car driver is a worker or other occupation, a collision with slight injuries is less likely to occur. And when the throwing distance is long between these two types of occupations in a collision accident, the probability of serious injury is high. Based on this study, we found that when the driver’s occupation is employed, self-employed, and pensioner, the probability of rider with slight injury collision is higher in the accident.
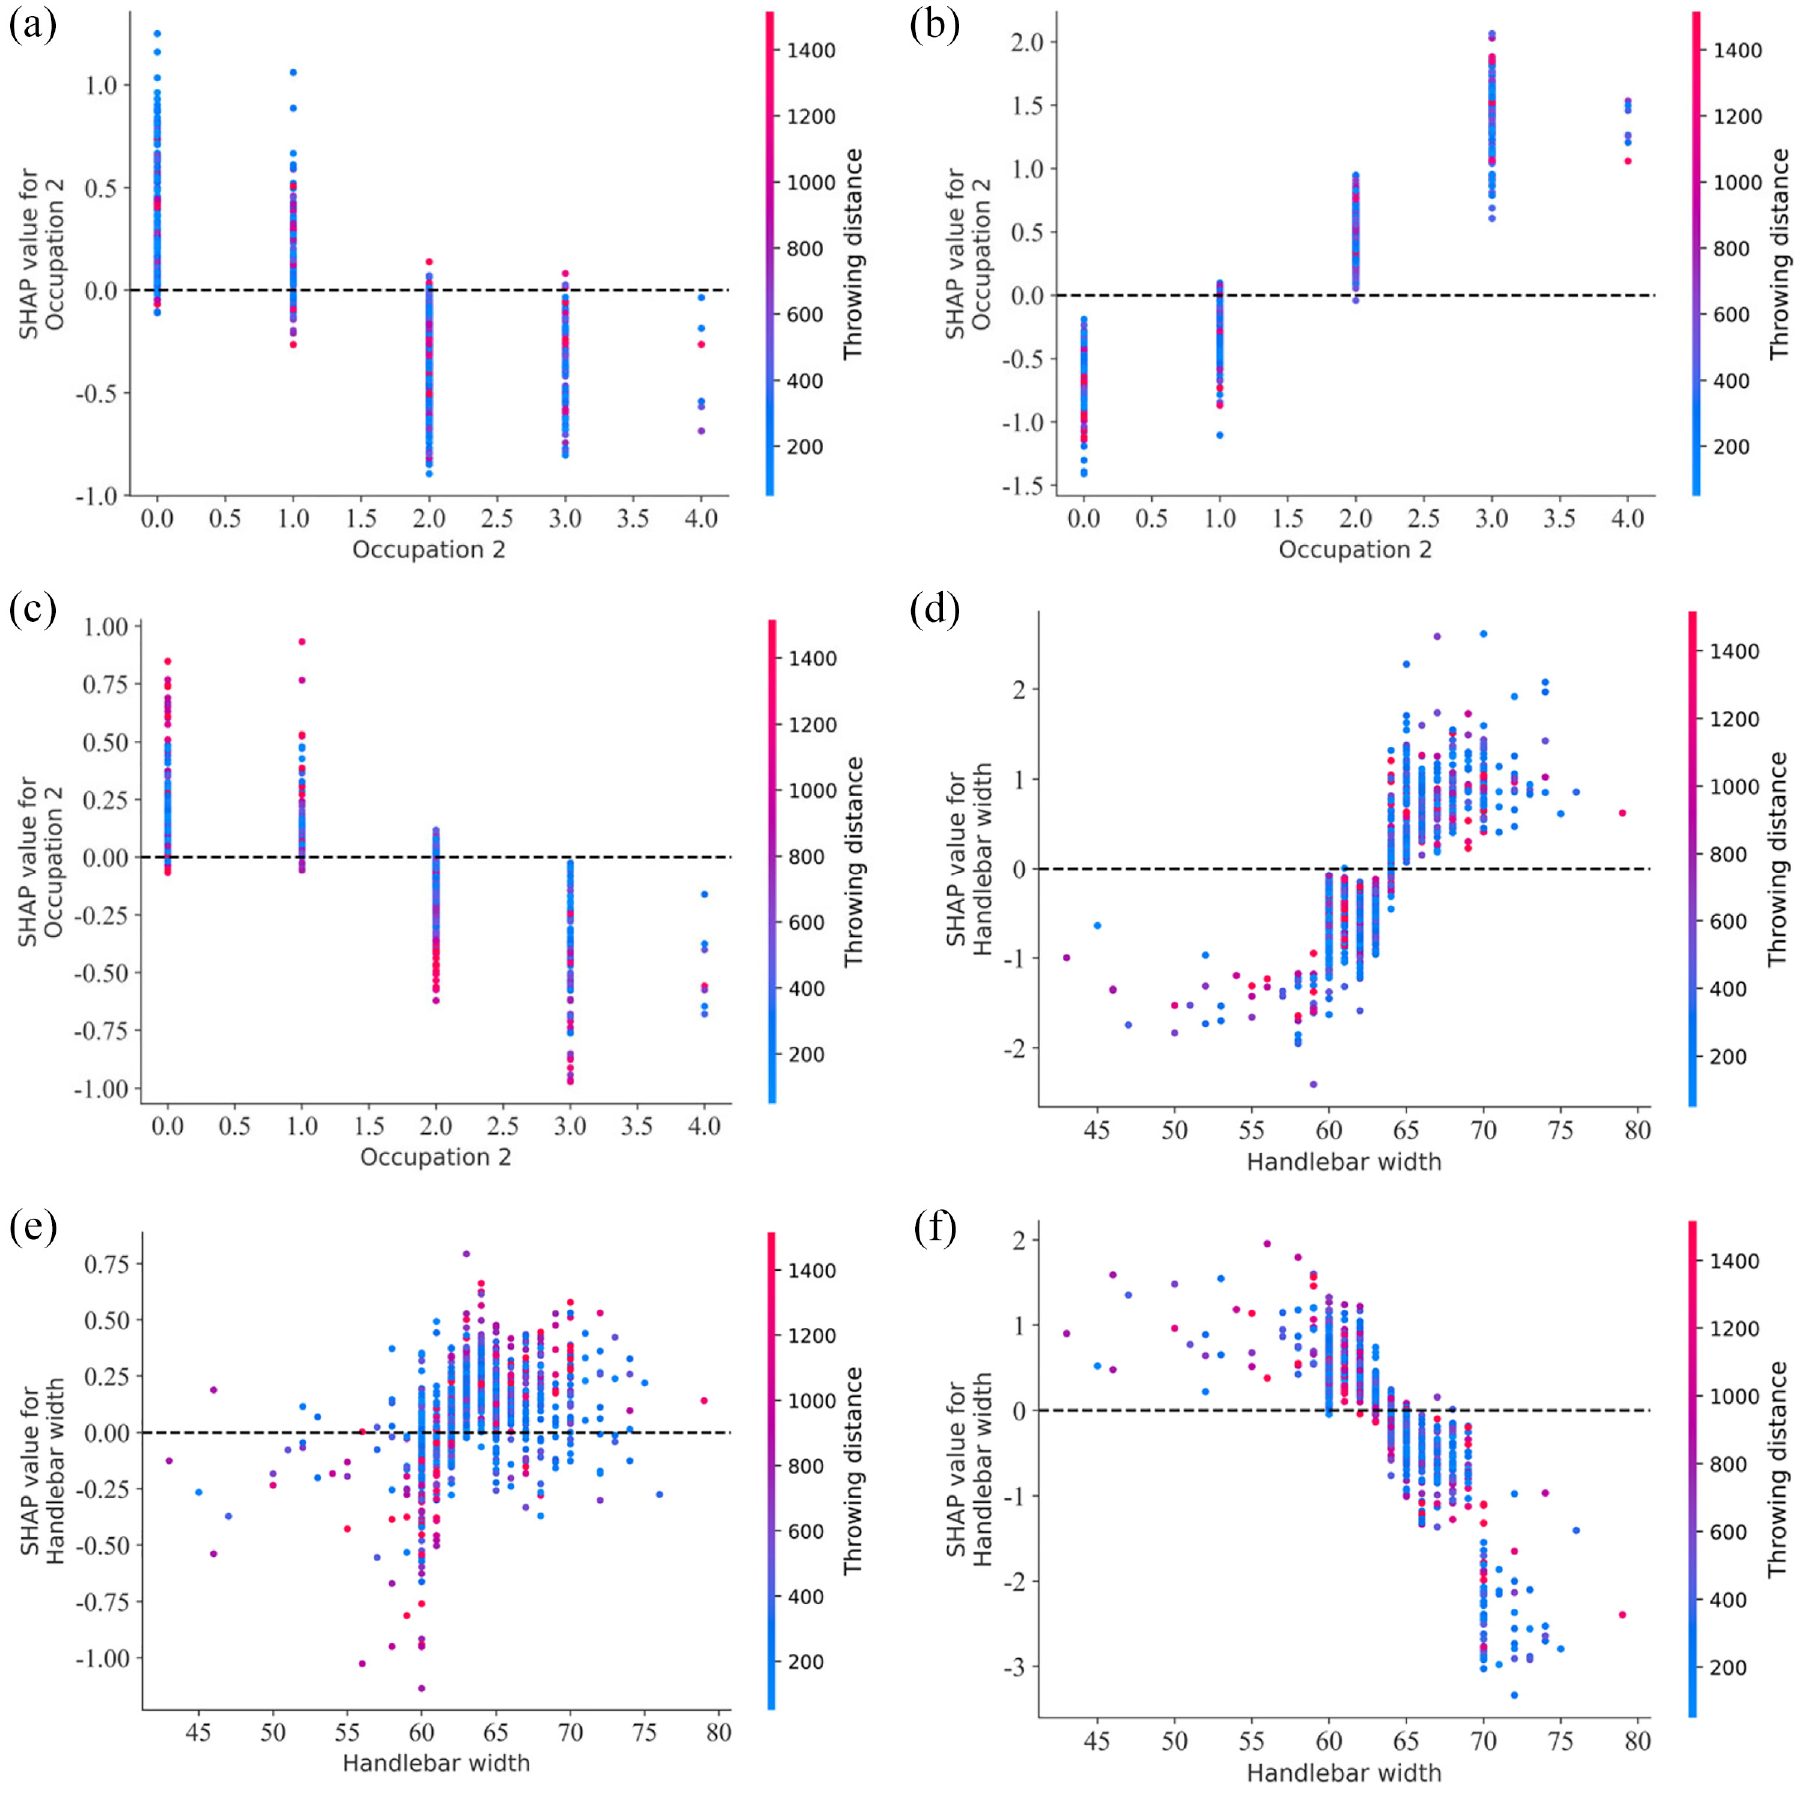
SHAP interaction effects plots: (a) PDO, (b) SI, (c) SIAF, (d) PDO, (e) SI, and (f) SIAF.
Figure 9(d) to (f) shows that the handlebar width of an e-bike is usually between 60 and 70 cm. When the handlebar width of the e-bike is <63 cm in accidents, the bicyclist is prone to serious injury and fatalities. When the handlebar width is >63 cm, the bicyclist has a higher probability of slight injury or only property damage. This shows that the larger handlebar width has a certain safety protection effect on the rider. But what needs to be considered is that when the handlebar width of the e-bike is larger, it will affect the driving it on narrow roads and narrower lanes. Therefore, it is necessary to comprehensively consider the influence of factors such as driving safety and the design of the e-bike to choose the handlebar width.
Further discussion on serious injuries and fatalities crashes
Figure 10 shows the SHAP interaction plot of the risk factors of riders in serious injuries and fatal accidents. It can be seen from Figure 10(a) that when the height of the rider is less than 165 cm, the rider is more likely to be seriously injured or fatally injured in a crash accident. When the rider’s height is higher than 170 cm, it has a negative impact on the probability of serious injury and fatal collision of the rider, but the interaction between the rider’s throwing distance and height is not obvious.
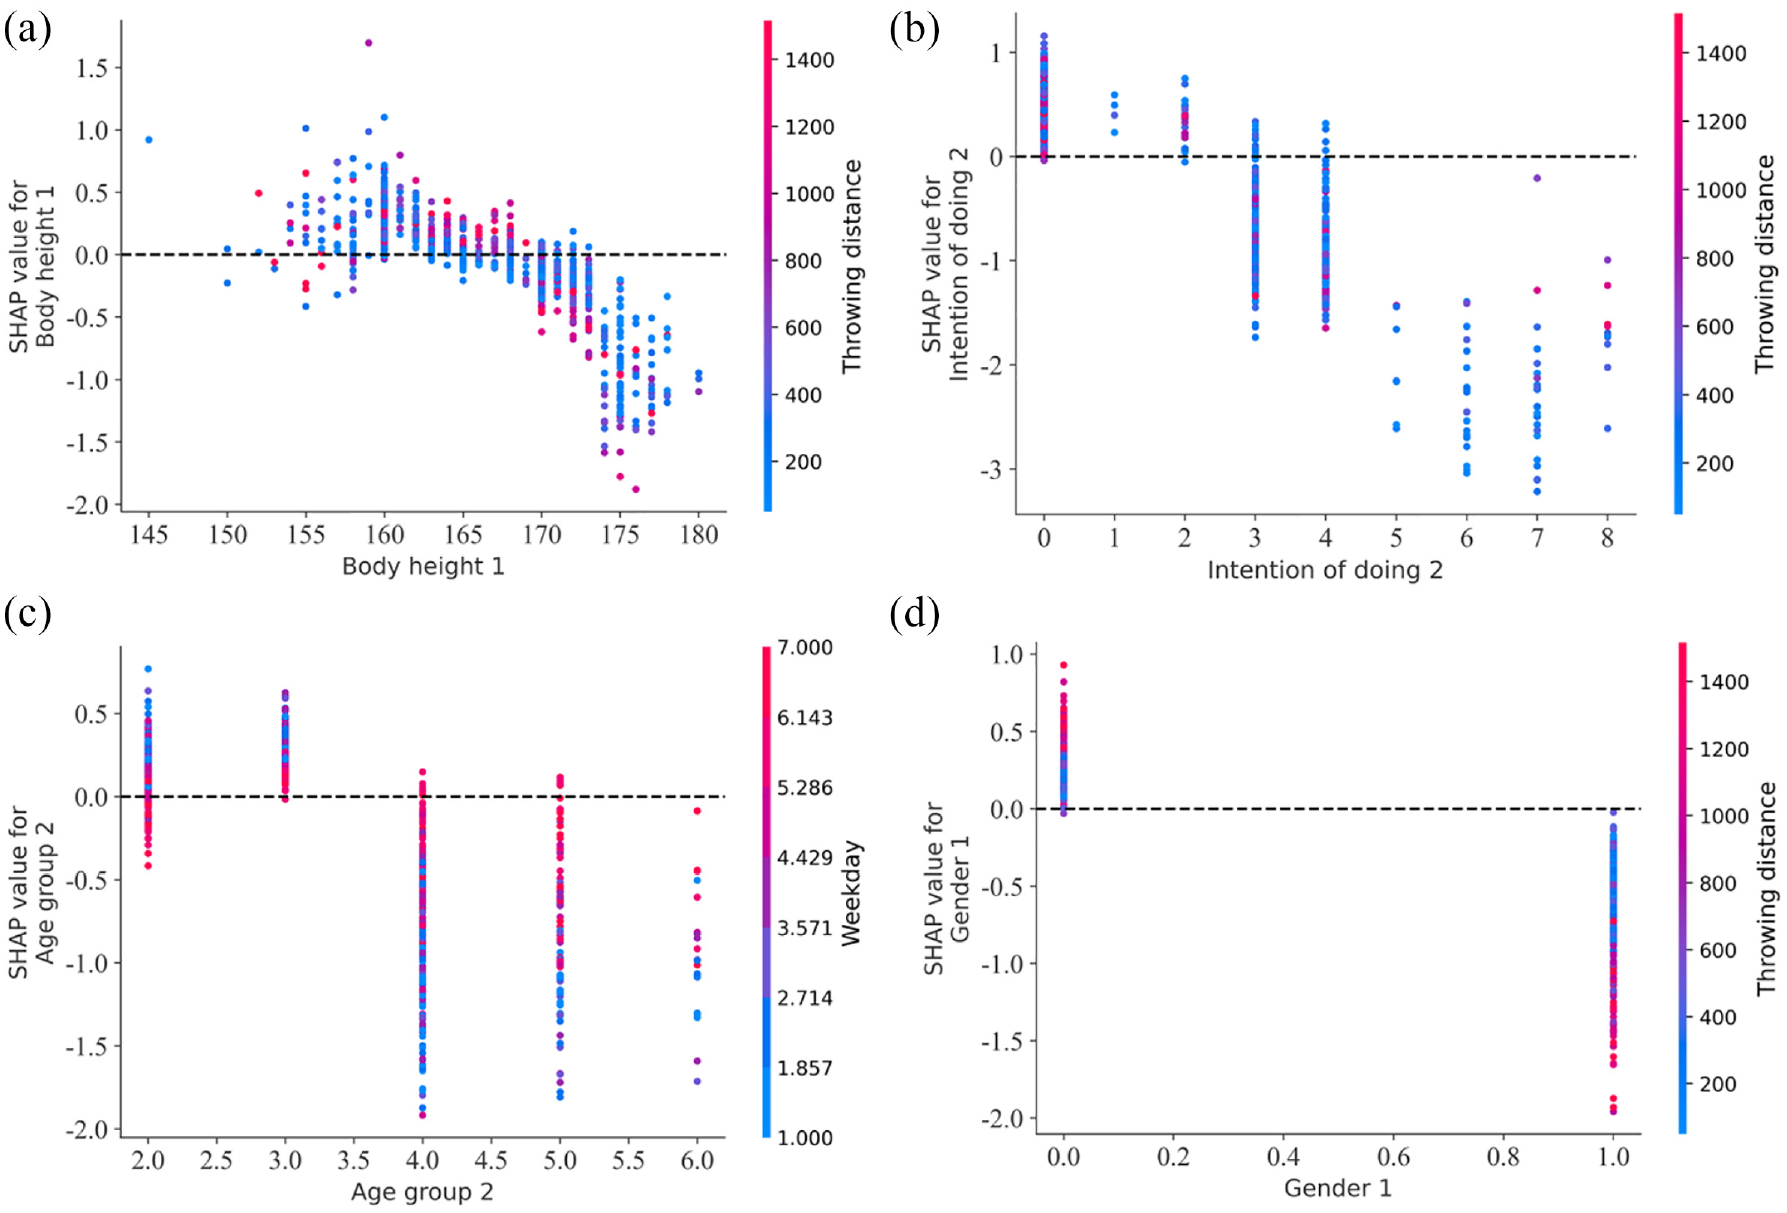
SHAP interaction plot: (a) body height of bicyclist, (b) driver’s intention of doing, (c) age group of driver, and (d) gender of bicyclist.
It could be found that when the driver’s driving intention before the collision is general continuous driving or using the opposite lane to overtake and change lanes. SIAF will occur with a high probability from Figure 10(b). This may be because the driving intentions of the driver usually maintain the speed at a relatively high level. A large impact speed will be generated once a collision accident occurs, which is likely to cause a large injury to the bicyclist. When the driver’s driving intention before the collision is to turn, stop, U-turn and other low-speed operations, resulting in a lower throwing distance for the bicyclist. In this case, the probability of serious or fatal injury to the bicyclist is low.
It can be seen that the probability of serious injury and fatal injury is high during working days from Figure 10(c). Drivers aged from 18 to 40 in e-bike accidents have a higher probability of serious injury and fatal collisions with the rider during weekday days. This may be due to the impact of morning and evening peak traffic flow on weekdays. 46 The increasing age of passenger car drivers has a negative impact on ridder’s serious injuries and fatal crashes. The rider’s probability of serious or fatal injury decreases as passenger car drivers age. This may be due to the more cautious and patient driving behavior of older drivers when driving the vehicle. 47
Studies have shown that in vehicle-pedestrian collisions, male pedestrians have a higher fatality rate per accident. 48 This study found that this phenomenon also exists in riders in passenger car-electric bicycle collision accidents. It can be seen from Figure 10(d) that when the rider is male, SHAP is a positive value, which means that the probability of serious injury or even fatal collision of male bicyclists is higher. Female riders have a negative SHAP value, meaning that female riders are less likely to be involved in serious or fatal crashes and are more likely to be involved in slight injuries in crashes (as shown in Figure 7(b)). 49 This may be because female riders are more likely to maintain a regular living and good driving habits, which can effectively reduce inappropriate driving behavior. 50 Making female drivers of e-bikes less likely to suffer from serious collisions.
Conclusion
This study takes an interpretable machine learning framework to study and analyze the risk factors that affect bicyclist crash severity in passenger car-electric bicycle collision accidents. The 2014–2018 passenger car-electric bicycle collision accidents were collected through the CIDAS dataset. After data screening and deletion of missing values, 989 cases that the accidents only involved passenger cars and electric bicycles were used for this study analysis. The injury severity of electric bicyclist accidents is divided into three types: only property damage, slight injury, and serious injury and fatalities. Through the comparative analysis of six machine learning methods, accuracy, precision, recall, F1-Score, AUC evaluation indicators, and ROC curve are used to comprehensively evaluate the performance of the algorithm. Finally, the LightGBM algorithm is selected with better classification performance, and its better data mining and optimization algorithm is used to predict the injury severity of electric bicyclists with higher accuracy based on fewer accident data. The interpretability of the LightGBM algorithm is further extended by using the SHAP method. The effects of different risk factors and their interaction effects on bicyclist injury severity were analyzed by identifying important risk factors.
The risk factor analysis results of injury severity of bicyclists in passenger car-electric bicycle accidents can provide references and suggestions for traffic management departments to prevent the occurrence of electric bicyclist collision accidents and reduce accident injuries. The results found that the throwing distance of the bicyclist is an important factor to predict the injury severity of the bicyclist. The farther the throwing distance is, the greater the chance of the bicyclist being seriously injured or even killed. Human factors play an important role in accidents. Bicyclists who are male, and shorter are more likely to be seriously injured in a crash accident. E-bikes have a smaller handlebar width, lower handlebar height, and lower saddle height, which have a positive impact on the bicyclist’s injury severity.
Footnotes
Declaration of conflicting interests
The author(s) declared no potential conflicts of interest with respect to the research, authorship, and/or publication of this article.
Funding
The author(s) disclosed receipt of the following financial support for the research, authorship, and/or publication of this article: This work was supported by the National Key R&D Program of China (Grant No. 2019YFE0108000) and Scientific Innovation Practice Project of Postgraduates of Chang’an University (Grant No. 300103722024).
Data availability
The data used to support the findings of this study are available from the corresponding author upon request.