
Abstract
BACKGROUND:
There is insufficient knowledge about the rate of force development (RFD) characteristics over both single and multiple joint movements and the electromechanical delay (EMD) values obtained in athletes and untrained individuals.
OBJECTIVE:
To compare single and multiple joint functions and the neural drive of trained athletes and untrained individuals.
METHODS:
Eight trained athletes and 10 untrained individuals voluntarily participated to the study. The neuromuscular performance was assessed during explosive and maximum voluntary isometric contractions during leg press and knee extension related to single and multiple joint. Explosive force and surface electromyography of eight superficial lower limb muscles were measured in five 50-ms time windows from their onset, and normalized to peak force and electromyography activity at maximum voluntary force, respectively. The EMD was determined from explosive voluntary contractions (EVC’s).
RESULTS:
The results showed that there were significant differences in absolute forces during knee extension maximum voluntary force and EVC’s (
CONCLUSIONS:
The differences in explosive performance between trained athletes and untrained individuals in both movements may be explained by different levels of muscle activation within groups, attributed to variation in biarticular muscle function over both activities.
Introduction
Dynamic exercise involves multiple rapid joint movements and rhythmic contractions, where movements occur about several joints simultaneously [1]. Success in intense dynamic sports such as sprinting and jumping demands large explosive muscular contractions, which last approximately 50–250 ms [2, 3]. However, the time required to reach maximum force in some human muscles may exceed 300-ms [4]. Therefore, individuals with a large contractile rate of force development (RFD) (the slope of the force-time curve) will achieve greater force production during the initial phase of dynamic movement possibly leading to enhance performance during explosive contractions. Electromechanical delay (EMD), the time interval between the change in electrical activity at the muscle and the generation of force [5] is also an indicator of rapid neuromuscular performance. Theoretically, shorter EMD latencies would improve explosive performance by reducing muscle activation response time.
RFD and EMD are descriptors of performance in explosive contractions [5] however, studies comparing these physiological characteristics in trained athletes (TA) and untrained individuals (UTI) are limited and predominantly centred on single joint activities; yet information from multi-joint assessment is more related to dynamic performance [6]. It could be expected that differences, if any, between the groups may be more pronounced in more complex multi-joint tasks, as multiple joint movements are believed to require greater coordination and rely more heavily on muscle activation [7].
RFD, which describes the ability of the neuromuscular system to develop rapid action velocities, has been suggested to be the most important variable determining performance in explosive movements [8, 9, 10]. It is likely that the enhanced RFD in athletic groups is due to physiological adaptations to their training. Indeed, RFD can be improved specifically through resistance exercises designed to improve explosive performance [8]. Dynamic strength training regimens can enhance the afferent neural drive (the sum of the spiking activities of motor neurons) to muscles [11] leading to improved efferent neural responses [12], resulting to a shift of the force-time curve to the left [13] and subsequent increase in development of explosive strength [14] and thus, RFD. The link between neural activation and RFD is further evidenced by the strong positive relationships between both factors, documented by de Ruiter et. al. [9]. The degree of synchronicity in activation onset of agonist muscles may further influence RFD [5].
EMD depicts the time required for propagation of an action potential, the excitation contraction coupling process, initial tension development and stretching of the series elastic components (SEC) to remove the natural slack, thereby facilitating force transmission [15]. Explosive sporting activities such as sprinting, involve repetitive muscle stretch-shortening actions resulting in high muscle-tendon stiffness [16]. Stiffer tendons remove series elastic components slack at a faster rate by allowing increased tension development for each unit change in length of the muscle fibres, as validated by Blackburn et. al. [17], resulting in shorter EMD.
The insufficient knowledge concerning RFD characteristics over both single and multiple joint movements and the equivocal EMD results obtained with TA and UTI warrants further investigation. The purpose of this study was to compare the single and multiple joint functions and the neural drive of TA and UTI. Specifically, to compare the RFD and EMD in both groups during voluntary isometric contractions of the knee extensors and muscles involved in the leg press activity. Comparison of neural activation via analysis of electromyography (EMG) recordings may assist in delineating any observed differences in muscular performance between the groups over both tasks.
Methods
Partcipants
Eighteen healthy men [(TA):
Procedure
The partcipants visited the laboratory for 60–120 min on two separate occasions separated by 7–10 days. Visits consisted of a familiarization and a test trial (conducted between the hours of 12.00 and 18.00). During both tests, subjects completed two seated exercises with their dominant legs. A modified leg press device (Precor, Woodinville, WA) and an isometric strength testing chair [18] were used to perform isometric maximum voluntary contractions (MVC) and explosive voluntary contractions (EVC) of the muscles. Measurements were taken in the following order: 1) leg press MVC’s, 2) leg press EVC’s, 3) knee extension MVC’s, and 4) knee extension EVC’s. Surface EMG of the Gluteus Maximus (GMAX), Vastus Medialis (VM), Vastus Lateralis (VL), Rectus Femoris (RF), long head of the Biceps Femoris (BF), Semitendinosus (ST), Soleus (SOL) and Gastrocnemius Lateralis (GL) were recorded throughout these contractions.
Surface EMG measurements
Surface EMG was obtained from the dominant leg muscles in the leg press and the knee extension, using two Delsys Bagnoli-4 EMG systems (Delsys, Boston, MA). After the skin was made ready by shaving, lightly abrading, and cleansing with 70% ethanol, double differential surface electrode configurations (10 mm inter-contact distance, model DE-3.1; Delsys, Boston, MA) were positioned at standardized percentages of the length measured from sacral vertebrae to greater trochanter (GMAX, 50%), from the anterior spina iliaca superior to the joint space in front of the anterior border of the medial ligament (VM, 80%), from the anterior spina iliaca superior to the lateral side of the patella (VL, 65%), from the anterior spina iliaca superior to the superior part of the patella (RF, 50%), from ischial tuberosity to medial epicondyle of the tibia (BF, 50%; ST, 50%), from medial condyle of femur to medial malleus (SOL, 66%), and head of the fibula to calcaneus (GL, 33%) [19]. The reference electrode was placed on the patella of the same limb for each subject. The same investigator completed skin preparation and surface electrode placement across all subjects. EMG signals were amplified (x100 using a differential amplifier, 20–450 Hz) and sampled at 2000 Hz with the aforementioned analogue to digital converter (Micro 1401; CED, Cambridge, UK) and PC software (Spike2, CED, Cambridge, UK). All EMG signals underwent a band-pass–filtered in both directions between 6 and 500 Hz using a second-order Butterworth digital filter.
Isometric leg press force measurements
Participants were firmly secured to the leg press with a waist belt. A 20 cm
Isometric knee extension force measurements
Subjects were tightly secured to the strength-testing chair using a waist belt and shoulder straps. Hip and knee angles were fixed at
Maximal Voluntary Contractions (MVC’s) and data analysis (force and EMG)
The participants completed a two-minute warm up of submaximal contractions before three isometric MVC’s separated by
Explosive Voluntary Contractions and data analysis (force, EMG, and EMD)
A series of 10 EVC’s with 20-s rest between efforts was performed. Subjects were asked to relax in order to avoid any pretension or countermovement, and respond as rapidly as possible to an auditory signal (3-2-1-go) by attempting to extend their dominant leg/knee as “fast and hard” as ossible for approximately one second. During all contractions emphasis was placed on “fast” as described with Maffiuletti et al. [21]. The baseline force was displayed on a high-resolution scale on the PC monitor, enabling fluctuations to be identified. Also displayed was the slope of the force-time curve (5-ms time constant), providing direct feedback on the RFD via the peak slope of each EVC. The RFD was mainly determined by the capacity to produce maximal voluntary activation in the early phase of an explosive contraction (first 50–75 ms), particularly as a result of increased motor unit discharge rate [21].
Maximal Voluntary Force of trained athletes (TA) (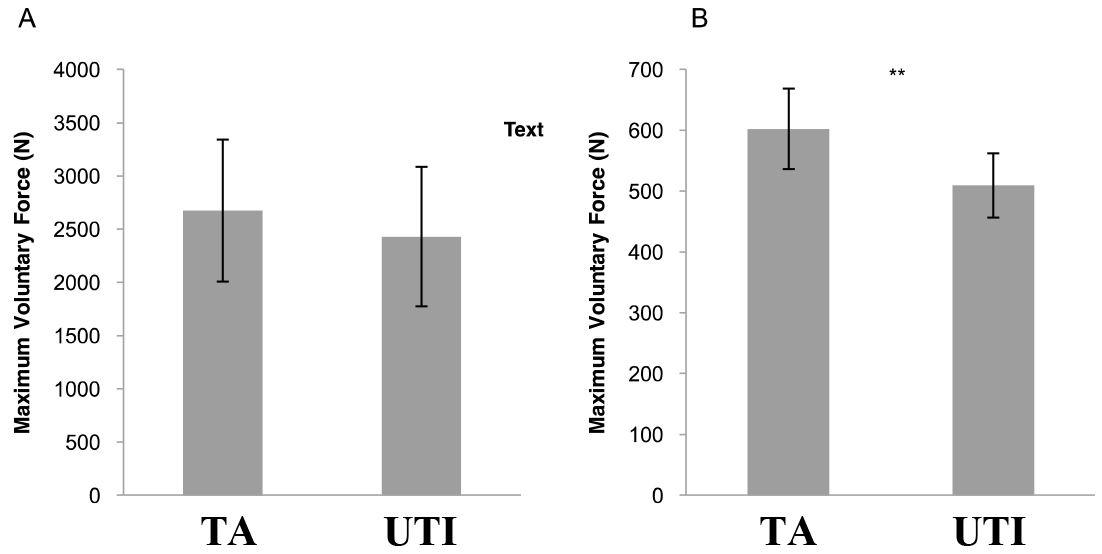
Absolute (A) and normalized (B) rate of force development (RFD) of trained athletes (light bars; 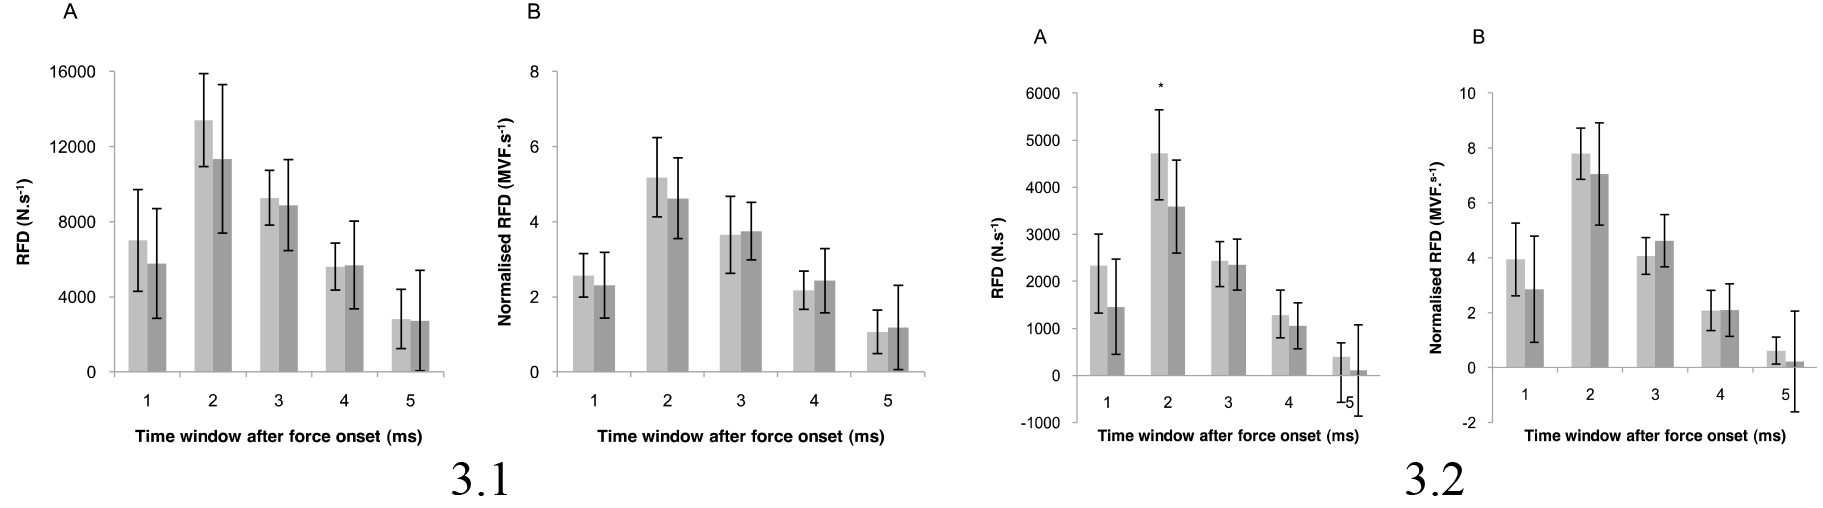
The three contractions with the highest peak of the force-time curve for each individual meeting the following criteria were analysed:
Absolute and relative strength values for trained athletes (TA) (
Data are means
Absolute force relative to body mass (relative strength) for trained athletes (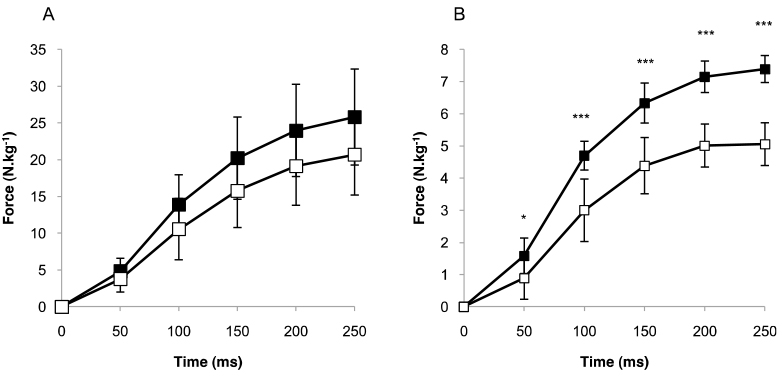
Identification of force and EMG onsets for all contractions was done manually (visually), considered to be the optimum method, having greater sensitivity, precision and accuracy compared to automated mathematical models [5]. Visual inspection can detect onsets approximately 60-ms earlier compared to computerized algorithms [23, 24]. All signal onsets were determined and analysed by the same investigator. Each signal recording was viewed on a consistent scale to allow onset detection to be differentiated from the noise pattern. The EMG standard view was the same for both activities (x-axis scale of 500-ms and y-axis scale of 10 mV). The standard view for force consisted of an x-axis scale of 500-ms and a y-axis scale of
Statistical analyses
Results are presented as means
Results
Voluntary force and RFD
No statistical difference between groups in leg press MVF was detected (Fig. 1A). TA produced 18.3% greater MVF compared to UTI during isometric contraction of the knee extensors (
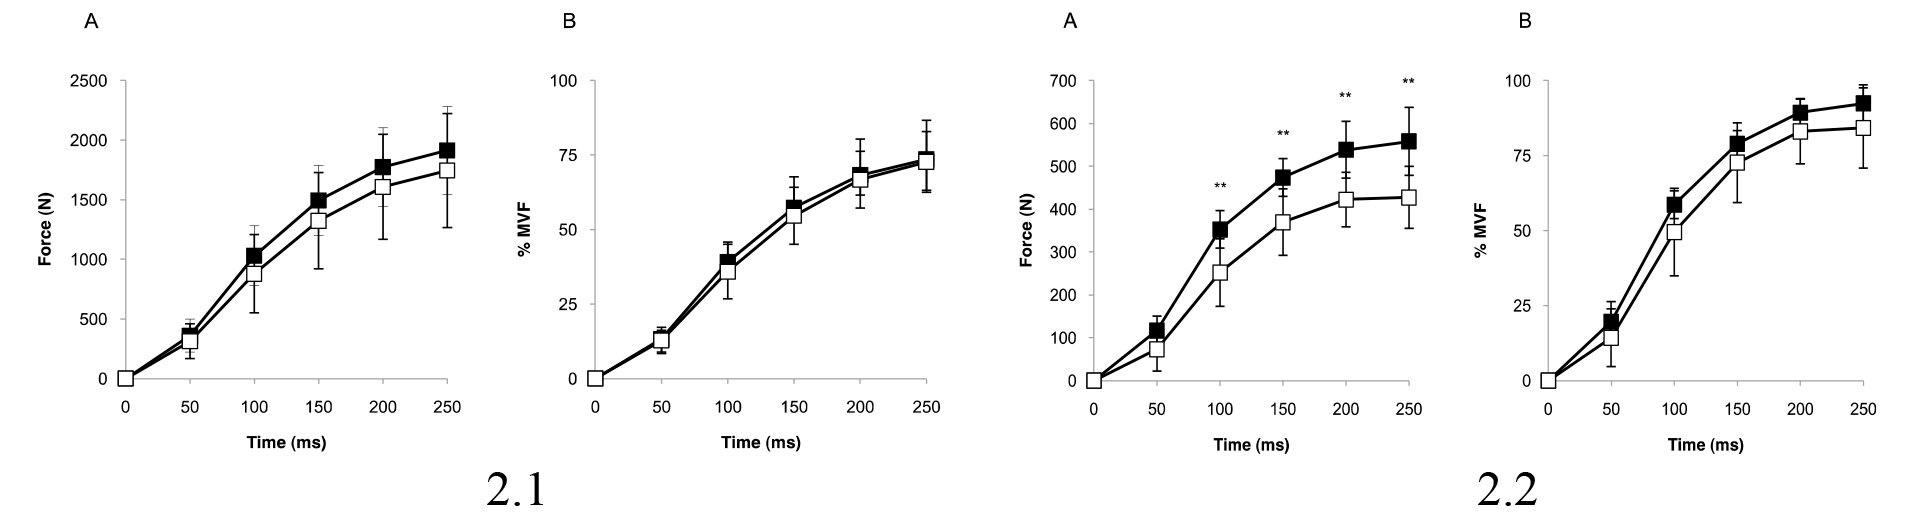
There was no significant effect of group on absolute force (Fig. 2.1A), and subsequently levels of absolute RFD (Fig. 3.1A) were similar between the groups during leg press EVC’s. Normalized force (Fig. 2.1B) and RFD (Fig. 3.1B) were comparable. TA produced a greater absolute force at 100, 150, 200 and 250 ms during EVC’s of the knee extensors (
While there was no statistically significant effect of group on relative strength during leg press EVC’s (Fig. 4A), TA attained significant higher relative strength values at all five time periods (
Neural activation during explosive contractions
The order of muscle activation onset during the EVC’s was not consistent within or between subjects of either group over both tests. TA and UTI achieved comparable time differences between the activation onset of the first and last muscle and first and last agonist muscle during the leg press and knee extensor contractions.
When RMS of the EMG signal was normalized to RMS EMG at MVF, no differences between groups for any muscle or muscle group in any time window was observed in the leg press activity. In relation to knee extension, normalized EMG of the mean superficial quadriceps over all five-time periods was similar for TA and UTI (Fig. 5). There was a significant main effect of group on normalized EMG of the main antagonists, the mean hamstrings (
Electromyography amplitude of the Vastus Medialis (VM), Vastus Lateralis (VL), Rectus Femoris (RF), mean hamstrings and mean superficial quadriceps at maximum voluntary force of trained athletes (
8) over both activities
Electromyography amplitude of the Vastus Medialis (VM), Vastus Lateralis (VL), Rectus Femoris (RF), mean hamstrings and mean superficial quadriceps at maximum voluntary force of trained athletes (
Data are means
Root mean square (RMS) electromyography (EMG) of the mean superficial quadriceps for trained athletes (black squares; 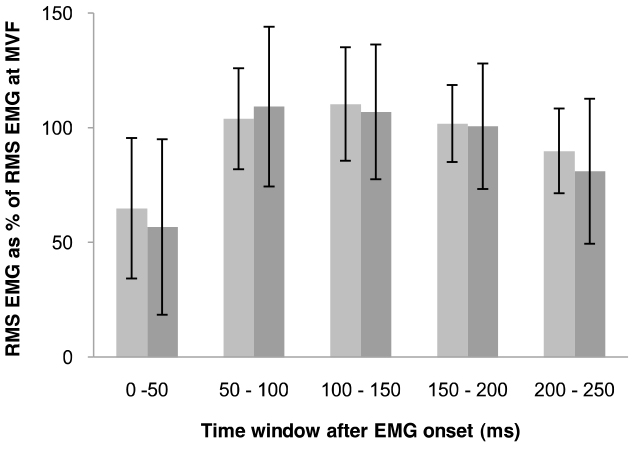
Comparison of the RMS EMG amplitude at MVF within groups revealed differences over both activities. Significant differences in the EMG activity levels of the VM, VL, RF, mean hamstrings and mean superficial quadriceps were identified in the TA (
Electromyography amplitude of the soleus (SOL), Gastrocnemius Lateralis (GL), Gluteus Maximus (GMAX), Vastus Medialis (VM), Vastus Lateralis (VL), Rectus Femoris (RF), mean calves and mean superficial quadriceps at MVF of untrained individuals (
Data are means
Furthermore, differences in EMG levels during EVC’s within groups over both tests were identified. TA had significantly different RMS EMG amplitudes of the VM, VL, RF, mean hamstrings and mean superficial quadriceps (
TA and UTI had similar EMD
Discussion
The present study compared the RFD, neural activation and EMD of TA and UTI during EVC’s of the muscles involved in the leg press and the knee extensors. During leg press EVC’s, TA and UTI achieved similar levels of absolute and normalised force and RFD. Correspondingly, normalised EMG of all muscles and muscle groups and relative strength were comparable. TA had a greater absolute force at 100, 150, 200 and 250 ms during EVC’s of the knee extensors, resulting from higher absolute RFD during the 50–100 ms time period and greater absolute force relative to body mass at all five time points. Surprisingly, normalised force and normalised RFD did not differ between the groups and no discrepancies in normalised EMG of the mean superficial quadriceps were noted. EMD levels were comparable between groups however TA and UTI had significantly different EMG activity levels of a number of muscles over both activities. This is the first study to show that differences between TA and UTI in single and multiple joint movements exist, and appear to be related to discrepancies in muscle activation within the groups over both activities.
The leg press EVC’s, TA and UTI achieved similar levels of absolute force at all time points (Fig. 2.1A); consequently, no difference in levels of absolute RFD (Fig. 3.1A) was reported. The force produced at specific time points and absolute RFDs are related to muscle strength and MVF [3, 25]. Therefore, the similarities in MVF obtained between TA and UTI (Fig. 1A) may explain the comparable force and RFD levels reported, as normalized force and normalized RFD (Figs 2.1B and 3.1B) were similar. The study results of Tillin et. al. [5] are the most comprehensive to date, reporting higher absolute and normalised RFD in explosive power athletes, attributed to greater agonist muscle neural activation. Comparisons of RFD within the athletic population has revealed greater absolute RFD in strength-trained athletes (different weight categories) and power-athletes (sprinters) compared to endurance-trained individuals [26]. When RFD is normalized to maximum voluntary force (MVF), the difference between explosive, strength and endurance athletes and untrained individuals is equivocal [26, 27]. In these studies, RFD was calculated at time points that corresponded to varying percentages of MVF, possibly explaining the contrasting results. In addition, possible causes for the variation of RFD between groups were not elucidated. Neural activation, as measured by EMG amplitude, influences RFD [5, 8, 9, 12]. Indeed, de Ruiter et. al. [9] concluded that RFD capacity may be dependent on the level of muscle activation (as measured by preceding surface EMG) at the contraction onset. When RMS of the EMG amplitude for each muscle and muscle group over each time period was normalized to RMS of the EMG signal at MVF, no difference between groups was reported. This is not surprising as both absolute and normalized RFD levels were comparable. Furthermore, the similarities in synchrony of activation onset and EMD
While absolute RFD is imperative in explosive powerful performances [9] and information on the physiological mechanisms of this characteristic are somewhat provided by examining normalized RFD, it is probable that the relative strength ratio is of greater functional relevance. Dynamic explosive activities require individuals to maintain joint stabilization whilst propelling their body weight. Accordingly, relative strength may provide a better indication of explosive performance. In contrast to the study results of Viitasalo and Komi [27], TA and UTI in the present study had similar levels of relative strength at all time points (Fig. 4A), possibly contributing to the similar levels of absolute force obtained.
TA achieved greater absolute force at 100, 150, 200, and 250 ms (Fig. 2.2B) during knee extension EVC’s, owing to a combination of their greater absolute RFD during the 50–100 ms time period (Fig. 3.2B) and relative strength values at all five time points (Fig. 4B). MVF was 18.3% greater in the same group, implying that this difference in strength could account for the 32% higher absolute RFD attained as no difference in normalized force or normalized RFD were reported (Figs 2.2B and 3.2B). Tillin et al. [5] also reported greater levels of absolute force and RFD in TA compared to UTI during EVC’s of the knee extensors. However, while the authors reported greater normalized mean quadriceps EMG amplitude, this study found similar levels between the groups, which, coupled with the similar normalized antagonist EMG levels, are possibly the main factors contributing to the comparable normalized RFD levels between TA and UTI. The positive correlation between neural activation and voluntary isometric knee extensor RFD [9] appear to support this neurologic explanation. The synchrony in activation onset and EMD
One limitation to the present study was the normalisation of RMS EMG to MVF, as normalising to a supramaximal compound muscle action potential (M-wave) may be more appropriate [30]. EMD
The present study results indicate that while discrepancies in the physiological characteristics were evident in the single joint knee extension, no differences between groups in the multi-joint leg press activity were found. This is surprising considering the anticipated greater difference between groups in the multi-joint movement due to a higher degree of muscle co-ordination and activation [7, 39]. This phenomenon may be related to muscle function during both tasks rather than the inherent physiological characteristics of the groups. The quadriceps are the only contributors to force generation during knee extension [40], while force production during leg press is dependent on a wider range of muscles and muscle groups [40, 41]. Reports have indicated that the EMG activity of individual muscles in the knee extension is not consistent with that of the same muscles during leg press [42, 43]. The results of this study would concur. TA elicited significantly different EMG activity levels of the VM, VL, RF, mean hamstrings and mean superficial quadriceps at both MVF (Table 2) and during the EVC’s in both tests. UTI had different EMG levels of all muscles and muscle groups except the ST, BF and mean hamstrings at MVF, while activity levels of the BF and mean hamstrings were the only similarities found during the EVC’s (Table 3). Due to the relationship between neural activation and RFD [9], it is likely that the discrepancies in muscle activation within groups over both tasks may account for the differences in RFD and thus explosive performance between groups, during single and multi-joint movements.
Whether a muscle is mono- or biarticular is most likely the primary factor contributing to discrepancies in muscle activation in single and multiple joint movements, as these muscle types exhibit different roles in such activities [44]. It has been suggested that the RF, a knee extensor agonist, may act as an antagonist during the leg press by flexing around the hip joint, which would reduce the activity level of this superficial quadricep [43]. The decrement in RF activity in the leg press compared to the knee extension in both groups (Tables 2 and 3) would appear to support this proposal. In addition, the bi-articular ST, BF (mean hamstrings) and GL act as agonists during the leg press but perform antagonistic roles during knee extension [2, 45], reinforced by the different EMG levels of these muscles in the groups during both activities (Tables 2 and 3). Force production is inherently related to muscle activation. Due to different operational mechanisms of several of the muscles tested over both single and multiple joint tasks, one may appreciate that differences between TA and UTI in the knee extension does not translate to a difference between the same groups in the leg press.
The results of the present study have practical implications for improving sport performance in all populations. The greater force produced by TA at
Conclusion
The results of this study indicated that RFD, neural activation and EMD were similar between TA and UTI during EVC’s of the muscles involved in the leg press. In contrast, while EMD was comparable between the groups during knee extension EVC’s, athletes had greater absolute RFD after 50 ms, attributed to their greater strength. The normalised RFD of both groups was similar, owing to comparable levels of neural activation. The similarities in the explosive performance between TA and UTI in the leg press and discrepancies during the knee extension may be explained by differences in neuromuscular activation within groups over both activities, most likely due to the different roles of biarticular muscles in single and multi-joint tasks. Furthermore, future studies should attempt to ascertain whether differences in neuromuscular performance between TA and UTI exist under dynamic conditions.
Ethical considerations
A written informed consent was obtained from each player in accordance with the ethical standard of Helsinki Declaration. The study was approved by Loughborough University Ethical Advisory Committee (R10-P127).
Funding
This paper was supported by The Scientific and Technological Research Council of Turkey (TUBITAK grant B.02.1.TBT.0.06.01-219-37-110).
Footnotes
Acknowledgments
The author would like to thank the students Katherine Maria Lydon, Mikaela Harrison from Loughborough University School of Sport, Exercise and Health Sciences, and trained athletes from Loughborough University Athletics for their assistance in the study. Special thanks are extended to Dr. J P. Folland for sharing his knowledge and experience and his support for studying in his laboratory.
Conflict of interest
The author has no conflicts of interest to report.