
Abstract
Background:
Both partial- and full-thickness quadriceps tendon (QT) graft harvests are used for anterior cruciate ligament reconstruction (ACLR).
Purpose:
To evaluate the impact of QT graft harvest depth (full or partial thickness) on electromechanical delay (EMD), peak torque (PT), and rate of torque development (RTD) after ACLR.
Study Design:
Controlled laboratory study.
Methods:
A total of 26 patients who underwent either partial-thickness (n = 14) or full-thickness (n = 12) autograft QT ACLR were recruited between June and November 2021 (>1 year before participation). Patients performed isokinetic knee extension testing with surface electromyography of the quadriceps muscles. Mixed repeated-measures analysis of variance with least significant difference post hoc testing was used to determine significant differences (mean difference [MD] ± SE) or interactions for all variables.
Results:
A significant speed×depth interaction was seen for the vastus medialis (P = .005). Pairwise analyses showed significantly longer EMD for the partial-thickness graft than the full-thickness graft (MD ± SE, 19.92 ± 6.33 ms; P = .006). In the partial-thickness graft, the EMD was significantly longer at 90 deg/s versus 180 deg/s (MD ± SE, 19.11 ± 3.95 ms; P < .001) and 300 deg/s (MD ± SE, 16.43 ± 5.30 ms; P = .006). For PT, the full-thickness graft had a significantly lower PT on the operated versus nonoperated side at all speeds (MD ± SE: 90 deg/s, −57.0 ± 10.5 N·m, P < .001; 180 deg/s, −26.0 ± 10.2 N·m, P = .020; 300 deg/s, −20.3 ± 8.9 N·m, P = .034). For RTD, the full-thickness graft showed significantly Slower RTD for the operated versus nonoperated side at all time points (MD ± SD: RTD0-25 (0-25% of the range of motion), −131.3 ± 50.9 N·m/s, P = .018; RTD25-50, −197.0 ± 72.5 N·m/s, P = .014; RTD50-75, −113.3 ± 39.8 N·m/s, P = .013; RTD75-100, −149.4 ± 35.9 N·m/s, P < .001).
Conclusion:
Compared with partial-thickness QT, full-thickness QT showed a shorter vastus medialis EMD at higher loading, and therefore greater stiffness, as well as slower RTD and lower PT across all testing speeds.
Clinical Relevance:
The impact of full-thickness QT autograft on EMD and neuromuscular performance should be considered for ACLR.
Quadriceps tendon (QT) autograft for anterior cruciate ligament reconstruction (ACLR) is an appealing alternative to more traditional methods, such as the bone–patellar tendon–bone (BTB) autograft or hamstring tendon autograft, due to its physiological and biomechanical properties.9,10,15 In harvesting QT autografts, partial- or full-thickness grafts are viable options and have distinct advantages. Potential benefits of partial-thickness grafts include improved cosmesis (due to less visible/palpable void in tissue and reduced potential for synovial fluid to cause outpouching if a violation of the suprapatellar pouch occurs) and decreased complications, such as anterior knee pain and hamstring weakness, 14 whereas it has been theorized that full-thickness grafts may provide lower rates of graft failure, improved stability, and increased tensile strength.2,11
Despite both partial- and full-thickness QT graft harvest depths being used for ACLR, no studies have evaluated differences in postsurgical neuromuscular outcomes such as electromechanical delay (EMD), peak torque (PT), and rate of torque development (RTD) between the 2 graft depths. EMD, the time from the onset of electrical activity to the onset of force production, is affected by the compliance of the musculotendinous junction (MTJ), action potential propagation, muscle size, and maximum voluntary contraction, all of which may be affected by ACLR.5,7 Therefore, EMD can be a valuable metric for tracking patients’ progress during rehabilitation and assessing return to sport. Researchers have demonstrated that EMD was significantly lower in the operated leg than the nonoperated leg in patients with BTB and QT ACLR autografts; however, graft depth was not evaluated for the QT group. 21
In addition to EMD, PT and RTD are valuable metrics to evaluate knee stability, return to play, and likelihood of reinjury.20,23 Specifically, the criterion of achieving 85% to 90% of maximal strength of the contralateral limb has been used to determine readiness to return to sport, despite minimal evidence to support this claim.4,24 Further, recovery of normal RTD may be critical for performance in daily activities and sports.1,20 Aagaard et al 1 noted that fast movements such as sprinting, karate, or boxing require contraction times of 50 to 250 ms, and this rate may be improved with training or altered with ACLR. Further, PT and RTD have been shown to be significantly lower in the operated compared with the nonoperated limb in patients with BTB and QT ACLR autografts at ≥1 year post-ACLR; however, QT graft depth was not evaluated. 18 To our knowledge, there has been minimal research evaluating changes in PT and RTD in QT autografts in patients >1 year post-ACLR and no research evaluating differences in these variables between graft depths with QT. 18
This study was designed to evaluate the impact of QT graft harvest depth (full or partial thickness) on EMD, PT, and RTD. We hypothesized that at >1 year post-ACLR, there would be a significantly lower PT and RTD, and longer EMD of the superficial quadriceps, in the operated limb for the full-thickness QT graft compared with partial thickness and that the same patten would be seen for the operated compared with the nonoperated limb regardless of graft depth. Last, we hypothesized that there would be greater increases in EMD for the rectus femoris (RF) than for the vastus medialis (VM) or vastus lateralis (VL) due to the superficial position of the RF aponeurosis on the QT graft.
Methods
Study Design and Participants
The institutional review board of our university approved the study protocol, and all participants completed a written informed consent document before enrollment. This prospective cohort study included patients who underwent autograft QT ACLR between June and November 2021, which was >1 year before study testing. All procedures were performed at a university medical center that performs 350 ACLRs annually, with approximately 65% being QT. A convenience sample of ACLR patients underwent the study testing at >1 year postoperatively (full thickness, 23.5 ± 10.9 months; partial thickness, 24.4 ± 12.7 months). The dimensions of the graft depths were determined at the time of surgery by the operating surgeon based on QT size and anatomic variation, and these measures were used to determine group allocation. In general, a partial-thickness harvest was favored; however, a full-thickness harvest was performed in smaller patients, who typically have smaller tendon diameters. 30 Graft harvest was deemed full thickness if there was violation of the suprapatellar pouch.
Study inclusion criteria were patients ≥18 years of age who were fully cleared for exercise. Prospective participants were excluded from the study if they had any neuromuscular diseases or previous surgery other than ACLR, articular lesion(s) greater than Outerbridge grade 2 at time of surgery, arthritis, or peripheral neuropathy, all of which might affect quadriceps function. After assessing 200 ACLR patients, 26 patients (14 with partial-thickness and 12 with full-thickness QT graft) were included in the study testing. Five patients from the full-thickness group had isolated ACLR, while 5 had ACLR with meniscal pathology (3 partial meniscectomies, 2 meniscal repair). Six participants in the partial-thickness group had isolated ACLR, and 6 had ACLR with meniscal pathology (4 partial meniscectomies, 2 meniscal repair). Follow-up outcomes from 2 patients from each group were removed from analysis due to errors in data collection; thus, 22 patients were included in the final follow-up analysis. A Strengthening the Reporting of Observational Studies in Epidemiology chart showing the movement of the patients through the study is presented in Figure 1.

Strengthening the Reporting of Observational Studies in Epidemiology flowchart of patients through the study. QT ACLR, quadriceps tendon anterior cruciate ligament reconstruction.
Surgical Technique and Rehabilitation
Two fellowship-trained sports medicine surgeons (M.G.B. and L.D.K.), experienced in harvesting QT autografts, performed all ACLR procedures. The first surgeon (M.G.B.), who performed 13 of the QT ACLRs included in this study (7 partial thickness, 6 full thickness), had 10 years of experience (7 years performing QT ACLR). The second surgeon (L.D.K.), who had 20 years of experience (5 years performing QT ACLR), performed 13 of the QT ACLRs included in this study (6 partial thickness, 7 full thickness). Both surgeons performed the same dual suspensory fixation technique.
Surgeries were performed with the patient under general anesthesia and with the use of a tourniquet. Harvesting of the QT autograft was performed through a 2- to 3-cm incision, 1 cm proximal to the superior pole of the patella. Central-medial harvest was performed using a width of 10 mm, with the aim of obtaining an all–soft tissue graft between 65 and 70 mm in length and from 9 to 10 mm in diameter. Care was taken to avoid penetration into the suprapatellar pouch and disruption of the rectus myotendinous junction. Any defects to the suprapatellar pouch were reapproximated with interrupted sutures at the deep aspect of the tendon harvest site, although full-thickness closure of the tendon was not performed. Diagnostic arthroscopy was completed. Reconstructions were performed using an all-inside technique with tibial and femoral cortical suspensory fixation. Femoral sockets were created through the center of the femoral anatomic footprint. Tibial sockets were created in the center of the tibial anatomic footprint in a retrograde fashion using a FlipCutter (Arthrex Inc) to a depth of approximately 25 mm. Tibial fixation was performed using adjustable loop cortical suspensory fixation (FiberTag TightRope ABS; Arthrex Inc), while femoral fixation was performed with a FiberTag Tightrope RT (Arthrex Inc). 27 Tibial fixation was performed at approximately 10° of knee flexion with a posterior drawer for both cohorts.
Participants were encouraged to initiate physical therapy within the first week after the procedure. All patients were provided a standard rehabilitation protocol after QT ACLR. Routine postoperative bracing was used for all patients, with progression to full weightbearing using crutches for the first 2 weeks until normal gait was achieved. Both active and passive extension exercises were emphasized after surgical treatment. Knee flexion range of motion (ROM) was progressed as tolerated. Patients were encouraged to begin weight training (leg extensions, hamstring curls, squats, dead lifts, and lunges) by 6 weeks after surgery and were allowed to begin jogging at 3 months with lateral movement/cutting at 5 months.
Patients were allowed to return to their recreational sport activities with no restrictions once they were evaluated by their respective surgeon, deemed ligamentously stable, and met the limb symmetry index criteria discussed by Harris et al 12 (ie, values >90% for the single-leg, cross-over, and triple-hop tests).
Postoperative Outcomes
Patient outcomes were measured at 1-year follow-up with the Lysholm score, International Knee Documentation Committee (IKDC) knee evaluation form, Tegner activity scale, and a visual analog scale for satisfaction with surgery and recovery (range, 0-10 [10 being highest possible]). In addition, we recorded the number of physical therapy sessions each patient completed.
Testing Protocol
A Biodex 4 Isokinetic Dynamometer (Biodex) and integrated electromyography (EMG) collection system (MP150 system; Biopac Systems) was used to assess PT, RTD, and EMD, respectively, during knee extension.
Isokinetic Testing
Participants were positioned on the Biodex for knee extension by aligning the axle of the powerhead with the lateral condyle. Restraining straps were placed across the chest, waist, and thigh to isolate the musculature to the greatest extent possible, and patients placed their hands across their chest during testing. Proper familiarization and a warm-up set were followed by 3 testing sets. The 4-repetition warm-up was performed at 270 deg/s, followed by 2 repetitions at each testing speed (90, 180, and 300 deg/s). After a 3-minute rest period, patients completed 3 sets of 3 repetitions at each speed with a 2-minute rest period between sets. Starting side, operated or nonoperated, was randomized to each patient, and vocal encouragement was standardized. 25 Isokinetic variables and surface EMG (sEMG) for the RF, VL, and VM were collected for each repetition and set using a dedicated laptop interfaced with the Biodex.
Electromyography
Patients were prepared for sEMG before being positioned on the Biodex. A bipolar surface configuration (2-cm interelectrode distance) was used to maximize the reception area and control for crosstalk between muscles during testing. Skin preparation included shaving, abrading, and cleansing the designated area with rubbing alcohol. Disposable Ag/AgCl dual electrodes (Noraxon USA) were positioned parallel to the underlying muscle fibers according to Cram’s Introduction to Surface Electromyography. 8 Raw EMG was recorded simultaneously to Biodex testing using the Biopac MP150 system. The MP150 has an input impedance of 1.0 MΩ and common mode rejection ratio of 110 dB (50/60 Hz). The gain was set at 1000, with band-pass filtering between 20 and 450 Hz. Signals were sampled at a frequency of 1000 Hz, digitized using a 16-bit analog-to-digital converter, and stored on a laptop laboratory computer. Raw torque and sEMG signals were then exported from the MP150 AcqKnowledge system software for analysis.
Data Analysis
Signal Onset and Offset Determination
Isokinetic torque and sEMG signals were processed using a custom LabView program (Version 18.0; National Instruments). Torque signals were converted to newton-meter by multiplying each sample point by 140.7 N·m/V and were filtered using a second-order Butterworth low-pass filter with a cutoff frequency of 6 Hz. Since isokinetic procedures were collected continuously, each speed was determined manually across the data set using a 3000-sample window. All sEMG signals were extracted within this window to maintain time synchronization with the torque signal.
For each EMG signal, the zero offset was removed by subtracting the mean value of the signal from each sample point across the trial. Signals were then rectified and filtered using a second-order Butterworth low-pass filter with a cutoff frequency of 6 Hz to create a linear envelope. Torque and EMG onsets and offsets were determined using a threshold of the mean ± 2 SDs derived from a 2500 sample block that preceded the first repetition.
Electromechanical Delay
EMD for each muscle was determined by subtracting the index of the global torque onset from the index of the global sEMG onset for the first repetition at each speed (Figure 2). Only the first repetition at each speed was used to calculate EMD, as residual activation of each muscle and dynamic nature of isokinetic testing made sEMG onset determination difficult in subsequent repetitions.

Graphic representations of EMD for the VM, RF, and VL. EMD, electromechanical delay; EMG, electromyography; RF, rectus femoris; VL, vastus lateralis; VM, vastus medialis.
PT and RTD
The PT was obtained for each repetition and at each speed by searching for the maximum value and its index between torque onset and offset. The torque onset and maximum index were used to define the ROM of each repetition. The RTD was then calculated as the average differentiated torque signal from 0% to 25% (RTD0-25), 25% to 50% (RTD25-50), 50% to 75% (RTD50-75), and 75% to 100% (RTD75-100) of the patient’s ROM.
Statistical Analysis
For the EMD of each muscle, as well as the PT and RTD, a 3 (speed) × 2 (side) × 2 (depth) mixed analysis of variance with repeated measures for side and speed were used to determine significant differences or interactions. If significant differences or interactions were found, a least significant difference post hoc analysis was used to determine the source. The threshold for significance in all tests was set a priori at P≤ .05. All analyses were performed using SPSS (Version 28.0; SPSS).
Using G*Power (Version 3.1.9.2; Heinrich Heine Universität Düsseldorf), a total sample size of 20 was calculated for a repeated-measures design incorporating 2 groups, 2 limbs, and 2 graft depths with a statistical power of 0.95 and alpha level of .05. An effect size of 0.58 was used based on the findings for isokinetic average power in our previous study. 22
Results
Patient Characteristics
Patient characteristics are displayed in Table 1. No significant differences were found between groups for any variable; however, the homogeneity of our sample (age range, 21-34 years in the partial-thickness group and 21-32 years in the full-thickness group), as well as the limited number of women (n = 4) in the sample, reduces the generalizability of our results.
Descriptive Characteristics of the Final Study Cohort (n = 22) a

Values are shown as mean ± SD or median [median absolute deviation] unless otherwise indicated. IKDC, International Knee Documentation Committee; QT, quadriceps tendon; VAS, visual analog scale.
Electromechanical Delay
Analyses for EMDRF and EMDVL showed no significant main effects or interactions. Results for EMDVM showed a significant speed × depth interaction (F(2, 36) = 6.294; P = .005; η2 = 0.259). Pairwise analyses indicated that EMD was significantly longer for the partial-thickness graft than the full-thickness graft (mean difference [MD] ± SE [95% CI], 19.915 ± 6.329 ms [6.618-33.212 ms]; P = .006). Furthermore, in the partial-thickness graft, the EMD was significantly longer for the VM at 90 deg/s compared with 180 deg/s (MD ± SE [95% CI], 19.106 ± 3.949 ms [10.809-27.403 ms]; P < .001) and 300 deg/s (MD ± SE [95% CI], 16.425 ± 5.299 ms [5.292-27.557 ms]; P = .006), while no significant differences were seen among speeds for the full-thickness group (see Figure 3).
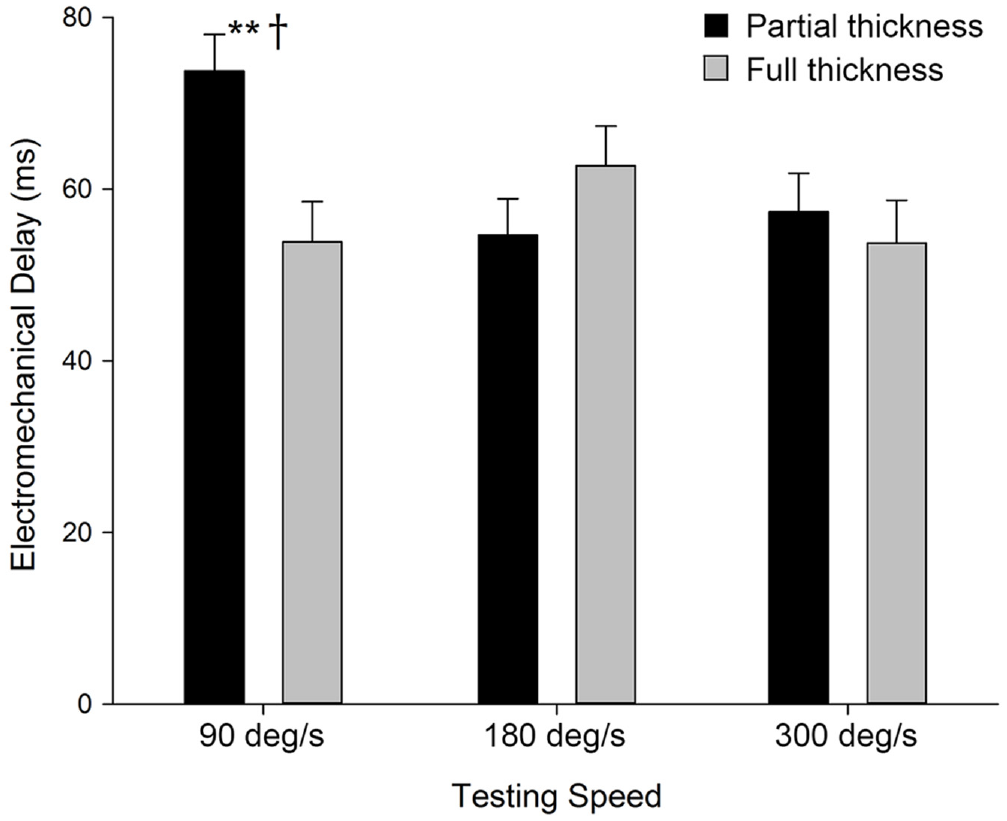
Electromechanical delay for the vastus medialis at different testing speeds. †Statistically significantly different between graft depths. **Statistically significantly different versus all other speeds within that graft depth.
Peak Torque
Results for PT showed a significant side × speed × depth interaction (F(2, 40) = 4.311; P = .020; η2 = 0.177). Pairwise comparisons revealed that the full-thickness graft had a significantly lower PT on the operated side compared with the nonoperated side, while the partial-thickness graft showed no significant difference between sides at 90 and 180 deg/s (Table 2). Additionally, significant differences were seen among all speeds for the partial-thickness graft and only between 90 deg/s compared with 180 and 300 deg/s for the full-thickness graft (Table 2).
Mean Differences in Peak Torque (in N·m) Between the Operated and Nonoperated Sides for Partial- and Full-Thickness QT Grafts a

Peak torque values are shown as mean ± SD. Boldface P values indicate statistically significant difference between the operated and nonoperated sides (P≤ .05). ES, effect size; MD, mean difference; QT, quadriceps tendon.
Statistically significant difference compared with the other speeds.
Cohen d.
RTD From 0% to 25% of Patient ROM
Results for RTD0-25 showed a significant main effect for side (F(1, 19) = 6.219; P = .022; η2 = 0.247) and speed (F(2, 38) = 4.554; P = .017; η2 = 0.193) and a significant side × speed × depth interaction (F(2, 38) = 4.219; P = .022; η2 = 0.182). For the partial-thickness graft, post hoc analyses showed no significant differences between depths for the nonoperated or operated side during pretest or posttest; however, for the full-thickness graft, the nonoperated side had a significantly higher RTD0-25 than the operated side (Table 3). Pairwise comparisons for speed × side and speed × depth interactions are presented in Appendix Tables A1 and A2, respectively.
Mean Differences in RTD (in N·m/s) Between the Operated and Nonoperated Sides for Partial- and Full-Thickness QT Grafts a

RTD values are shown as mean ± SD. Boldface P values indicate statistically significant difference between the operated and nonoperated sides (P≤ .05). ES, effect size; MD, mean difference; QT, quadriceps tendon; RTD, rate of torque development. Note that the subscripts indicate the percentages of the complete range of motion.
Cohen d.
RTD From 25% to 50% of Patient ROM
Results for RTD25-50 showed a significant main effect for speed (F(2, 38) = 12.006; P < .001; η2 = 0.387). A significant side × depth interaction was also found (F(1, 219) = 4.835; P = .040; η2 = 0.203). Post hoc analyses showed a significantly lower RTD25-50 for the full-thickness graft on the operated side compared with the nonoperated side but no significant differences between sides for the partial-thickness graft (Table 3). Pairwise analyses among speeds are presented in Appendix Table A3.
RTD From 50% to 75% of Patient ROM
Results for RTD50-75 showed a significant main effect for speed (F(2, 28) = 10.942; P < .001; η2 = 0.439) and for side (F(1, 14) = 8.497; P = .011; η2 = 0.378). Post hoc analyses disclosed that the operated side had a significantly slower RTD50-75 compared with the nonoperated side (MD ± SE [95% CI], −81.9 ± 28.1 N·m/s [−142.3 to −21.7 N·m/s]; P = .011). Furthermore, an examination of pairwise comparisons of differences between sides for each graft depth showed significantly lower RTD for the operated side only (see Table 3). Pairwise analyses among speeds are presented in Appendix Table A4.
RTD From 75% to 100% of Patient ROM
Results for RTD75-100 showed a significant side × depth interaction (F(1, 19) = 5.696; P = .028; η2 = 0.231). Pairwise comparisons showing significantly lower RTD on the operated side of the full-thickness graft only are presented in Table 3.
Discussion
Our results showed differences in EMD, PT, and RTD between the partial- and full-thickness grafts. For EMD, no significant main effects or interactions were found for the RF or VL; however, for the VM, only the partial-thickness graft showed reductions as testing speed increased (90 deg/s longer than 180 or 300 deg/s; P = .006). For PT, the full-thickness graft had significantly lower values on the operated side compared with the nonoperated side (MD ± SE: 90 deg/s, −57.0 ± 10.5, P < .001; 180 deg/s, −26.0 ± 10.2, P = .020; 300 deg/s, −20.3 ± 8.9, P = .034). Furthermore, the full-thickness graft showed significantly lower RTD for the operated compared with the nonoperated side at all time points (MD ± SD: RTD0-25, −131.3 ± 50.9 N·m/s, P = .018; RTD25-50, −197.0 ± 72.5 N·m/s, P = .014; RTD50-75, −113.3 ± 39.8 N·m/s, P = .013; RTD0-25, −149.4 ± 35.9 N·m/s, P < .001), while no significant differences were detected between sides for the partial-thickness graft.
For EMD, the longer delay in the VM for the partial-thickness graft at slower isokinetic testing speeds reflects the pattern reported in healthy knees. Howatson et al 13 reported longer EMD for the dominant and nondominant arms of 11 male patients (mean ± SD age, 30 ± 6 years) during arm curls performed at 60 deg/s compared with 210 deg/s. Mirroring our results, Vos et al 29 reported longer EMD for the VM, RF, and VL at 30 deg/s compared with 60 deg/s, with the differences between the 2 speeds being greater for the VM (30 deg/s, 104 ± 8.7 ms; 60 deg/s, 96 ± 6.3 ms) than the RF (30 deg/s, 91 ± 8.2 ms; 60 deg/s, 90 ± 6.8 ms) or VL (30 deg/s, 99 ± 8.1 ms; 60 deg/s, 94 ± 6.5 ms). Therefore, lack of significant differences among speeds for the EMD of the full-thickness group is atypical, possibly resulting from an increased stiffness of the QT resulting from graft depth and subsequent changes in gait across the 1 year after surgery. Indeed, using a biophysical multiscale skeletal muscle model, Schmid et al 26 found that a stiffer tissue is associated with a reduction in EMD.
The full-thickness QT graft had a significantly lower PT and slower RTDs on the operated than the nonoperated side, while no significant differences were seen between sides for the partial-thickness graft. These results support our hypothesis that the full-thickness graft would have a greater negative impact on maximal strength, musculotendinous force transfer, and neuromuscular functionality compared with the partial-thickness graft. While the full-thickness graft has distinct advantages, we postulated that a full-thickness graft may disrupt the MTJ to a greater extent than the partial-thickness graft due to the surgical approach. This disruption could theoretically result in lower PT and increased RTD due to a reduction in the series elastic force transfer between the tendon and quadriceps muscles. The MTJ has been shown to develop additional folds within the tissue due to training, which increases its surface area and, therefore, force transduction through the musculature per cross-sectional area. 16 Further, as demonstrated in animal models, this folding is approximately 40% greater in fast-twitch (type 2) muscle fibers, which may further explain the disruption to maximal force production and RTD for explosive movements such as isokinetic knee extension.16,28 Additionally, in relation to MTJ disruption, reductions in the structural protein, dystrophin, could affect lateral force transfer within the muscle. 16 Collectively, these findings could explain the differences in force production and the rate at which force is produced in patients undergoing a full-thickness QT graft harvest. 2
Andersen and Aagaard 3 elucidated the importance of early phase RTD for successful performance in sports with explosive movements including high-intensity sprinting, running, karate, and jumping. Therefore, the impact of the full-thickness graft on RTD0-25 may be of critical importance for return-to-sport readiness. Furthermore, muscle fiber type and composition, cross-sectional area, maximal muscle strength, properties of the MTJ, and neural drive are believed to affect RTD. 3 We theorize that the impact of ACLR on the elasticity of the MTJ may have a significant impact on early phase RTD, specifically in the patients with full-thickness grafts. PT is significantly dictated by muscle cross-sectional area and neural drive. 3 Detriments in PT from ACLR as a result of reduced cross-sectional area and connectivity at the neuromuscular junction may affect late phase RTD. Intrinsic factors related to the musculature such as fiber type composition may influence early phase RTD to a greater extent, while late phase RTD may have a greater relation to maximal strength production. 3 Additionally, the stiffness of the tendon aponeurosis could account for up to 30% of the variance in late phase RTD.3,6 Full-thickness grafts may result in greater likelihood of scar tissue, which could affect tendon aponeurosis stiffness. Both late phase and early phase RTD detriments are apparent in our findings for the full-thickness QT graft, but not the partial-thickness graft.
Despite the speculated physiological bases of our presented findings, our research does not align with the review by Kanakamedala et al, 17 who concluded that there was no difference in clinical or complication outcomes between full-thickness and partial-thickness QT grafts. Further, a comparison of full- and partial-thickness grafts has only been conducted by Kim et al, 19 and that research did not find any difference between the graft depths when comparing 28 single- (partial thickness) and 31 double- (full thickness) bundle ACLR patients using QT grafts. This research concluded that the double-bundle group had less laxity as measured by the KT-2000 arthrometer, but the between-group differences for all other measures (IKDC, Lysholm) were not significant. It is possible that our findings differ from those outlined above due to neuromuscular and musculotendinous components that cannot be visualized through these clinical assessments; however, Kim et al did conclude that the double-bundle group (full thickness) had less laxity, which may result in a stiffer tissue. Kaneko et al 18 noted that “a decrease in stiffness of series elastic components may lead to a decrease in the efficiency of propagation of contractile tension to bones.” Despite these differences in clinical and complication outcome profiles, this research has its foundation in measures of neuromuscular and musculotendinous functional outcomes; therefore, more research must be conducted employing these and similar measures.
Limitations
This research was limited by several factors including sample size, population demographics, and innate differences in surgical techniques. While the study sample size was determined a priori, the observed power value of the study and statistical findings indicate that statistical significance may have been limited by sample size. Further, the study included a convenience sample; therefore, bias may have resulted because of patient selection, which may reduce the generalizability of our results. Finally, all surgeries were conducted by 2 fellowship-trained sports medicine surgeons, and while they both utilized the techniques outlined above, it is possible that slight variations in surgical technique may have occurred.
Conclusion
The full-thickness QT graft showed a shorter VM EMD at higher loading, slower RTD, and lower PT across all testing speeds when compared with the partial-thickness graft. The invasive nature and the results for EMD, PT, and RTD of full-thickness QT harvest versus partial thickness should be considered when employing QT graft for ACLR.
Footnotes
Appendix
Differences Between Isokinetic Testing Speeds Across Graft Conditions for RTD From 50% to 75% of Patient ROM (n = 22) a

| I: Speed | Mean ± SD b | J: Speed | Mean ± SD b | I-J: MD ± SE (95% CI) | P | ES c |
|---|---|---|---|---|---|---|
| 90 deg/s | 266.5 ± 148.9 | 180 deg/s | 344.9 ± 214.4 | −76.4 ± 35.7 (−152.9 to 0.1) | . |
.42 |
| 90 deg/s | 266.5 ± 148.9 | 300 deg/s | 180.2 ± 112.7 | 88.3 ± 20.8 (43.8 to 132.8) |
|
.65 |
| 180 deg/s | 206.2 ± 158.1 | 300 deg/s | 189.4 ± 116.2 | 164.7 ± 44.9 (68.3 to 261.1) | . |
.96 |
Boldface P values indicate statistically significant difference between speeds compared (P≤ .05). ES, effect size; I, code for the speed in column 1; J, code for the speed in column 3; MD, mean difference; ROM, range of motion; RTD, rate of torque development.
In N·m/s.
Cohen d.
Final revision submitted April 29, 2023; accepted May 19, 2023.
One or more of the authors has declared the following potential conflict of interest or source of funding: M.G.B. has received education payments from Southern Edge Orthopaedics, consulting fees from Arthrex and LifeNet Health, nonconsulting fees from Arthrex, and hospitality payments from Smith & Nephew. L.D.K. has received education payments from Southern Edge Orthopaedics, nonconsulting fees from Arthrex, and royalties from Arthrex and Smith & Nephew. T.M.B. has received consulting fees from Bioventus and hospitality payments from GE Healthcare. AOSSM checks author disclosures against the Open Payments Database (OPD). AOSSM has not conducted an independent investigation on the OPD and disclaims any liability or responsibility relating thereto.
Ethical approval for this study was obtained from the University of Miami (reference No. 20210610).