
Abstract
RNA-binding protein (RBP) plays pivotal roles in the malignant progression of cancer by regulating gene expression. In this paper, we aimed to develop RBP-based prognostic signature and identify critical hub RBPs in bladder cancer (BLCA). Firstly, a risk model based on differentially expressed RBP gens (DERBPs) between normal and tumor tissues was successfully established, which can predict the tumor stromal score and drug sensitivity. Then two another RBP risk models based on miRNA-correlated RBPs or lncRNA-correlated RBPs were also established, and RBMS3 was identified as the overlapping gene in the three models. Data from multiple bioinformatics databases revealed that RBMS3 was an independent prognostic factor for overall survival (OS), and was associated with an immunosuppressive tumor microenvironment (TME) in BLCA. Further, Single-cell RNA-Seq (scRNA-Seq) data and the human protein altas (HPA) database showed that RBMS3 expression (both mRNA and protein) were up-regulated in BLCA tumor and tumor stromal cells. Finally, RBMS3 was shown to be associated with worse response to BLCA immunotherapy. Overall, RBMS3 is a key prognostic RBP with TME remodeling function and may serve as a target for BLCA immunotherapy.
1. Introduction
Bladder cancer (BLCA) is the fourth-most common malignant disease in men and the ninth most common cancer in women. It accounts for an estimated 573,000 new cases and 213,000 deaths annually worldwide. 1 According to the depth of bladder wall invasion, BLCA can be categorized as non-invasive papillary carcinoma (Ta) or as a tumor invading the lamina propria (T1), muscles (T2), or beyond (T3, T4). Ta and T1 are also classified as non–muscle-invasive BLCA and are treated differently from tumors that invade the muscle or beyond. 2 Based on their large-scale messenger RNA (mRNA) expression profiles, human cancers can be grouped into molecular subtypes, which share similar gene-expression patterns and biological characteristics. BLCA can be categorized into basal and luminal molecular subtypes, which can inform clinical behaviors like the response to neoadjuvant chemotherapy, the sensitivity to immunotherapy, and the risk of progression. 3 Recently, the risk stratification of BLCA has been made more accurate and personalized by integrating tumor genetic-sequencing data with clinical outcomes. 4 This provides a basis for determining the most appropriate treatment regimen for BLCA, such as whether neoadjuvant chemotherapy should be administered prior to radical cystectomy or not. 4 In the future, risk classification, including molecular subtyping with specific treatment considerations, will provide great assistance in the clinical management of BLCA. 4
RNA-binding proteins (RBPs) interact with various classes of RNAs, including mRNA, long non-coding RNA (lncRNA), and transfer RNA to form ribonucleoprotein complexes. This enables them to play pivotal roles in the regulation of gene expression at the post-transcriptional level 5 . To date, more than 1500 RBPs have been identified, representing approximately 7.5% of all protein-coding genes in the human genome. 6 Dysregulation of RBPs is associated with various diseases. In cancers, RBP modulates the expression of target RNAs involving in various cellular processes like proliferation, angiogenesis, senescence, and metastasis 7 . Many recent studies have shown that RBPs can regulate TME constitution and hence influence cancer progression in various types of cancer such as colorectal cancer 8 , gastric cancer 9 , hepatocellular cancer 10 and bladder cancer 11 . This indicates RBPs a potential target for TME-based anticancer therapy.
Many studies have reported risk signatures based on RBP expression in various types of tumors, such as hepatocellular carcinoma 12 , lung cancer 13 , osteosarcoma 14 , head and neck carcinoma 15 , and liver cancer 16 . In BLCA, risk signatures composed of six RBPs 17 , eight RBPs 18 , and 12 RBPs 19 have been reported to have predictive value for overall survival (OS). However, those risk signatures contained too many member genes and its clinical application were therefore limited. Moreover, most studies did not perform further analysis of these RBP molecules, such as identifying the source of the RBP, exploring its relationship with the tumor microenvironment (TME). Therefore, in this study, we first identified prognostic RBP signatures based on three data profiles: the differentially expressed RBPs between normal and BLCA tissues and the miRNA-correlated and lncRNA-correlated RBPs with prognostic value in BLCA cancer tissues. The critical prognostic RBP members was identified by intersection of the three signatures, and RBMS3 was ultimately selected as the unique gene present in all three signatures. Further analysis demonstrated that high RBMS3 expression was associated with greater stromal content and predicted poor survival after immunotherapy.
2. Materials and methods
2.1. Data acquisition and processing
Bulk RNA-sequencing (RNA-Seq) data (19 normal, 412 tumors), microRNA (miRNA) data (19 normal, 418 tumors) and clinical information were downloaded from the TCGA-BLCA database (
2.2. Construction and validation of prognostic RBP signatures
The DERBPs, miRNA-correlated RBPs or lncRNA-correlated RBPs were respectively subjected to univariate Cox regression analysis using the “survival” R package to identify the genes that significantly affected the OS (

Where N represents the total number of signature genes and
The patients were sorted into high- and low-risk groups based on the median risk score. The risk score model, survival status, and expression levels of the signature genes in TCGA-BLCA cancer patients were generated by the “pheatmap” R package. A receiver operating characteristic (ROC) curve was generated using the “survival” R package. The Kaplan–Meier survival curves of high- and low-risk patients were generated using the “survminer” R package.
2.3. Construction of the nomogram
To assess the probability of OS in BLCA at 1, 3, and 5 years, a nomogram combining clinical characteristics and the risk score was constructed using the “rms” R package. Calibration plots were used to evaluate the discriminative ability of the nomogram.
2.4. Evaluation of tumor stromal score and immune cell infiltration
The ESTIMATE stromal and immune scores of TCGA-BLCA patients were calculated using the “ESTIMATE” R package and visualized by the “ggpubr” R package. The infiltration of 22 immune cells was analyzed by the “CIBERSORT” R package. Differences in various immune cell components between the high- and low-risk groups were analyzed by the “limma” R package and visualized by the “ggplot2” R package. The immune checkpoint genes were sourced from previously published literature23, 24, and their different expression between the high- and low-risk groups was analyzed by the “limma” R package. Tumor purity and the correlation between gene expression and immune cell infiltration were analyzed using the Tumor Immune Estimation Resource (TIMER2.0) (
2.5. Correlation analysis of RBMS3 expression and gene signatures
Correlation analysis between RBMS3 and gene signatures of various cells, including effector regulatory T-cells (FOXP3, CTLA4, CCR8, TNFRSF9), exhausted T-cells (HAVCR2, TIGIT, LAG3, PDCD1, CXCL13, LAYN), fibroblasts (RGS5, COL1A1, PDGFRA, PDGFRB, DES), and endothelial cells (VWF, PECAM1) in the TCGA-BLCA dataset was performed using gene-expression profiling interactive analysis (GEPIA2) (
2.6. scRNA-Seq data preprocessing
The scRNA-Seq data GSE190888, including one case of cystitis glandularis, one case of low-grade BLCA, one case of high-grade BLCA, and one case of recurrent BLCA, and the scRNA-Seq data GSE192575, including one case of chemotherapy-sensitive and one case of chemotherapy-resistant human bladder cancers, were obtained from the Gene Expression Omnibus database. The scRNA-Seq data were processed using the “seurat” R package. Cells with 300 genes at least and mitochondrial genes
2.7. Evaluation of the predictive ability of RBMS3 on BLCA immunotherapy
The immunotherapy datasets were obtained from IMvigor210CoreBiologies (
2.8. Quantitative real-time PCR and immunohistochemistry (IHC)
Bladder cancer tissues were obtained from patients who had undergone surgical resection at Southern Medical University (Guangzhou, China) with consent from all patients. The experimental protocols were approved by the ethics committee of Southern Medical University. Trizol reagent (TaKaRa, Kusatsu, Japan) was used to extract total RNA from BLCA specimens according to the manufacturer’s protocol. Reverse transcription and quantitative real-time PCR were performed as described before 26 , with the primers as follow. RBMS3 forward primer: 5’-CAGTGGACACATCCAACGAAC-3’, reverse primer: 5’-CTTCTTGTTCAATGA AGTTTCTTC-3’. GAPDH forward primer: 5’-AGCCA CATCGCTCAGACAC-3’, reverse primer: 5’-GCCCA ATACGACCAAATCC-3’. The expression levels of RMBS3 mRNA were normalized using the GAPDH expression. Each assay reaction was performed in triplicate.
The bladder cancer tissues were subjected to IHC analysis as routine. Briefly, the bladder cancer tissues were sequentially fixed (4% paraformaldehyde), paraffin embedded, paraffin sections (4–5
2.9. Statistical analysis
R software version 4.2.2 (R Foundation for Statistical Computing, Vienna, Austria) (
3. Results
3.1 Identification of DERBPs

DERBPs in BLCA and functional enrichment analysis. (A) Volcano plot and (B) boxplot of the top 20 upregulated and top 20 downregulated DERBPs in BLCA cancer tissues compared to normal tissues. (C) GO enrichment analysis of DERBP genes visualized by circle plot. (D) KEGG enrichment analysis of DERBP genes visualized by circle plot.
A total of 111 DERBPs between the normal and tumor groups were identified, of which 56 were downregulated and 55 were upregulated in BLCA tissues (Figure 1A, B, Supplementary Figure 1). In GO analysis, RNA catabolic processes, regulation of mRNA metabolic process and regulation of translation were highly enriched (Figure 1C). In each category, both upregulated and downregulated DERBPs were enriched, whereas, in the RNA catabolic process, more DERBPs were downregulated in cancer tissues (Figure 1C). KEGG analysis showed that miRNAs in cancer, platinum drug resistance, influenza A, and mRNA surveillance pathways were upregulated in cancer tissues (Figure 1D).
3.2 Construction and verification of the prognostic signature based on the DERBPs

Construction and verification of the prognostic DERBP signature. (A) Survival-related DERBPs were obtained by univariate Cox regression,
26 genes were identified with statistical prognostic significance with univariate Cox regression analysis (
3.3 The prognostic signature is associated with higher tumor stromal scores and predicts chemotherapy sensitivity

The prognostic signature is associated with higher tumor stromal scores and predicts chemotherapy sensitivity. (A) Enrichment analysis was performed by GSEA, TME-related pathways were highly enriched in the high-risk patients. (B) The ESTIMATE, stromal, and immune scores of the BLCA cancer tissues were calculated using the ESTIMATE algorithm and visualized with the “ggpubr” R package. (C) Immune cells scores were analyzed by CIBERSORT.R. (D) differential expression of immune checkpoint genes between high- and low-risk groups. (E) IC50 of indicative drugs were estimated through the “OncoPredict” R package.
GSEA analysis was performed to detect the vital tumor phenotypes correlated with the risk score. It showed that genes related to adhesion, junction, ECM-receptor interaction, and canonical TME-related signal pathways like TGF
TME plays essential roles in the efficiency of cancer therapy. To evaluate the potential value of the risk signature to predict response to clinical drug therapy, estimated IC50 of 198 drugs was analyzed by the “OncoPredict” R package. As expected, the prognostic signature was associated with chemotherapy sensitivity. High-risk group was less sensitive to Oxaliplatin_1089, Acetalax_1804, and Lapatinib_1558; but sensitive to certain kind of inhibitors, such as IGF1R/IR inhibitor BMS-754807, pan-kinase inhibitor Staurosporine_1034, and heat shock protein 90 inhibitor Luminespib_1559 (Figure 3E).
3.4 RBMS3 is the critical hub gene with prognostic value in BLCA
RBPs exert biological functions mainly by regulating target RNA. To further explore the critical RBPs for cancer development, the correlation between RBPs and RNA expression (miRNA and lncRNA) in BLCA was analyzed to obtain RNA-correlated RBPs, from which risk models were constructed. Six miRNA-correlated RBPs (CTU1, MYO5A, OAS1, PATL2, RBMS3, TXNL4A) and seven lncRNA-correlated RBPs (DDX39B, EIF4B, ELAC1, MYO5A, PATL2, RBMS3, TIA1) were finally screened out as prognostic risk genes (Figure 4A, Supplementary Figure 2). To narrow down the number of prognostic RBPs, three RBP prognostic signatures (miRNA-correlated RBPs, lncRNA-correlated RBPs, and DERBPs) were intersected to identify the overlapping genes. RBMS3 was a unique gene found in all three signatures (Figure 4B), strongly suggesting that RBMS3 is a critical RBP for BLCA development.

RBMS3 predicts poor OS in BLCA. (A) The network of miRNAs (left) or lncRNAs (right) with their correlated RBPs was visualized by the “ggalluvial” R package. (B) Intersection of 10 hub DERBPs, six hub miRNA-correlated RBPs, and seven hub lncRNA-correlated RBPs. (C) RBMS3 expression in BLCA cancer matched with normal and GTEx data were analyzed using GEPIA2.

RBMS3 expression is associated with higher stromal cell content. (A) The correlations of RBMS3 with tumor purity and diverse immune cell infiltration in BLCA were analyzed using TIMER2. Scatterplots show the purity-corrected partial Spearman’s rho value and statistical significance. (B) Correlation analysis of RBMS3 expression with stromal cell markers (GEPIA2). Correlation coefficient: Spearman.
Next, the expression profile of RBMS3 in BLCA was analyzed using GEPIA2. Surprisingly, RBMS3 was significantly downregulated in BLCA cancer tissues, compared to normal tissues which including TCGA normal and the Genotype-Tissue Expression (GTEx) bladder data (Figure 4C). However, in tumor tissues, RBMS3 expression was positively correlated with tumor stage (Figure 4D). Moreover, RBMS3 was a risk factor for OS; high RBMS3 expression alone could predict poor survival of BLCA. High RBMS3 expression was a risk factor in papillary BLCA (HR
3.5 RBMS3 is associated with high tumor matrix content and immunosuppressive environment
The correlation between RBMS3 expression, tumor purity, and immune cell infiltration was analyzed using TIMER2. High RBMS3 expression was associated with lower tumor purity (R
3.6 RBMS3 is mainly expressed in tumor, endothelial, and fibroblast cells in BLCA tissues
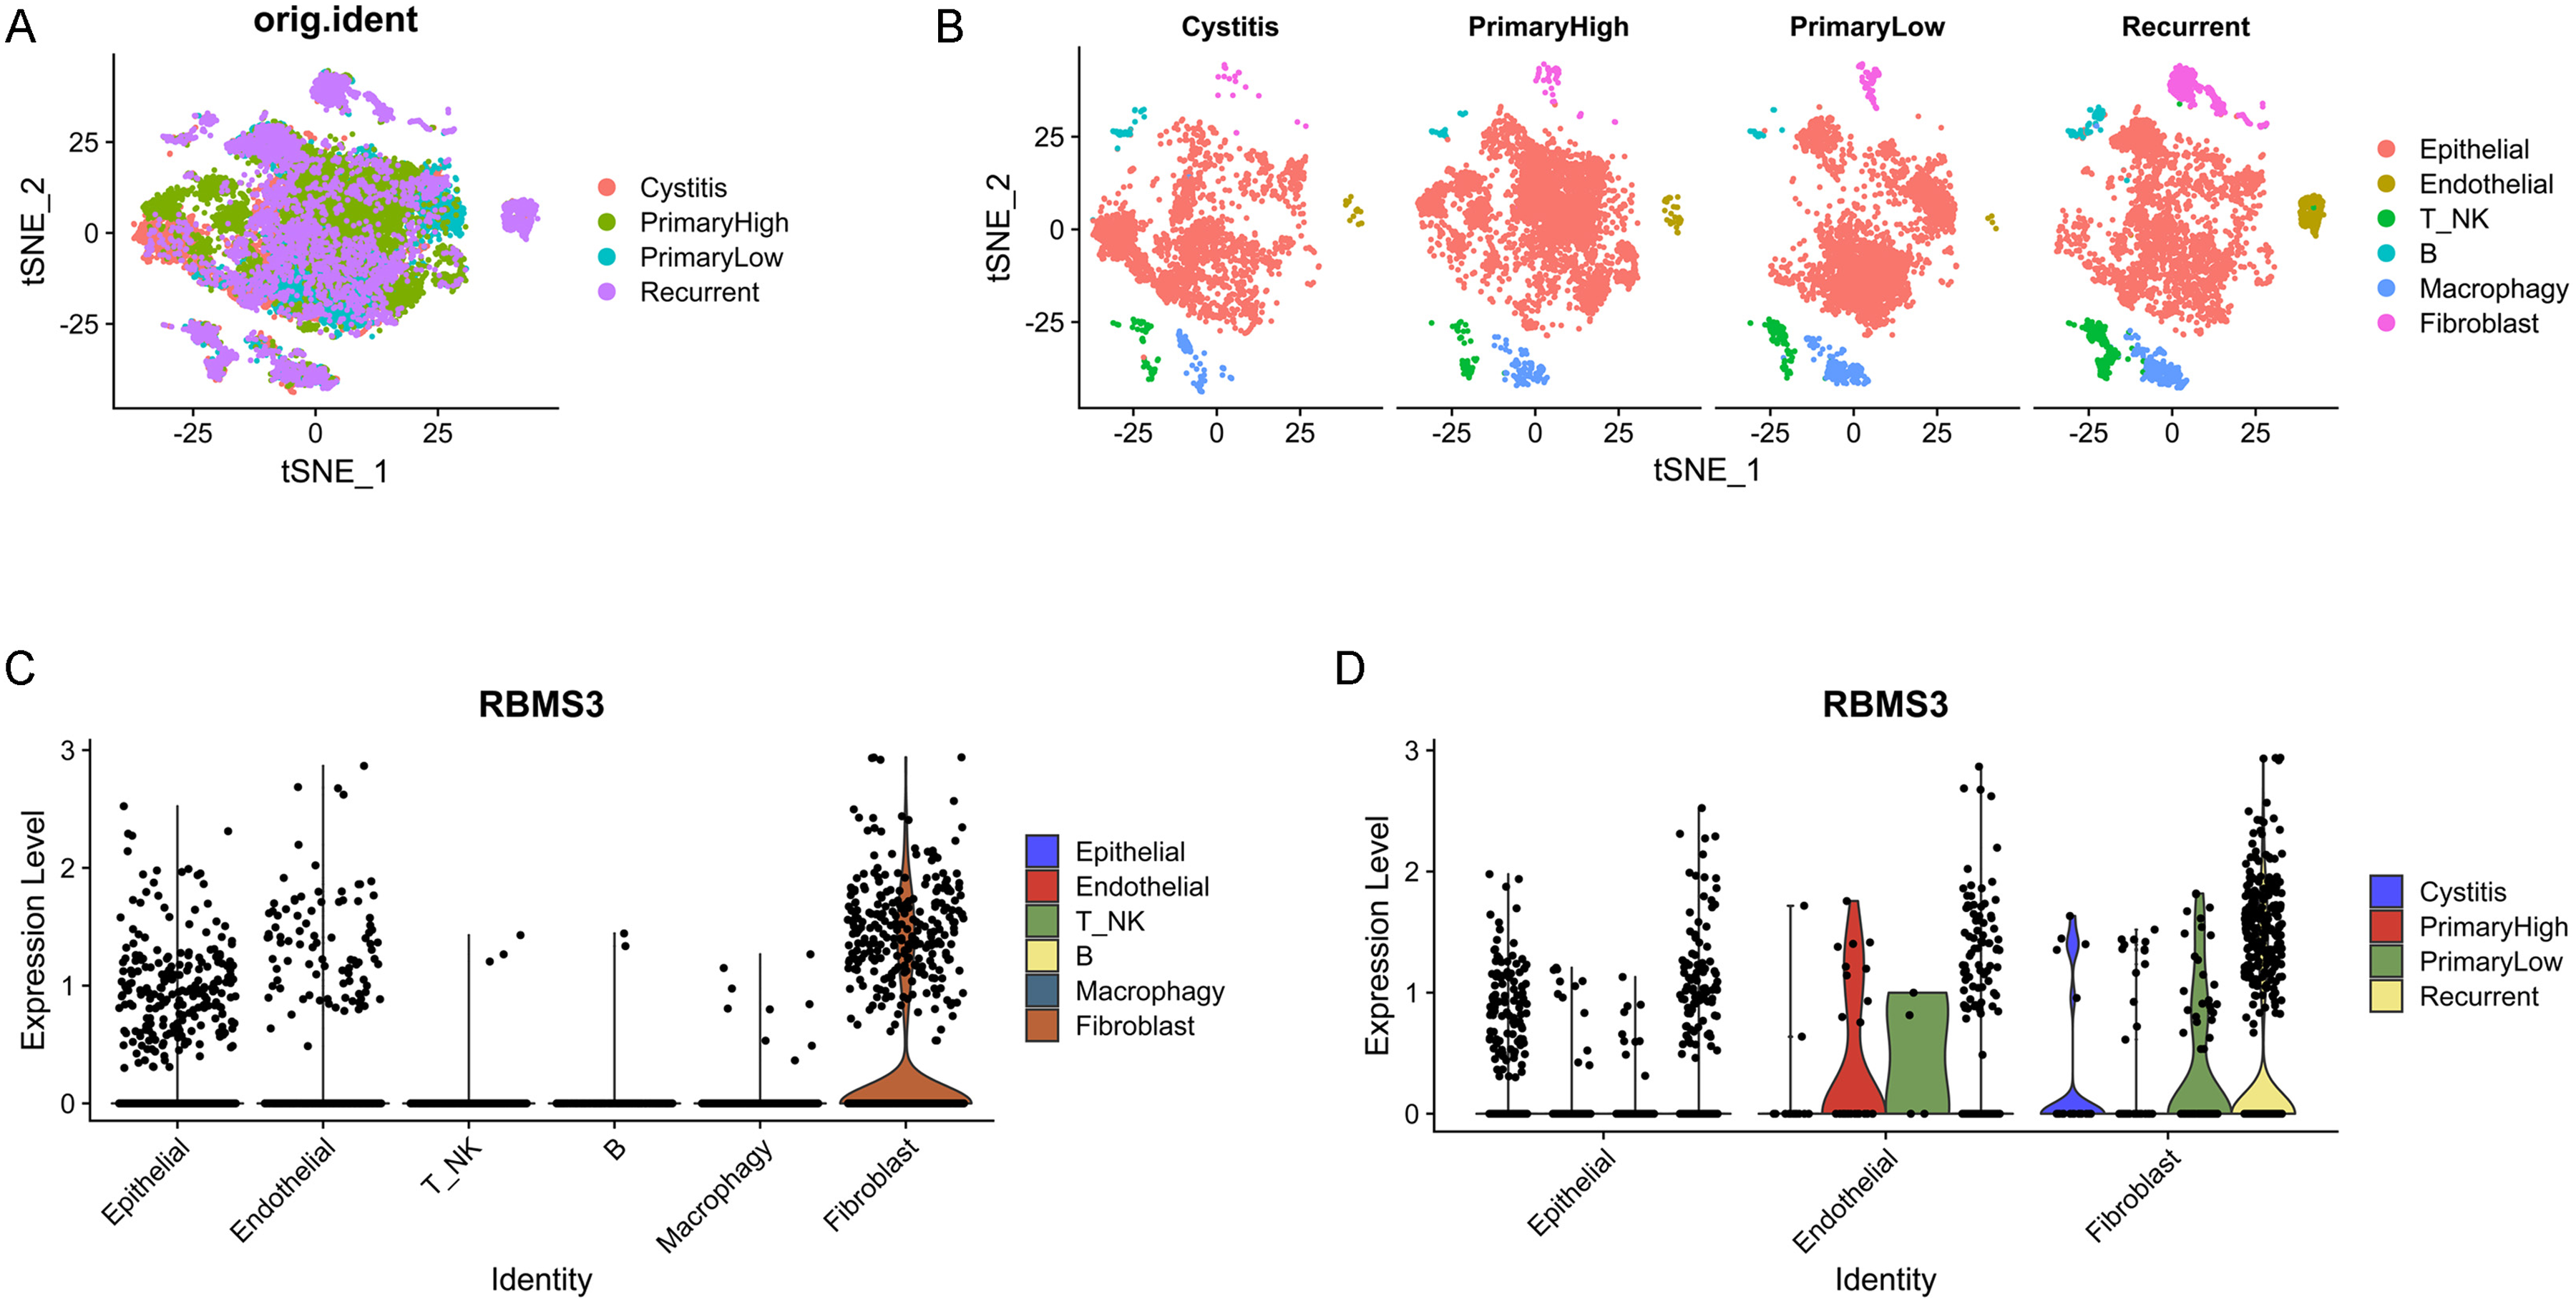
RBMS3 is mainly expressed in epithelial, endothelial, and fibroblast cells. (A) tSNE plot of cells from four patients. (B) tSNE plot of the cell clusters split according to origin. (C) VlnPlot of RBMS3 expression according to cell type. (D) RBMS3 expression in epithelial, endothelial, and fibroblast cells split according to origin.
To characterize RBMS3 expression, scRNA-Seq data (GSE190888) of patients with cystitis and BLCA were analyzed. After quality control, 3179 cells with cystitis, 5376 cells with high-grade BLCA, 4583 cells with low-grade BLCA, and 4885 cells with recurrent BLCA were obtained. According to tSNE and cell-type annotation, the cells were clustered into the following six groups: epithelial, endothelial, T/NK, B-, macrophage, and fibroblast cells (Figure 6A, B). RBMS3 was mainly expressed in epithelial, endothelial, and fibroblast cells but rarely in immune cells (Figure 6C). This is consistent with the above data on the correlation of RBMS3 with tumor stroma. Furthermore, RBMS3 expression was increased in recurrent patients, especially in recurrent fibroblasts (Figure 6D). Moreover, in another scRNA-Seq data (GSE192575) which containing chemotherapy-sensitive and resistant human bladder cancers, the expression of RBMS3 was significantly increased in the chemotherapy-resistant bladder cancer (Supplementary Figure 3). This indicates that RBMS3 may be involved in activating cancer-associated fibroblasts and could contribute to TME remodeling.

RBMS3 expression in BLCA tissue. (A)The immunohistochemistry results of RBMS3 protein in normal bladder and BLCA tissues from the Human Protein Atlas. (B) In the primary and recurrent BLCA tissues, RBMS3 mRNA level was examined by quantitative real-time PCR, ** P< 0.01 (left), RBMS3 protein was detected by immunohistochemistry assay.
To further clarify RBMS3 expression at protein level, the Human Protein Atlas database was searched to compare expression levels between normal bladder and BLCA tissues. RBMS3 protein was expressed at a moderate intensity in 75%–25% of normal bladder tissues. RBMS3 expression showed significant heterogeneity in BLCA tissues. It varied from weak to moderate to strong among the different tumor tissues (Figure 7). More importantly, RBMS3 was not ubiquitously expressed in tumor tissues. In most tumors, only a portion (
3.7 High RBMS3 expression predicts poor survival in BLCA immunotherapy

High RBMS3 expression predicts poor response to BLCA immunotherapy. (A–C) Exploration of RBMS3 expression as prognostic markers for BLCA immunotherapy (immune checkpoint inhibitors) using the Imvigor210CoreBiologies dataset. (A) Difference of RBMS3 expression between different immune response patients, NR: non-response, R: response. (B) Comparison of immune response ratio between high- and low-RBMS3 expression patients. (C) Survival analysis of high- and low-RBMS3 expression patients. (D–F) Survival analysis of the high- and low-RBMS3 expression BLCA patients received immune checkpoint inhibitors treatment using the Kaplan-Meier Plotter. (D) Kaplan–Meier plot of anti–PD-1 and (E) anti–PD-L1 immunotherapy in BLCA (
The TME is an essential factor affecting immune response. As key components of the TME, cancer-associated fibroblasts play critical roles in efficient anti-programmed cell death protein 1(PD-1)/anti-programmed death ligand 1 (PD-L1) immunotherapy by participating in extracellular matrix remodeling.27, 28 Since RBMS3 is highly correlated with fibroblast cells and the immunosuppressive TME, we wondered whether it affects immunotherapy. Our results based on the Imvigor210CoreBiologies dataset showed that the non-response patients had higher RBMS3 expression level than the response patients (
We further analyzed the predictive value of RBMS3 on BLCA immunotherapy through the Kaplan-Meier Plotter. Results showed that high RBMS3 expression was a risk factor for anti–PD-1 (HR
4. Discussion
Risk stratification of cancer traditionally uses clinical and pathological characteristics to provide prognostic information, helping to select the best treatment for each patient. 4 Epidemiologically, advanced age, cigarette smoking, and heredity are the risk factors for BLCA. 2 Based on genetic alterations in the DNA and subsequent RNA expression levels, BLCA can be grouped into distinct molecular subtypes with variable prognostic, predictive, and therapeutic implications. 2 Increasing evidence indicates that RBPs play a crucial role in the initiation, development, and recurrence of various malignant tumors. 29 Several studies have identified risk RBP signatures in BLCA.17,18,19 In this study, we established a risk score model based on DERBPs. Moreover, we successfully constructed a nomogram combining the risk score with clinical variables to establish a quantitative prognostic evaluation of the OS of BLCA patients. High-risk patients showed increased stromal scores and differential immune cell infiltration compared to low-risk patients. These results indicate that prognostic RBPs participate in the malignant progression of BLCA by functioning as regulators of tumor stromal content.
RBPs establish highly dynamic interactions with coding and non-coding RNAs to regulate RNA splicing, stability, localization, translation, and degradation. 29 Therefore, critical RBPs that participate in the malignant progression of BLCA should be correlated with RNA expression. To further explore the critical RBPs for cancer development, we additionally identified RNA-correlated RBPs with prognostic value – namely, prognostic miRNA-correlated RBPs and prognostic lncRNA-correlated RBPs. After intersection, RBMS3 was found to be the only gene present in all three prognostic RBP signatures. We noticed that RBMS3 was also included in the prognostic RBP signature in previous studies.18, 19 This finding highlights the importance of RBMS3 in the development of BLCAs.
RBMS3 expression was downregulated in BLCA tissues compared to normal bladder samples. However, in BLCA samples collected at different tumor stages, RBMS3 was upregulated at relatively more advanced stages of BLCA. These contradictory findings have been observed for several genes. For example, the ferroptosis-related gene CHAC1 is downregulated in kidney renal clear cell carcinoma but shows increased expression in more malignant kidney renal clear cell carcinoma samples and is associated with poor OS. 30 Pleiotrophin mRNA levels in many breast cancer samples are not higher than normal levels; however, pleiotrophin also positively regulates growth, angiogenesis, and chemoresistance in breast cancer. 31 A reasonable explanation is that these genes may participate in malignant progression instead of cancer initiation. 30 In this study, RBMS3 expression was associated with poor OS in BLCA patients. Survival analysis restricted to the tumor subtype revealed that high RBMS3 expression was a risk factor for papillary BLCA but not for non-papillary BLCA. Moreover, the survival disadvantage is obvious in stage IV BLCA but not in lower-stage (II and III) BLCA. These results suggest an important contribution of RBMS3 to the malignant progression of BLCA, especially papillary BLCA.
By reviewing the existing literature, we noticed that RBMS3 can exert both pro- and anti-cancer effects in different types of cancers. First, RBMS3 was identified as a tumor-suppressive gene during tumorigenesis. RBMS3 effectively suppressed the tumorigenicity of esophageal squamous cell carcinoma cells by downregulating C-MYC.
32
Consistently, another study reported that the loss of RBMS3 cooperates with the oncoprotein BRAFV600E to induce lung tumorigenesis.
33
Silencing of RBMS3 promotes the growth of BRAFV600E lung organoids and the development of malignant lung cancers by elevating the Wnt/
However, recent studies have shown that RBMS3 has cancer-promoting potential, which is necessary for malignant progression. 36 The most well-studied cancer-promoting potential of RBMS3 concerns the epithelial-mesenchymal transition (EMT) relationship. 37 RBMS3 expression is positively associated with EMT. According to prior research, RBMS3 is necessary for maintaining the mesenchymal phenotype and invasion in triple-negative breast cancer models. 38 Loss of RBMS3 significantly impairs tumor progression and spontaneous metastasis in vivo. 38 Functionally, RBMS3 interacts with and stabilizes the mRNA PRRX1 (an EMT transcription factor). 38 The EMT-promoting function of RBMS3 may explain its upregulation in advanced tumors and its association with poor survival.
In the present study, RBMS3 expression was associated with a higher stromal score. Specifically, RBMS3 expression was highly correlated with counts of fibroblasts. Using scRNA-Seq analysis, it was also revealed that RBMS3 is highly expressed in fibroblasts and endothelial cells in BLCA tissues, while immunohistochemical analysis from the Human Protein Atlas confirmed that high levels of RBMS3 were observed in the tumor stromal area in some BLCA tissues. Similar results have been reported for breast cancer: higher RBMS3 expression was observed in breast cancer stromal cells compared to tumor cells. 36 Therefore, RBMS3 may be enriched in tumor stromal cells, thereby participating in TME remodeling. The immunosuppressive TME is a major obstacle to efficient anti-cancer immunotherapy. 28 According to the infiltration pattern of immune cells, tumors are commonly classified into three categories – namely, “inflamed”, “immune-excluded”, and “immune desert”. 39 Most BLCA tumors (approximately 47%) are immune-excluded and show a lower response to immune checkpoint inhibitors. 40 Abnormal activation of tumor-associated fibroblasts plays a critical role in immune-excluded BLCA tumors. 40 In this study, RBMS3 was highly correlated with fibroblast cells and the immunosuppressive TME. Moreover, the Kaplan–Meier plot demonstrated that high RBMS3 expression is a risk factor for immunotherapy in patients with BLCA. Actually, RBMS3 has been reported to be a target to improve anti-cancer immunity in triple-negative breast cancer. RBMS3 correlates with several immunosuppressive molecules such as CD274. Mechanistically, RBMS3 protein binds to CD274 mRNA specifically to increase PD-L1 levels. Disruption of RBMS3 can enhance the anti-tumor immune activity by suppressing PD-L1. 41 Collectively, these results highlight the role of RBMS3 in promoting an immunosuppressive TME in BLCA.
This study had some limitations. Most results of this were gleaned from public databases, and additional in vitro and in vivo studies are needed to prove the mechanism of action of RBMS3 in BLCA. TCGA was the main database used in this study, additional well-developed datasets were required to validate the main findings.
In conclusion, we constructed three prognostic RBPs signatures based on DERBPs, miRNA-correlated RBPs, and lncRNA-correlated RBPs in BLCA. RBMS3 has been identified as a key prognostic gene with TME remodeling functions. The potent role of RBMS3 in the immunosuppressive TME provides a foundation and new ideas for BLCA immunotherapy.
Footnotes
Acknowledgments
This study was supported by a grant from the Natural Science Foundation of Guangdong Province (No.2022A1515010515) and Heyuan City Science and Technology Plan Project (No. Heke Platform 007).
Declaration of interests
The authors declare that they have no known competing financial interests or personal relationships that could influence the work reported in this study.
Author contributions
All authors listed have made a substantial contribution to this work and approved the manuscript. Conception: Jinlong Li and Li Zhou; interpretation or analysis of data: Tarimo Fredrick Praygod and Zhiming Hu; preparation of the manuscript: Li Zhou and Tarimo Fredrick Praygod; revision for important intellectual content: Hongwei Li and Tan Wanlong; supervision: Jinlong Li.
Supplementary data
The supplementary files are available to download from