
Abstract
Objectives
Pancreatic cancer presents a formidable challenge with its aggressive nature and dismal prognosis, often hampered by elusive early symptoms. The tumor microenvironment (TME) emerges as a pivotal player in pancreatic cancer progression and treatment responses, characterized notably by hypoxia and immunosuppression. In this study, we aimed to identify hypoxia-related genes and develop a prognostic model for pancreatic cancer leveraging these genes.
Methods
Through analysis of gene expression data from The Cancer Genome Atlas (TCGA) and subsequent GO/KEGG enrichment analysis, hypoxia-related pathways were identified. We constructed a prognostic model using lasso regression and validated it using an independent dataset.
Results
Our results showed that expression levels of PLAU, SLC2A1, and CA9 exhibited significant associations with prognosis in pancreatic cancer. The prognostic model, built upon these genes, displayed robust predictive accuracy and was validated in an independent dataset. Furthermore, we found a correlation between the risk score of the prognostic model and clinical parameters of pancreatic cancer patients. At the same time, we also explored the relationship between the established hypoxia-related prognostic model and the immune microenvironment at the single-cell level. RT-qPCR results showed notable differences in the expression of hypoxia pathway-related genes between normal PANC-1 and hypoxic-treated PANC-1 cells.
Conclusion
Our study provides insights into the role of the hypoxic microenvironment in pancreatic cancer and offers a promising prognostic tool for clinical application.
Introduction
Pancreatic cancer (PC), characterized by malignant cell growth in pancreatic tissue, stands as the third leading cause of cancer-related mortality in America, often claiming patients’ lives within six months of diagnosis. 1 Pancreatic ductal adenocarcinomas represent the predominant subtype, encompassing 80–90% of cases. 2 This malignancy manifests with aggressive features including dense interstitium, severe hypoxia, and an immunosuppressive microenvironment. 3 Compounded by elusive early symptoms, pancreatic cancer typically evades detection until advanced stages, 4 contributing to pancreatic cancer bleak prognosis. 5 Novel diagnostic and prognostic therapeutic targets are urgently needed, particularly for pancreatic ductal adenocarcinoma.
The tumor microenvironment encompasses the intricate relationship between tumor occurrence, growth, and metastasis, encompassing both the internal and external milieu of tumor cells. This environment encapsulates not only the structure, function, and metabolic aspects of tumor tissues but also the internal cellular environment. 6 Constant interaction between tumor cells and the tumor microenvironment dynamically shapes disease progression. 7 Hypoxia and immunosuppression emerge as principal characteristics of the tumor microenvironment, with hypoxia being a prevalent feature in solid tumors. 8 Aberrant cancer cell proliferation leads to compromised oxygen diffusion, coupled with dysfunctional tumor neovascularization, disrupting tumor microcirculation and inducing hypoxia with solid tumors. 9 The hypoxic environment not only fosters rapid tumor growth and spontaneous metastasis in pancreatic tumors but also confers resistance to radiation therapy, 10 rendering chemotherapy and radiotherapy less effective. 11 To adapt to hypoxia, evade apoptosis, and sustain continuous proliferation, pancreatic cancer cells primarily promote the formation of tumor neovascularization, augment glucose transport, and enhance glucose metabolism, thereby ensuring tumor cell survival, proliferation, metastasis, and drug resistance. 12
Studies have elucidated the close association between the malignant progression, treatment resistance, and poor prognosis of pancreatic cancer and the immunosuppressive nature of its microenvironment. 13 Within the tumor microenvironment, diverse immune components interact intricately, influencing the occurrence, development, invasion, and metastasis of pancreatic cancer. 14 Under normal circumstances, the immune system effectively eliminates tumor cells and prevents the occurrence and development of tumors. 15 However, when tumor cells enter TME, they activate immune cells and other immune-related cells in the tumor immune microenvironment, facilitating the evasion of immune surveillance by cancer cells, and even inhibiting the cytotoxic function of anti-tumor immune cells through various mechanisms. 16
Pancreatic cancer harbors an anoxic tumor microenvironment, which affects tumor metastasis and treatment responses, leading to poor prognosis. Enhancing comprehension of the role of the anoxic microenvironment in the clinical management and prognostication of pancreatic cancer necessitates the development of an effective prognostic model tailored to the anoxic microenvironment of pancreatic cancer.
Methods and Materials
Cell Culture and Reagents
Human pancreatic cancer cell line PANC-1 was purchased from PROCELL, while human normal pancreatic ductal cell line hTERT-HPNE was purchased from CELL RESEARCH. Both types of cells were stored in liquid nitrogen at the sample bank of the Affiliated Hospital of Qingdao University. Both PANC-1 and hTERT-HPNE were cultured in DMEM supplemented with 10%FBS and 1% P/S. PANC-1 cells were cultured in an anoxic incubator (Ruskinn Invivo2 400 anoxic workstation) for 24 h following starvation treatment with Dextrose-free DMEM/F12 medium(PROCELL) for 6 h.
Search for Hypoxia-Related Genes
We used GEPIA2 17 to identify differential expression genes in pancreatic cancer, with genes having P < 0.05 considered differentially expressed. Genes with log2FC > 2.5 were regarded as up-regulated, while those with log2FC < −2.5 were considered down-regulated. A volcano map was then used to depict these differential genes.
To explore enrichment pathways and genes associated with hypoxia, various analytical tools and databases were employed. First, “clusterProfiler”, “msigdbr,” and MSigDB Collections gene set database were used for GO/KEGG enrichment analysis of differential genes, aiding in the identification of biological processes and pathways associated with hypoxic conditions.
We then used the STRING database to construct a protein-protein interaction (PPI) network involving the aforementioned hypoxic-related genes, enhancing understanding of their interactions and effects under hypoxia.
To further investigate the importance of immune-related genes within the PPI network, we used the “Stress” algorithm to score these genes. This helps to identify key immune-related genes. The top 20 rated genes were then subjected to univariate COX regression analysis using the “survival” software package to explore their relationship with relevant survival data.
Establishment of Prognostic Model
RNAseq data and clinical data from TCGA-PAAD were obtained from the TCGA database (<https://portal.gdc.cancer.gov/>) and served as the training set (Supplementary file 1: table S1). We further analyzed hypoxia-related genes with P < 0.05 obtained by univariate COX regression. First, the training set was modeled using the “survival” software package. The “glmnet” software package was employed to calculate lambda values of the model. Based on these lambda values, coefficient values of variables were computed, and variables with coefficient values of 0 were filtered out. This process facilitated the construction of a Lasso prognostic model comprising the most relevant variables, thereby enhancing the model's generalization performance.
In addition, 10-fold cross-validation to get the optimal model. Cross-validation aids in determining optimal parameters and assessing model performance.
According to the median risk score from OS survival analysis, PAAD patients were divided into high-risk and low-risk groups. A ROC curve was developed using the “timeROC” software package to evaluate the prognostic effect of the model.
Verification of Prognostic Model
To validate the robustness of our model, we used the selected GSE62452 dataset for validation (Supplementary file 2: table S2). At the same time, employing the “rms” and “survival” software packages, we assessed the prediction performance of the model against actual outcomes. This evaluation involved plotting the actual probability against the predicted probability of the model across different situations. Next, to determine whether our model exhibits superior prognostic predictive ability compared to traditional clinical prognosis scoring systems, we used the “pROC” software package to construct ROC curves for the risk score and related clinical variables. Histological grade and T stage, along with other clinicopathological parameters, were subjected to univariate and multivariate Cox regression analysis to evaluate the risk scoring system's potential as an independent predictor.
Clinical Significance of the Model
We also studied the relationship between the risk score generated by our prognostic model and the clinical characteristics of TCGA-PAAD patients. Patients were grouped according to clinical characteristics, and the relationship between risk scores and clinical characteristics of patients in TCGA-PAAD was analyzed.
Analysis of the Level of Immune Cell Infiltration
Using the ssGSEA algorithm provided in “GSVA”, immune infiltration corresponding to the prognostic model was calculated using 24 immune cell markers as outlined in the “immunity” article. 18 Additionally, the expression levels of immune checkpoint-related molecules in the TCGA-PAAD cohort of pancreatic cancer patients were calculated.
Distribution of Hypoxic-Related Genes in the Immune Microenvironment of Pancreatic Cancer
To further explore the relationship between our prognostic model and the immune microenvironment of pancreatic cancer, we used the pancreatic cancer single-cell sequencing dataset (GSA: CRA001160) for subsequent analysis. 19 The downloaded single-cell sequencing samples underwent preprocessing, renaming, combination, and reading into R(version 4.0.4) software. These samples were then loaded into the Seurat package, where objects were created and the number of detected genes was determined. Mitochondrial genes were removed from single cells where they accounted for more than 500 cells (twenty percent of the cells). Standardized data were used to identify highly variable genes, followed by PCA analysis. UMAP clustering was then used to preliminarily analyze cell clustering and identify various group characteristic genes.
Real-Time Quantitative PCR
Total RNA was extracted from untreated PANC-1, anoxically treated PANC-1 and hTERT-HPNE cells using Trzoil. Reverse transcription was performed using PrimeScrip RT-PCR kit (Takara, Japan), followed by RT-qPCR performed on Roche instruments with SYBR PreMix Ex Taq (Takara, Japan). The sequence of primers used in this study are in Supplementary file 3: table S3.
Statistical Analysis
GraphPad Prism 6 was used for image editing. SPSS 20.0 was used for statistical analysis of clinical data. The t-test was used to compare the differences between two groups, and data are presented as mean ± standard error. A p value <0.05 indicates a statistically significant difference. The reporting of this study conforms to TRIPOD guidelines. 20
Result
Search for Hypoxia-Related Genes
A total of 9211 genes were screened with P < 0.05, including 1279 up-regulated genes and 116 down-regulated genes (Figure 1A). Hypoxia-related pathways were investigated through GO/KEGG enrichment analysis of 2615 differentially expressed genes, revealing one pathway associated with hypoxia: response to hypoxia (GO:0001666,45 genes identified in total) (Figure 1B).

Gene differential expression and enrichment analysis from GEPIA2, A A total of 9211 differentially expressed genes were screened, comprising 1279 genes up-regulated and 116 genes down-regulated. B Pathways related to hypoxia screened through GO/KEGG enrichment analysis. One of the pathways related to hypoxia was “response to hypoxia” (GO:0001666), with a total of 45 genes identified.
In the STRING database, the “Stress” algorithm was used to screen a gene involved in the hypoxia pathway (Figure 2A-B). Key hypoxia genes with p < 0.05 were further identified by univariate COX regression analysis (Supplementary file 4:table S4).

Visualization of genes associated with hypoxia pathways, A Genes related to hypoxia pathway screened by the “Stress” algorithm in the STRING database. B Selected key hypoxia genes with a p-value less than 0.05 identified through univariate Cox regression analysis.
Construction of a Prognostic Model
For key hypoxic genes with P < 0.05 obtained from univariate COX regression, lasso regression was employed to screen variables and establish prognostic models. Prognostic model formulas were developed for all cancer samples in the training set:
RiskScore = PLAU*0.23118476032699 + SLC2A1*0.0299816024619313 + CA9*0.0565720151088764 (Figure 3A-B). To evaluate the prognostic capability of our model in predicting the prognosis of patients with pancreatic cancer, 178 patients were divided into two groups: a high-risk group (n = 89) and a low-risk group (n = 89) (Figure 3C). Log-rank test revealed a significant difference in survival time distribution between the high-risk and low-risk groups, with poorer prognosis observed in the high-risk group (P = 0.008) (Figure 3D). Additionally, the expression levels of PLAU, SLC2A1, and CA9 were highest in the high-risk group and lower in the low-risk group (Figure 3D). ROC time analysis showed that the accuracy of prognosis was 0.69011 (95%CI0.592-0.7882) at 1 year and 0.72589 (95%CI0.6037-0.8481) at 3 years. The 5-year prognostic accuracy of OS was 0.78947 (95%CI0.6296-0.9493) (Figure 3E). These results collectively affirm the reliable prediction ability of our model.

Risk score analysis, prognostic performance, and survival analysis of prognostic models, A-B selected key genes related to hypoxia by Lasso regression and established the formula of prognosis model. C Divides 178 patients in the training set into high-risk group and low-risk group. D In the training set, the expression of PLAU, SLC2A1, and CA9 was higher in the high-risk group and lower in the low-risk group. F ROC time analysis showed that the prognostic accuracy of this model at 1 year, 3 years, and 5 years were 0.69011, 0.72589, and 0.78947, respectively.
Validation of Prognostic Models
To validate the accuracy of the established prognostic model, we used the GSE62452 dataset for validation and applied the same formula used in the training set to calculate the risk score. According to the median risk score (Figure 4A), the verification group was stratified into a high-risk group (n = 33) and a low-risk group (n = 32). Through Log-rank test analysis, we found that the high-risk group exhibited a shorter survival time (P = 0.018) (Figure 4B). ROC time-dependent analysis indicated prognostic accuracies of 0.5848 (95%CI0.4362-0.7334) at 1 year, 0.81829 (95%CI0.4362-0.7334) at 3 years, and 0.94286(95%CI0.8791 −1.0067) at 5 years (Figure 4C).
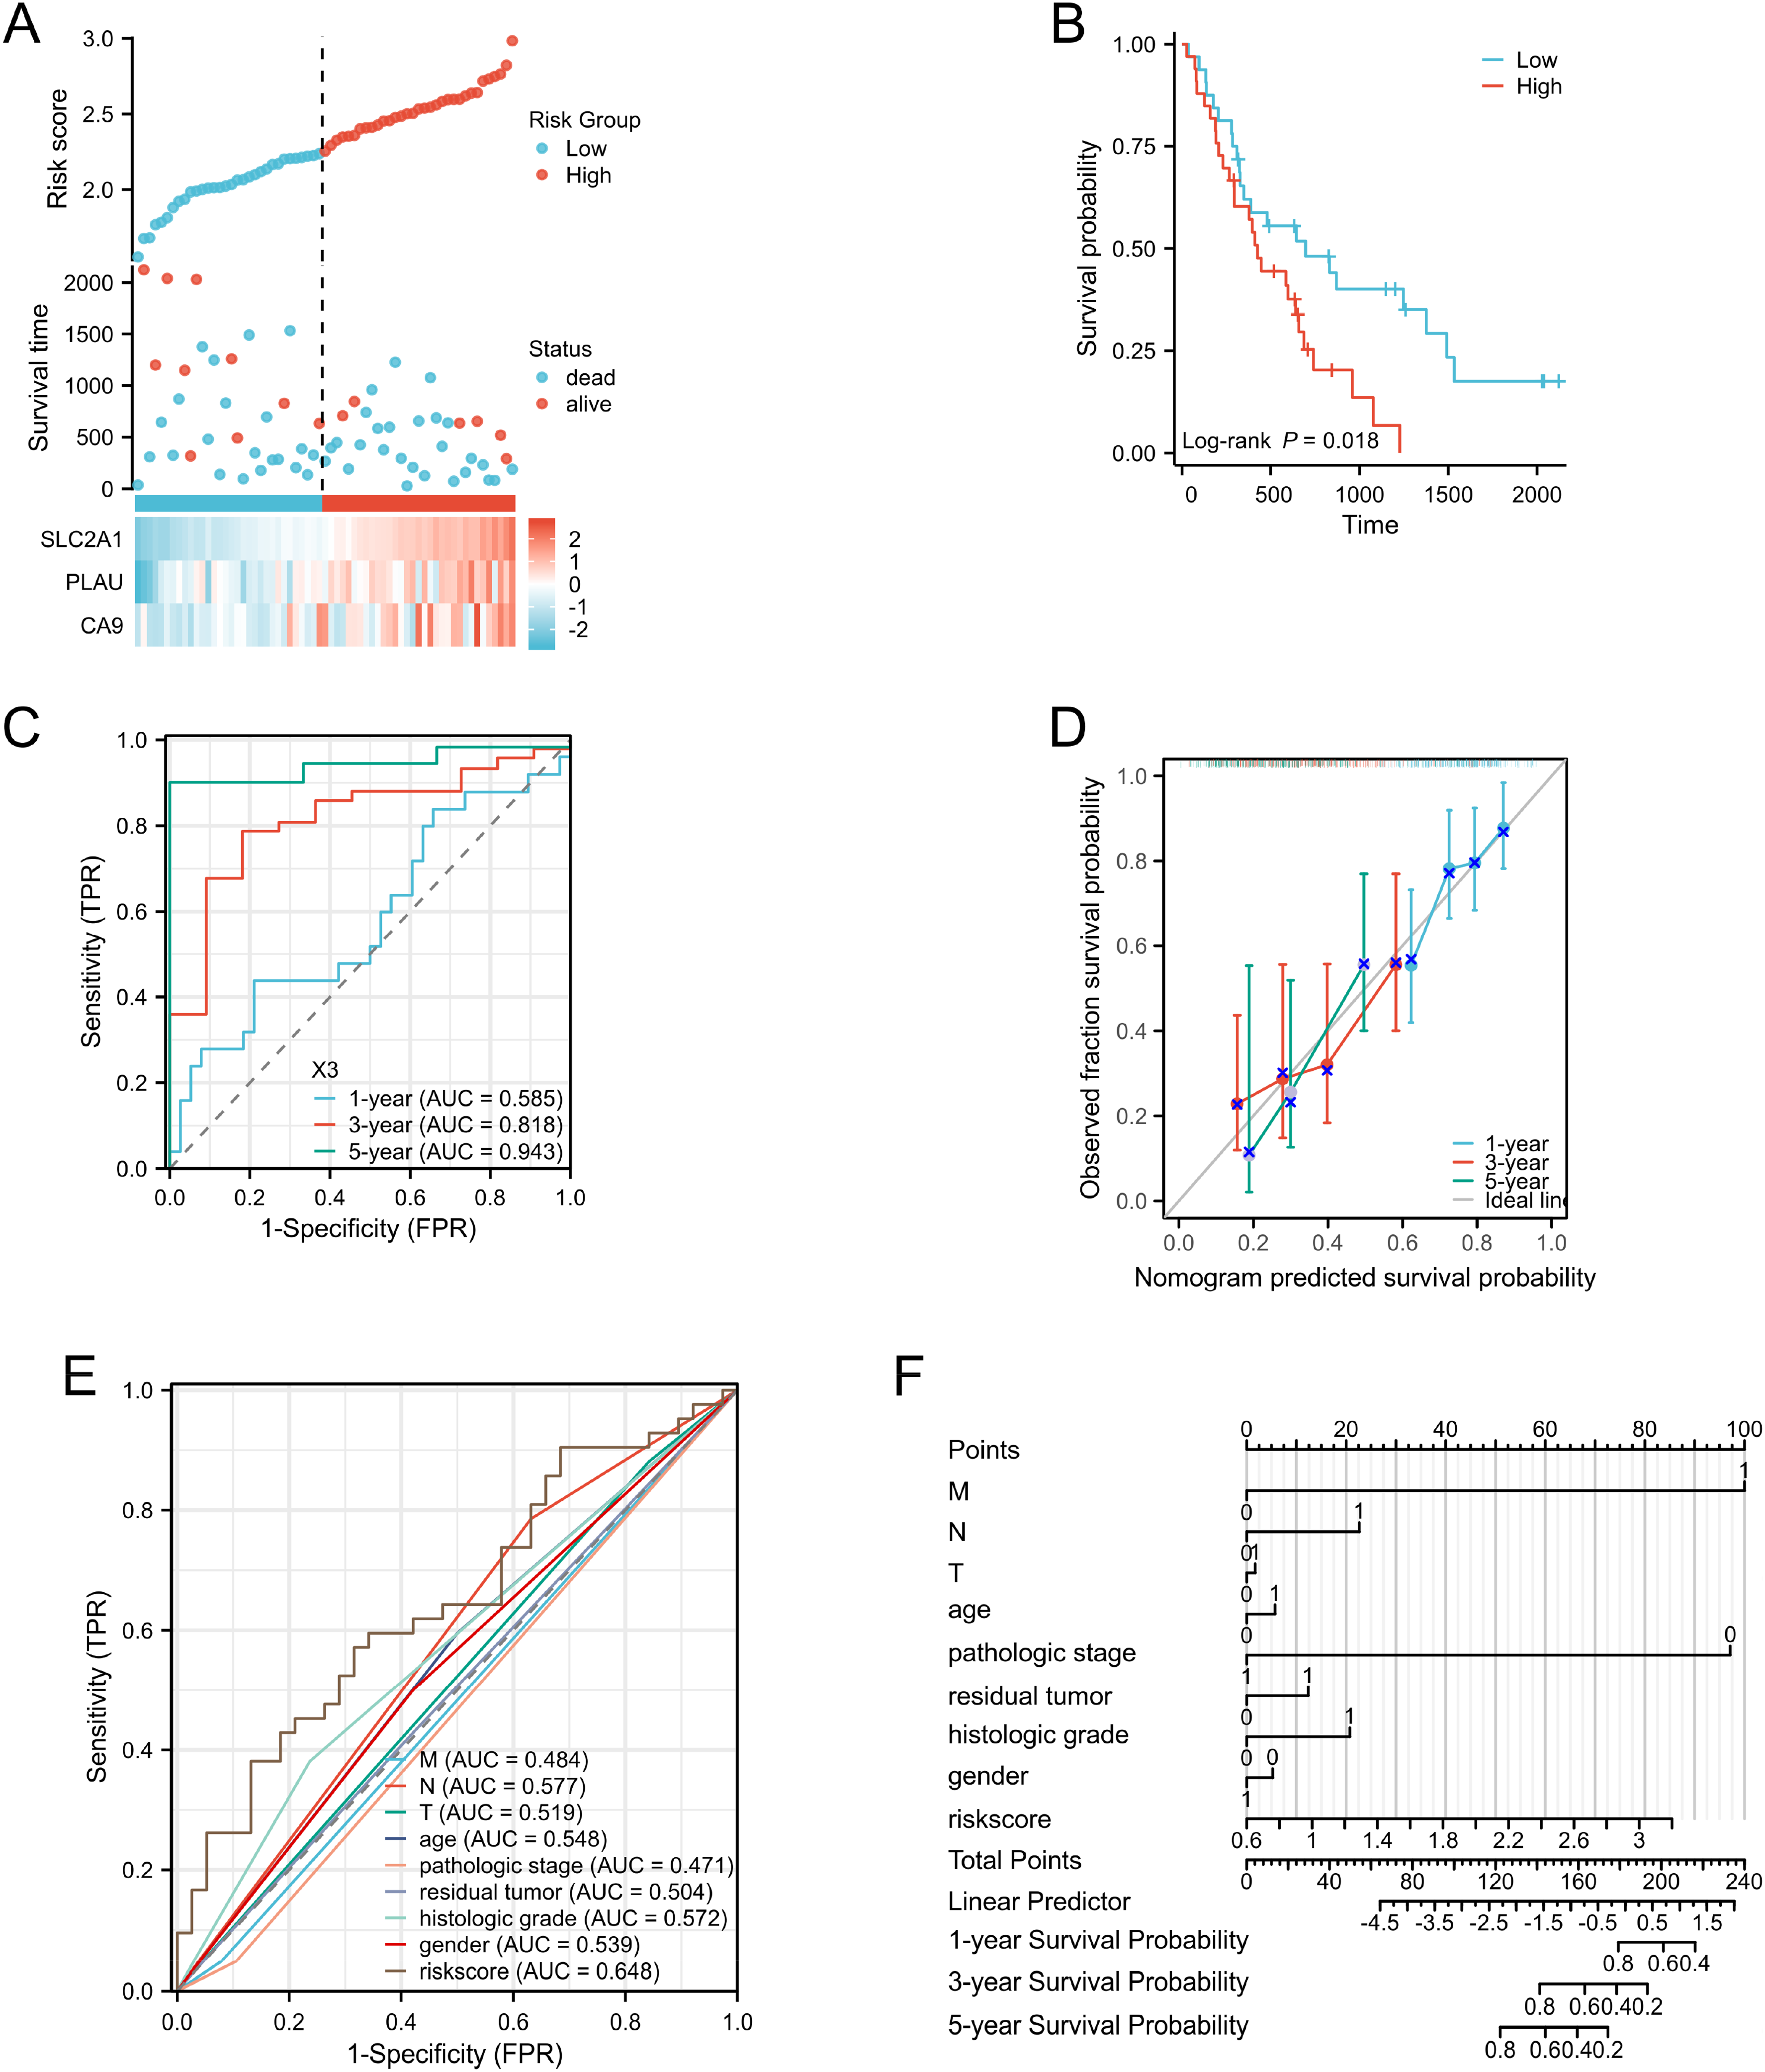
Analysis of the validation set prognostic model's risk score, prognostic performance, and survival analysis, A 65 patients in the verification set were divided into high risk group and low risk group. B Verification set. The expression of PLAU, SLC2A1, and CA9 was higher in the high-risk group, while lower in the low-risk group. C ROC time analysis showed that the prognostic accuracy of this model at 1 year, 3 years, and 5 years were 0.5848, 0.81829, and 0.94286, respectively. D Verifies the prediction ability of the model through calibration curve and ROC curve analysis. E The risk score of this model has a higher AUC value and a better prognosis. F Prognostic model established by combining clinical prognostic risk factors and risk score of prognostic model.
A calibration curve illustrated good agreement between our model and the actual survival time of PAAD patients (Figure 4D). Furthermore, we developed a nomogram model by combining T stage, gender, age, histological grade, and other potential clinical prognostic risk factors of PAAD patients with the risk score of our prognostic model (Figure 4F). Notably, the risk score of our model exhibited a higher AUC and superior prognostic efficacy (Figure 4E).
Correlation Between Risk Scores and Clinical Features
We found a relationship between the risk score of our prognostic model and the clinical characteristics of TCGA-PAAD. Significant differences in risk score distribution were noted among T stage (Figure 5A) and tumor residue (Figure 5B).

Association between clinical features and risk scores in the TCGA-PAAD dataset; The relationship between the risk score of the prognostic model and T stage(A) and tumor residue (B).
Analysis of Infiltration Level of Immune Cells
Correlation analysis between Riskscore and immune invasion matrix data showed that Th1 cells, NK CD56bright cells, Th2 cells, and Macrophages exhibited higher invasion degrees, whereas Th17 cells, pDC, TFH, T cells, CD8 T cells, and Eosinophils demonstrated lower invasiveness (Figure 6A). We also found that in our model, CD276, TNFSF4, CD70, TNFSF9, CD44, CD80, CD274, CD160, TNFRSF18, CD40, PDCD1LG2, HHLA2, TNFRSF4, CD40LG, TNFRSF9, HAVCR2, TNFRSF25, LGALS9, ADORA2A, and CD86 expressed differently in high-risk and low-risk patients. CD160, CD40LG, and ADORA2A were highly expressed in the low-risk group, while other molecules exhibited negative expression in the low-risk group (Figure 6B). In our study, we directly analyzed the correlation between hypoxia-related gene molecules and the precalculated immune cell fraction based on the TCGA-PAAD public data. We found that three different hypoxia-related gene molecules were positively correlated with Th2 immune cells2, and T and B immune activated cells (Figure 6C,D,E).

Immune infiltration and risk score association in the TCGA-PAAD dataset, The relationship between the risk score of the prognostic model and the degree of immune cell invasion (A) and the expression of immune-related molecules (B).
Distribution of Hypoxic-Related Genes in the Immune Microenvironment of Pancreatic Cancer
Through in-depth analysis of sc-RNA data (GSA: CRA001160) (Figure 7A), we found high expression of major components of the tumor immune microenvironment, including macrophages, fibroblasts, B cells, and T cells, in pancreatic cancer tissue (Figure 7B). Analysis of the expression of key hypoxic genes in the predictive model indicated their widespread distribution not only in malignant cells, such as Ductal cell type 2, but also in constituent cells of the immune microenvironment (Figure 7C). Specifically, CA9 was predominantly expressed in Fibroblast cells (Figure 7D), PLAU was primarily expressed in Fibroblast and Macrophage cells (Figure 7E), and SLC2A1 exhibited high expression in Fibroblast cell, Macrophage cell, T cell, and B cell (Figure 7F). Additionally, close cellular communication was observed between Fibroblast cells and malignant Ductal cell type 2 in the immune microenvironment of pancreatic cancer (Figure 7G), with PLAU playing an important role (Supplementary file 5:table S5).

Distribution of hypoxic-related genes in the immune microenvironment of pancreatic cancer, A GSA: cell scatter diagram of CRA001160. B Distribution of cell clusters in GSA: CRA001160 in tumor tissue and normal tissue. C Distribution of CA9 in cell clusters. D Distribution of PLAU in cell clusters. E Distribution of SLC2A1 in cell clusters. F Expression of CA9 in cell clusters. G Expression of PLAU in cell clusters. H Expression of SLC2A1 in cell clusters. I Single-cell RNA dataset GSA: CRA001160 Components of the pancreatic cancer immune microenvironment in CRA001160 and cellular communication in pancreatic cancer malignant cells.
Real-Time Quantitative PCR
RT-qPCR results demonstrated higher expression levels of PLAU, SLC2A1, and CA9 in PANC-1 cells compared to hTERT-HPNE cells (Figure 8A,C and E). Moreover, the expressions of PLAU, SLC2A1, and CA9 in PANC-1 cells treated with hypoxia were higher than those in untreated PANC-1 cells (Figure 8B,D and F).

The gene was expressed in PANC-1 cells and hTERT-HPNE cells, Real-time quantitative PCR verified the high expression of PLAU, SLC2A1, and CA9 in pancreatic cancer cells (A,C,E), and the higher expression in hypoxia conditions (B,D,F).
Discussion
Pancreatic cancer encompasses a group of malignant tumors originating mainly from pancreatic ductal epithelium and acinar cells. 21 Characterized by high malignancy, concealed onset, rapid progression, and short survival time in early diagnosis, 22 pancreatic cancer presents a formidable challenge in clinical management.
Within the tumor tissue of pancreatic cancer, tumor cells constitute less than 30%, with the majority comprising inflammatory interstitial cells and fibrous tissue, contributing to the hypoxic nature of pancreatic cancer. 18 This unique tumor microenvironment poses challenges for antineoplastic drug delivery through blood vessels and impedes the recognition and clearance of tumor cells by normal immune cells. 23 Consequently, tumor cells undergo adaptive changes to confront hypoxia, including alterations in glucose metabolism pathways and neovascularization. However, despite these adaptations, the hypoxic state of tumor cells persists due to the tumor's rapid growth. 24 Under hypoxic conditions, tumor cells secrete HIF1α, which regulates the increase of hypoxia response pathway, promoting processes such as epithelial transformation (EMT) and neovascularization. 25
In recent years, research on tumor microenvironment of pancreatic cancer has surged, with this leading to the identification of potential immunotherapy targets and hypoxia marker molecules. However, the understanding of the prognosis and tumor microenvironment of pancreatic cancer remains limited. 26 Through enrichment analysis of differentially expressed molecules in pancreatic cancer, we identified hypoxia-related pathways and key genes. Using univariate Cox regression, we identified prognostic genes related to hypoxia and established a prognostic model with Lasso analysis. Validation revealed high predictive ability. Our model is closely related to clinical features, and a high-risk score correlates with stage G, N, and tumor residue. Compared to conventional clinical index models, our model demonstrates superior prognostic efficacy. To enable effective clinical use, we combined our model's risk score with common prognostic factors such as TMN stage to form a Nomogram, enhancing clinical practice.
CA9, a 459-amino acid transmembrane protein, regulates intracellular and extracellular pH balance, contributing to hypoxic and acidic tumor microenvironments. 27 Studies show CA9 promotes cancer cell progression and invasion under hypoxic conditions. 28 Additionally, CA9 acidifies the extracellular environment, facilitating cancer cell metastasis. 29 SLC2A1, overexpressed in many cancers including pancreatic cancer, promotes aggressiveness by enhancing glycolysis, supporting tumor growth and metastasis. 30 PLAU degrades the extracellular matrix and stimulates tumor cell angiogenesis, migration, and invasion via the MAPK and ERK pathways. 31
Tumor progression is intricately linked to immune cell infiltration within the tumor microenvironment. 32 Pancreatic cancer cells often lack immunogenic antigen expression and major histocompatibility antigen (MHC) class I molecules. 33 . The immune microenvironment shows increased immunosuppressive cells and decreased anti-tumor immune cells. 34 Th1 cells release chemokines CXCL9 and CXCL10, exerting immunosuppressive effects, while NK CD56bright cells and Th2 cells suppress anti-tumor immune responses.35-37 Th17, pDC, TFH T cells, CD8 T cells, and eosinophils, main effector cells of anti-tumor immunity, show poor infiltration and activity in tumors, indicating poor tumor development.38-40 Our study found high infiltration of immunosuppressive cells in high-risk patients for pancreatic cancer hypoxia and high infiltration of anti-tumor immune activator cells in low-risk patients. Immunoregulatory factors like TGF-β1, IL-10, IL-35, CCL5, and CXCL12 contribute to the immunosuppressive nature. 41 Immune checkpoints PD-L1 and PD-L2 are upregulated in the high-risk group, correlating with hypoxic prognostic model risk factors, revealing significant infiltration of an immunosuppressive microenvironment in high-risk patients.
To further investigate the relationship between our hypoxic-related prognostic model and the immune microenvironment of pancreatic cancer, we conducted a meticulous analysis of single-cell sequencing data (GSA: CRA001160). Our findings revealed that hypoxia-related genes within the model exhibited elevated expression across multiple components of the pancreatic cancer immune microenvironment, especially in Fibroblast cell, where all three genes showed significantly high distribution. Fibroblast cell constitute a major portion of the tumor stromal cells within the tumor microenvironment, engaging in extensive interactions with tumor cells and exerting influence on other components in the immune microenvironment. 42 These cells secrete a variety of growth factors, cytokines, and extracellular matrix proteins, pivotal for tumor development, proliferation, angiogenesis, invasion, and metastasis. 43 In addition, Fibroblast cells have the capability to produce ECM proteins and recruit immunosuppressive cells such as monocytes and PD-1+ TAMs, thereby promoting the immunosuppression of tumor. 44 Fibroblast cell is not only related to the immunosuppressive microenvironment of pancreatic cancer, but also closely related to the characteristics of hypoxia. 45 It is involved in the regulation of tumor angiogenesis through various mechanisms, including secretion of angiogenic factors and modulation of angiogenesis-related signaling pathways. 46 These mechanisms contribute to aberrant formation and dysfunction of tumor blood vessels, eventually culminating in hypoxia of tumor tissue. 47 Furthermore, Fibroblast cells increase the pressure and tightness of tumor tissues by changing the structure and composition of tumor tissues, thus limiting the formation and function of tumor blood vessels. 48 Additionally, by regulating the metabolic pathway of tumor cells, Fibroblast cells increase the demand for oxygen, exacerbating the hypoxia of tumor tissues. 49 Through a dual level analysis of RNA-seq and single-cell sequencing data from TCGA, we uncovered a significant correlation between our established hypoxia-related prognostic model and the hypoxia and immune microenvironment of pancreatic cancer. In summary, tumor hypoxia can regulate various molecular and cellular mechanisms, alter tumor immune microenvironment, inhibit anti-tumor immune response, and ultimately promote tumor growth and progression. This complex relationship reveals potential strategies for targeting both hypoxia and immunosuppression in tumor therapy.
RT-qPCR analysis further corroborates these findings, demonstrating significantly altered expression levels of key hypoxic-related genes (PLAU, SLC2A1, and CA9) in pancreatic cancer cells under hypoxic conditions compared to untreated cells. This suggests that hypoxia-related genes play a crucial role in pancreatic cancer hypoxia, and their overexpression indicates significant malignant progression caused by hypoxia.
The hypoxic and immunosuppressive microenvironment of pancreatic cancer promotes the progression of pancreatic cancer. 50 However, our study has not yet explored the specific mechanism of hypoxic microenvironment leading to the malignant progression of pancreatic cancer, and has not specifically explored the effect of hypoxia-related molecules on the progression of pancreatic cancer in anoxia. Our future research is also conducting more in-depth exploration.
Conclusion
We established a prognosis model related to hypoxia in pancreatic cancer and studied its relationship with immune infiltration in pancreatic cancer. We found that our model can predict the prognosis of patients from hypoxia and immune infiltration in pancreatic cancer and provide new ideas and targets for the treatment of pancreatic cancer.
Supplemental Material
sj-docx-1-tct-10.1177_15330338241288687 - Supplemental material for Establishment of a Prognostic Model for Pancreatic Cancer Based on Hypoxia-Related Genes
Supplemental material, sj-docx-1-tct-10.1177_15330338241288687 for Establishment of a Prognostic Model for Pancreatic Cancer Based on Hypoxia-Related Genes by Yangdong Wu, MS, Jianrui Zhou, MS, Qingyan Kou, MS, Lin Sun, BSc, YuanMa, BSc, Tingting Yang, BSc, and Xiao Hu, MD in Technology in Cancer Research & Treatment
Supplemental Material
sj-docx-2-tct-10.1177_15330338241288687 - Supplemental material for Establishment of a Prognostic Model for Pancreatic Cancer Based on Hypoxia-Related Genes
Supplemental material, sj-docx-2-tct-10.1177_15330338241288687 for Establishment of a Prognostic Model for Pancreatic Cancer Based on Hypoxia-Related Genes by Yangdong Wu, MS, Jianrui Zhou, MS, Qingyan Kou, MS, Lin Sun, BSc, YuanMa, BSc, Tingting Yang, BSc, and Xiao Hu, MD in Technology in Cancer Research & Treatment
Supplemental Material
sj-docx-3-tct-10.1177_15330338241288687 - Supplemental material for Establishment of a Prognostic Model for Pancreatic Cancer Based on Hypoxia-Related Genes
Supplemental material, sj-docx-3-tct-10.1177_15330338241288687 for Establishment of a Prognostic Model for Pancreatic Cancer Based on Hypoxia-Related Genes by Yangdong Wu, MS, Jianrui Zhou, MS, Qingyan Kou, MS, Lin Sun, BSc, YuanMa, BSc, Tingting Yang, BSc, and Xiao Hu, MD in Technology in Cancer Research & Treatment
Supplemental Material
sj-docx-4-tct-10.1177_15330338241288687 - Supplemental material for Establishment of a Prognostic Model for Pancreatic Cancer Based on Hypoxia-Related Genes
Supplemental material, sj-docx-4-tct-10.1177_15330338241288687 for Establishment of a Prognostic Model for Pancreatic Cancer Based on Hypoxia-Related Genes by Yangdong Wu, MS, Jianrui Zhou, MS, Qingyan Kou, MS, Lin Sun, BSc, YuanMa, BSc, Tingting Yang, BSc, and Xiao Hu, MD in Technology in Cancer Research & Treatment
Supplemental Material
sj-docx-5-tct-10.1177_15330338241288687 - Supplemental material for Establishment of a Prognostic Model for Pancreatic Cancer Based on Hypoxia-Related Genes
Supplemental material, sj-docx-5-tct-10.1177_15330338241288687 for Establishment of a Prognostic Model for Pancreatic Cancer Based on Hypoxia-Related Genes by Yangdong Wu, MS, Jianrui Zhou, MS, Qingyan Kou, MS, Lin Sun, BSc, YuanMa, BSc, Tingting Yang, BSc, and Xiao Hu, MD in Technology in Cancer Research & Treatment
Footnotes
Availability of Data and Materials
All the datasets and data involved are accessible.
Declaration of Conflicting Interests
The authors declared no potential conflicts of interest with respect to the research, authorship, and/or publication of this article.
Ethical Approval
This study did not involve human or animal studies.
Funding
The authors disclosed receipt of the following financial support for the research, authorship, and/or publication of this article: This work was funded by National Natural Science Foundation of China, 52075277.
National Natural Science Foundation of China (grant number 52075277).
Supplemental Material
Supplemental material for this article is available online.
References
Supplementary Material
Please find the following supplemental material available below.
For Open Access articles published under a Creative Commons License, all supplemental material carries the same license as the article it is associated with.
For non-Open Access articles published, all supplemental material carries a non-exclusive license, and permission requests for re-use of supplemental material or any part of supplemental material shall be sent directly to the copyright owner as specified in the copyright notice associated with the article.