
Abstract
BACKGROUND:
The biological roles of immune-related genes (IRGs) in bladder cancer (BC) need to be further elucidated.
OBJECTIVE:
To elucidate the predictive value of IRGs for prognosis and immune escape in BC.
METHODS:
We comprehensively analyzed the transcriptomic and clinical information of 430 cases, including 19 normal and 411 BC patients from the TCGA database, and verified 165 BC cases in the GSE13507 dataset. The risk model was constructed based on IRGs by applying LASSO Cox regression and exploring the relationship between the risk score and prognosis, gene mutations, and immune escape in BC patients.
RESULTS:
We identified 4 survival-related genes (PSMC1, RAC3, ROBO2 and ITGB3) among 6,196 IRGs in both the TCGA and GES13507 datasets,, which were used to establish a gene risk model by applying LASSO Cox regression. The results showed that the high-risk (HR) group was closely associated with poor survival or advanced pathological stage of BC. Furthermore, the risk score was found to be an independent risk factor for prognosis of BC patients. In addition, high-risk individuals showed a greater prevalence of TP53 mutations lower CD8+ T-cell and NK cell infiltration, higher Treg cell infiltration, higher expression of PD-L1, and higher immune exclusion scores than those in the low-risk (LR) group. Finally, the experimental verification shows that the model construction gene, especially PMSC1, plays an important role in the growth and metastasis of bladder cancer.
CONCLUSIONS:
These evidences revealed the vital role of IRGs in predicting prognosis, TP53 mutation and immune escape in BC patients.
Introduction
Bladder cancer is among the top 10 most lethal forms of the disease around the world [1]. Muscle-invasive bladder cancer (MIBC) and none muscle-invasive bladder cancer (NMIBC) are the main pathological subtypes of BC, with different treatment strategies for each type. Early surgical treatment with subsequent chemotherapy is essential for NMIBC and has improved the prognosis of NMIBC patients [2]. For MIBC patients, cisplatin-based neoadjuvant chemotherapy (NAC) with surgical treatment remains the first-line strategy to help reduce the progression of MIBC [3]. Although these common therapies have made great improvements in BC prognosis, patients often suffer a high recurrence rate and high disease progression risks, which finally lead to metastatic BC without effective treatment [4]. Therefore, investigating effective methods for reducing progression has gained much attention around the world.
Recently, studies in the tumor microenvironment have delighted several possible mechanisms in the axis of immune functions with tumor progression. Importantly, immune cells have been considered a crucial factor in the tumor microenvironment. In BC, it has been reported that several subtypes of T cells contribute to reducing tumor progression, especially CD8+ T cells, and
It is worth noting that immunotherapy has shown promise as a novel treatment for BC [9]. Immunotherapy has demonstrated successful antitumor effects by stimulating the immune system, while different BC patients have different immunotherapeutic responses [10]. Bacillus Calmette–Guerin (BCG) was first used in the United States in the 1990s for stage I BC and remains the first-line immunotherapy for BC, however, many patients show a poor BCG therapeutic response [11, 12]. Therefore, it is important to identify those patients with poor immunotherapeutic responses so that we can choose more effective therapies in a timely manner. Immune checkpoints such as PD1 have been found to play a crucial role in suppressing immunological responses and developing self-tolerance by influencing T-cell activity, triggering the death of antigen-specific T cells, and reducing the apoptosis of regulatory T cells [13]. Importantly, more than 30% of patients who have metastatic BC respond well to immune checkpoint inhibitors (ICIs) [14]. With numerous studies investigating this approach, the Food and Drug Administration has licensed five ICIs for the treatment of BC, including the PD-1 inhibitors atezolizumab, nivolumab, and pembrolizumab, as well as the PD-L1 inhibitors avelumab and durvalumab [15]. In clinical studies, the aforementioned medications and CTLA inhibitors had significant antitumor action, significantly extending BC patients’ chances of survival [16]. Chimeric antigen receptor T-Cell immunotherapy (CAR-T) is based on the extraction of the patient’s own T cells, genetic modification, and reinfusion back into the patient to detect tumor cell surface antigens and destroy tumor cells [17]. There are several studies on other immunotherapeutic targets of BC, such as prostate-specific membrane antigen and human epidermal growth factor receptor 2, which have been shown to be effective in the treatment of BC with preliminary investigations, but more research is needed because of extratemporal cytotoxicity [18].
Meanwhile, mounting evidence suggests that the genes associated with immunity are crucial in cancer progression and treatment outcome [19]. A study discovered that the TUBA1C gene was associated with immune infiltration, which is considerably upregulated and related to the proliferation, migration, and invasion of BC cells, likewise suppressing tumorigenesis after TUBA1C function was blocked [20]. Analogously, as a known therapeutic target, FGFR3, the latest study found that it can increase the protein levels of PD-L1 and reduce the antitumor effects of CD8+ T cells, which could be a promising immunotherapeutic target [21]. However, the prognostic value of immune-related genes in bladder cancer prognosis and immune escape remains to be further explored. Somehow none of our existing treatments can effectively address these problems and novel biomarkers as well as a predictive model of immune-related genes which could help us to early predict prognosis and immune escape are urgently needed.
In this work, we developed a risk model based on differentially expressed IRGs and found close relationships between the risk scores and prognosis, PD-L1 expression levels, immune cell infiltration and immune exclusion of BC. These findings will also provide new molecular targets for personalized treatment of BC.
Material and methods
Data acquisition and preprocessing
Transcriptomic and SNP data and clinical information for 430 samples, including 411 BC and 19 normal cases, were obtained from the TCGA database (
The transcriptomics data and clinical information of 165 BC patients in dataset GSE13507 were obtained from the GEO data portal (
Identification of differentially expressed genes (DEGs)
All transcriptomics data have been standardized above. We identified DEGs of transcriptomics by the edge R package with FDR
Protein-protein interaction network
We built a protein-protein interaction network (PPI) for immune-related genes with STRING (
Functional enrichment analysis
Gene Ontology (GO) and Kyoto Encyclopedia of Genes and Genomes (KEGG) enrichment analyses of risk groups were performed by Gene Set Enrichment Analysis (GSEA) (
Risk model based on immune-related genes
We used univariate Cox analysis to confirm survival-related IRGs in both the TCGA and GEO cohorts, and 4 survival-related IRGs were finally identified. Then, we developed a prognostic model by the LASSO Cox regression model (R package “glmnet”). The cases in the TCGA and GEO cohorts were assigned a risk score as follows: Risk Score
Cell culture
The human bladder cancer cell lines UMUC3 and RT112 were purchased from the Institute of Biochemistry and Cell Biology, Chinese Academy of Sciences (Shanghai, China), and were cultured in DMEM (UMUC3) and RPMI-1640 (RT112) medium supplemented with 10% fetal bovine serum and 1% penicillin/streptomycin at 37
Cell transfection
The PSMC1 knockdown plasmid was purchased from GeneCopoeia™, China. First, we plated bladder cancer cells into 6-well plates and waited for the cell density to reach 80%–90% of the transfection phase. Then, we changed the culture medium to 1.5 ml Opti-MEM (Gibco, USA) two hours before transfection. Next, one EP tube contained 245
Wound healing assay
A horizontal line was drawn on the back of the 6-well plate before seeding the cells. The cells in different treatment groups (PSMC1-knockdown group and control group) were digested and centrifuged at 1500 rpm for 3 min after termination of digestion, the supernatant was removed and rinsed again with PBS, and the cells were counted. After cell counting, the cells were connected to 6-well plates, and the number was appropriate to cover the bottom of the plate after adherence. After the cells were spread all over the bottom of the plate, a cell scratch was made with a 200
Transwell assay
The transinfected cells of each group (PSMC1-knockdown group and control group) were incubated in serum-free medium for 12 hours and then adjusted to a density of 1
Immunofluorescence
The main and secondary antibodies used in this section were anti-Ki67 (Abcam, ab92742, USA) and anti-rabbit fluorescent antibody (ApexBio, USA). First, we combined 10
Statistical analysis
Two-sample
Results
Genotyping based on IRGs in BC patients
In our study, 430 cases, including 19 normal patients and 411 BC patients, were included from the TCGA database. First, 6,196 immune-related genes were included in the analysis, and the expression of these genes is shown in a heatmap (Fig. 1A). Moreover, we further identified 32 IRGs that were significantly different between normal and BC tissues, of which 19 genes were upregulated and 13 were downregulated in bladder cancer tissues (Supplementary Table 1). In addition, we found that the vast majority of these differentially expressed IRGs had good correlations and protein-protein interactions (PPIs) with each other (Fig. 1B–1C). Moreover, these differentially expressed IRGs were mainly enriched in cytokine receptor binding, natural killer cell-mediated cytotoxicity, the TNF signaling pathway and the JAK-STAT signaling pathway, which were intimately tied to the prognosis of patients (Fig. 1D–1E, Supplementary Fig. A–1B). These results suggested that those differentially expressed IRGs may have a strong impact in BC.
Genotyping of IRGs can distinguish prognosis in bladder cancer. (A) Heatmap of IRG expression levels of normal and BC cases in the TCGA cohort. (B) Protein-protein interaction network of IRGs that were differentially expressed in normal and BC patients in the TCGA cohort. (C) Correlation network of IRGs that were differentially expressed in normal and BC patients in the TCGA cohort. (D) GO enrichment analysis for the IRGs that were differentially expressed in normal and BC patients in the TCGA cohort. (E) KEGG enrichment analysis for the IRGs that were differentially expressed in normal and BC patients in the GEO cohort. (F) A total of 411 BC patients in the TCGA cohort were divided into two clusters based on the consensus clustering matrix (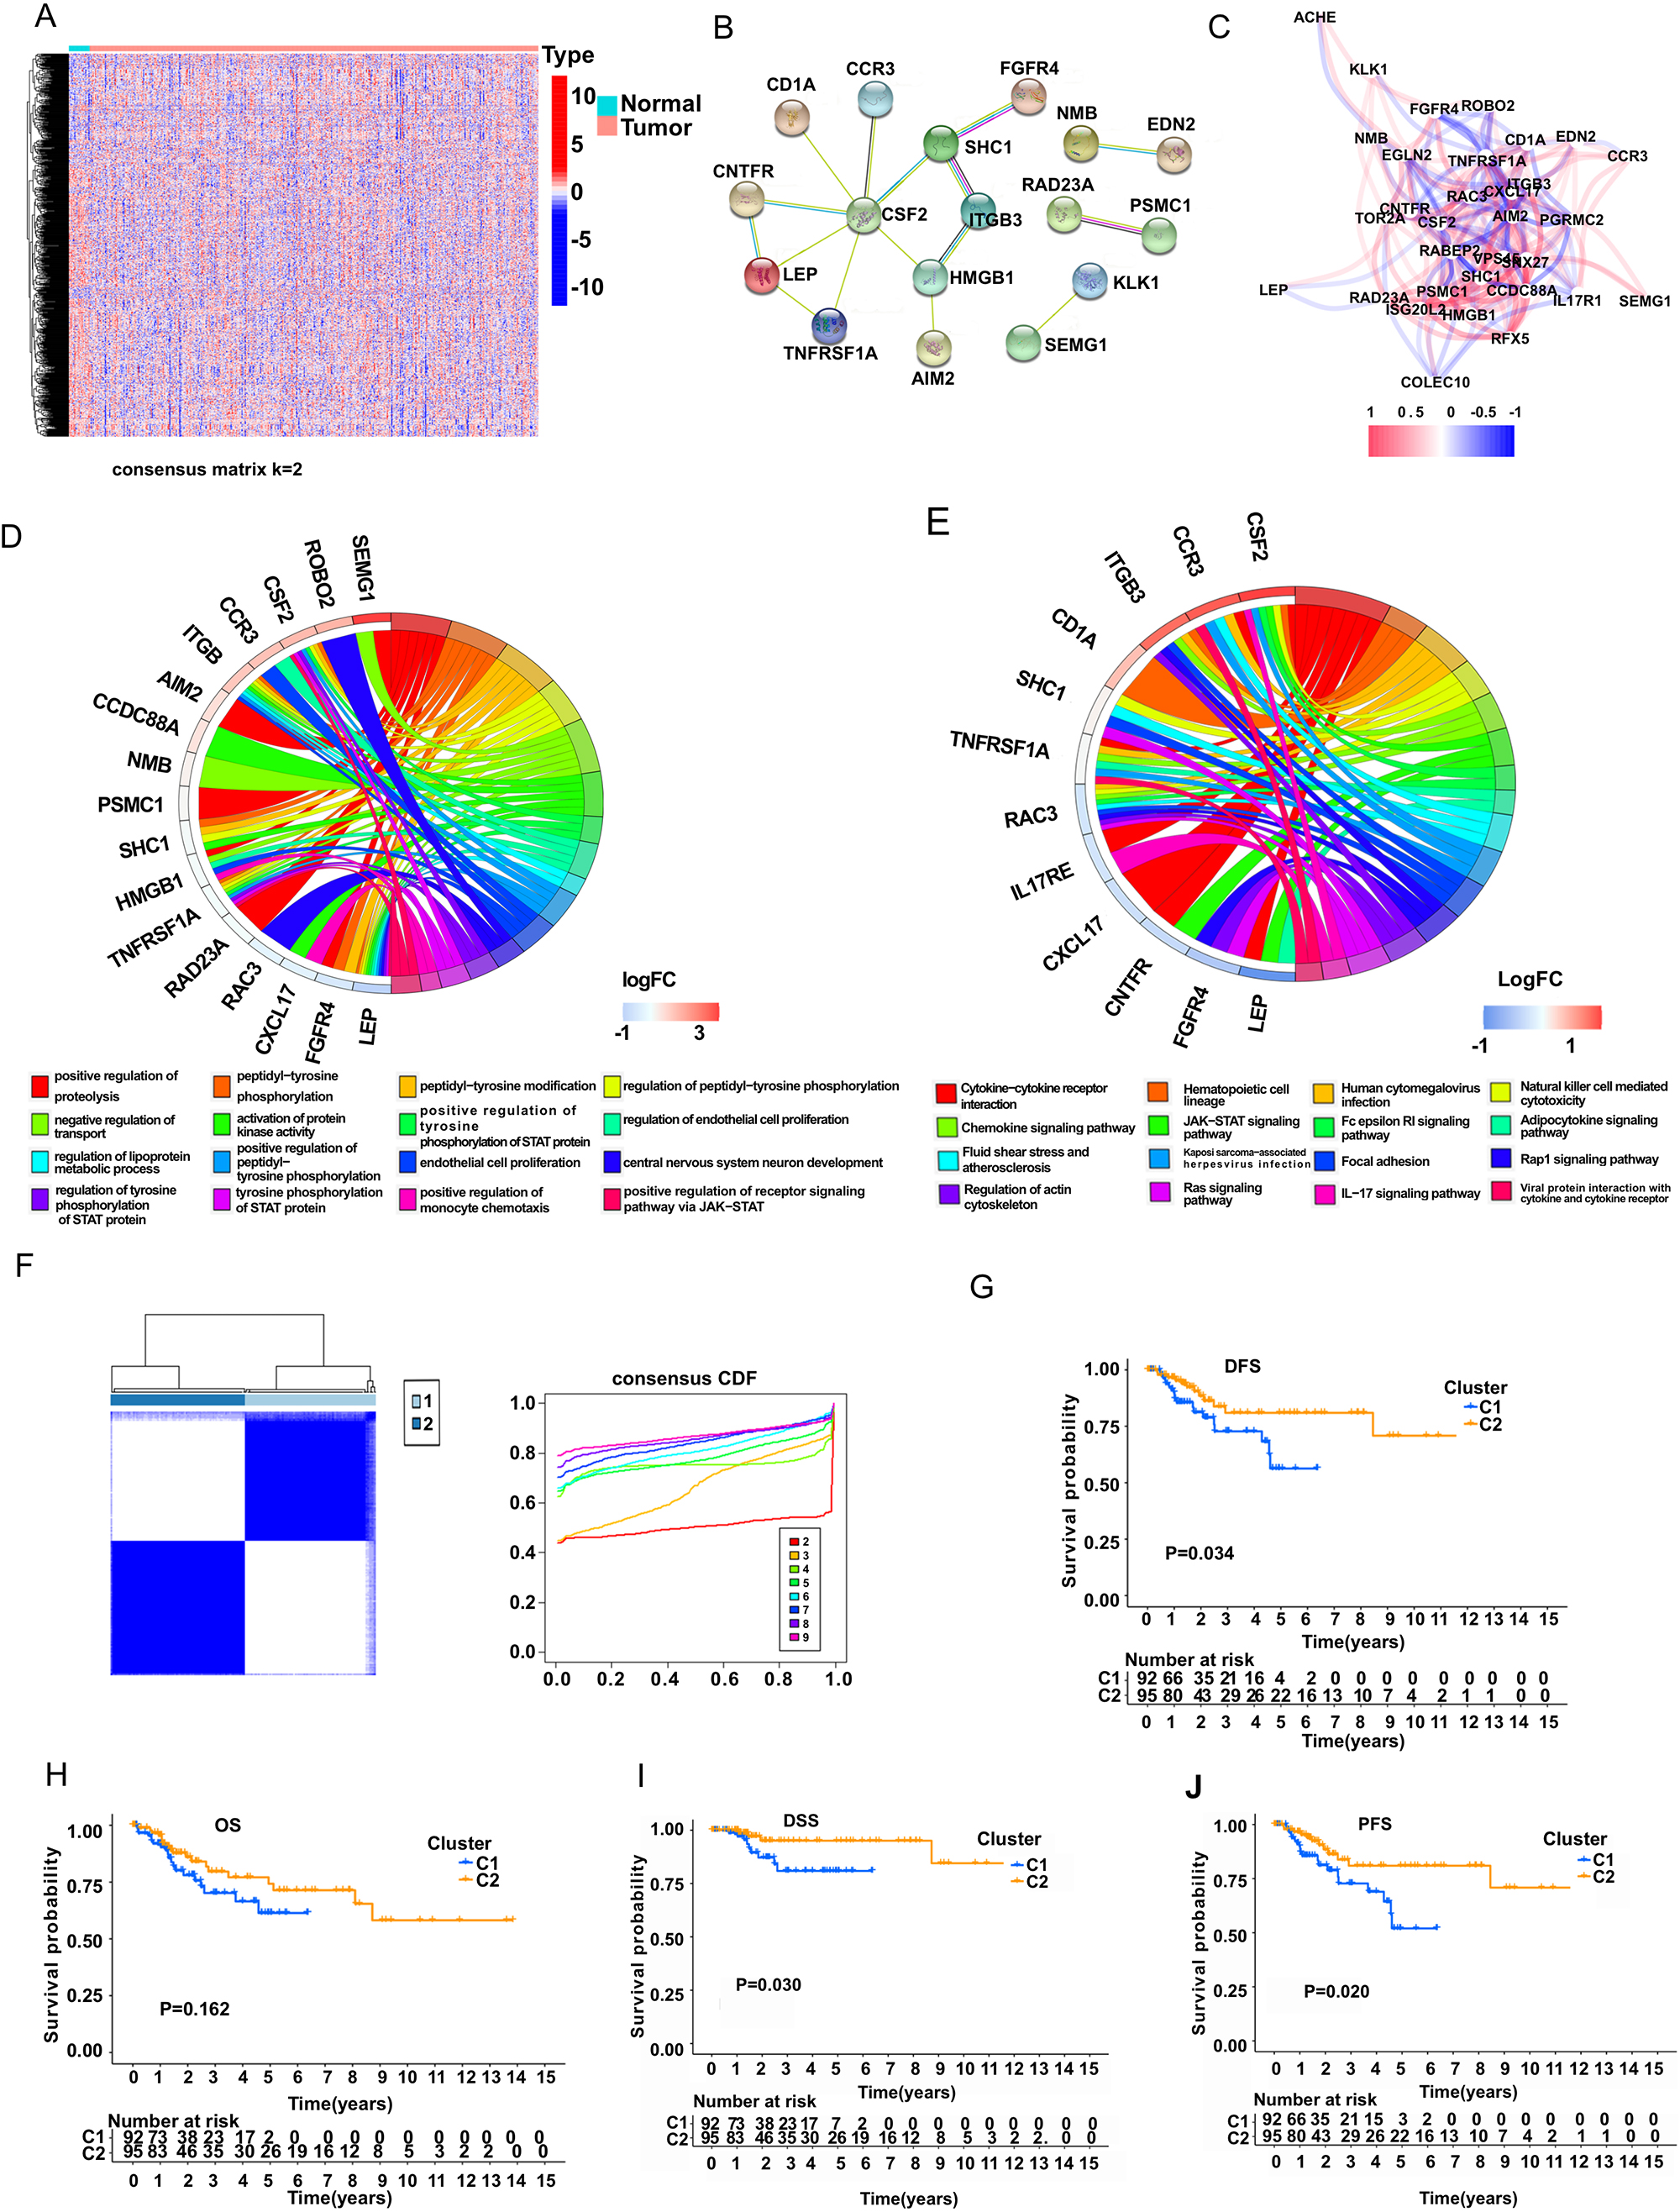
Next, we performed a consensus clustering analysis with all 411 BC patients based on the 32 IRGs in the TCGA cohort. Then, we found that when the clustering variable (
A risk model based on IRGs was established according to TCGA and GEO patients. (A) Heatmap of 58 DEG expression levels of different classifications in the TCGA cohort. (B) Forest plot of IRGs associated with poor PFS in BC patients. (C-F) Kaplan-Meier analysis for PFS, OS, DSS, and DFS of risk groups in the TCGA cohort. (G-J) ROC analysis was used to verify the efficiency of the risk model for predicting PFS, OS, DSS, and DFS in the TCGA cohort. (K) Kaplan-Meier analysis for PFS of risk groups in the GEO cohort. (L) Univariate and (M) multivariate Cox regression analysis for risk score and clinical features in TCGA patients. 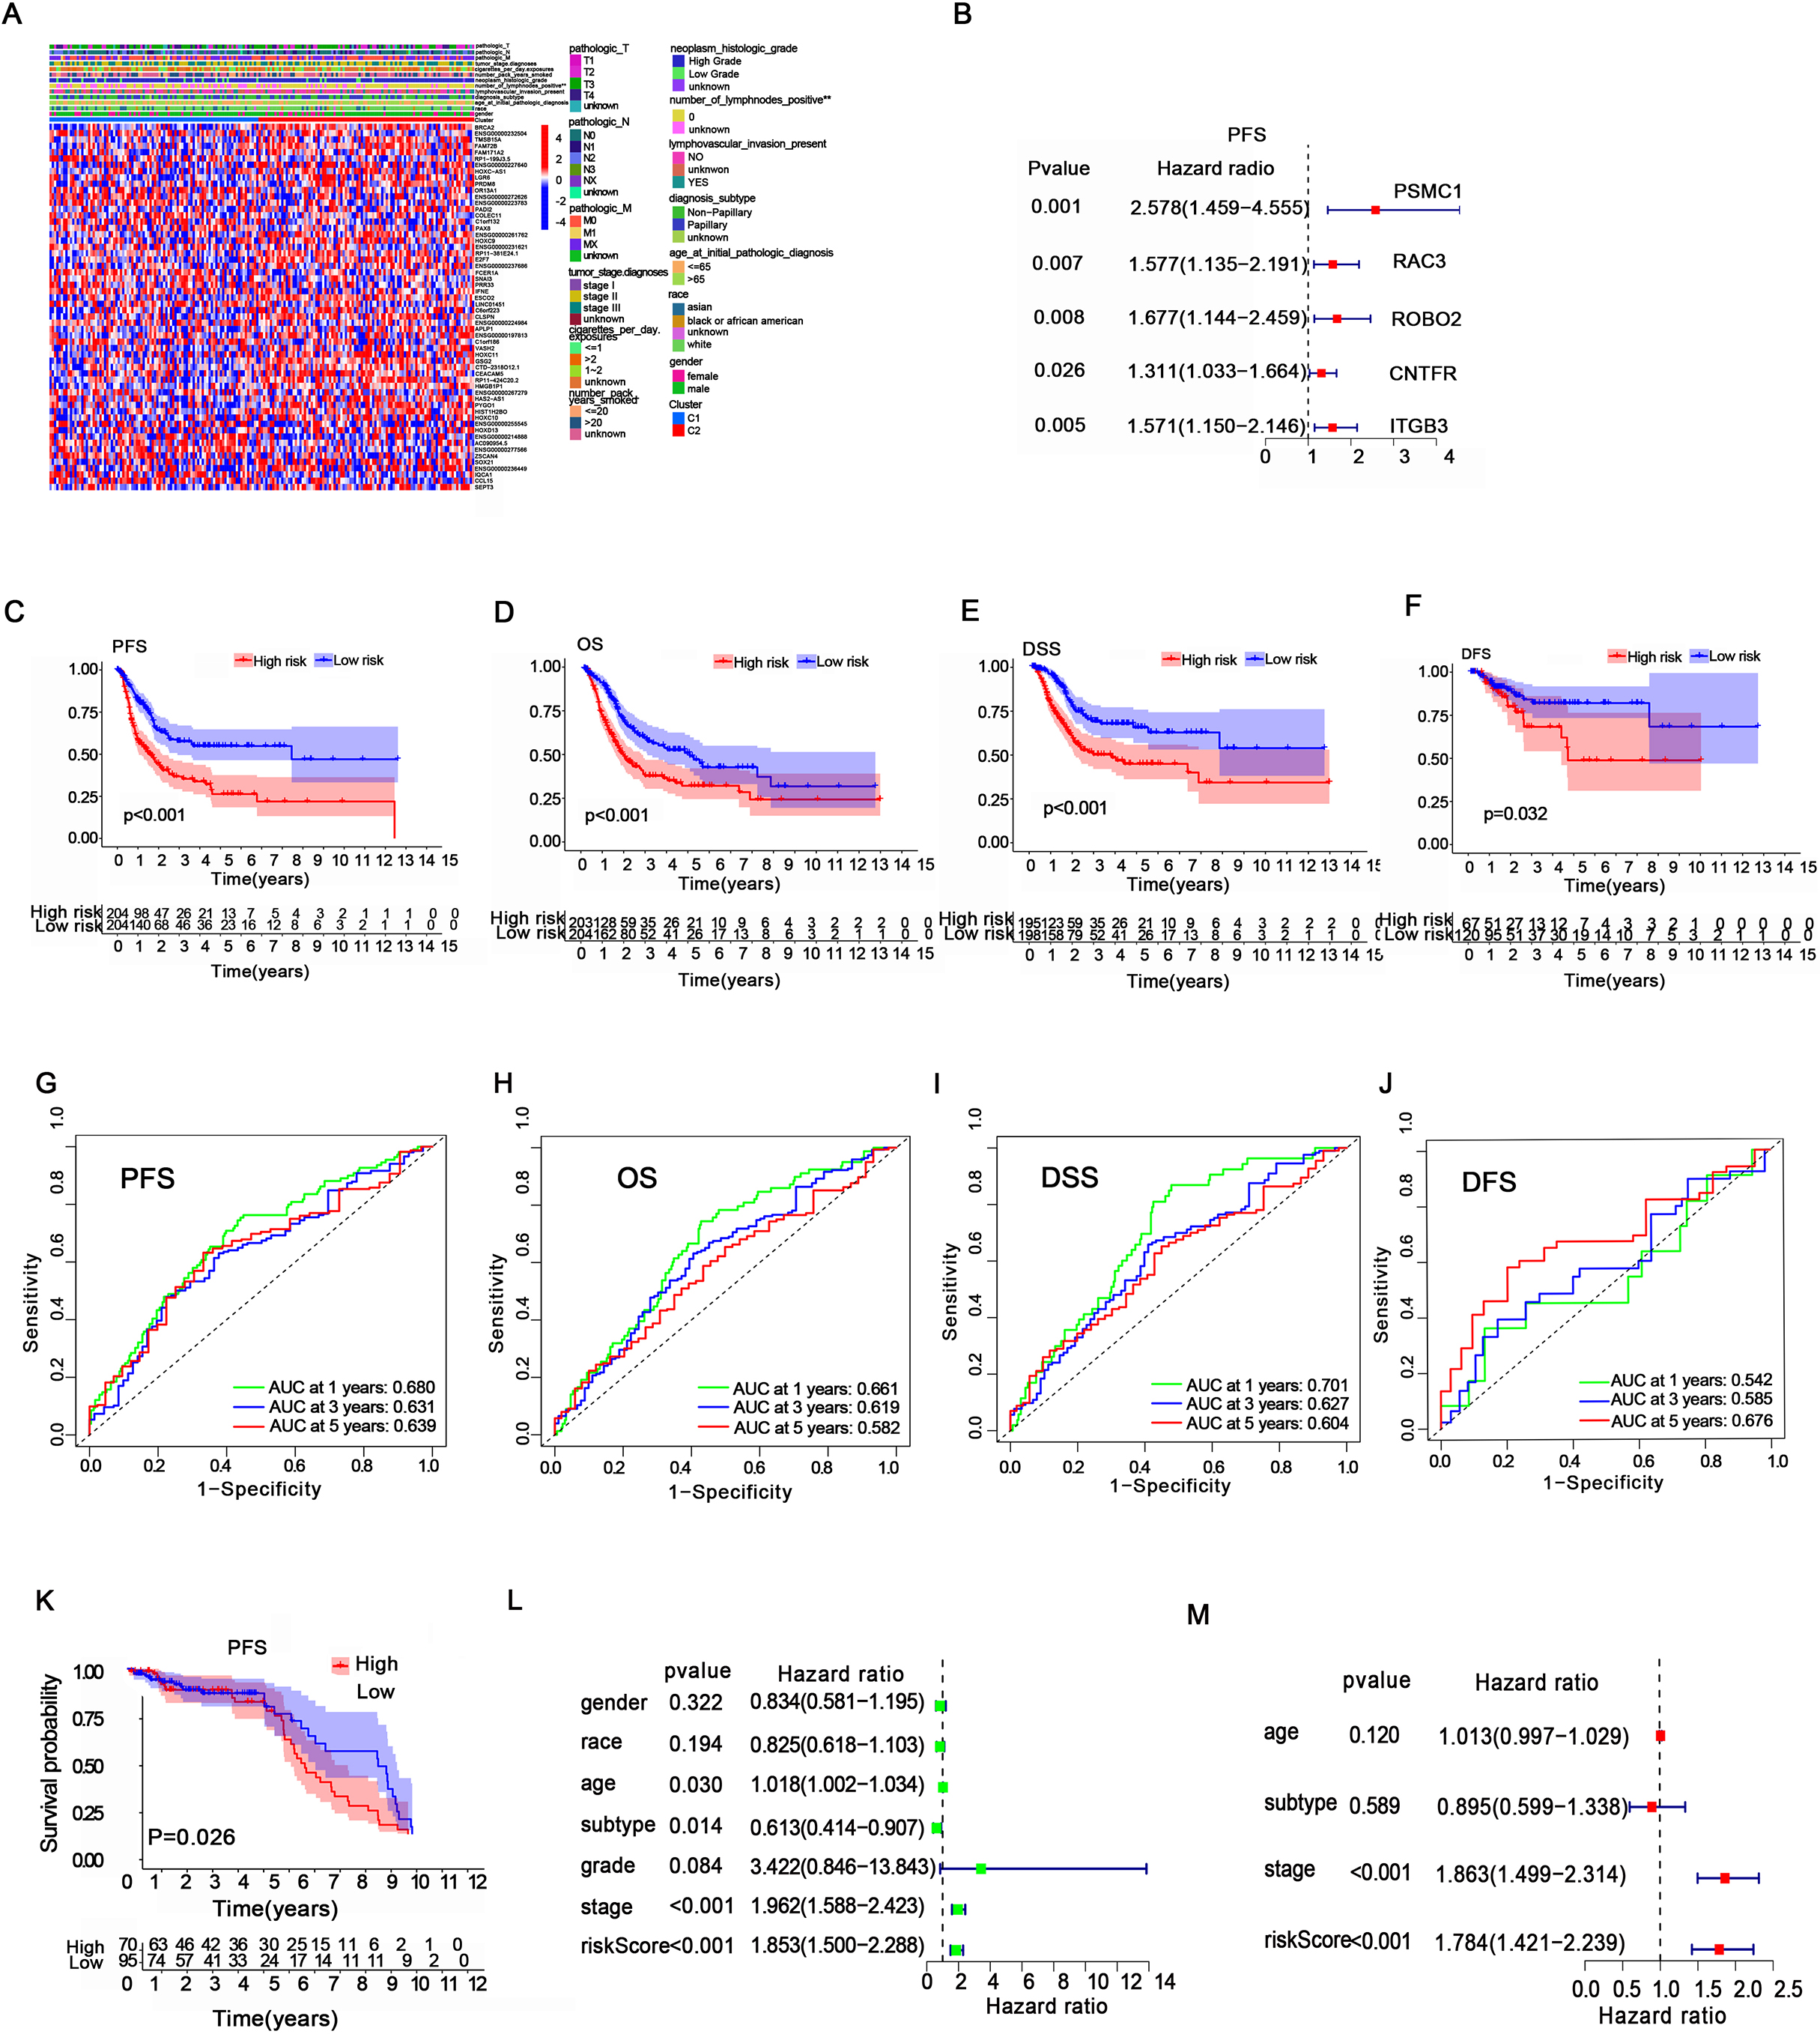
After comparing the two clusters (C1 and C2) in the TCGA cohort, 58 differentially expressed genes (DEGs) were found to be significantly different (Fig. 2A), and 5 PFS-related IRGs (PSMC1, RAC3, ROBO2, CNTFR, ITGB3) were identified in BC patients (Fig. 2B, Supplementary Fig. 2A–2E). Moreover, we found that high expression of PSMC1 and RAC3 also led to worse overall survival (OS) for BC patients(Supplementary Fig. 2F–2G), and high expression of PSMC1, RAC3 and ROBO2 was associated with worse disease-specific survival (DSS) in BC patients(Supplementary Fig. 2H-2J). Next, we intersected these survival-related genes with the GSE13507 dataset, which included 165 BC patients, and finally identified 4 survival-related genes (PSMC1, RAC3, ROBO2, and ITGB3) with statistical significance in both the TCGA and GEO cohorts. By performing least absolute shrinkage and selection operator (LASSO) Cox regression analysis, a 4-gene model was constructed according to the optimum
After that, we used the median risk score to classify patients into a high-risk group (HR) or a low-risk group (LR) in 411 TCGA patients and 165 GEO patients. Higher expression of PSMC1, RAC3, ROBO2, and ITGB3 was observed in the HR group in both the TCGA and GEO cohorts(Supplementary Fig. 3A-3B). Focusing on these four genes, we found 22 mutations in 411 samples (5.35%)(Supplementary Fig. 3C). Moreover, pairwise correlations among the four IRGs are shown in Supplementary fig 3D. Next, Kaplan-Meier analysis indicated that the HR group had a lower survival probability in PFS, OS, DSS and DFS than the LR group of TCGA patients (Fig. 2C–2F). Moreover, we found that the risk scores were closely related to the survival status and survival time of PFS, OS, DSS and DFS in our patients(Supplementary Fig. 4A-4D). Receiver operating characteristic (ROC) analysis was performed to validate the prognostic accuracy of our gene risk model. The results showed that the areas under the ROC curve (AUCs) for PFS were 0.680, 0.631, and 0.639 for predicting 1-, 3-, and 5-year survival, respectively; AUCs for OS were 0.661, 0.619 and 0.582 for predicting 1-, 3-, and 5-year survival, respectively; AUCs for DSS were 0.701, 0.627, and 0.604 for predicting 1-, 3-, and 5-year survival, respectively; and AUCs for DFS were 0.542, 0.585, and 0.676 for predicting 1-, 3-, and 5-year survival, respectively (Fig. 2G–2J). Moreover, a worse PFS in the HR group was also observed in the GEO database (Fig. 2K). Then we combined clinical features with our risk scores to conduct both univariate and multivariate COX regression analysis, which indicated that the risk score may serve as an independent prognostic indicator for our patients (Fig. 2L-2M). These evidences suggested that our risk model has good predictive value for the prognosis of BC patients.
Gene mutations and functional enrichment analysis in risk groups
Next, we examined the genetic mutations in our risk groups, and the top 20 genes with the highest mutation rates were shown in the HR group and LR group, (Fig. 3A–3B). We found that the HR group had higher mutation frequencies in total when compared to the LR group (95.1% in the high-risk group vs 92.61% in the low-risk group). It is worth noting that TP53 was the most frequently mutated gene in both risk groups, but a higher mutation rate was observed in the high-risk group than in the low-risk group (58% vs 34%). Moreover, TTN and ARID1A also showed a higher mutation rate in the HR group than in the LR group. The mutations of these IRGs might partly account for the poorer prognosis in the HR group.
Gene mutation and functional enrichment analysis for risk groups. (A, B) Top 20 mutated genes in the high- and low-risk groups in the TCGA cohort. (C, D) GO and KEGG enrichment analysis based on gene set enrichment analysis (GSEA) for the high-risk group in the TCGA cohort. (E, F) GO and KEGG enrichment analysis based on GSEA for the low-risk group in the TCGA cohort.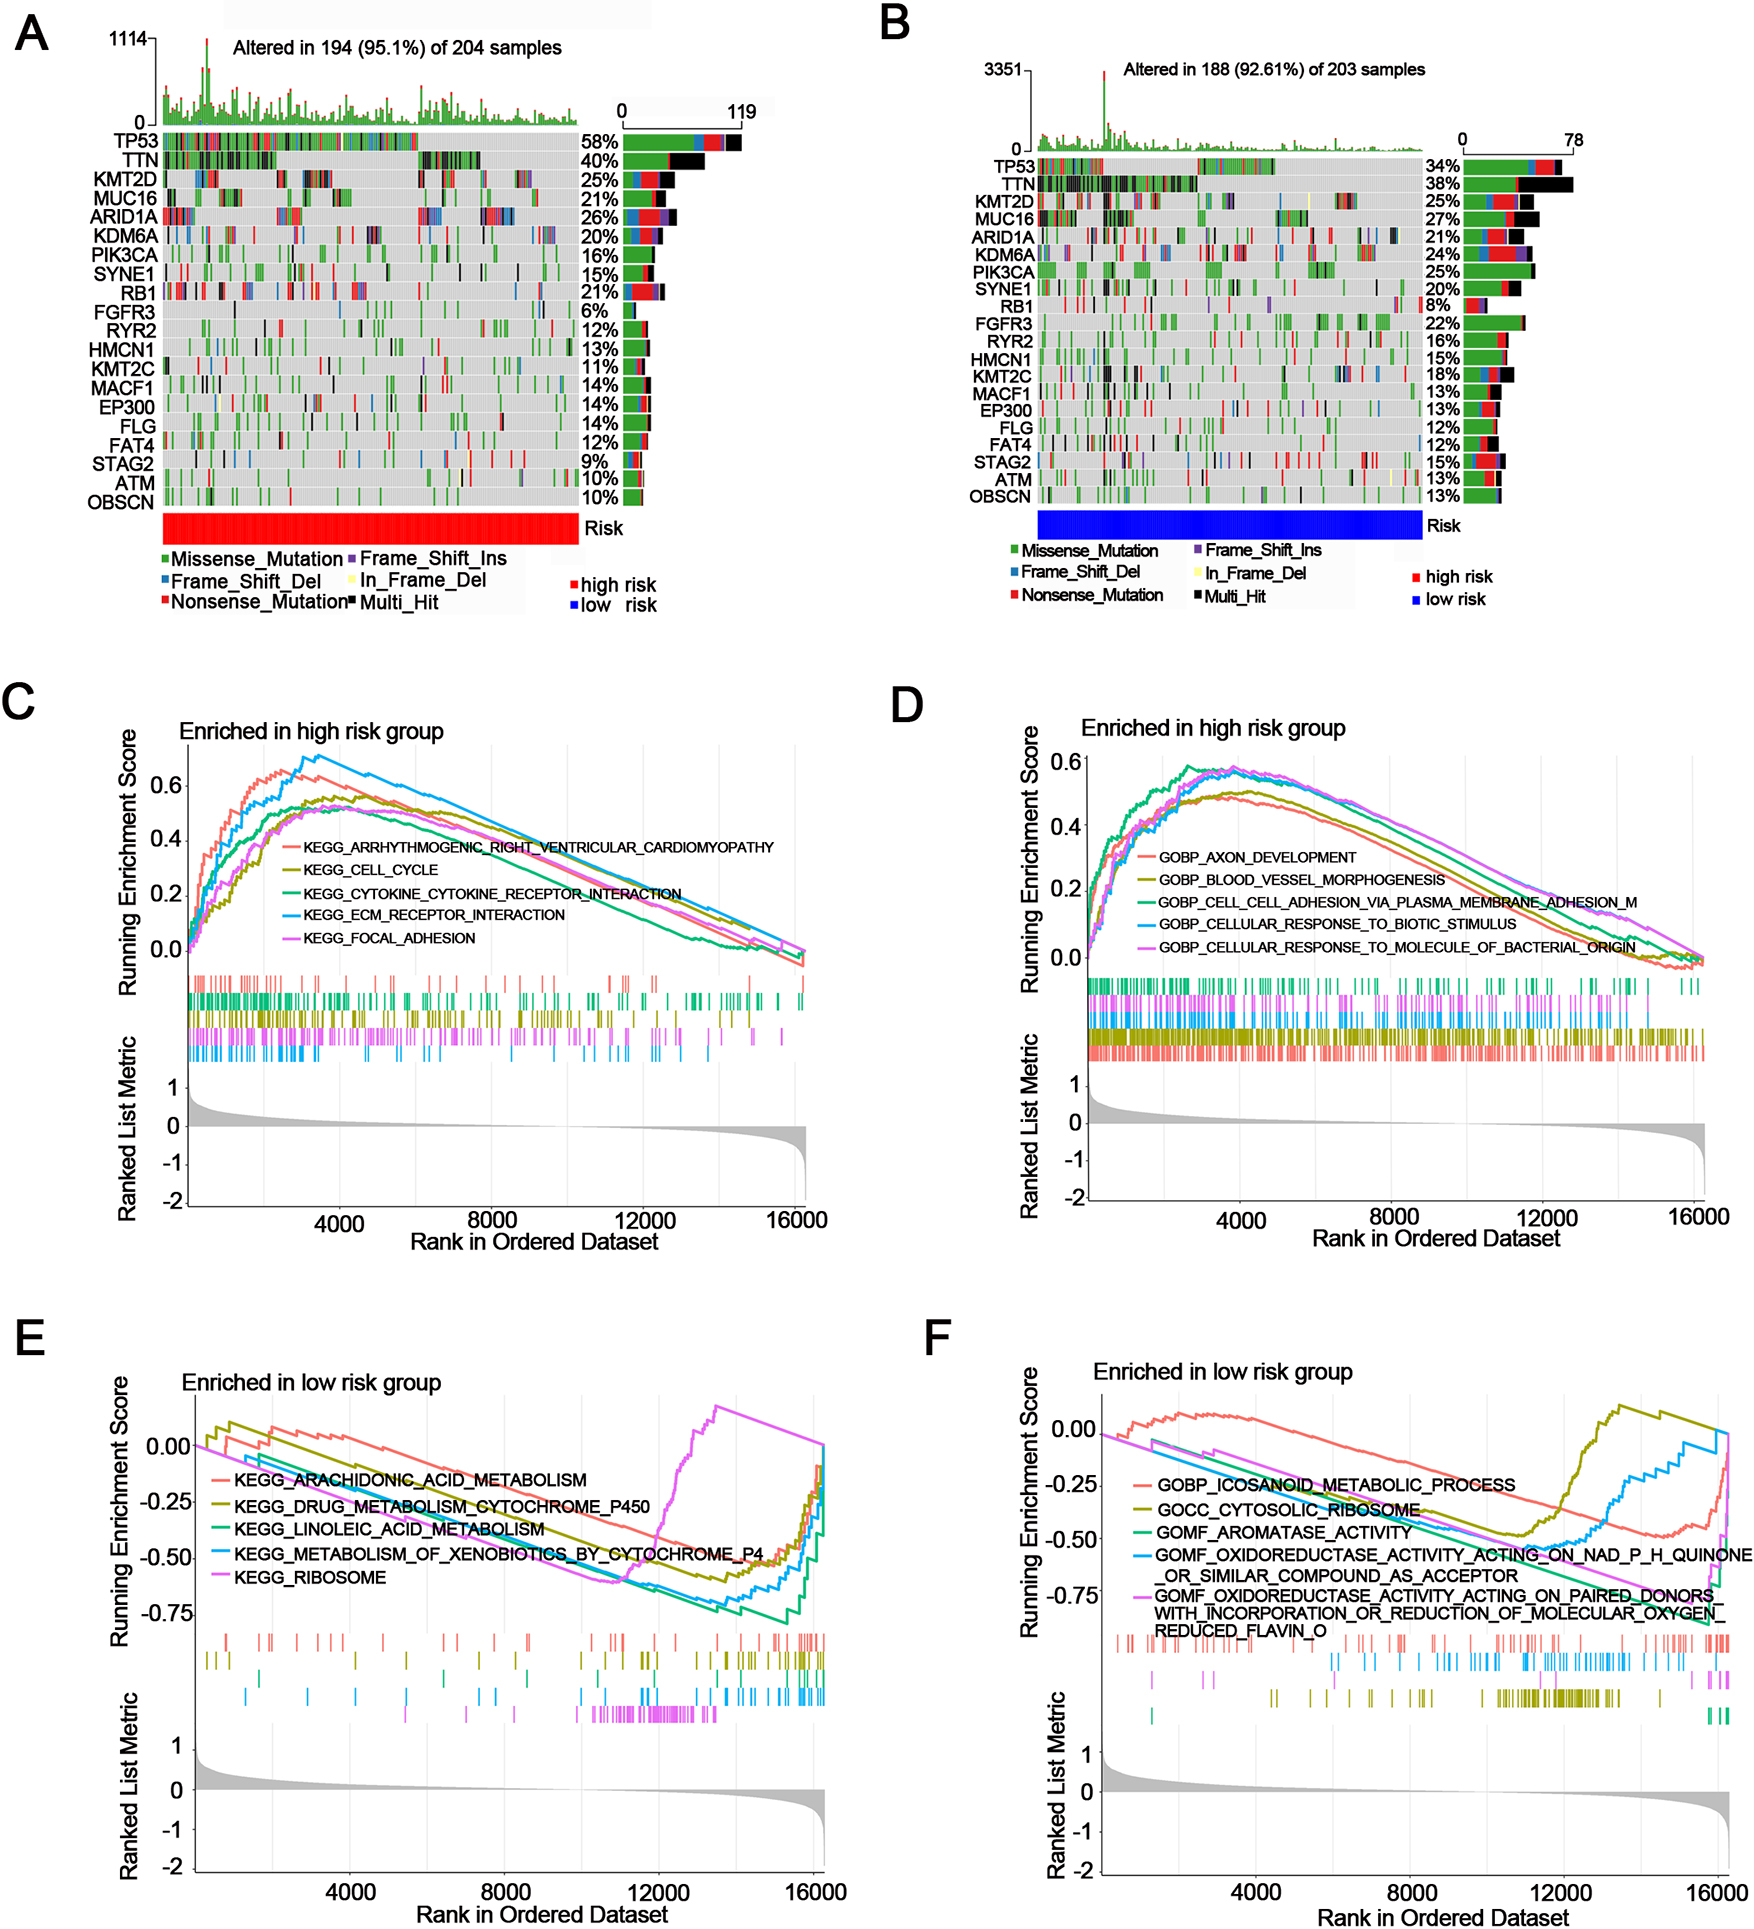
Afterwards, we used GSEA enrichment analysis to investigate the functions or pathways for the two risk groups. The enrichment analysis of GO showed that cell division, cell-cell adhesion via plasma membrane adhesion, metaphase anaphase transition of the cell cycle, etc., were more enriched in the HR group in both the TCGA and GEO cohorts (Fig. 3C–3D, Supplementary Fig. 5A–5B, Supplementary Tables 2 and 3). Moreover, KEGG enrichment analysis showed that the HR group was more enriched in ECM receptor interaction, cell cycle, and DNA replication in both the TCGA and GEO cohorts (Fig. 3E–3F, Supplementary Fig. 5C–5D Supplementary Tables 4 and 5). These results might provide a theoretical basis for the poor prognosis of the HR group.
First, we investigated the connections between clinical features and our risk groups in the TCGA cohort and found that our risk groups had significant differences in diagnosis subtype, lymphatic metastasis, neoplasm histologic grade or tumor grade (Fig. 4A). For tumor stage, we discovered a significantly higher rate of patients at tumor stage 4 in the HR group (42%) than in the LR group (24%). In contrast, the number of patients with tumor stage 2 in the HR group (25%) was lower than that in the LR group (39%) (Fig. 4B). In the GEO cohort, we also found that clinical characteristics such as invasiveness status, treatment, tumor grade and tumor progression status were significantly associated with risk scores (Fig. 4C). The rate of patients who were at high tumor grade in the HR group (56%) was higher than that in the LR group (22%) (Fig. 4D). Similarly, cases at lower tumor stages (Ta and T1) showed a much lower rate in the HR group (37% T1 and 9% Ta) than in the LR group (57% T1 and 19% Ta) (Fig. 4E). Patients at N0 and M0 in the HR group were also lower than those in the LR group (for M0 stage, 91% in the HR group and 99% in the LR group; for N0 stage, 83% in the HR group and 96% in the LR group) (Fig. 4F–4G). Based on the results above, patients in the HR group of our risk model may have poor clinical features.
Clinical features analysis for risk groups. (A) Heatmap of the correlation of clinical characteristics with risk groups in the TCGA cohort. (B) The chi-square test was performed for the tumor stage of the risk groups in the TCGA cohort. (C) Heatmap of the correlation of clinical characteristics with risk groups in the GEO cohort. (D-G) The chi-square test was performed for the T, N, and M stages and tumor grades of the risk groups in the GEO cohort.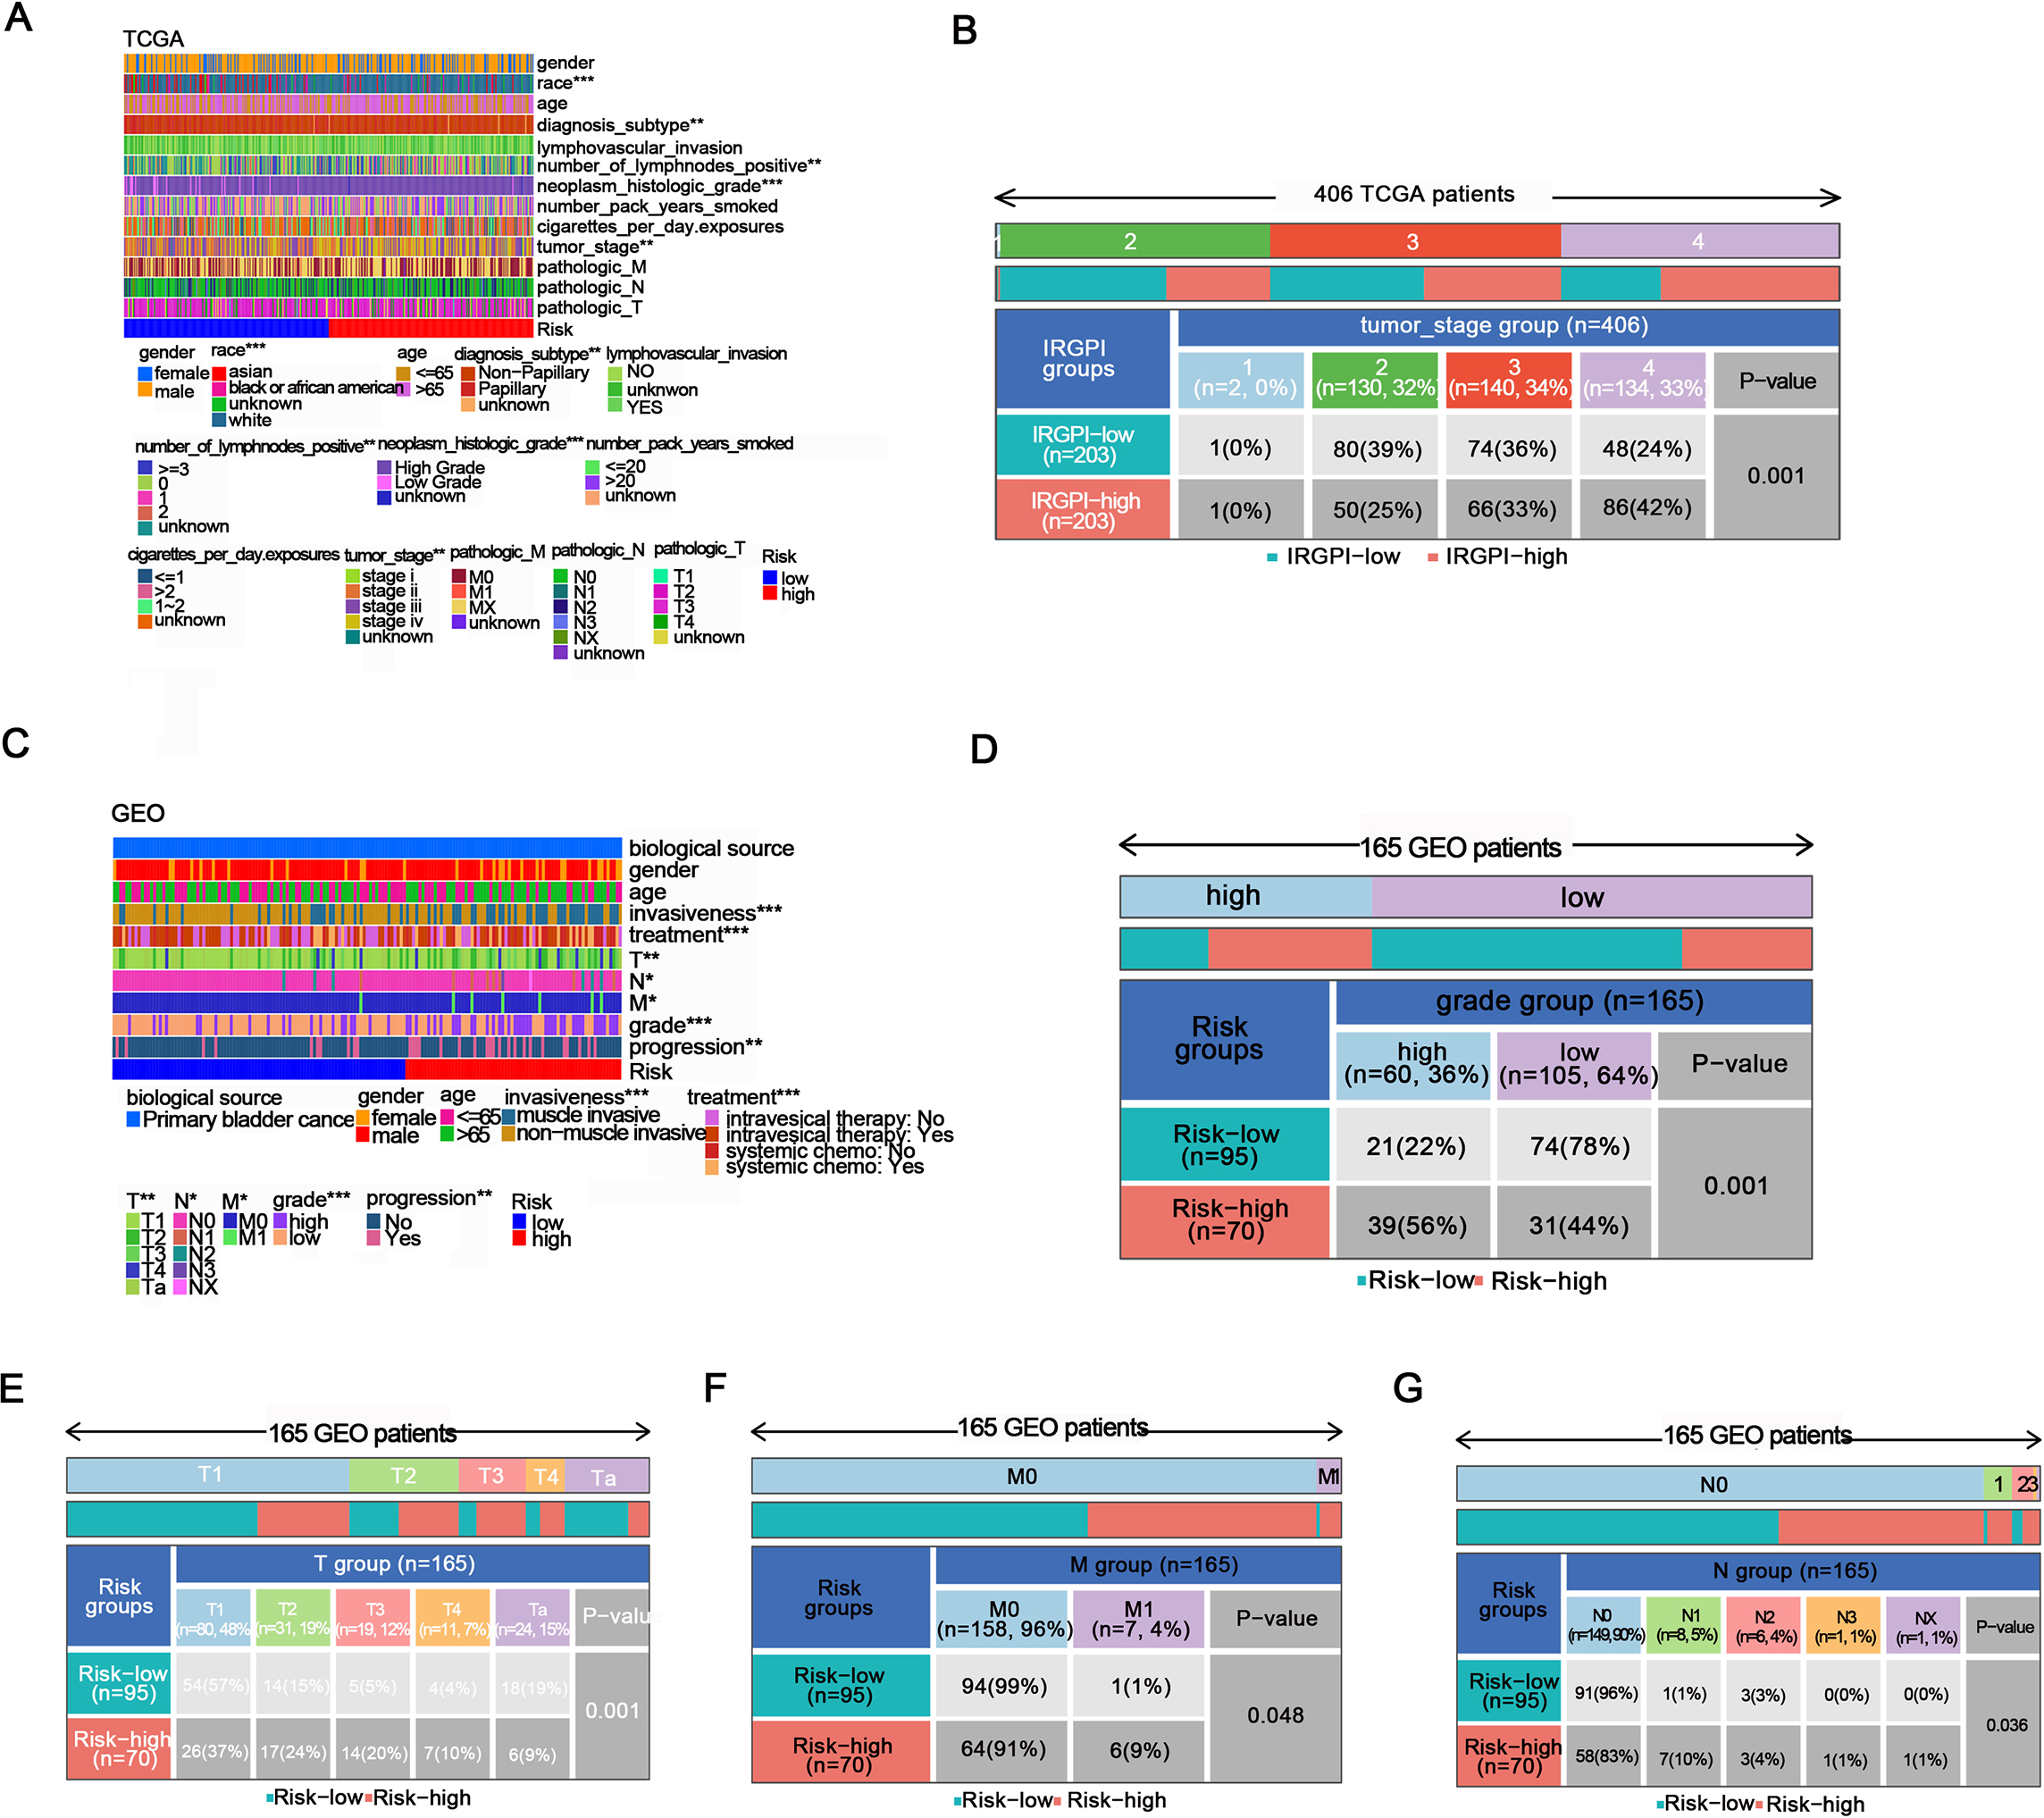
Relationship between risk groups and immune escape in BC patients. (A, B) Immune landscape of risk groups in the TCGA cohort. (C-G) Infiltration levels of Tregs, CD8+ T cells, APCs, T-cell co-inhibition and NK cells in the risk groups of TCGA patients. (H) Chi-square test performed for risk groups and immune subtypes in the TCGA cohort. (I-J) The expression of CD274 in the risk groups in the TCGA and GEO cohorts. (K) The immune exclusion score of risk groups in the TCGA cohort.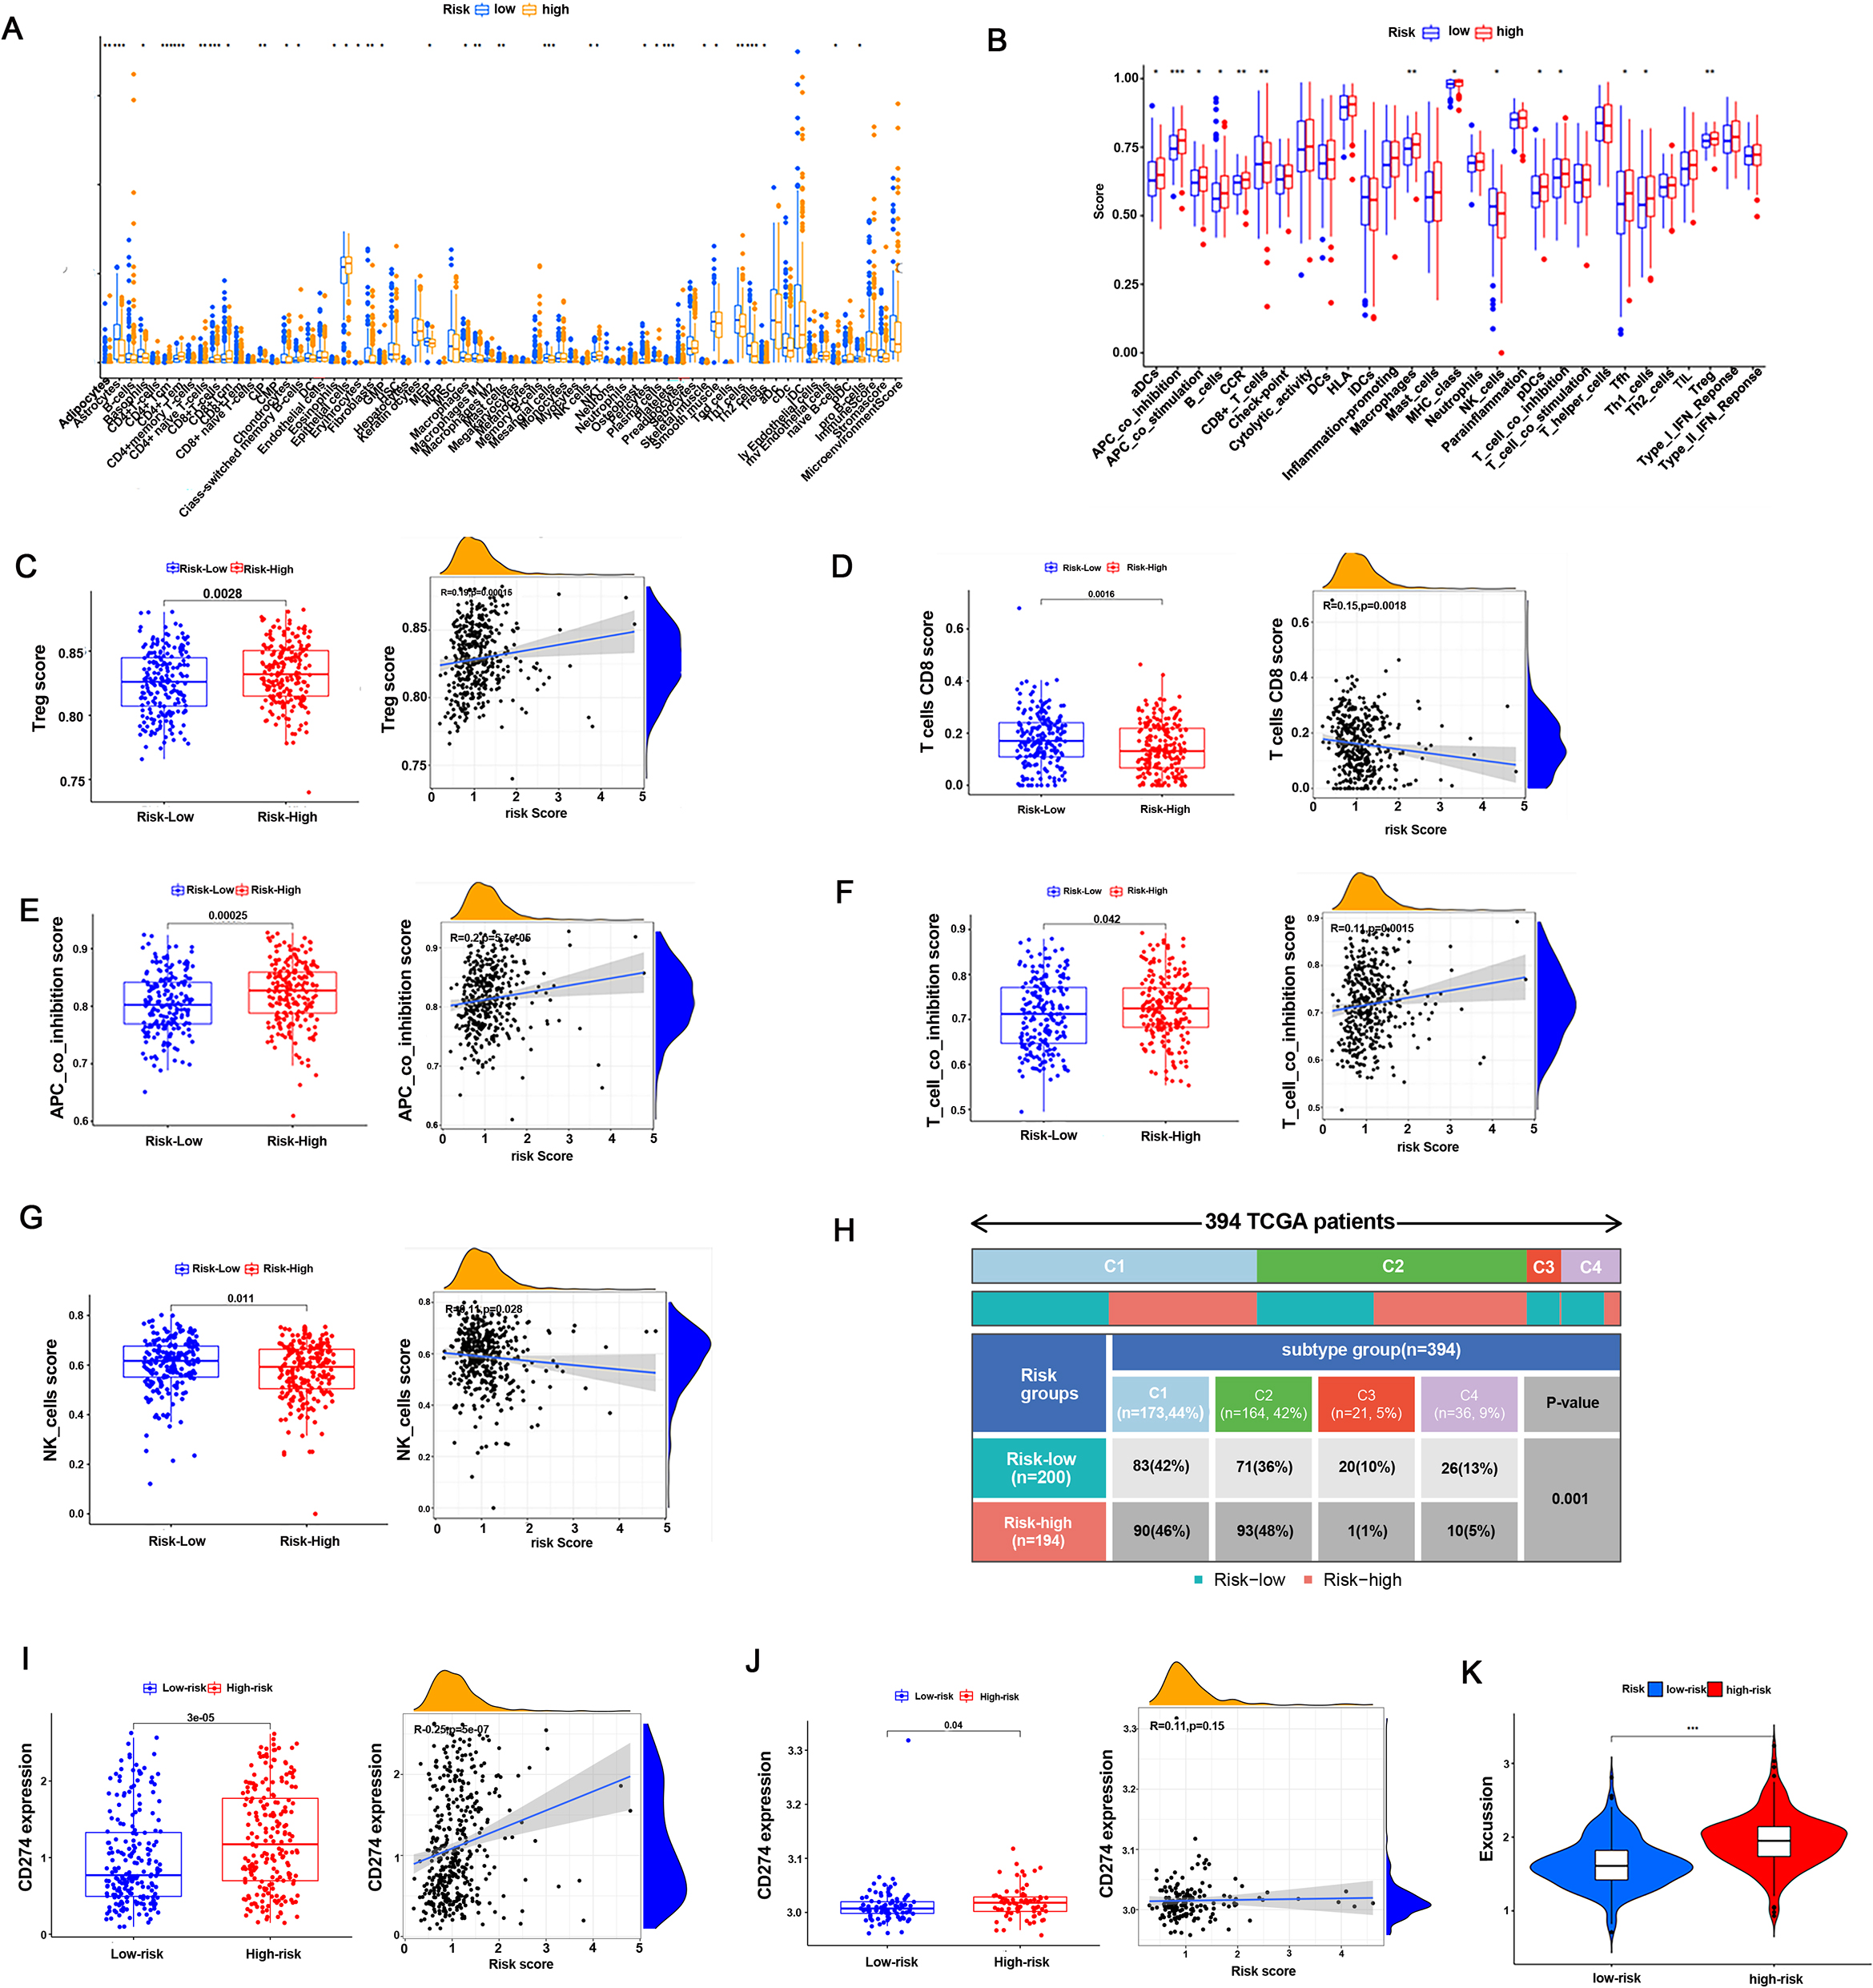
Initially, we performed immune landscape analysis in the TCGA and GEO cohorts, and the results showed that the HR and LR groups differed noticeably in the majority of immune cells and immunological activities. (Fig. 5A, 5B, Supplementary Fig. 6A). It is worth noting that Treg cells, APC co-inhibition signals and T-cell co-inhibition signals were more highly infiltrated in the HR group than in the LR group in the TCGA cohort (Fig. 5C, 5E, 5F). Moreover, CD4+ naive cells, CD8+ T cells, CD8+ Tcms and NK cells were less infiltrated in the HR group than in the LR group in the TCGA and GEO cohorts (Fig. 5D, 5G, Supplementary Fig. 6B, C, D). These results suggested that the HR group had lower immune cell infiltration and worse immune cell function than the LR group, which contributed to a higher risk of immune escape. Next, we investigated the correlations of risk groups with clinical immune subtypes in the TCGA cohort. The results showed that cases in the HR group preferred aggregating in Immune C1 (Wound Healing) and C2 (IFN-gamma Dominant) (94% vs 78%), while C3 (Inflammatory) and C4 (Lymphocyte Depleted) were more likely to be in the LR group (6% vs 22%) (Fig. 5H). Furthermore, we investigated immune checkpoint expression in our risk group in both the TCGA and GEO cohorts and found that the expression of PD-L1 was significantly higher in the HR group than in the LR group (Fig 5H-5I). In addition, the HR group expressed a higher immune exclusion score than the LR group (Fig. 5J). These findings indicated that the HR group was at a greater risk of immune escape.
Experimental verification of immunerelated genes in the risk model
In our results, PSMC1, RAC3, ROBO2, and ITGB3 were the main contributing genes to the risk model, and these genes had positive contribution coefficients to the risk score, indicating that these genes are associated with poor prognosis of bladder cancer. Accordingly, we selected 10 samples (5 bladder cancer tissues and 5 adjacent normal tissues) in our center and verified their gene expression. The results showed that the gene expression of PSMC1, RAC3, ROBO2 and ITGB3 in bladder cancer tissues was significantly higher than that in adjacent normal tissues, and this evidence strengthened the evidence that these genes lead to poor prognosis in bladder cancer (Fig. 6A). In addition, among these genes, PSMC1 had the largest contribution coefficient to the risk score of the risk model. Therefore, we selected PSMC1 for further experimental verification to explore its relationship with the prognosis of bladder cancer. The results showed that the growth activity of bladder cancer cells in the PSMC1 knockdown group was significantly inhibited and that the Ki67 fluorescence intensity was significantly reduced in UMUC3 or RT112 cells compared to that in the empty vector transfection group (Fig. 6B, 6I). In addition, in UMUC3 and RT112 cells, the metastatic ability of the PSMC1 knockdown group was significantly inhibited compared with that of the empty vector transfection group (Fig. 6C–D, E–F, G–H). These results suggested the important role of immunerelated genes in our risk model, especially PMSC1, in the poor prognosis of bladder cancer.
Experimental verification of immune-related genes in the risk model. A: The gene expression of PSMC1, RAC3, ROBO2, and ITGB3 in bladder cancer tissues and adjacent normal tissues was measured by qPCR. B: CCK8 was used to determine the growth activity in the PSMC1 knockdown group and empty vector group of bladder cancer cells. C-F: A wound healing assay was used to measure the migration ability of UMUC3 and RT112 cells in the PSMC1 knockdown group and empty vector group. G-H: Transwell assays were used to measure the migration ability of UMUC3 and RT112 cells in the PSMC1 knockdown group and empty vector group. I: An immunofluorescence assay was used to measure the expression of Ki67 in UMUC3 cells in the PSMC1 knockdown group and empty vector group.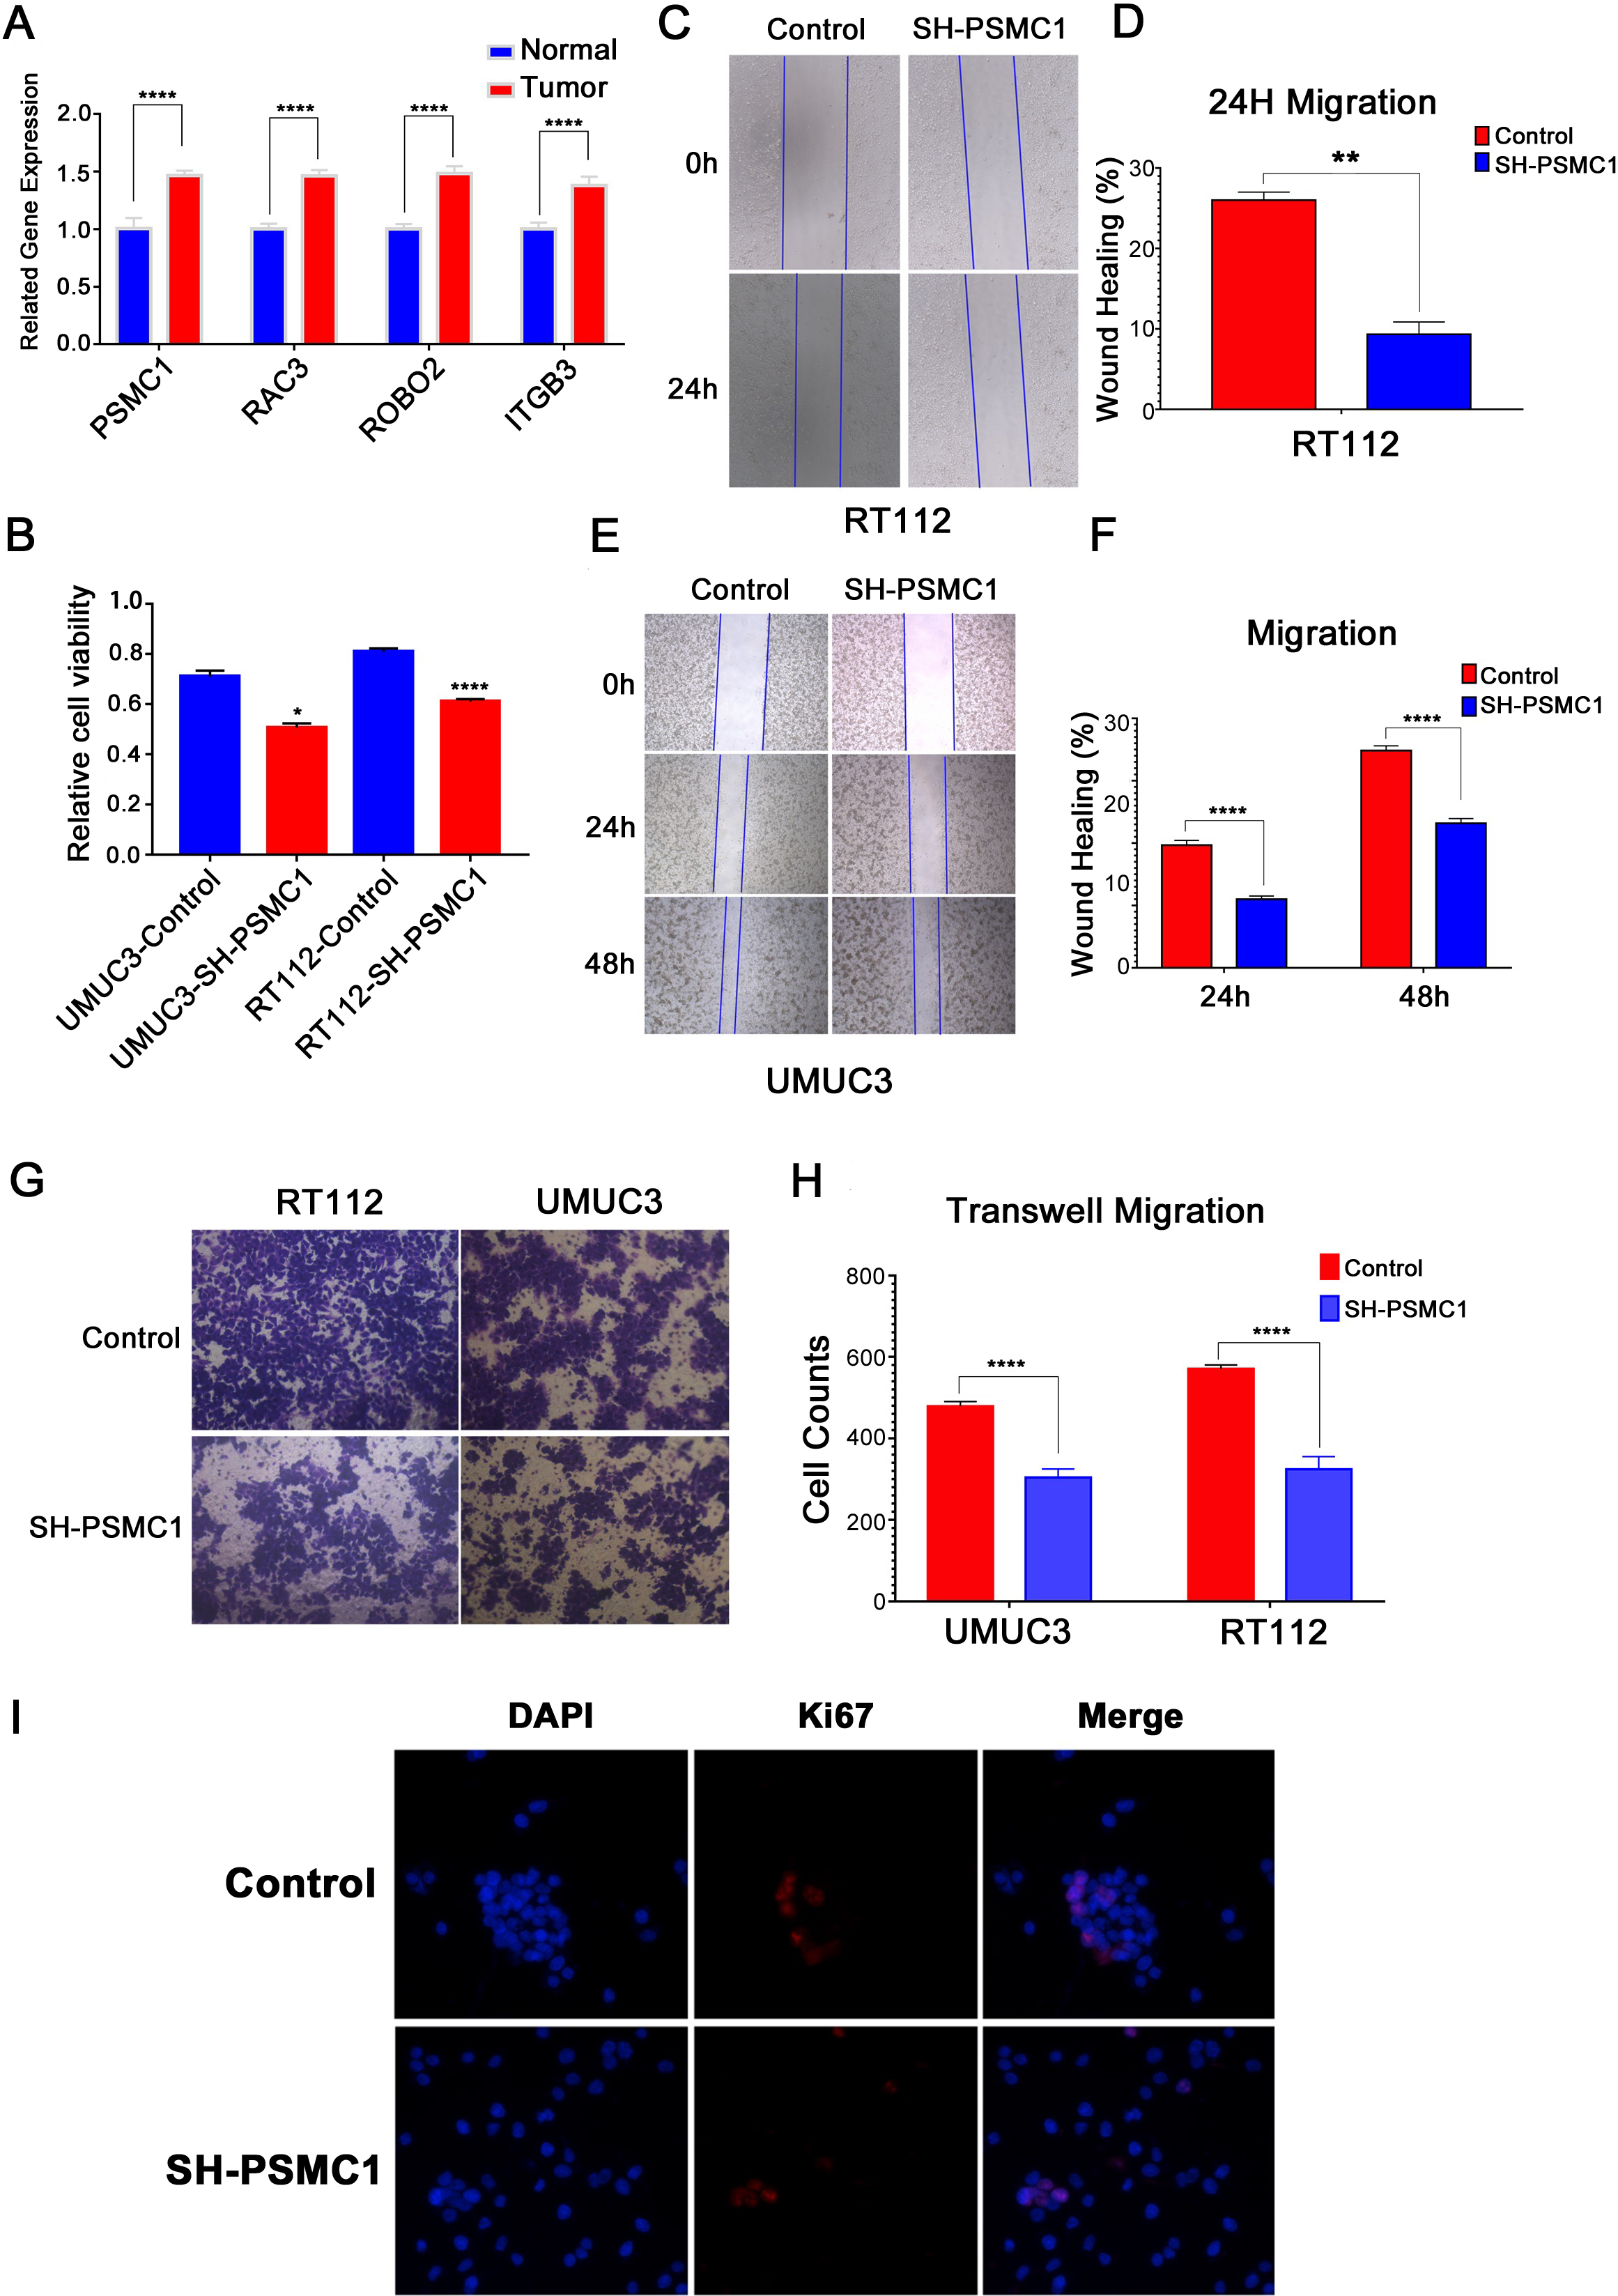
According to our findings, we developed a risk model using IRGs (PSMC1, RAC3, ROBO2, and ITGB3). PSMC1 is a member of the proteasome 26S subunit ATPase (PSMC) family, which plays a role in protein degradation. A study showed that breast cancer cells expressed moderate levels of PSMC1, and there might be a negative correlation between the overexpression of PSMC1 and the prognosis of breast cancer [22]. Another study found that siRNA knockdown of PSMC1 could impair the viability of PC3 cells [23]. Integrin beta-3 (ITGB3) is a major member of the integrin family, and it was reported that ITGB3 down-regulation was a factor that inhibited the invasion of transitional cell carcinoma cells [24]. ROBO2, an axon guidance gene, might be involved in tumorigenesis in prostate cancer [25]. It has been shown to bind to SLITs, a kind of evolutionarily conserved secreted polypeptide that modulates the cytoskeleton, in turn regulating cell migration, adhesion, and proliferation In addition, SLIT/ROBO signaling could prevent micropinocytosis and cytotoxic polarization in macrophages, and the lack of the ROBO2 gene in macrophages may lead to an enhanced response to immunotherapy [26]. Rac family of small GTPase 3 (RAC3) is a member of the Rho GTPase family, and RAC3 has been revealed to be connected with poor prognosis in BC. Recently, some research demonstrated that RAC3 expression was elevated in BC tissues and aided BC in their capacity for proliferation, migration, and invasion through JAK/STAT3 signaling [27]. These results indicated that these IRGs are related to the poor prognosis of patients, which supports our conclusions. In addition, the relationship between these genes and immune escape was further revealed in our study, which has guiding significance for bladder cancer immunotherapy.
Impressively, TP53, TTN and KMT2D exhibited a notably higher mutation rate in both the HR group and LR group in our risk model. The human gene TP53, which is found on chromosome 17, has the role of a tumor suppressor and expressed a higher mutation in the HR group than in the LR group. Inactivating mutations and deletions of TP53 tend to be enriched in advanced and metastatic basal cancers, especially in carcinoma in situ (CIS) and MIBC [28]. It was reported that the loss-of-function mutations of the P53 protein lead to the inactivation of the TP53 gene through negative regulation and finally generate tumor cell invasion, proliferation and survival, resulting in tumor progression and metastasis [29, 30]. Another gene that attracted us was RB1, the retinoblastoma susceptibility gene and the mutation rate in the HR group (21%) was much higher than that in the LR group (8%). RB1 is also well known as the first tumor suppressor gene that has been defined molecularly and mutated in different kinds of human cancers [31, 32]. In addition, ARID1A mutation was comparable in the risk groups, and it has been shown to act as a truncal driver mutation that leads to the development of BC [33]. Furthermore, ARID1A-deficient BC was proven to be sensitive to PIK3 inhibitors, which offers a new idea for the treatment of BC [34]. Thus, mutational differences in these genes may partly explain the differences in prognosis between the high- and low-risk groups.
Immune cells receive antigens, and potentially useful immune cells have been identified including CD4+ and CD8+ lymphocytes, NK cells, and Th2 cells. These immune cells secrete TRAIL (tumor necrosis factor-related apoptosis-inducing ligand) to kill BC cells through direct cytotoxicity [35]. Immune suppression is known to have a pivotal role in cancer development, and immune therapy is essential in the management of BC [36]. In our work, CD8+ T cells, NK cells and Th2 cells exhibited lower infiltration levels in the HR group, while the T-cell co-inhibition signal was higher than that in the LR group, which might also cause a worse immune response.
Immune checkpoint pathways with immunosuppressive functions can be activated by different cancer cells, and immune checkpoint inhibitor therapy is beneficial for people suffering from a wide variety of cancer types [37]. Two of PD-1’s principal biological roles include keeping T-cell responses and peripheral tolerance stable within a desired physiological window. Deletion of PDCD1 (encoding PD-1) causes autoimmune pathologies [38]. Genitourinary cancers have been treated with anti-PD-1 and anti-PD-L1 including renal cell carcinoma, bladder cancer, and prostate cancer. Approximately 30% of patients with metastatic urothelial carcinoma of BC respond to immune checkpoint inhibitor (ICI) immunotherapy. A medical study also observed that patients treated with pembrolizumab whose tumors demonstrated
Conclusions
In this work, we established a novel risk model based on IRGs (PSMC1, RAC3, ROBO2, and ITGB3). The results indicated that our risk model could well predict prognosis, TP53 mutation and the risk of immune escape in BC patients. These findings will provide new potential targets for the precision treatment of BC.
Abbreviations
Declaration of interest statement
The authors declare that they have no conflicts of interest.
Author contributions statement
Conception: Ming-hua Ren and Bei-chen Ding.
Interpretation or analysis of data: Yang Liu, Yan-song Han and Jing-feng Wang.
Preparation of the manuscript: Zhong-qi Pang and Jia-xin He.
Revision for important intellectual content: Lu Zhang and Lin-kun Shen.
Supervision: Jian-she Wang and Bo Ji.
Data availability statement
All data in this study are available in the TCGA and GEO data portal.
Funding
This study was supported by the Horizontal Project of Heilongjiang Renxin Medical Assistance Foundation, Heilongjiang Charity Fund General Association, Natural Science Foundation of Heilongjiang Province (No. LH2019H030 to Ming-hua Ren) and National Natural Science Foundation of China (No. 82002680 to Bei-chen Ding).
Ethical approval statement
Our study is based on open source data, so there are no ethical issues or other conflicts of interest.
Supplementary data
The supplementary files are available to download from http://dx.doi.org/10.3233/CBM-230190.
sj-pdf-1-cbm-10.3233_CBM-230190.pdf - Supplemental material
Supplemental material, sj-pdf-1-cbm-10.3233_CBM-230190.pdf
sj-xlsx-1-cbm-10.3233_CBM-230190.xlsx - Supplemental material
Supplemental material, sj-xlsx-1-cbm-10.3233_CBM-230190.xlsx
sj-xlsx-2-cbm-10.3233_CBM-230190.xlsx - Supplemental material
Supplemental material, sj-xlsx-2-cbm-10.3233_CBM-230190.xlsx
Footnotes
Acknowledgments
We are grateful to the TCGA and GEO databases for their data support.