
Abstract
BACKGROUND:
Autophagy-related genes and immune-related genes contribute significantly to the initiation and prognosis of bladder cancer (BLCA).
OBJECTIVE:
We aimed to explore differentially expressed autophagy-related genes (DEARGs) and immune-related genes (DEIRGs) in BLCA to create a prognostic risk assessment model and gain some insights into BLCA’s molecular underpinnings.
METHODS:
The prognostic DEARGs and DEIRGs were evaluated for BLCA through The Cancer Genome Atlas (TCGA) database (
RESULTS:
In the risk model, AURKA, ACTC1, MYLK, PDGFD, PDGFRA and TNC were significantly associated with the overall survival. The pathways in cancer, T cell receptor signaling pathway and B cell receptor signaling pathway were significantly gathered in the high-risk group. Moreover, the risk score was significantly correlated with infiltrating immune cells, expression of critical immune checkpoints and mismatch repair genes including MSH6, MLH1, and MSH2.
CONCLUSIONS:
In this study, three DEARGs (AURKA, ACTC1, MYLK) and three DEIRGs (PDGFD, PDGFRA, TNC) were demonstrated to be potential prognostic biomarkers for BLCA patients through bioinformatics methods, which might be novel therapeutic targets and prognostic markers for BLCA, in follow up studies, we will combine experiments to verify this.
Introduction
Bladder cancer (BLCA) is the major malignant tumor of the urinary system and one of the tenth most common new malignant tumors worldwide [1]. Approximately 5% of BLCA patients have metastatic disease at the time of diagnosis [2]. Metastatic bladder cancer is mainly treated by chemotherapy based on platinum and gemcitabine, partly by radiotherapy and immunotherapy [3, 4]. Despite these aggressive therapies, the survival of patients with BLCA still faced severe challenges [5] and the prognosis of BLCA patients with recurrence and metastasis is still poor [6]. It is needed to further clarify the mechanism of disease development and develop new diagnosis and treatment measures to improve clinical diagnosis and treatment of BLCA. Therefore, there is an urgent need to explore and determine promising prognostic indicators in BLCA, to further improve the survival rate and prognosis of BLCA.
Autophagy plays an important role in inhibiting tumorigenesis and tumor development by maintaining genomic integrity, reducing proliferation and inhibiting inflammation [7]. Autophagy is closely related to the occurrence and development of cancers [8]. Some autophagy genes such as Jun, myc and itga3 can be used as potential prognostic markers of BLCA [9]. Numerous studies have reported the influence of the immune microenvironment on BLCA development and immunotherapy including programmed cell death protein 1 (PD-1)/programmed cell death-ligand 1 (PD-L1) blockade, which was extensively applied to the treatment of BLCA patients [10, 11]. The medicines of immunotherapy and regulating autophagy bring new opportunities for patients with BLCA [12, 13].
However, at present, effective prognostic markers of immunotherapy are lacking. So, it is a new idea for clinical treatment of BLCA to study the relationship between autophagy, immunity and BLCA, which effectively predicts the prognosis of BLCA. Although there have been reports on autophagy or immune genes related to BLCA prognosis. There is no study on autophagy combined with immune genes as prognostic markers of BLCA and their relationship with immunotherapy response. It is significant for the treatment and prognosis of BLCA to explore the genes and construct a gene model related to the prognosis of BLCA.
In this study, 32 differentially expressed autophagy-related genes (DEARGs) or immune-related genes (DEIRGs) were identified from the cancer genome atlas (TCGA) dataset and GSE13507 dataset of BLCA. We identified three DEARGs (AURKA, ACTC1, MYLK) and three DEIRGs (PDGFD, PDGFRA, TNC) that were associated with the overall survival (OS) of BLCA patients and suggested as potential prognostic markers of BLCA. This may provide a foundation for developing highly specific prognostic tools and more robust therapeutic strategies for BLCA in the future.
Materials and methods
Data source and preprocessing
We collected the transcriptome data of 424 samples (include 19 normal and 405 BLCA samples) from the TCGA database (
Identification of DEARGs and DEIRGs
The differentially expressed genes (DEGs) between normal and BLCA samples in the TCGA dataset and GSE13507 dataset were determined respectively by using the ‘limma’ R package [14, 15]. The
Differentially expressed ARGs/IRGs. (A) Heatmap demonstrating DEGs identified in the TCGA dataset between BLCA and normal samples, with red representing high expression and green representing low expression; (B) Heatmap demonstrating DEGs identified in the GSE13507 dataset between BLCA and normal samples, with red representing high expression and green representing low expression; (C) Venn graph of 32 DEARGs/DEIRGs, of which 14 ARGs and 18 IRGs, were identified by taking the intersection of DEGs from the TCGA dataset, GSE13507 dataset, and ARGs/IRGs.
The univariate Cox regression model was used to identify DEARGs/DEIRGs that were significantly associated (
Correlation analysis of prognostic gene signature and clinicopathological characteristics
The risk scores between subgroups were compared based on the following clinicopathological features: age (
Gene set enrichment analysis
The gene set enrichment analysis (GSEA) was carried out in high- and low-risk groups with c2.cp.kegg.v7.0. symbols derived from MSigDb as the gene set via GSEA software (3.18.0) [16]. The significantly enriched KEGG pathway was screened with a NOM
Evaluation of immune microenvironment
The immune-, stromal- and estimate-scores of each TCGA-BLCA sample in the low- and high-risk groups were calculated by applying the ‘Estimation of Stromal and Immune cells in Malignant Tumours using Expression data’ (ESTIMATE) algorithm. The enrich score of 22 immune cells was calculated with single-sample gene set enrichment analysis (ssGSEA) [17]. A box plot was drawn to visualize the differences in 22 immune cells infiltration between the low- and high-risk groups.
Statistical analysis
All analyses were conducted using the R programming language, and the data from different groups were compared by the Wilcoxon test. If not specified above, a
Results
Identification of DEARGs and DEIRGs in BLCA
The expression level of genes was compared between normal and BLCA samples in the TCGA dataset and GSE13507 dataset respectively. We found that 3134 DEGs were identified in the TCGA dataset, of which 1310 were up-regulated and 1824 were down-regulated(Supplemental Table 1). A total of 492 DEGs were identified in the GSE13507 dataset, including 74 up-regulated and 418 down-regulated genes(Supplemental Table 2). The heatmaps showed the expression levels of these DEGs (Fig. 1A and B). A total of 32 DEARGs/DEIRGs, of which 14 ARGs and 18 IRGs, were identified by taking the intersection of DEGs from the TCGA dataset, GSE13507 dataset, and ARGs/IRGs (Fig. 1C, Supplemental Table 3).
Univariate (A) and multivariate (B) Cox regression analysis in terms of OS for patients with BLCA.
The evaluation of the BLCA risk model. (A) The Kaplan-Meier curves of OS for patients with high-risk scores (red line) and low-risk scores (blue line) in the training set; (B) The Kaplan-Meier curves of OS for patients with high-risk scores (red line) and low-risk scores (blue line) in the validation set; (C) The AUC values of 1-, 3-, and 5-year survival in the training set; (D) The AUC values of 1-, 3-, and 5-year survival in the validation set; (E) Distribution of patients with high-risk scores (red color) and low-risk scores (green color) in the training set; (F) Survival status of patients with BLCA (red dots stand for the deceased patients and the green dots stand for the survivors) in the training set; (G) Distribution of patients with high-risk scores (red color) and low-risk scores (green color) in the validation set; (H) Survival status of patients with BLCA (red dots stand for the deceased patients and the green dots stand for the survivors) in the validation set; (I) The heatmap of the six survival-associated DEARGs and DEIRG expression profiles in the training set; (J) The heatmap of the six survival-associated DEARGs and DEIRG expression profiles in the validation set.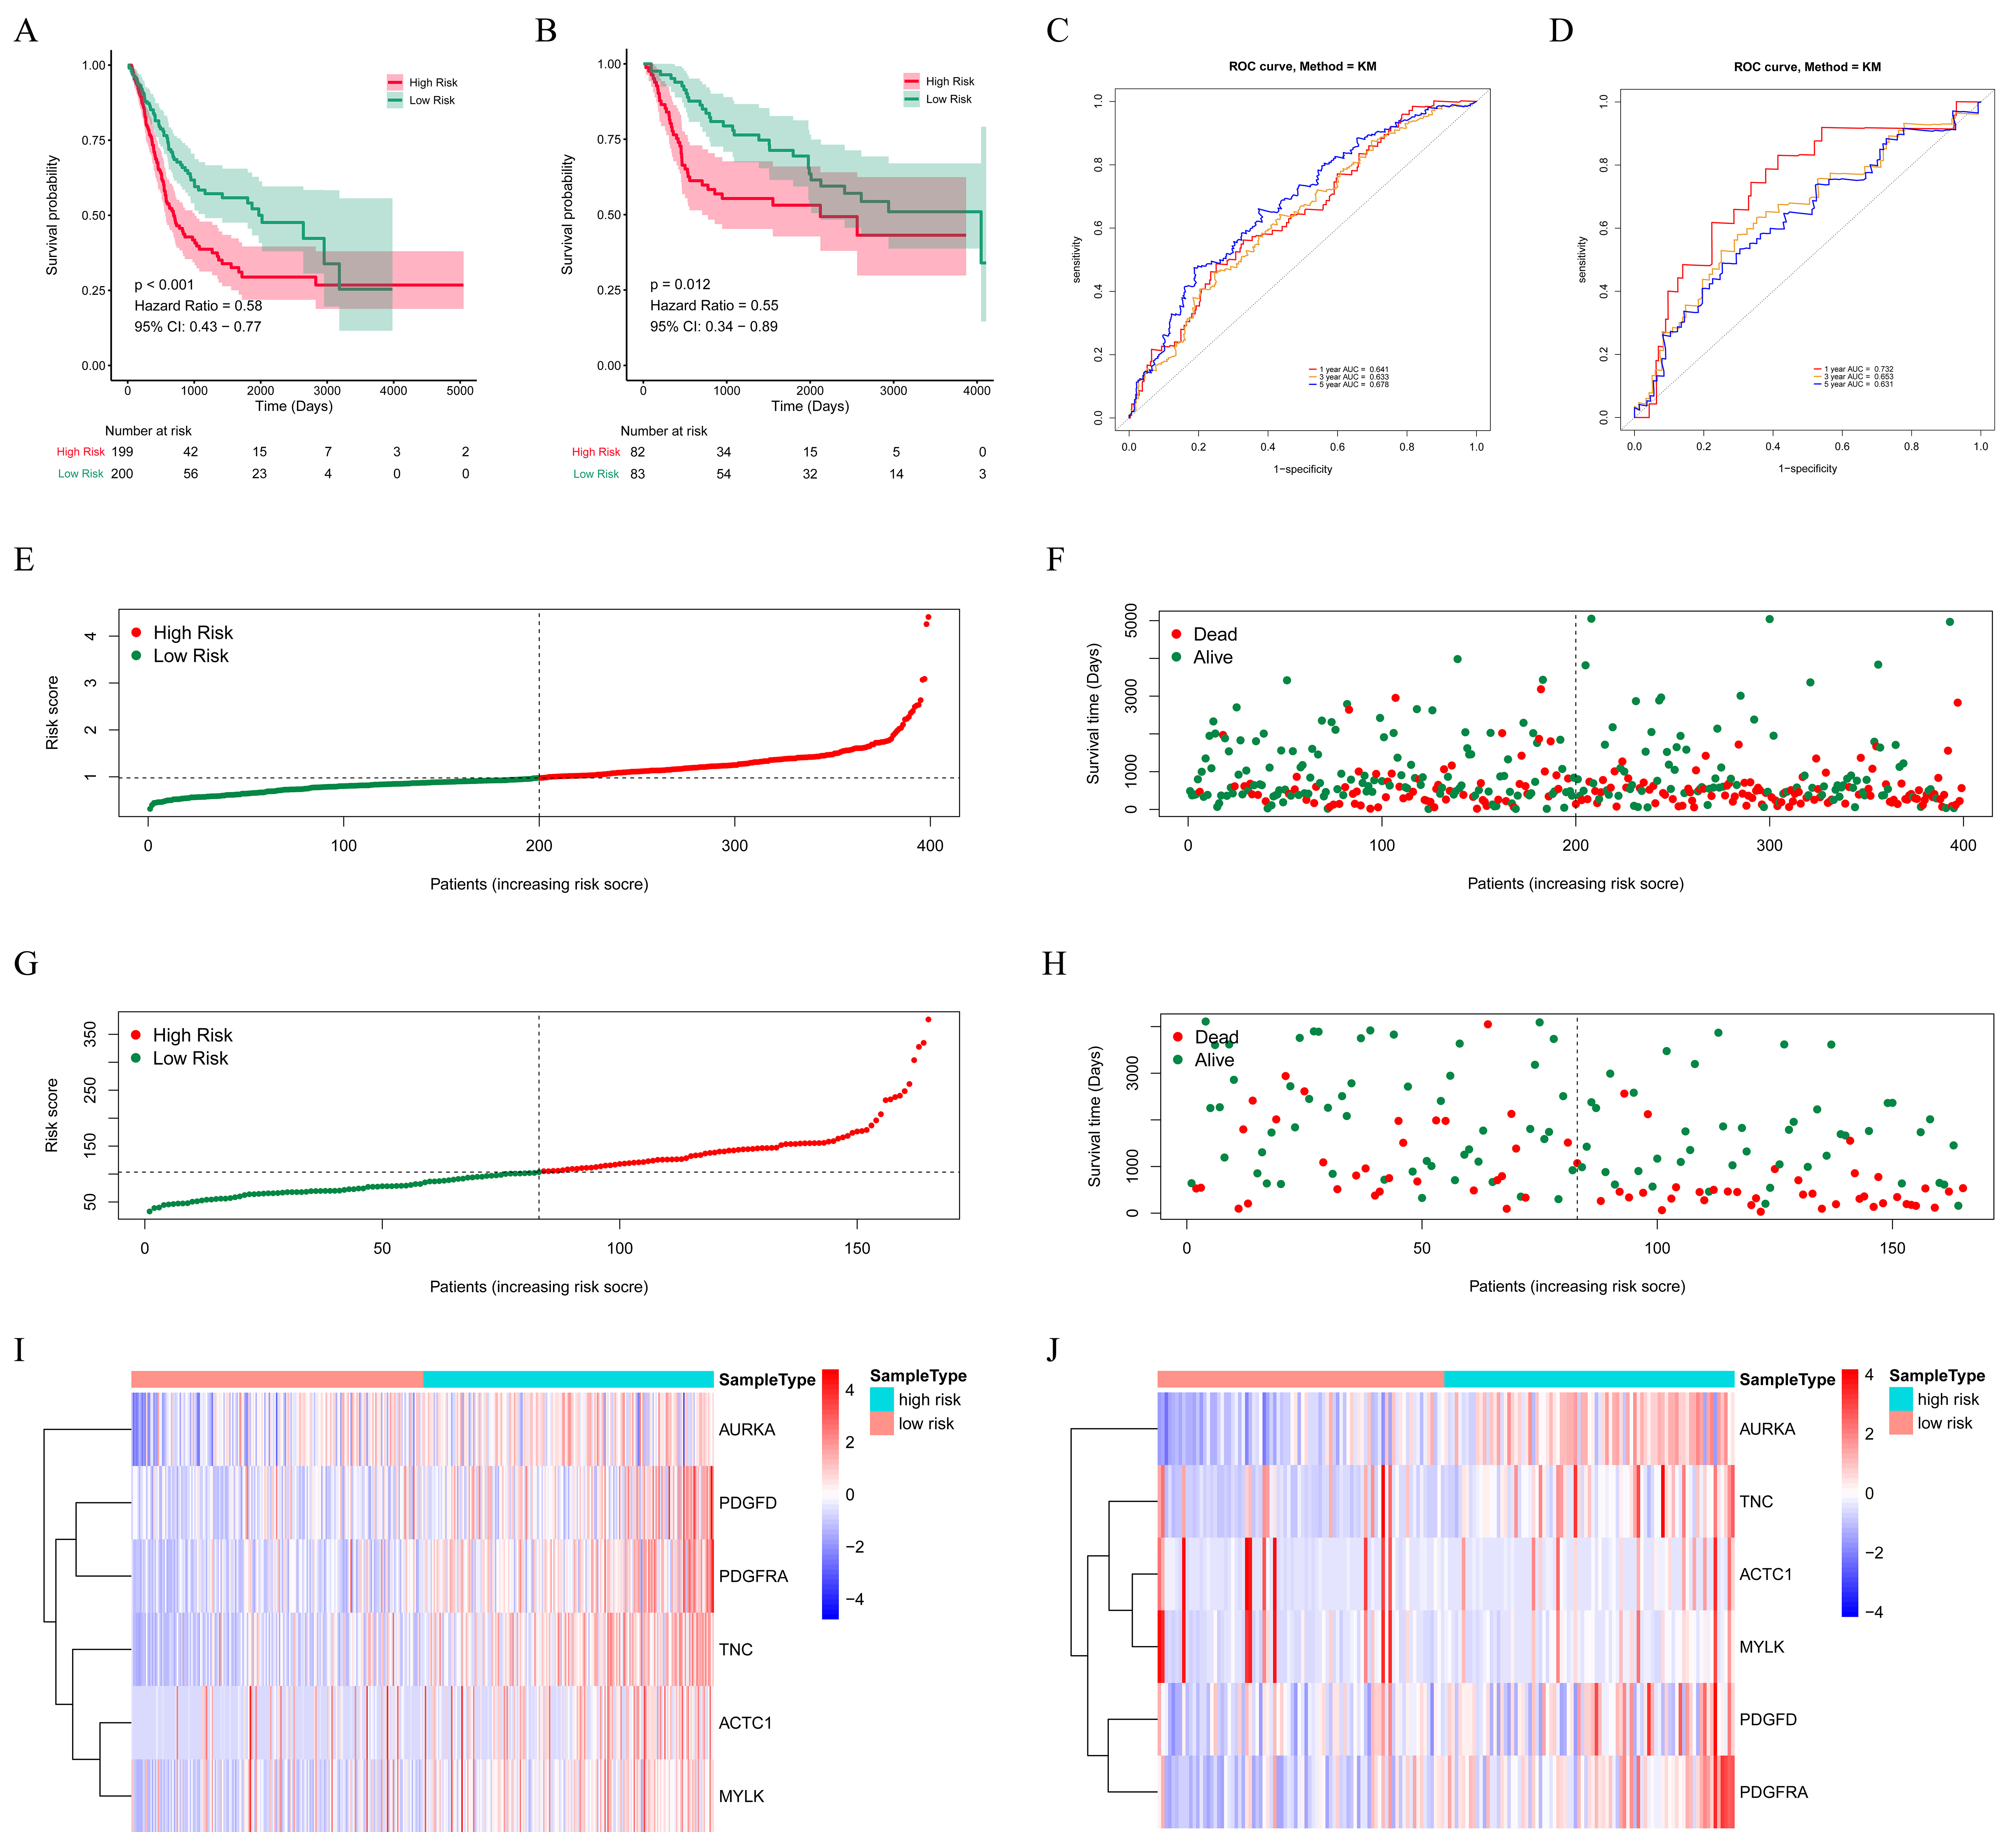
The relationships between the riskscore and clinicopathological factors. (A) age; (B) gender; (C) pathological stage; (D) T stage; (E) M stage and (F) N stage in the BLCA patients from the TCGA database. 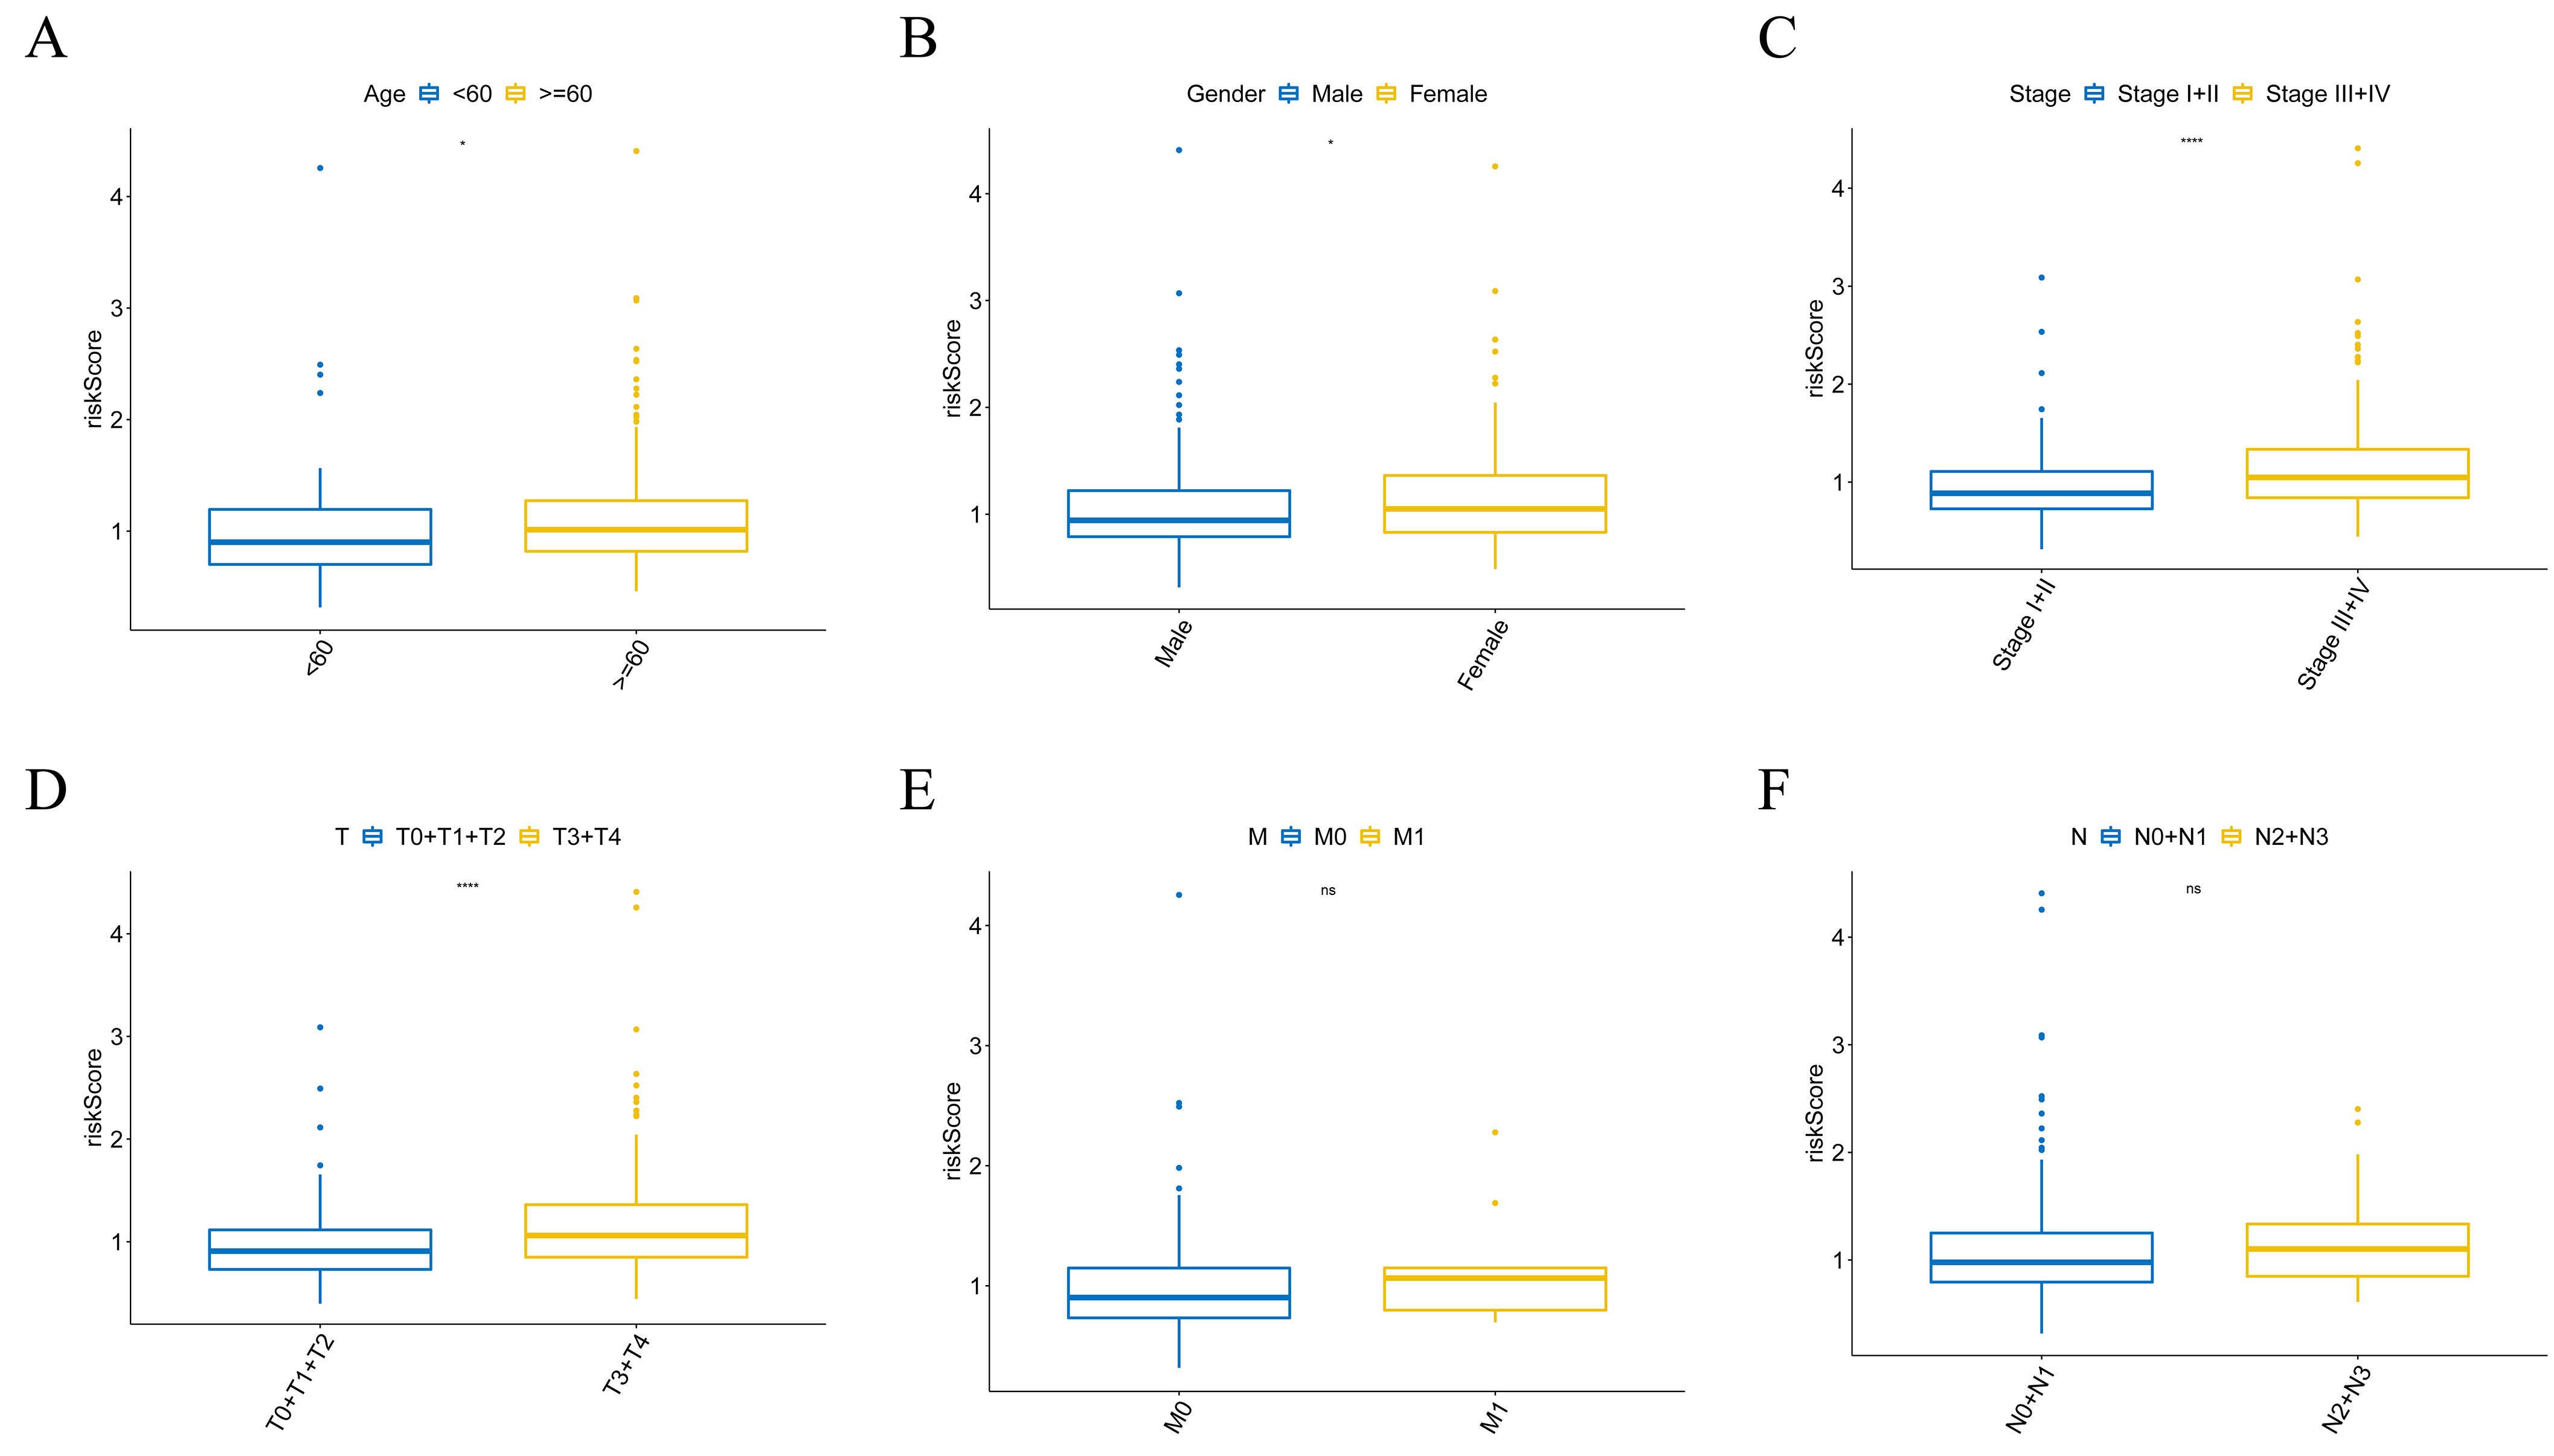
The prognostic values of the risk score in forest plot of the hazard ratios with high-risk genes (HR 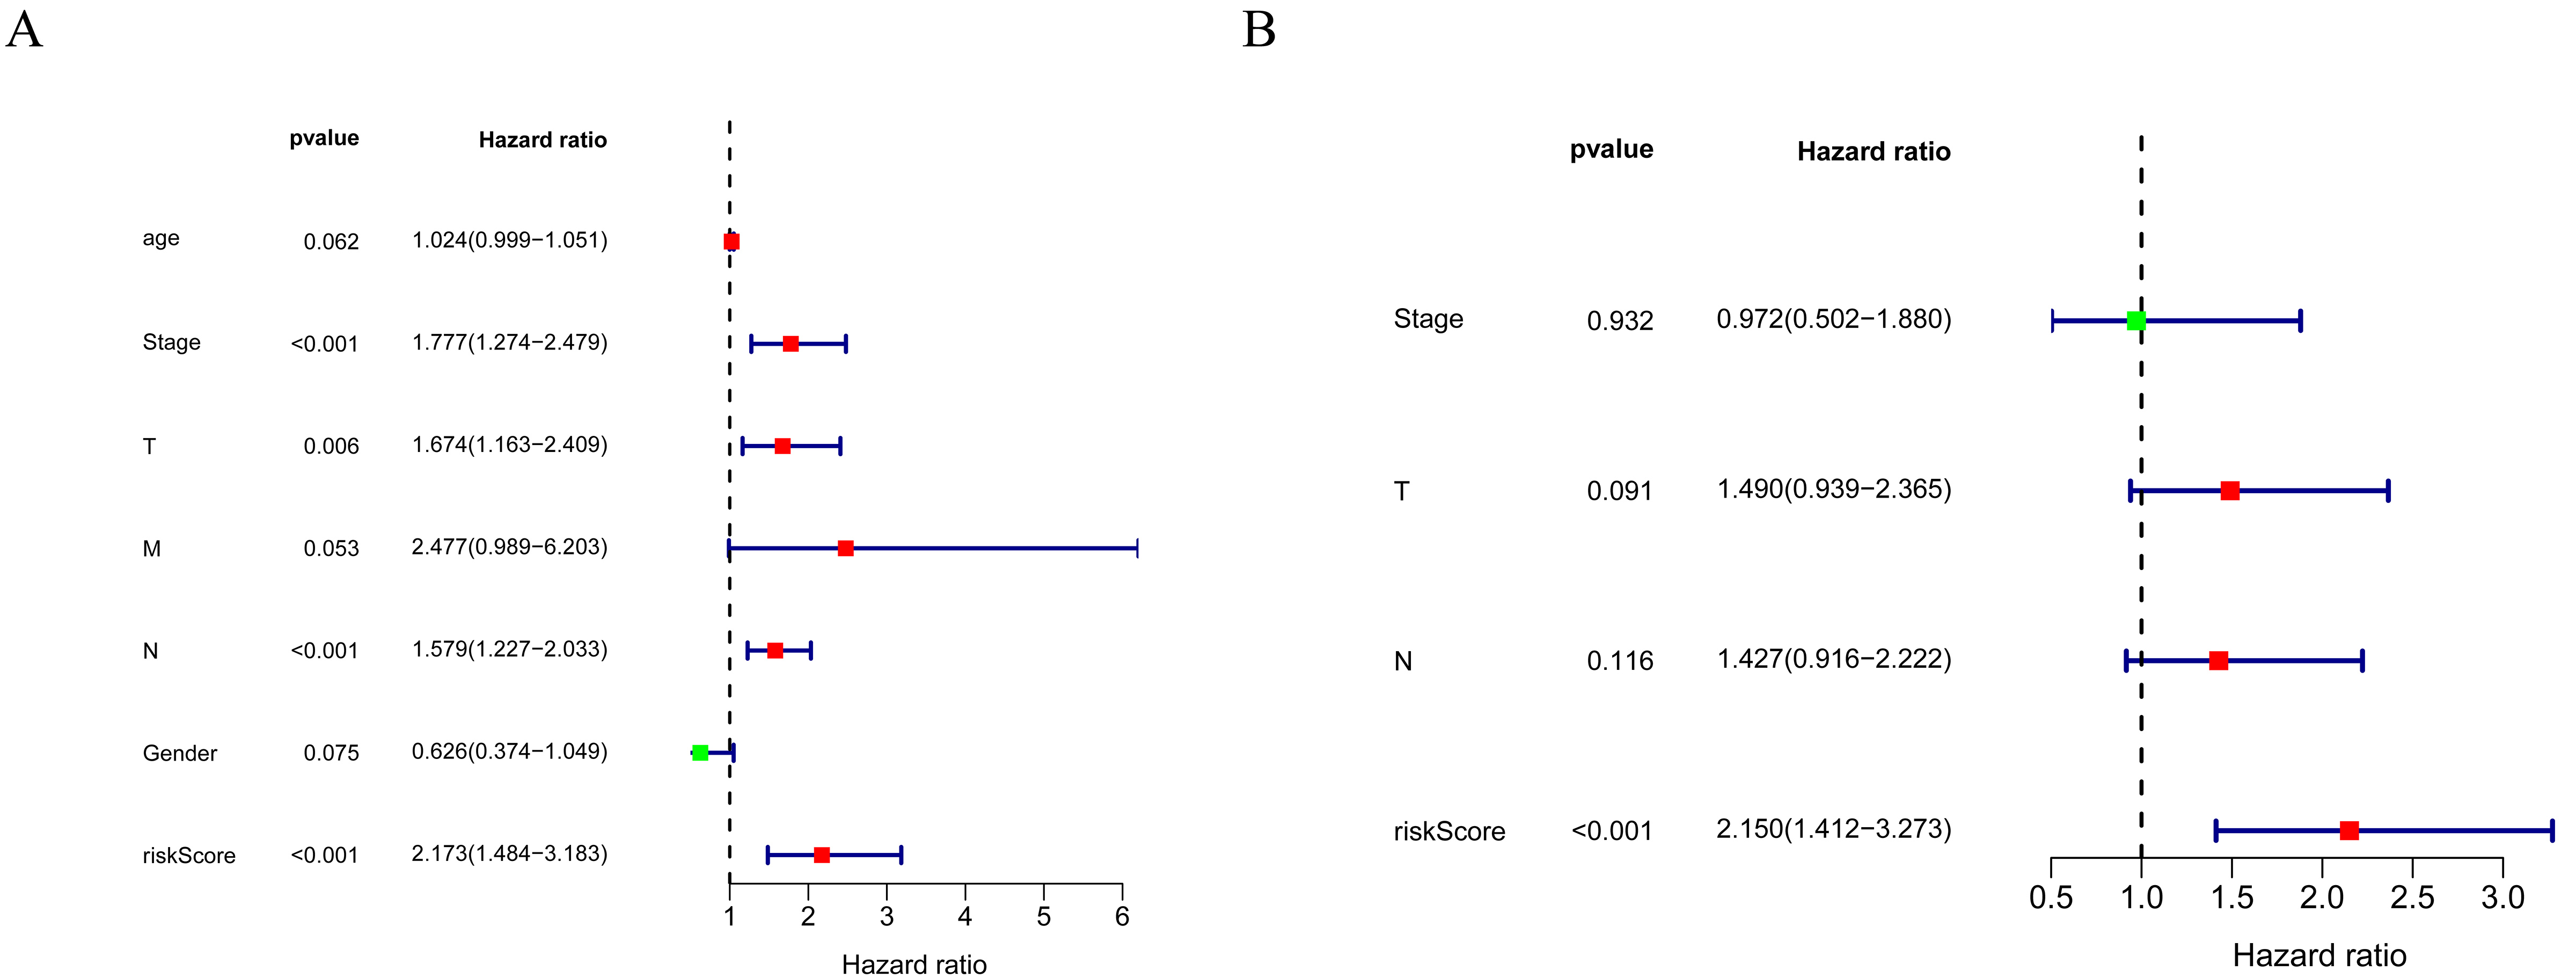
The KEGG pathways significantly enriched in low- and high-risk groups. (A) Pathways in cancer; (B) T cell receptor signaling pathway; (C) B cell receptor signaling pathway; (D) Oxidative phosphorylation; (E) Ribosome; (F) Glycerophospholipid metabolism.
Comparison of the immune microenvironment and immunotherapy efficiency between low-risk group (blue) and high-risk group (yellow) in TCGA dataset. (A) immune score; (B) stromal score; (C) estimate score; (D) enrichment scores of 22 immune-associated gene sets using the ssGSEA algorithm; (E) expression of immune checkpoint molecules. 
Correlations of risk score with MMR genes (MSH6, MLH1, PMS2, MSH2). (A) MMR genes expression in low- (yellow) and high-risk groups (blue) in TCGA; (B) MMR genes expression in low- (yellow) and high-risk groups (blue) in GSE13507 dataset; (C) Pearson correlation of risk score with MMR genes in TCGA; (D) Pearson correlation of risk score with MMR genes in GSE13507 dataset. 
Through univariate Cox regression analysis, 15 out of the 32 DEARGs/DEIRGs were identified as closely related to BLCA patients’ OS in the training set (
After erecting the risk model, the patients were divided into high- and low-risk groups based on the median value of the risk score. Then K-M survival analysis was performed in the training set and validation set. The results suggested that patients with high-risk scores had remarkably worse survival rates than those with low-risk scores (Fig. 3A and B). As shown in Fig. 3C and D, the AUC values of 1-, 3-, and 5-year survival in the training set and validation set were greater than 0.6 respectively, exhibiting a decent accuracy. Furthermore, we ranked all BLCA patients according to their risk scores to evaluate the survival rate distribution. The scatterplot showed the survival status of patients with a different risk scores (Fig. 3E–H). We described the expression level of prognostic genes with the different risk scores of samples using heatmaps (Fig. 3I and J). As shown in Fig. 3I and J, the expression of AURKA, PDGFD, PDGFRA, and TNC was higher in the high-risk group. In summary, these results indicated the risk score showed satisfactory performance in predicting the OS for BLCA.
Stratification analysis of the risk score
For determining the relationship between the risk score with the clinicopathological characteristics, we analyzed the corresponding clinical information of BLCA patients from the TCGA database. The results revealed that risk scores had significant differences in different age groups, gender groups, pathological stage groups, and T stage groups (Fig. 4A–D), while the risk score was not associated with M and N stages (Fig. 4E and F). The result of the stratification analysis showed that the prognostic signature could be a potential prognostic marker for some subgroups of BLCA patients.
Independent prognostic value of the risk model
We performed univariate and multivariate Cox regression analyses to assess whether the risk score was independent of other clinical parameters (age, gender, pathological stage, TNM stage) as a prognostic factor for BLCA patients. The univariate analysis indicated that the pathological stage, T stage, N stage, and risk score were associated with the prognosis of BLCA patients (Fig. 5A). The multivariate Cox regression analyses demonstrated that the risk score can be used independently to predict the prognosis of BLCA patients (Fig. 5B).
Gene set enrichment analyses between low- and high-risk groups
To unravel the molecular mechanism underlying the six-gene signature, GSEA was conducted in the TCGA database. The KEGG pathways enriched in low- and high-risk groups were shown in the Supplementary Table 4. We noted that some cancer and immune-related pathways, including pathways in cancer, T cell receptor signaling pathway and B cell receptor signaling pathway were significantly enriched in the high-risk group as defined (Fig. 6A–C). In the low-risk group, the significantly enriched pathways were mainly related to oxidative phosphorylation, ribosome, and glycerophospholipid metabolism (Fig. 6D–F).
Comparison of the immune microenvironment and immunotherapy efficiency between low- and high-risk groups
To further explore the correlation between the risk score and immune status, the ESTIMATE algorithm was used to calculate the immune score, stromal score, and estimate score for the tumor tissues. The results show that the immune score, stromal score, and estimate score were higher in the high-risk group compared with the low-risk group (Fig. 7A–C). Moreover, we estimated the enrichment scores of 22 immune-associated gene sets between low- and high-risk groups using the ssGSEA algorithm. As shown in Fig. 7D, the low-risk BLCA patients had significantly higher enrich scores of Th17 cells than high-risk BLCA patients and the high-risk BLCA patients had significantly higher enrich scores of aDC, B cells, CD8 T cells, cytotoxic cells, DC, Eosinophils, iDC, Macrophages, Mast cells, Neutrophils, NK CD56dim cells Tcm, NK cells, T cells, T helper cells, Tem, TFH, Tgd, Th1 cells, and Th2 cells than low-risk BLCA patients, These findings suggested that there were significant differences in immune microenvironment between the two risk groups.
Immune checkpoint molecules are essential for immune function and have diverse clinical implications in immunotherapy. Therefore, we contrasted the expression of immune checkpoint molecules between the two risk groups. As shown in Fig. 7E, the expression of immune checkpoint molecules PDCD1, CD274, CTLA4, IDO2, IDO1, LAG3, TIGIT and BLTA in the high-risk group was greater than that in the low-risk group in the TCGA dataset.
Correlations of risk score with MMR genes
Mismatch repair (MMR) proteins are crucial for DNA mismatch repair and play important role in maintaining the integrity and stability of genetic material. As shown in Fig. 8A and B, three MMR genes, MSH6, MLH1, and MSH2 present higher expression in high-risk groups in TCGA and GSE13507 datasets. Subsequently, we analyzed the Pearson correlation of risk score with MMR genes (MSH6, MLH1, PMS2, MSH2) and showed that risk score was significantly correlated with MSH6, MLH1, and MSH2 (Fig. 8C and D).
Discussion
At present, the molecular mechanism of BLCA has not yet been described, while growing evidence has revealed that ARGs, IRGs and immune cell infiltration, play critical roles in the pathogenesis and progression of BLCA [18, 19]. it is a new idea for clinical treatment of BLCA to study the relationship between autophagy, immunity and BLCA, which effectively predicts the prognosis of BLCA. In this study, our goal was to identify common DEARGs and DEIRGs in BLCA. We had identified three DEARGs (AURKA, ACTC1, MYLK) and three DEIRGs (PDGFD, PDGFRA, TNC) were associated with the development and OS of BLCA patients.
In our study, the BLCA risk score model was constructed based on the above three DEARGs and three DEIRGs, and verified to be effective to predict the prognosis of BLCA patients. Compared with other risk score models of BLAC [20, 21], our model included not only immune genes but also autophagy genes. Independent prognostic analysis shown that our risk score could be used as a clinically independent prognostic factor, which provided a reference for doctors to decide clinical treatment strategies. In GO and KEGG enrichment analysis, cancer related pathways were enriched in the high-risk group, which further illustrated the effectiveness of our risk scoring model. Moreover, the enrichment of immune related pathways in high-risk group indicated that immunity played an important role in affecting the prognosis of BLCA patients.
The prognosis of BLCA patients with different infiltration of immune cells was variant, and these differences affected development of BLCA and sensitivity of immune checkpoint inhibitors (ICIs) treatments [10]. The number of tumor infiltrating lymphocytes (TILs) was closely related to the prognosis of BLCA patients [22]. In this study, we found that the TILs and expression of critical immune checkpoints were significantly different between high-risk group and low-risk group. The immune score, stromal score, and estimate score were higher and the expression of many immune checkpoint molecules was greater in the high-risk group than those in the low-risk group. These results suggested that immunotherapy would be more suitable for BLCA patients in the high-risk group. Tumor-associated macrophages affected progress of solid tumors as part of tumor microenvironmental cells [23]. The macrophages directly affected immune response to BLCA and were the main inhibitors of the tumor microenvironment that promoted growth and metastasis of BLCA [24]. The paracrine interaction between tumor-associated macrophages and BLCA cells led to enhanced BLCA cell growth, migration, and invasiveness, and moreover, increased CCL5 cytokine production and IL-8 in tumor microenvironment [25]. In our study, the enrich score of macrophages was significantly higher in high-risk score group than that in low-risk group. A higher abundance of macrophages in the tumor immune microenvironment suggested higher amounts of abnormal expression of immune genes; this, in turn, participated in the occurrence and progression of BLCA and the processes of invasion and metastasis [24, 26].
MMR played important role in maintaining the integrity and stability of genetic material. In this study, there were significant differences in MMR genes between the high- and low-risk groups. The risk score was significantly correlated with multiple MMR genes. At present, MMR defect or high instability of microsatellite was one of the markers predicting the efficacy of PD1 antibody [27]. BLCA lacking MMR genes was usually immunogenic and showed extensive infiltration of T cells, making it highly responsive to ICIs [28, 29].
Viewed in total, this study found biomarkers of autophagy- and immune-related genes that could be used as prognostic factors for BLCA. The risk model established was highly correlated with autophagy and immunity and provided valuable targets and prognostic indicators for BLCA patients. These DEARGs and DEIRGs in the model played an important role in the occurrence and development of BLCA, and may be new targets for precise treatment of BLCA. This study provides a theoretical basis for judging the prognosis and treatment response of BLCA patients. However, the study was conducted based on public databases and did not include experimental verification. Moreover, this study had another limitation of small sample size. Notwithstanding these limitations, this study can still provide a theoretical basis for further study of prognosis-related biomarkers of BLCA, and we will continue to pay attention to the role of these genes.
Conclusion
AURKA, ACTC1, MYLK, PDGFD, PDGFRA and TNC can be used as novel prognostic markers for BLCA, and they are related to immune cell infiltration and immune checkpoint. The BLCA prognosis model based on DEARGs and DEIRGs is reliable, and is expected to help clinical physicians to predict the prognosis of BLCA. At present, this study is limited to small sample size and bioinformatics clinical data from public databases, in subsequent studies, we will verify it in more samples and combination with clinical trials. Experiments of in vitro and in vivo were lacked to validate our data mining results, which are also needed in the future.
Author contributions
Conception: Cheng Chen and Zhenhua Gao.
Interpretation or analysis of data: Cheng Chen, Zhenhua Gao and Peng Gu.
Preparation of the manuscript: Cheng Chen, Zhenhua Gao and Jianheng Chen.
Revision for important intellectual content: Jianheng Chen, Xiaodong Liu and Jihong Shen.
Supervision: Xiaodong Liu and Jihong Shen.
Supplementary data
The supplementary files are available to download from http://dx.doi.org/10.3233/CBM-220058.
Footnotes
Acknowledgments
This study was partly supported by grants from Joint Special Funds for Applied Basic Research of Yunnan Provincial Science and Technology Department and Kunming Medical University (Grant No. 202001AY070001-206 and 202101AY070001-014), and the National Natural Science Foundation of China (Grant Nos. 81960133, 81860451, and 81802548).