
Abstract
BACKGROUND:
Dynein axonemal light intermediate chain 1 (DNALI1) is a component of axonemal dyneins and its role in cancer progression is not known.
OBJECTIVE:
The influence of DNALI1 expression on the prognosis of low-grade gliomas (LGG) and the possible mechanisms of DNALI1 in promoting the progression of LGG was investigated by applying multiple bioinformatics analyses using datasets from TCGA, GTEx, CPTAC, and CGGA.
METHODS:
The expression of DNALI1 in different tumor tissues including LGG was investigated. GO functional annotation, KEGG pathway analysis, and GSEA enrichment analysis were performed. The correlation between DNALI1 and prognosis, tumor microenvironment (TME) and immune checkpoints in LGG were assessed.
RESULTS:
DNALI1 is mainly expressed in malignant cells in the TME of LGG and positively correlated with the development of LGG. DNALI1 expression is negatively correlated with isocitrate dehydrogenase (IDH) mutations and 1p/19q co-deletion. High DNALI1 expression is associated with poor prognosis in LGG. DNALI1 may promote LGG progression through multiple immune-related pathways. The expression of DNALI1 is positively correlated with the infiltration of certain types of immune cells and the expression of some immune checkpoints.
CONCLUSIONS:
DNALI1 is a potential prognostic marker for LGG, and high expression of DNALI1 may play an important role in maintaining the immunosuppressive microenvironment of LGG.
Introduction
Glioma, a common and fatal type of tumor in the central nervous system, is a serious threat to human health and is mainly characterized by high rates of death and disability. Low grade glioma (LGG, WHO II, III) is a type of glioma that is slow growing, less malignant and has a better survival outcome compared to high grade gliomas such as glioblastoma (GBM, WHO IV) [1]. However, more than 50% of LGG patients will eventually develop highly aggressive gliomas, although surgical removal of the tumor combined with chemotherapy and radiotherapy has improved the prognosis of LGG patients to some extent [2, 3]. Therefore, there is an urgent clinical need to identify new biomarkers that reflect the prognosis and therapeutic efficacy of LGG [4]. Bioinformatics studies have been shown to play an important role in the improvement of the accuracy of glioma diagnosis and treatment. For example, the World Health Organization has added molecular biomarkers such as isocitrate dehydrogenase (IDH) mutations to the diagnostic guidelines for glioma with the help of bioinformatics analysis [5]. With the development of big data analytics, the analysis of high-throughput LGG samples and clinical data will potentially provide an important basis for clinical decision-making in the diagnosis and treatment of LGG patients.
In recent years, immunotherapy has changed the paradigm of cancer treatment and has become one of the most important pillars of cancer therapy [6]. For example, immune checkpoint inhibitors targeting programmed cell death protein 1 (PD-1) and programmed cell death ligand 1 (PD-L1), and cytotoxic T-lymphocyte-associated antigen-4 (CTLA-4) have been widely used to treat a variety of solid tumors and have achieved significant clinical results [7]. The microenvironment within gliomas exhibits significant immunosuppression and is an important contributor to the poor prognosis of gliomas [8]. Activating the immune response within gliomas through multiple pathways is one of the most promising means of treating gliomas in the future. Research and applications of glioma immunotherapy have been focused on GBM and are rarely seen in LGG [9, 10]. Although targeted therapies have greatly improved the overall survival of LGG patients in recent years, it remains challenging to facilitate immunotherapy in LGG patients [11]. Therefore, it is urgent to develop new and effective biomarkers to diagnose LGG and facilitate immunotherapy in LGG patients [12].
DNALI1 is a flagellar protein that is essential for the assembly of the inner dynein arm [13]. Studies have shown that DNALI1 is strongly expressed in spermatocytes, spermatids, and flagella of mature sperm, and plays an important role in sperm flagellogenesis [14]. DNALI1 mutations impair the integration of axoneme structure and affect sperm motility, leading to azoospermia [15]. Bioinformatics analysis suggested that DNALI1 may be a prognostic biomarker for childhood asthma [16]. Although DNALI1 was found to be highly expressed in high-grade ovarian cancer [17], there is a lack of evidence for pan-cancer studies on the relationship between DNALI1 and other tumor types. Also, the function of DNALI1 in tumor progression remains largely unknown. Herein, we first performed a pan-cancer analysis of DNALI1, including expression differences and correlations between expression levels and prognosis, and found a significant association between DNALI1 expression and prognosis in LGG. Then, we performed bioinformatics analysis of DNALI1 using different LGG-related databases to investigate the potential role and mechanism of DNALI1 in LGG progression and prognosis.
Materials and methods
Data acquisition
The RNA-seq data and clinical information for glioma was obtained from TCGA database (
Pan-cancer analysis
The pan-cancer analysis of DNALI1 was performed using the TIMER database (
Analysis of DNALI1 expression
DNALI1 expression in LGG was analyzed by the profiles that downloaded from the TCGA, GTEx, and GEO. The raw data were downloaded as MINiML files. Statistical analyses were performed using R software v4.0.3.
Correlations between DNALI1 and survival in LGG
The relationship between DNALI1 expression and the prognosis of LGG patients in TCGA was then examined by overall survival (OS). Differences in survival between high and low DNALI1 expression groups in LGG patients were compared using a logarithmic test. The timeROC (v 0.4) analysis was used to compare the predictive accuracy of DNALI1 expression. All analyses were implemented by R4.0.3.
GO and KEGG pathway analysis of differentially expressed genes (DEGs) between high and low DNALI1 expression groups
The difference of gene expression between high and low DNALI1 expression groups was analyzed to explore the possible role of DNALI1 in LGG. Using the limma package in the R software to study the DEGs. “Adjusted
Analysis of gene set enrichment
RNA-sequencing expression profiles for LGG were downloaded from the TCGA dataset. GSEA analysis was performed using the GSVA package of R software. Correlation between DNALI1 expression and pathway scores was analysed by Spearman correlation. All analyses were implemented by R version 4.0.3.
Evaluation of immune score and immune checkpoint
The difference of immune cell infiltration between high and low DNALI1 expression groups was analyzed by TIMER in immunedeconv, a reliable immune score assessment R package. To assess the differential expression of immune checkpoint-related genes between the DNALI1 high and low expression groups, expression values of eight representative genes in different groups including SIGLEC15, TIGIT, CD274, HAVCR2, PDCD1, CTLA4, LAG3 and PDCD1LG2 were extracted. All analyses were implemented by R4.0.3.
Results
Pan-cancer analysis of DNALI1
Gene_DE module of TIMER allows users to study the differential expression between tumor and adjacent normal tissues for any gene of interest across all TCGA tumors. Therefore, the Gene_DE module of TIMER was applied in this study to compare the expression levels of DNALI1 in different human tumors. As shown in Fig. 1A, compared with that in the corresponding normal tissues, DNALI1 expression was higher in breast invasive carcinoma (BRCA), cholangiocarcinoma (CHOL), glioblastoma multiforme (GBM), kidney renal papillary cell carcinoma (KIRP), and uterine Corpus Endometrial Carcinoma (UCEC). Lower expression of DNALI1 was observed in bladder urothelial carcinoma (BLCA), colon adenocarcinoma (COAD), esophageal carcinoma (ESCA), kidney chromophobe (KICH), kidney renal clear cell carcinoma (KIRC), liver hepatocellular carcinoma (LIHC), lung adenocarcinoma (LUAD), lung squamous cell carcinoma (LUSC), rectum adenocarcinoma (READ), and thyroid carcinoma (THCA). However, no significant differences were found in cervical squamous cell carcinoma (CESC), head and neck squamous cell carcinoma (HNSC), prostate adenocarcinoma (PRAD), pancreatic adenocarcinoma (PAAD), pheochromocytoma and paraganglioma (PCPG), and stomach adenocarcinoma (STAD). Gene_Surv module of TIMER uses Cox proportional hazard model to evaluate the outcome significance of gene expression. In this study, the relationship between DNALI1 expression and overall survival (OS) was evaluated by Gene_Surv module. As shown in Fig. 1B, higher expression of DNALI1 indicated worse OS in LGG and LUSC, and better OS in ACC, UVM, LUAD, and SARC. It is worth noting that high expression of DNALI1 in LGG is a particularly significant risk factor for poor prognosis. However, due to the lack of LGG corresponding adjacent non-cancerous tissues in the TCGA database, whether DNALI1 is highly expressed in LGG tissues needs further confirmation.
Pan-cancer analysis of DNALI1. (A) Analysis of DNALI1 expression in different types of tumors from TCGA using the Gene_DE module of TIMER. 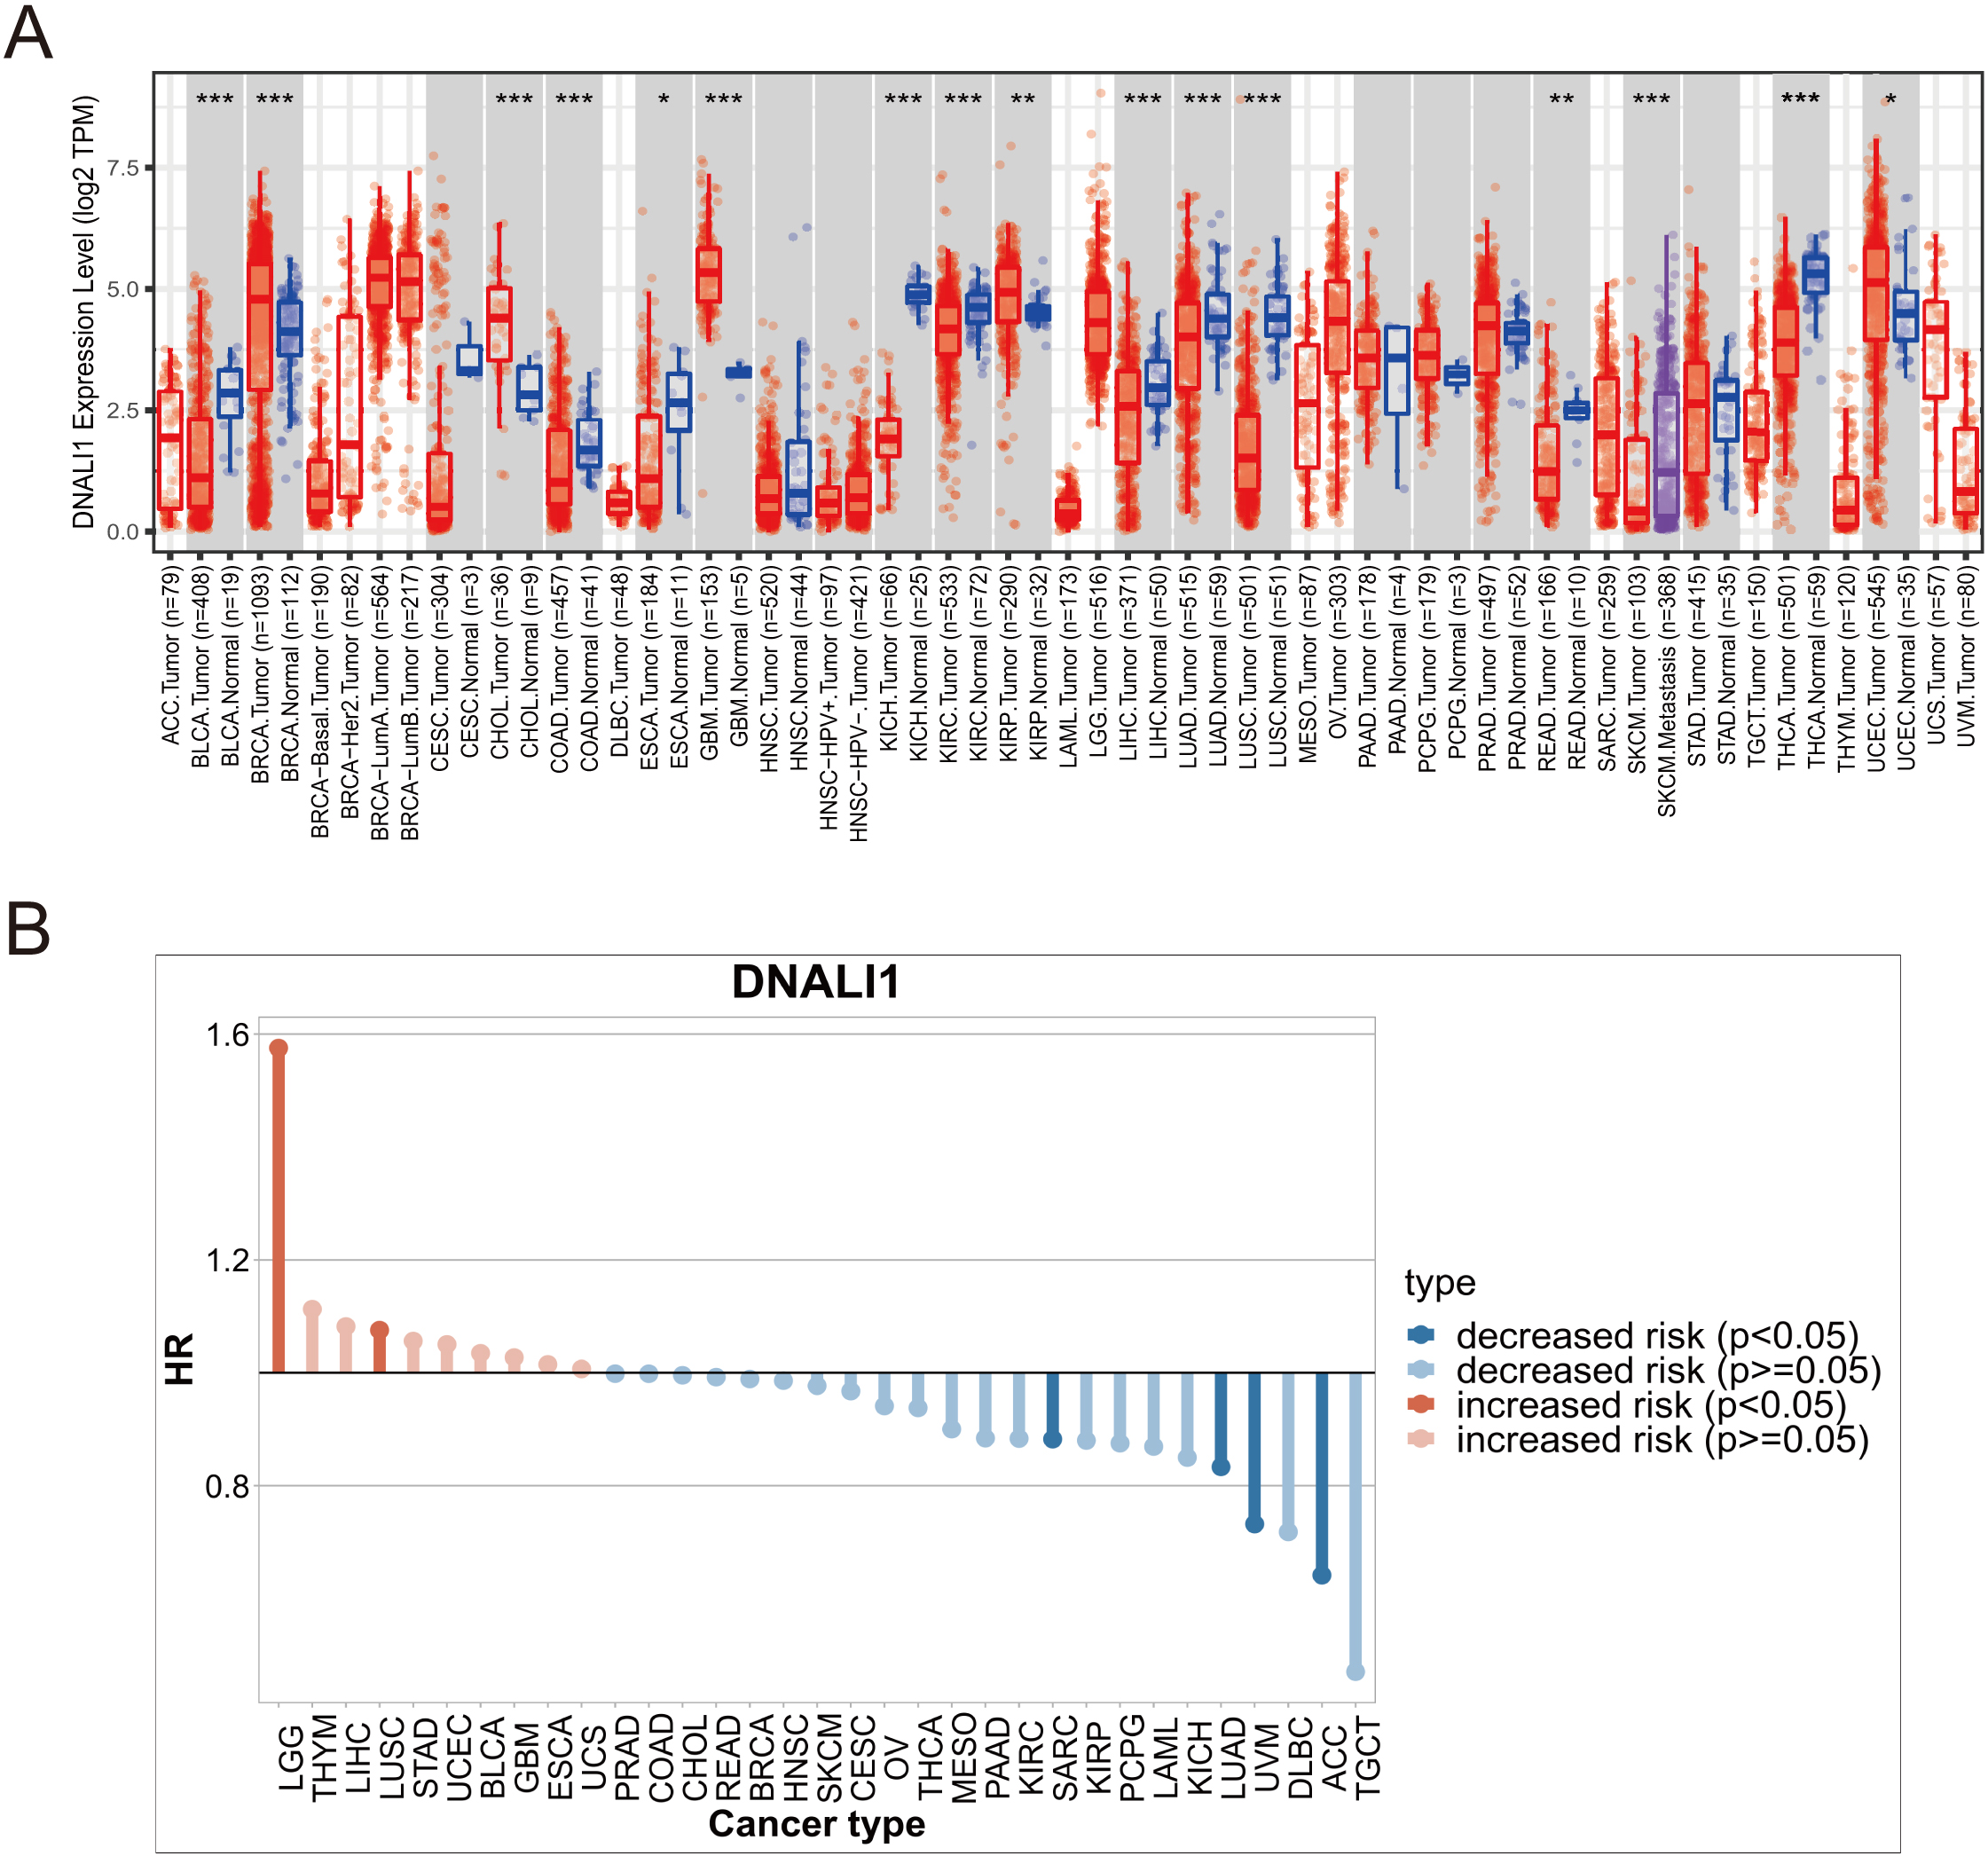
To assess DNALI1 expression in LGG, GBM and normal tissues, RNA sequencing data obtained from TCGA including 509 LGG and 153 GBM samples were analyzed using R software. Since the TCGA database lacked paracancerous tissue samples of LGG, 2642 normal samples from the GTEx database were downloaded and analyzed. The results suggested that DNALI1 was overexpressed in LGG tumor tissues compared to the normal tissues (
Expression of DNALI1 in LGG. (A) The expression of DNALI1 in LGG, GBM, and normal tissues. (B, C) The expression of DNALI1 in different stages of glioma in datasets of mRNAseq-325 and mRNAseq-693 in CGGA. (D) The expression of DNALI1 in datasets of GSE111260 in GEO. (E) The different protein levels of DNALI1 in LGG and normal tissues. (F) Effect of radiotherapy on DNALI1 expression in tumor tissues of LGG patients. 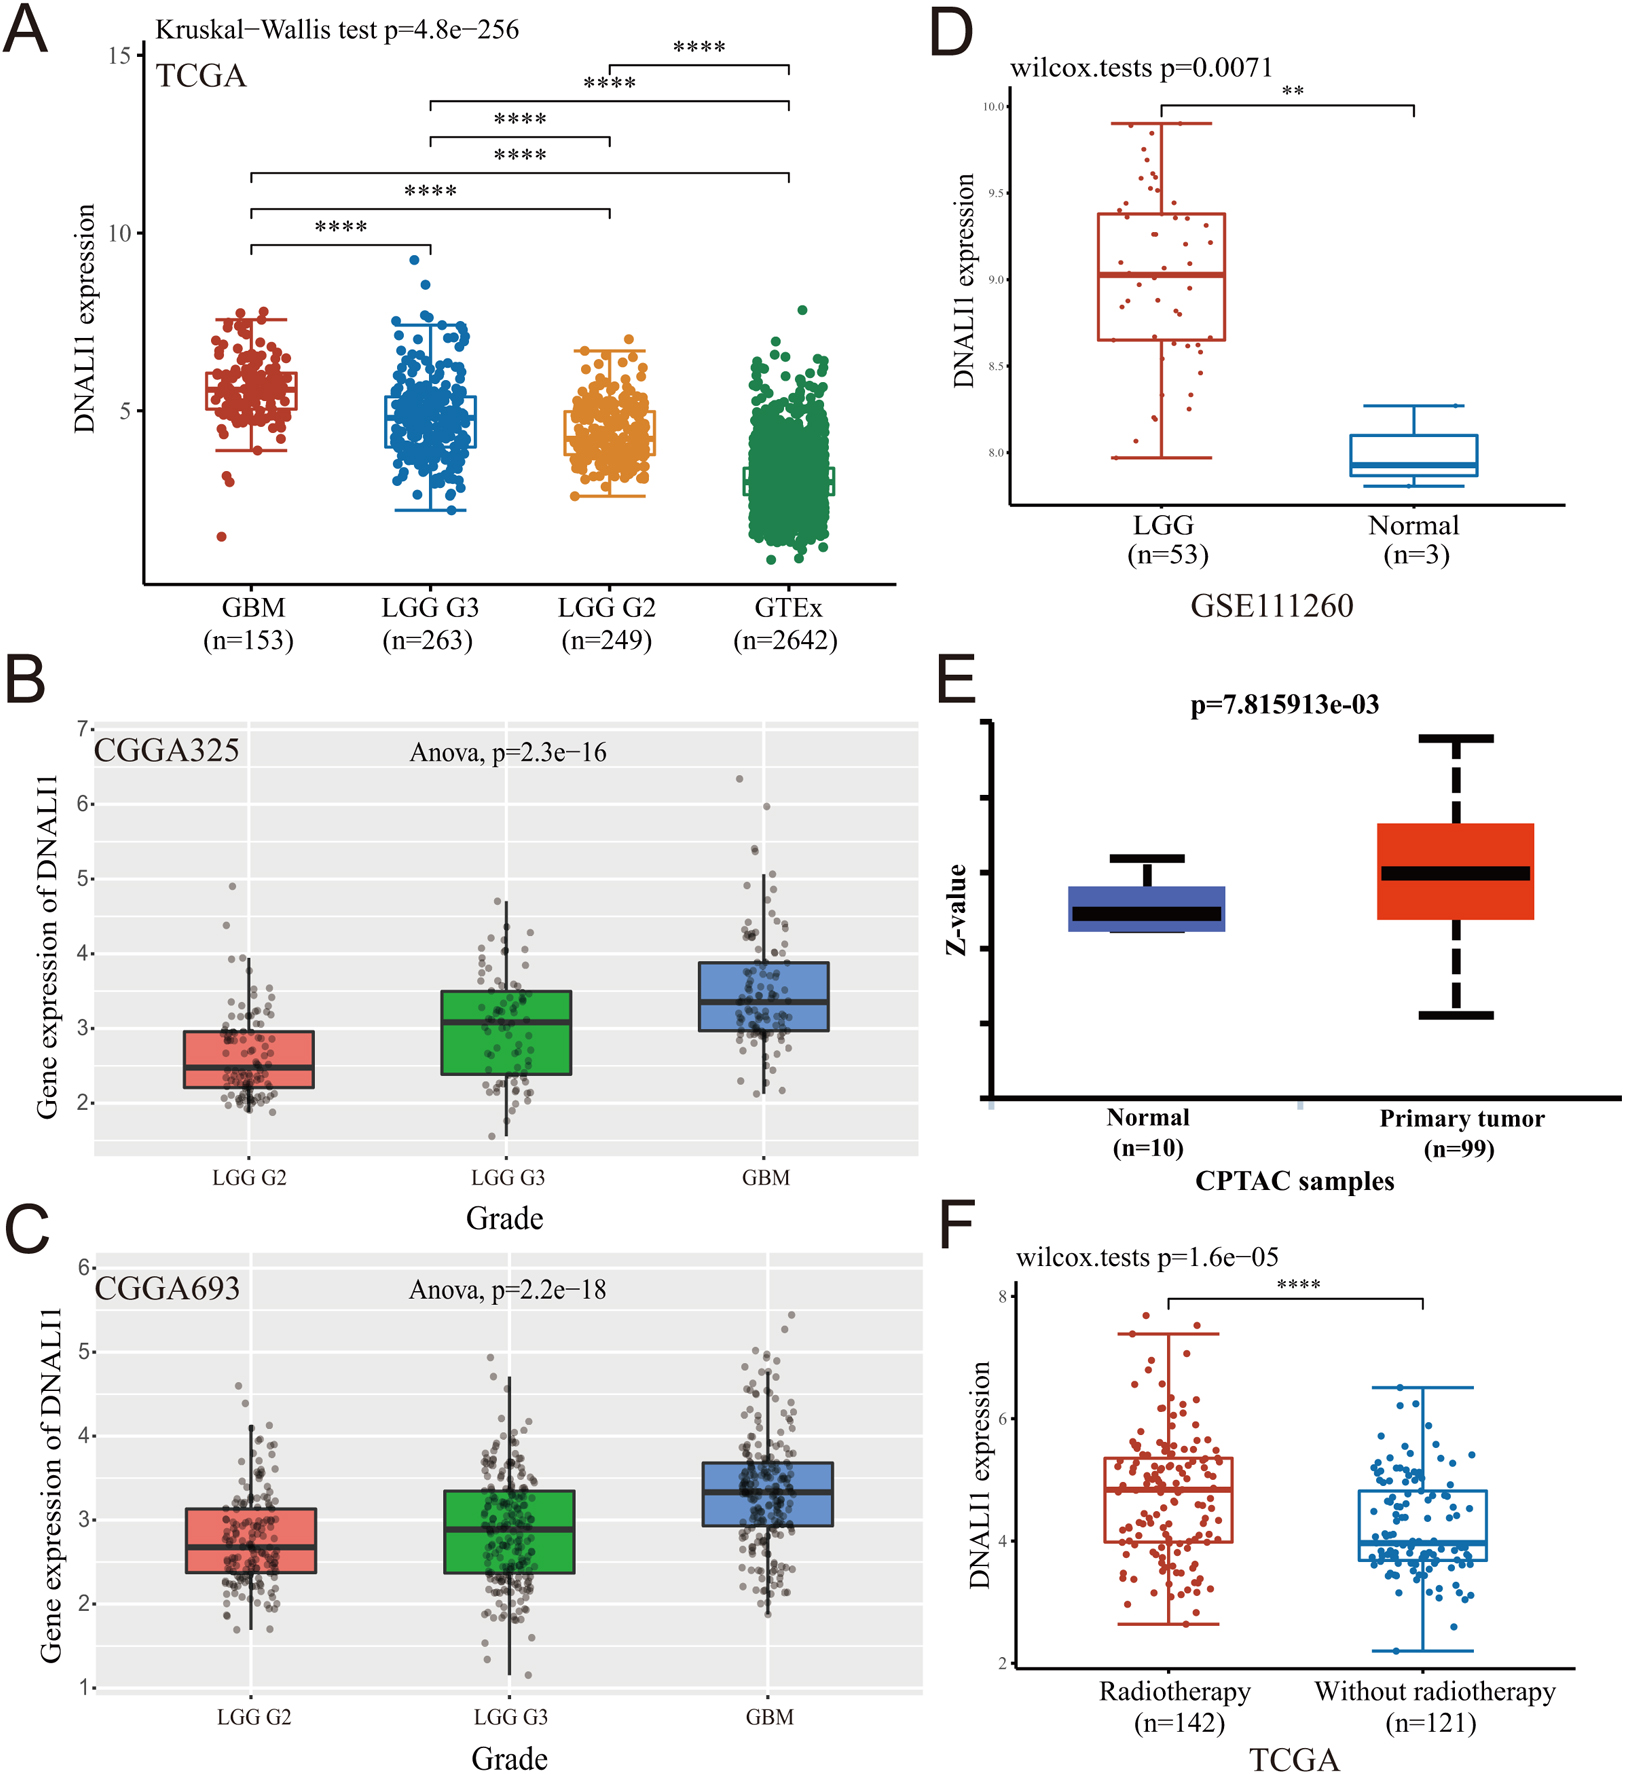
Glioma-associated single-cell transcriptome data included in the TISCH database were used to investigate in which cell subpopulations DNALI1 is predominantly expressed. A glioma single cell dataset (GSE131928) was explored and DNALI1 expression was found very high in malignant cells compared to other cell subpopulations (Fig. 3A). This result was subsequently validated in multiple glioma-associated single-cell datasets, indicating that the malignant cell subpopulation in the TME of LGG is indeed highly DNALI1-expressing (Fig. 3B).
Expression of DNALI1 in the TME of glioma. (A, B) The expression of DNALI1 in different cell subpopulations in the TME of glioma in GSE131928. (C) Analysis of DNALI1 expression in different cell subpopulations in the TME of glioma in different single cell transcriptomic sequencing datasets.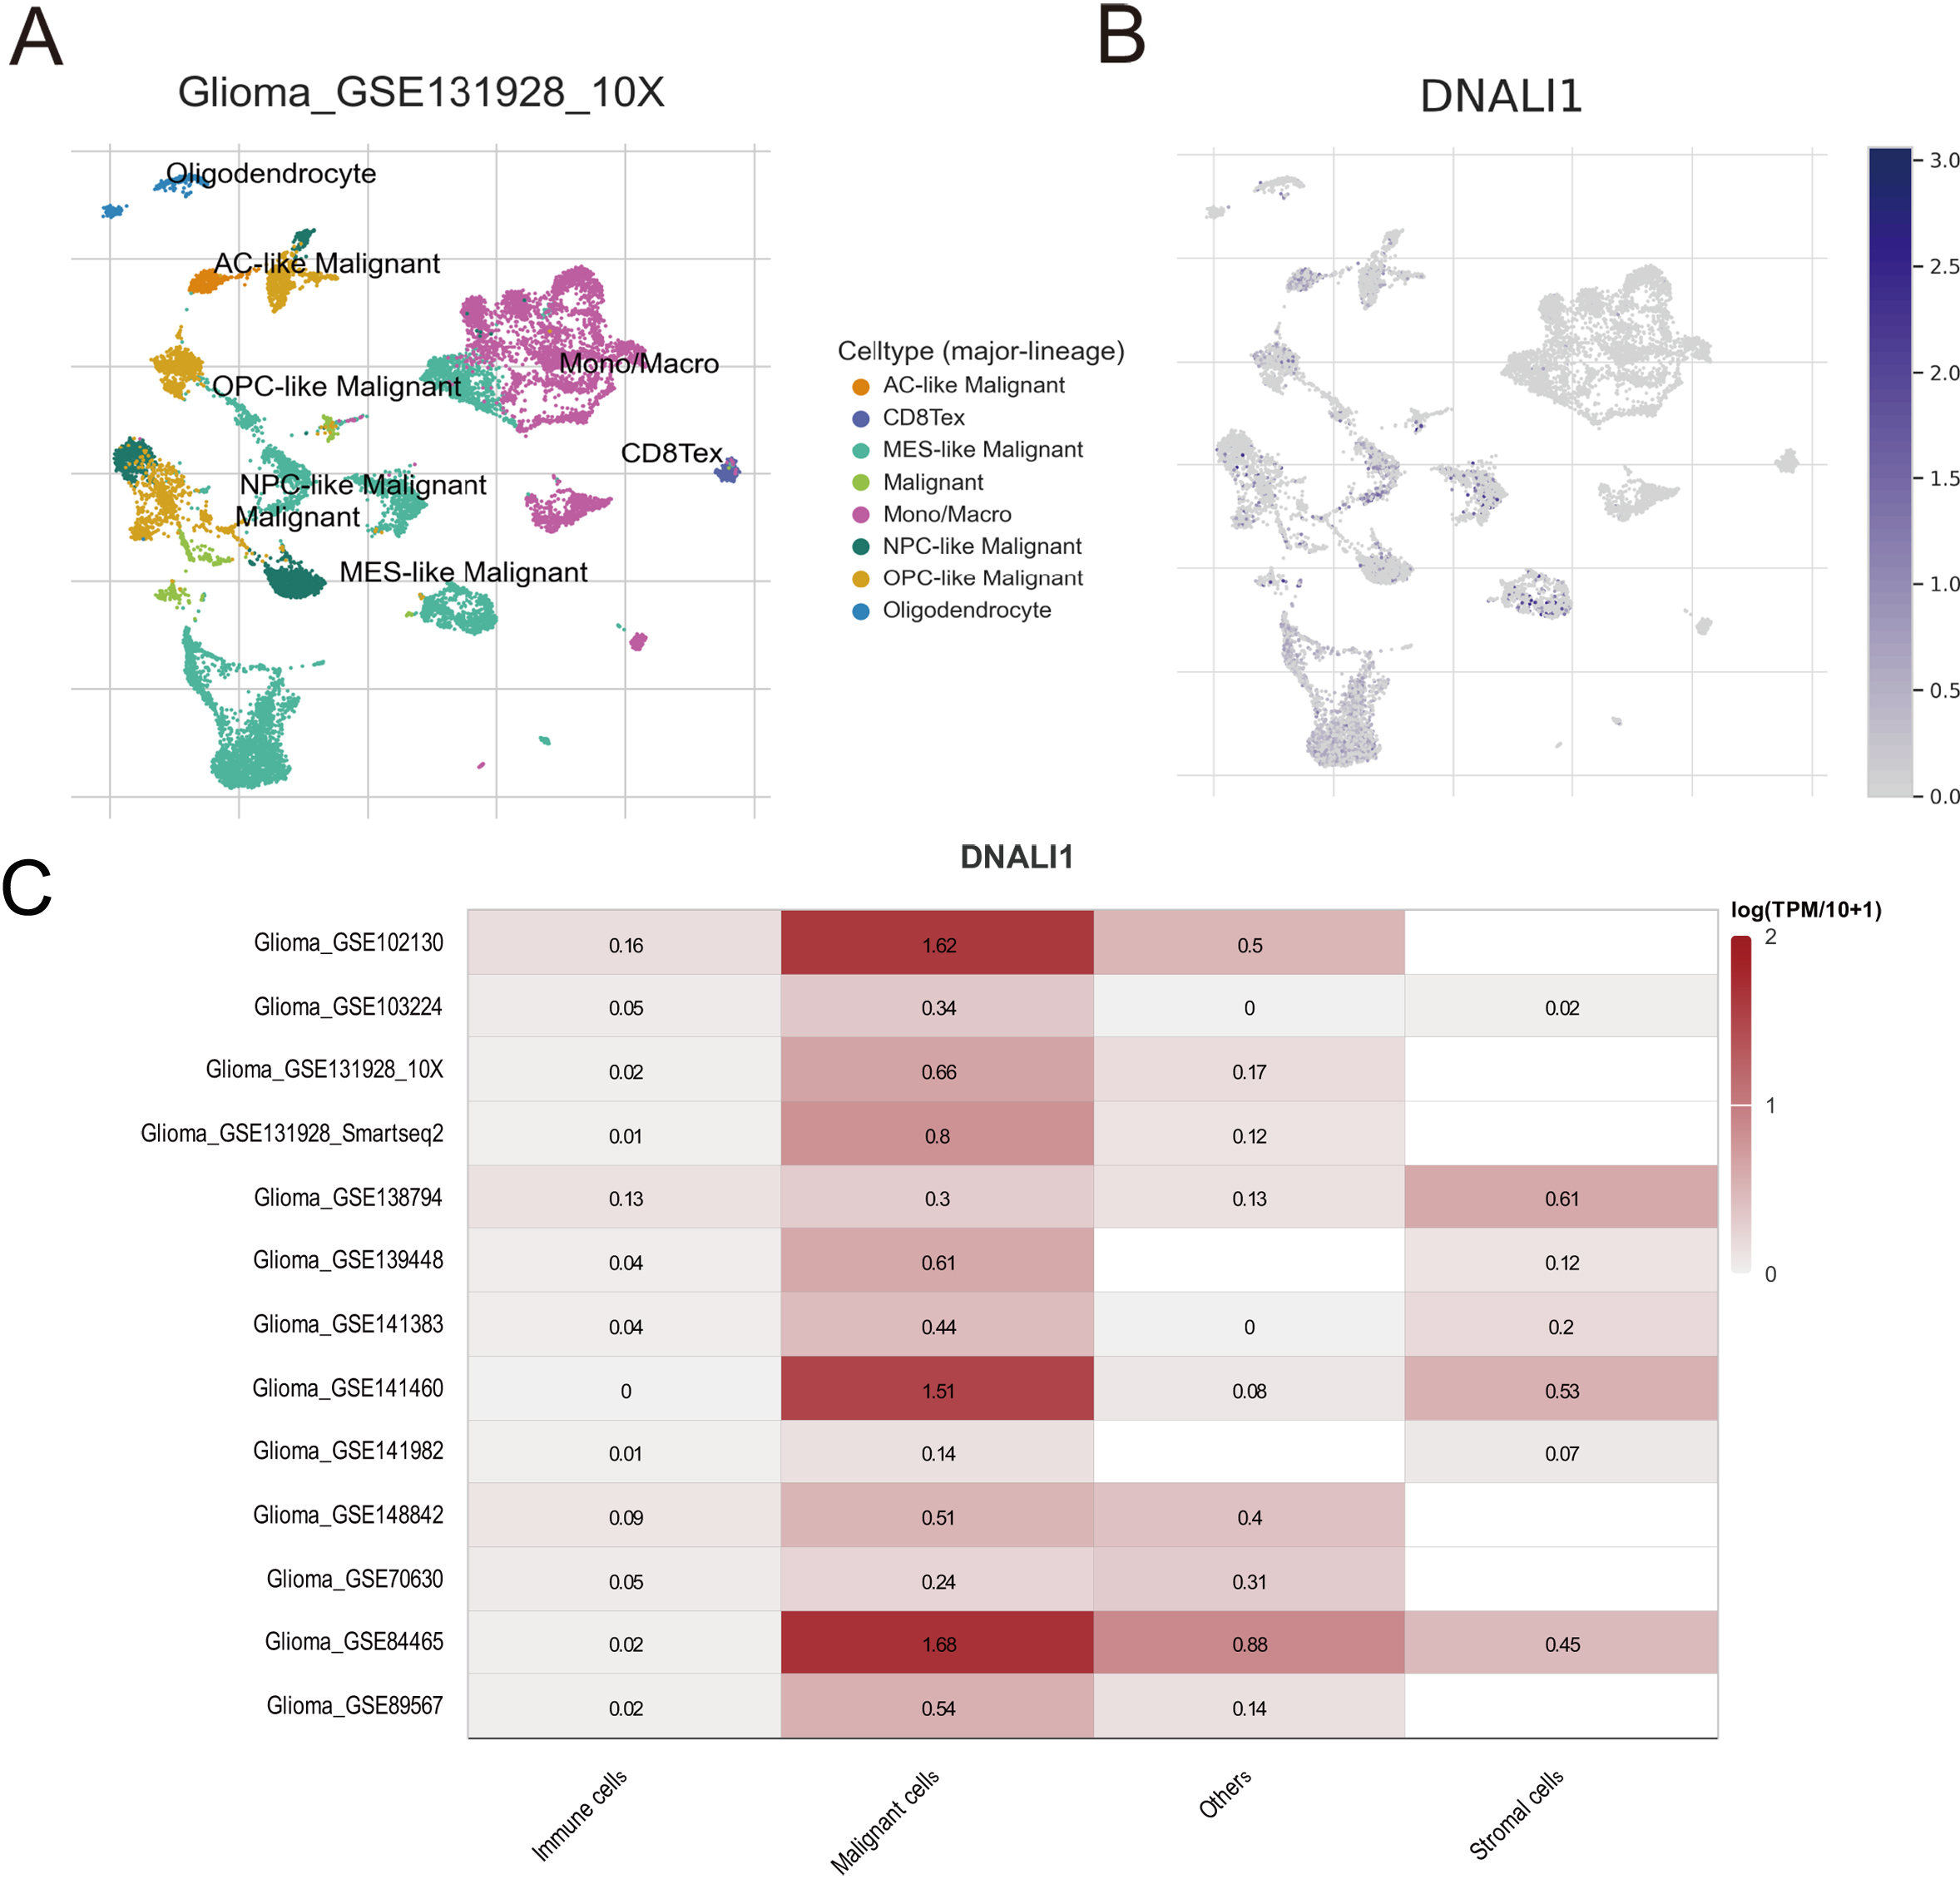
Based on the median value of DNALI1 expression, LGG patients in the TCGA database were divided into a high DNALI1 expression group and a low DNALI1 expression group. Figure 4A shows the relationship between risk score distribution, survival status and DNALI1 expression. Risk scores increased with the increasing expression of DNALI1, while patients had an increased risk of death and a decreased survival time. Then the Kaplan-Meier curves were plotted and the result revealed that elevated DNALI1 levels were associated with poor OS outcomes (median time
Effect of DNALI1 expression on the prognosis of LGG. (A) The DNALI1 expression, survival time and survival status of LGG patients in TCGA dataset. The top scatterplot represents the DNALI1 expression from low to high. Different colors represent different groups. The scatter plot distribution represents the DNALI1 expression of different samples correspond to the survival time and survival status. The buttom figure is the DNALI1 expression heatmap. (B) Kaplan-Meier survival analysis of DNALI1 expression on LGG from TCGA dataset, comparison among different groups was made by log-rank test. HR represents the hazard ratio of the low-expression sample relatives to the high-expression sample. (C) The ROC curve of the DNALI1. The higher values of AUC corresponding to higher predictive power. (D) and (E) Kaplan-Meier survival analysis of DNALI1 expression on the prognosis of all grade of glioma in the CGGA dataset mRNAseq-325 and mRNAseq-693.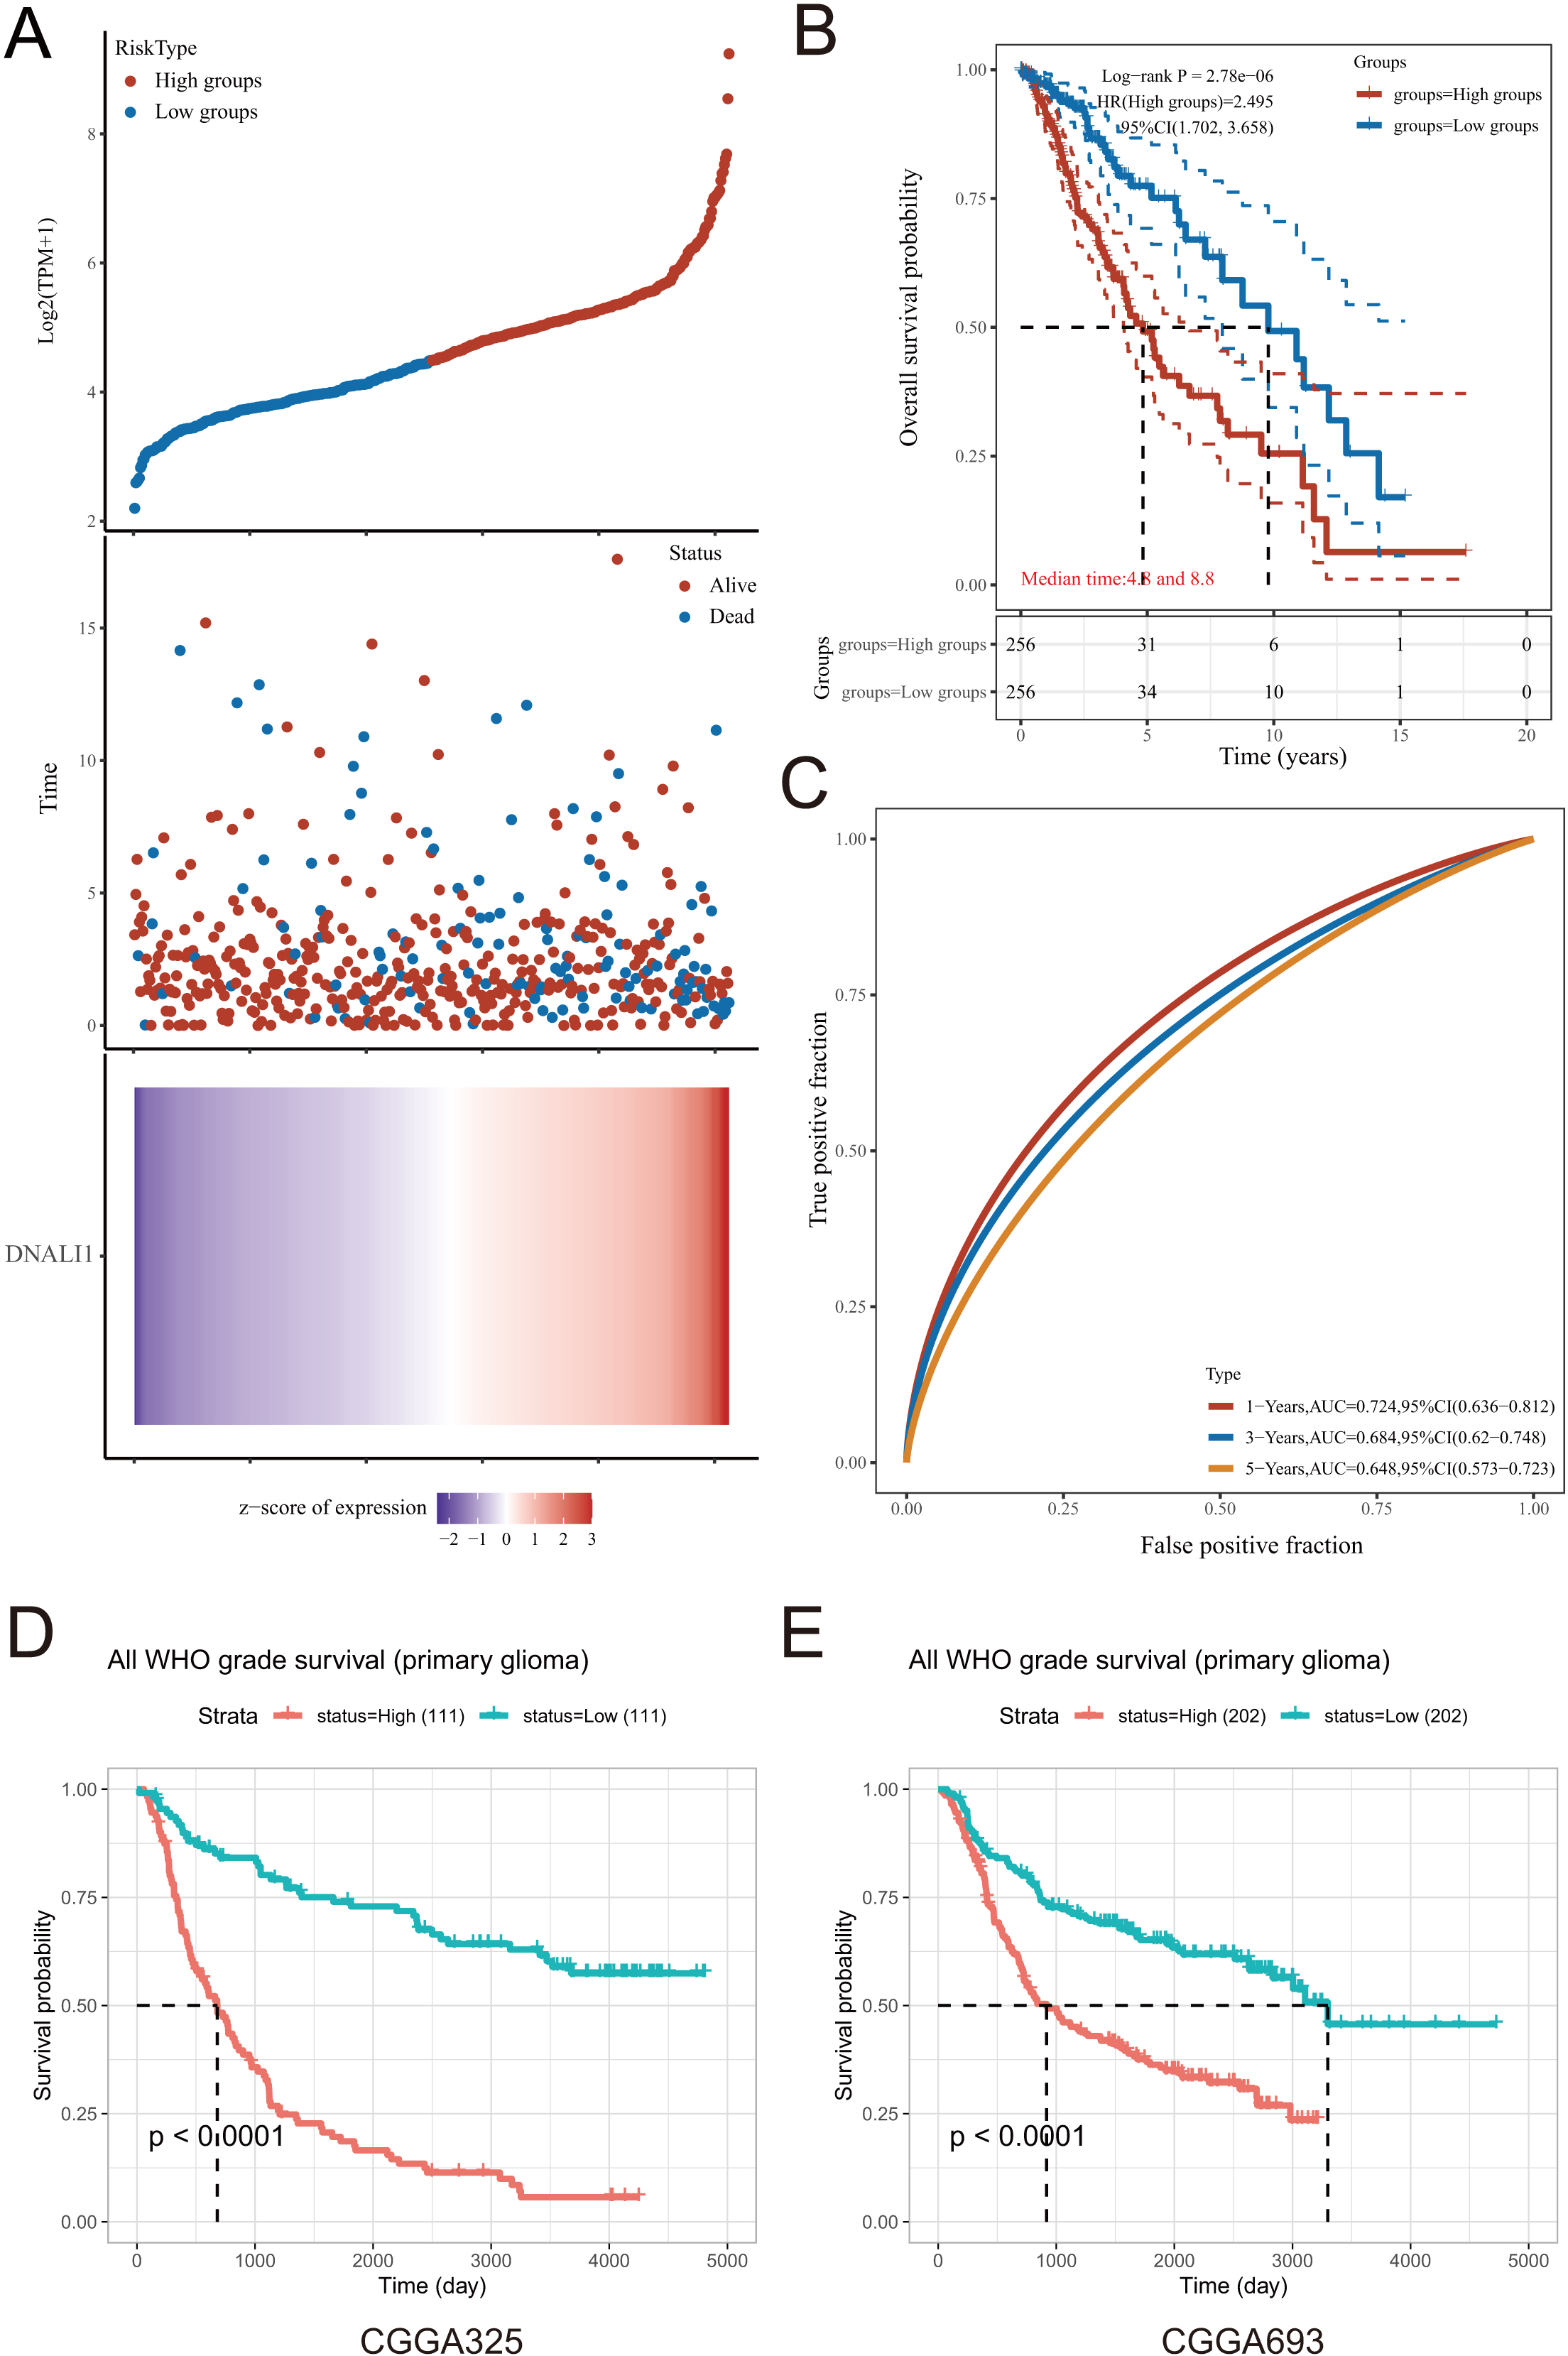
Relationship between DNALI1 expression and clinical features of LGG. (A) The expression of DNALI1 in the isocitrate dehydrogenase (IDH) wild-type group and in the IDH mutant group in the CGGA dataset mRNAseq-325. (B) The expression of DNALI1 in the 1p/19q co-deletion group and in the no co-deletion group in the CGGA dataset mRNAseq-325. (C) The expression of DNALI1 in the IDH wild-type group and in the IDH mutant group in the CGGA dataset mRNAseq-693. (D) The expression of DNALI1 in the 1p/19q co-deletion group and in the no co-deletion group in the CGGA dataset mRNAseq-693.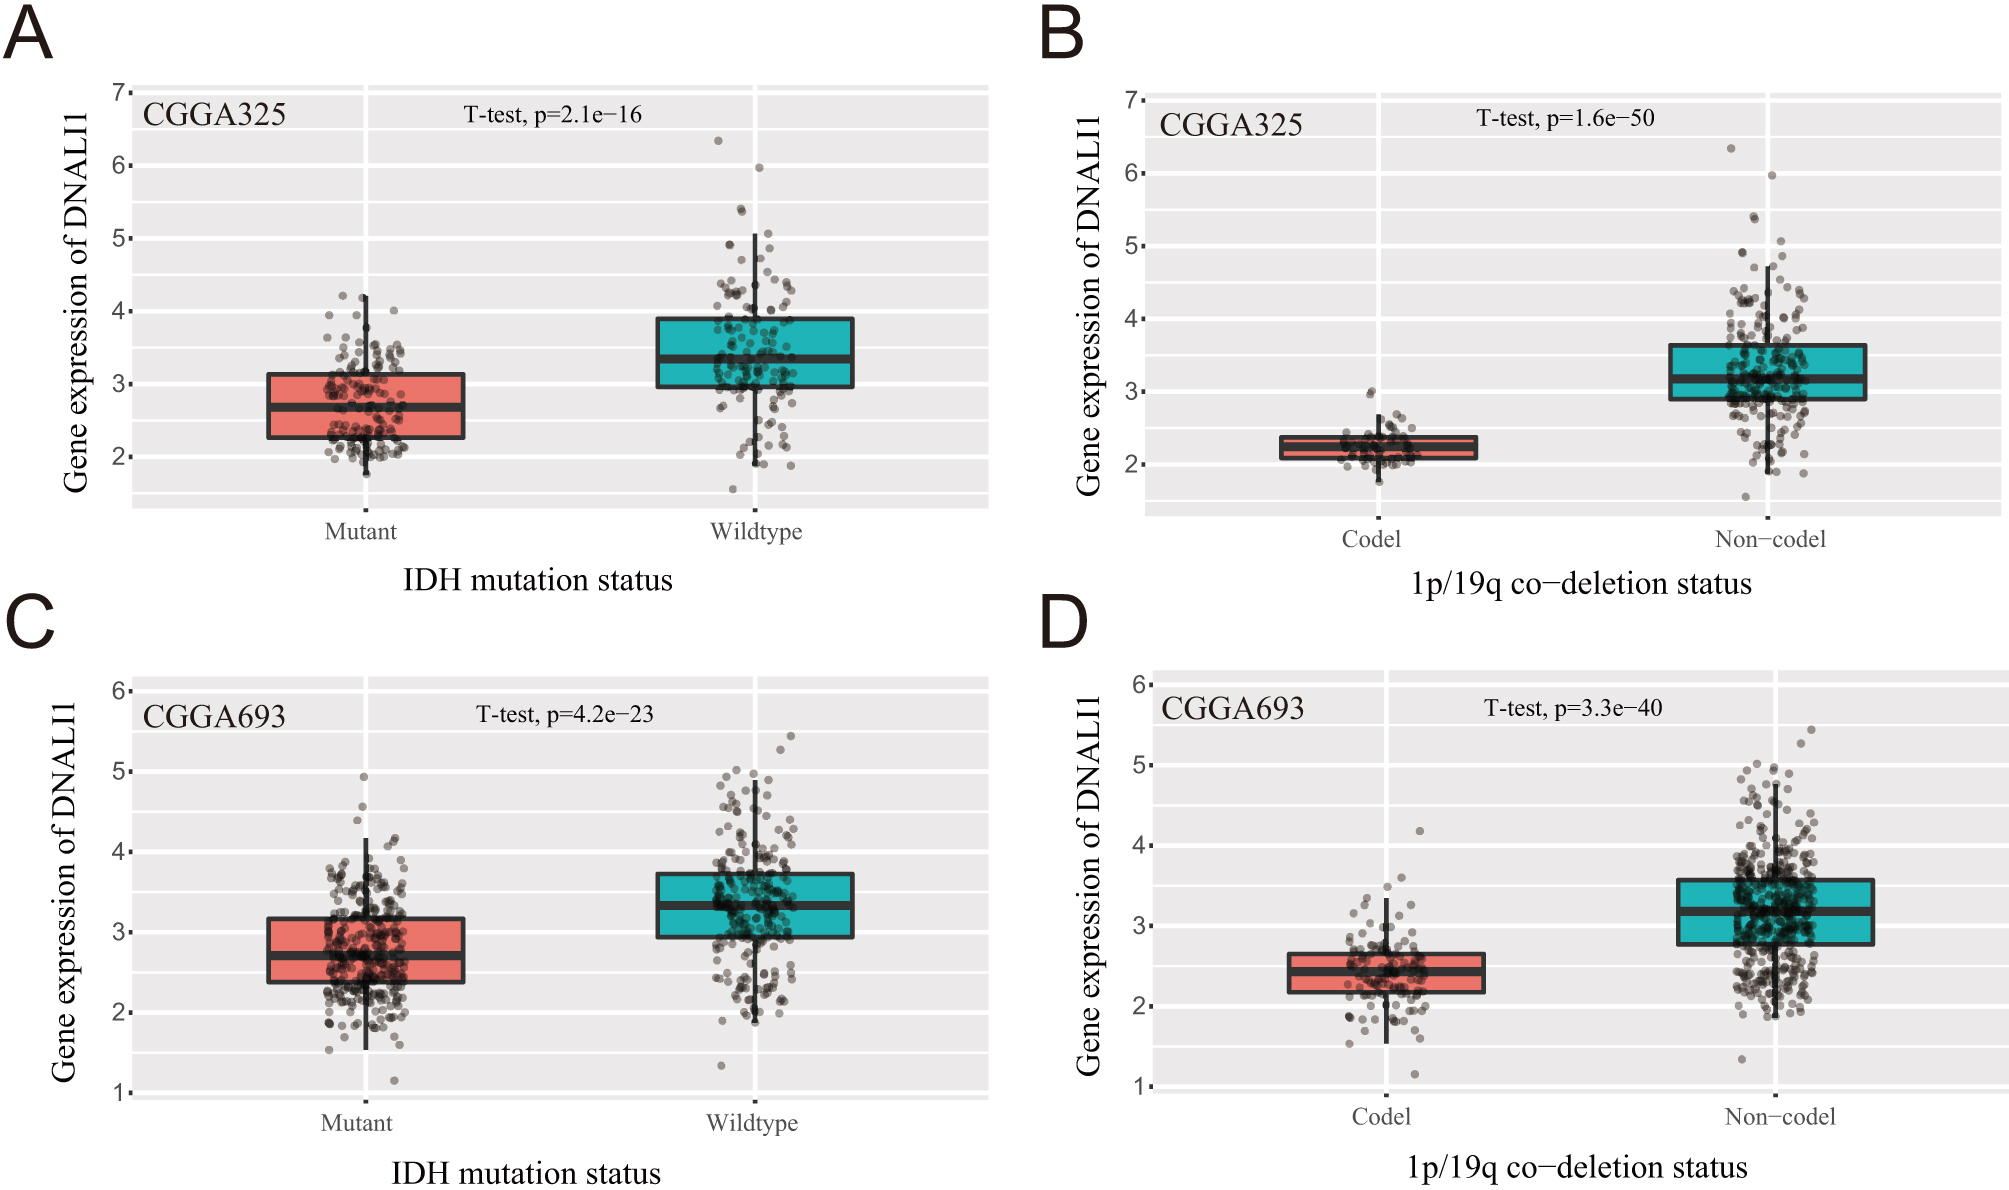
The CGGA database was used to analyze whether DNALI1 was differentially expressed in the tumor tissues of LGG patients with different clinical features. The results showed that DNALI1 expression in tumor tissue did not show significant differences in LGG patients of different ages and genders (data not shown). In the CGGA dataset mRNAseq-325 and mRNAseq-693, the expression of DNALI1 is significant higher in the IDH wild-type group than in the IDH mutant group (Fig. 5A and C). In addition, the expression of DNALI1 in the 1p/19q co-deletion group is significant lower than that of the no co-deletion group in both mRNAseq-325 and mRNAseq-693 (Fig. 5B and D).
Functional and pathway enrichment analyses of DEGs between high and low DNALI1 expression groups
Based on the median value of DNALI1 expression, LGG patients in the TCGA database were divided into a high DNALI1 expression group and a low DNALI1 expression group. Using the limma package in the R software to study the differentially expressed genes between high and low DNALI1 expression groups. Volcano plots were constructed based on fold change values and p-adjustment values. Red dots indicate up-regulated genes, blue dots indicate down-regulated genes, and grey dots indicate insignificant (Fig. 6A). The up-regulated genes and down-regulated genes were shown in the heatmap (Fig. 6B). The significantly changed genes including 391 up-regulated genes and 275 down-regulated genes associated with the expression of DNALI1 were selected for enrichment analysis. KEGG pathway analysis indicated an enrichment and crosstalk of these genes in Th17 cell differentiation, systemic lupus erythematosus, staphylococcus aureus infection, phagosome, inflammatory bowel disease, cell adhesion molecules, as well as human T cell leukemia virus 1 infection (Fig. 6C). In addition, GO analysis revealed that DNALI1 expression was primarily associated with immune-related gene terms, including regulation of the proliferation, activation, adhesion, and migration of immune-related cells (Fig. 6D). These findings demonstrated that DNALI1 might be involved in immune-related pathways in the TME of LGG.
Functional and pathway enrichment analyses of DEGs between high and low DNALI1 expression groups. (A) The DEGs between high and low DNALI1 expression groups. The volcano plot was constructed using the fold change values and 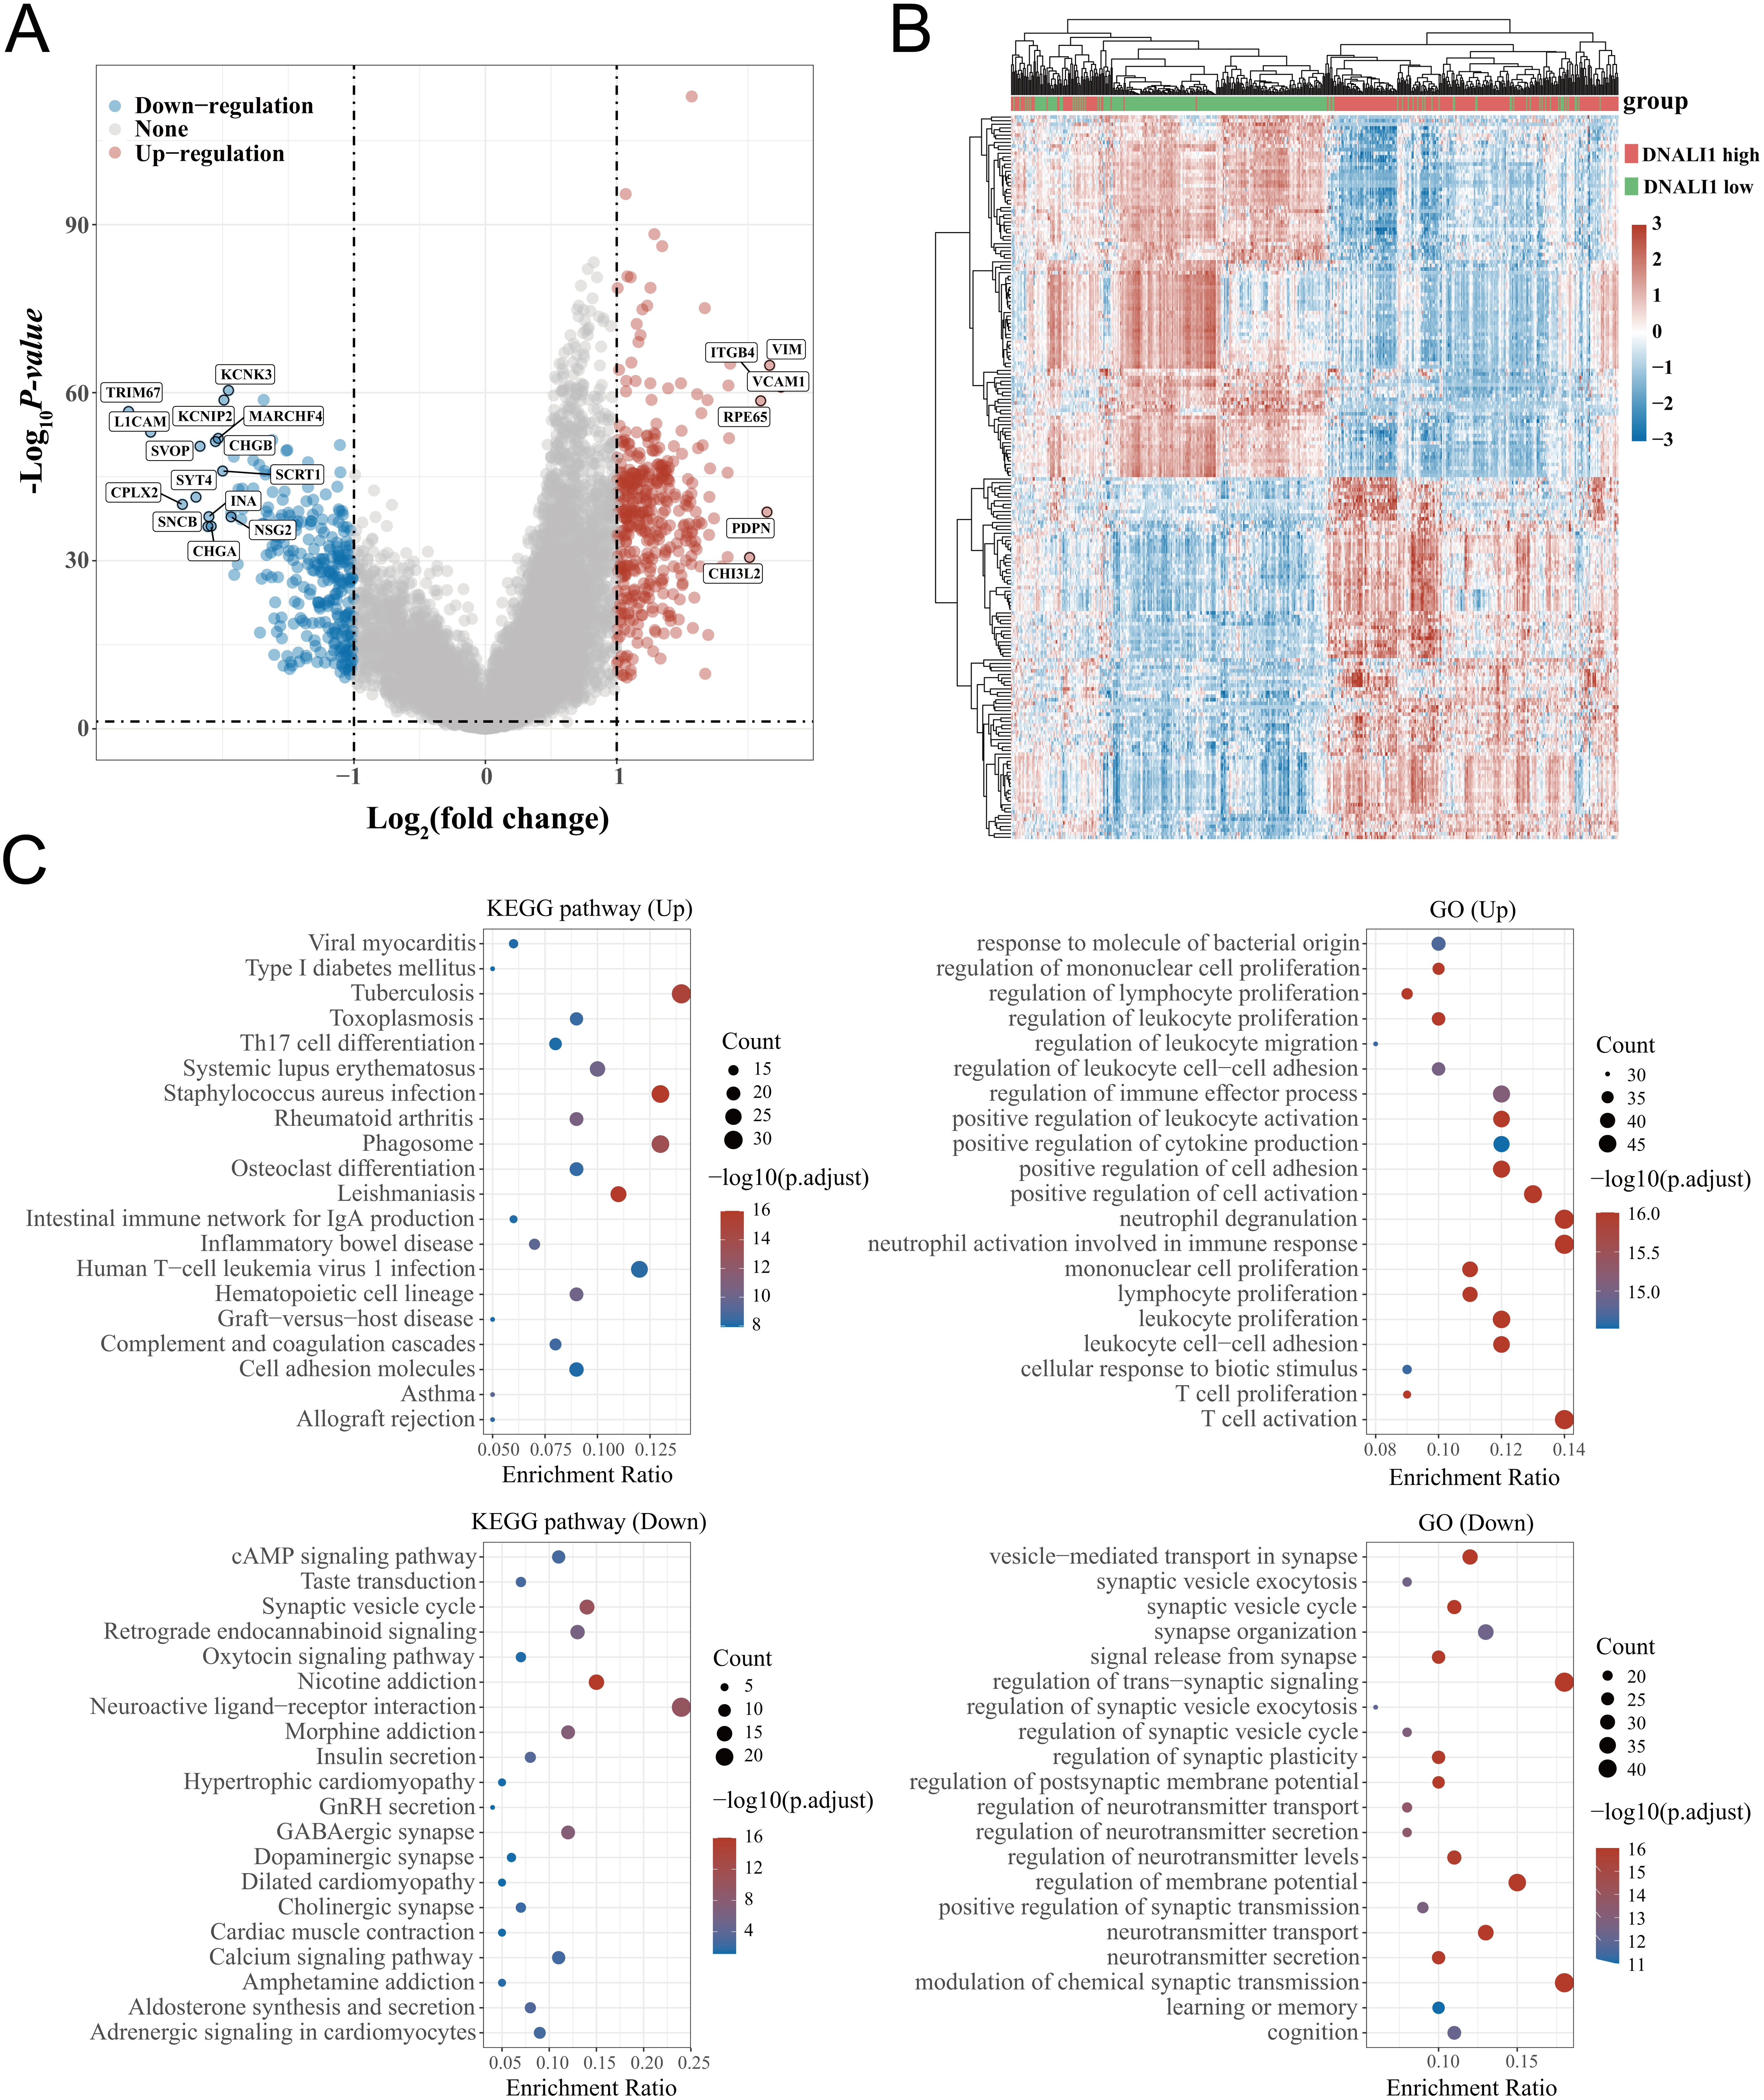
The biological function of DNALI1 in LGG was studied by GSEA enrichment analysis using GSVA package of R software. We collect the set of genes contained in the relevant pathways and calculate the enrichment score for each sample on each pathway in turn to obtain the association between the sample and the pathway, which can be obtained by calculating the correlation between DNALI1 expression and pathway score. The results showed that DNALI1 expression was positively correlated with TGFB, IL-10 anti-inflammatory signaling pathway, amino sugar and nucleotide sugar metabolism, pantothenate and CoA biosynthesis, inflammatory response, and tumor inflammation signature (top 6 most positively correlated pathways, Fig. 7A). DNALI1 expression was negatively correlated with taurine and hypotaurine metabolism, terpenoid backbone biosynthesis, glutamine and glutamate metabolism, fatty acid biosynthesis, oxidative phosphorylation, and arginine biosynthesis (top 6 most negatively correlated pathways, Fig. 7B).
GSEA enrichment analysis of DNALI1-related pathways in LGG. The 6 pathways most positively associated with DNALI1 expression in LGG. (B) The 6 pathways most negatively associated with DNALI1 expression in LGG. The correlations between DNALI1 and pathway score was analysed with Spearman. The abscissa represents the distribution of the gene expression, and the ordinate represents the distribution of the pathway score. The density curve on the right represents the trend in distribution of pathway immune score, the upper density curve represents the trend in distribution of the gene expression. The value on the top represents the correlation 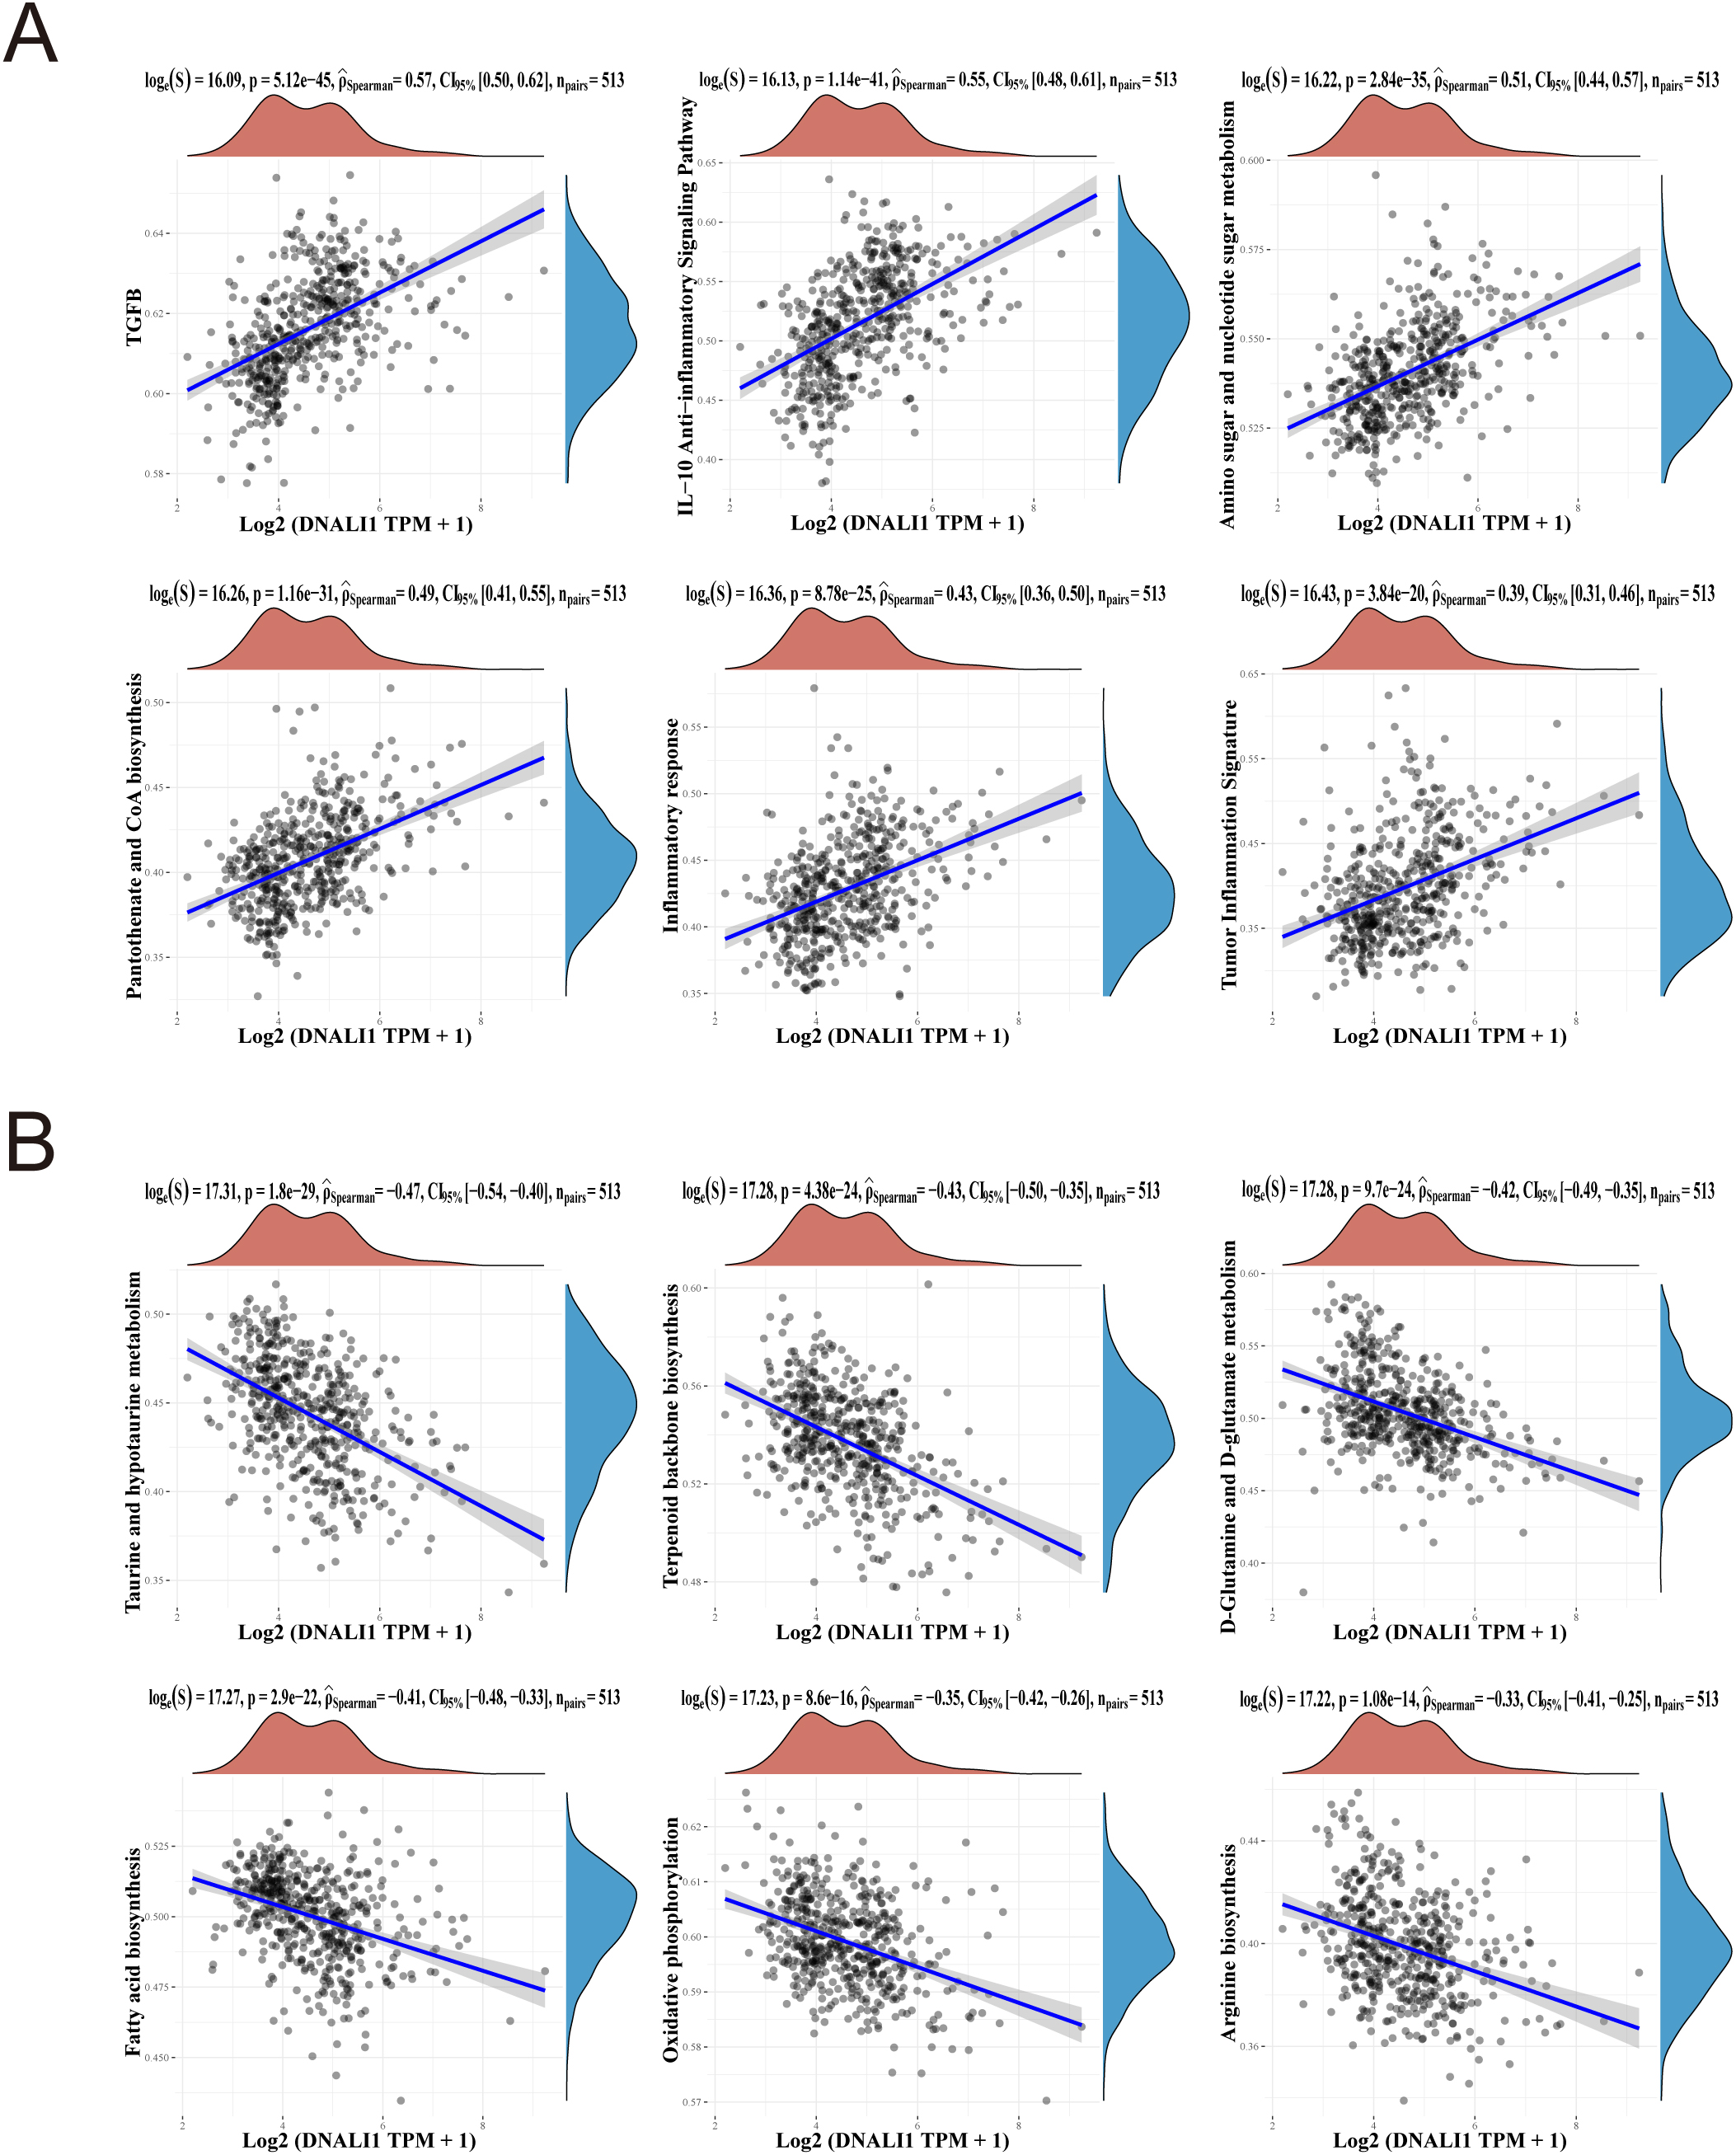
The TIMER immune infiltration algorithm was used to calculate the correlation between DNALI1 expression and immune infiltration of different immune cells in TME (Fig. 8A–B). The results showed that high DNALI1 level was positively correlated with the numbers of B cell (
Immune infiltration analysis between high and low DNALI1 expression groups in LGG. (A) Immune cell score heatmap, different colors represent different expression distribution in different groups. The statistical difference of high and low DNALI1 expression groups was compared through the Wilcox test, 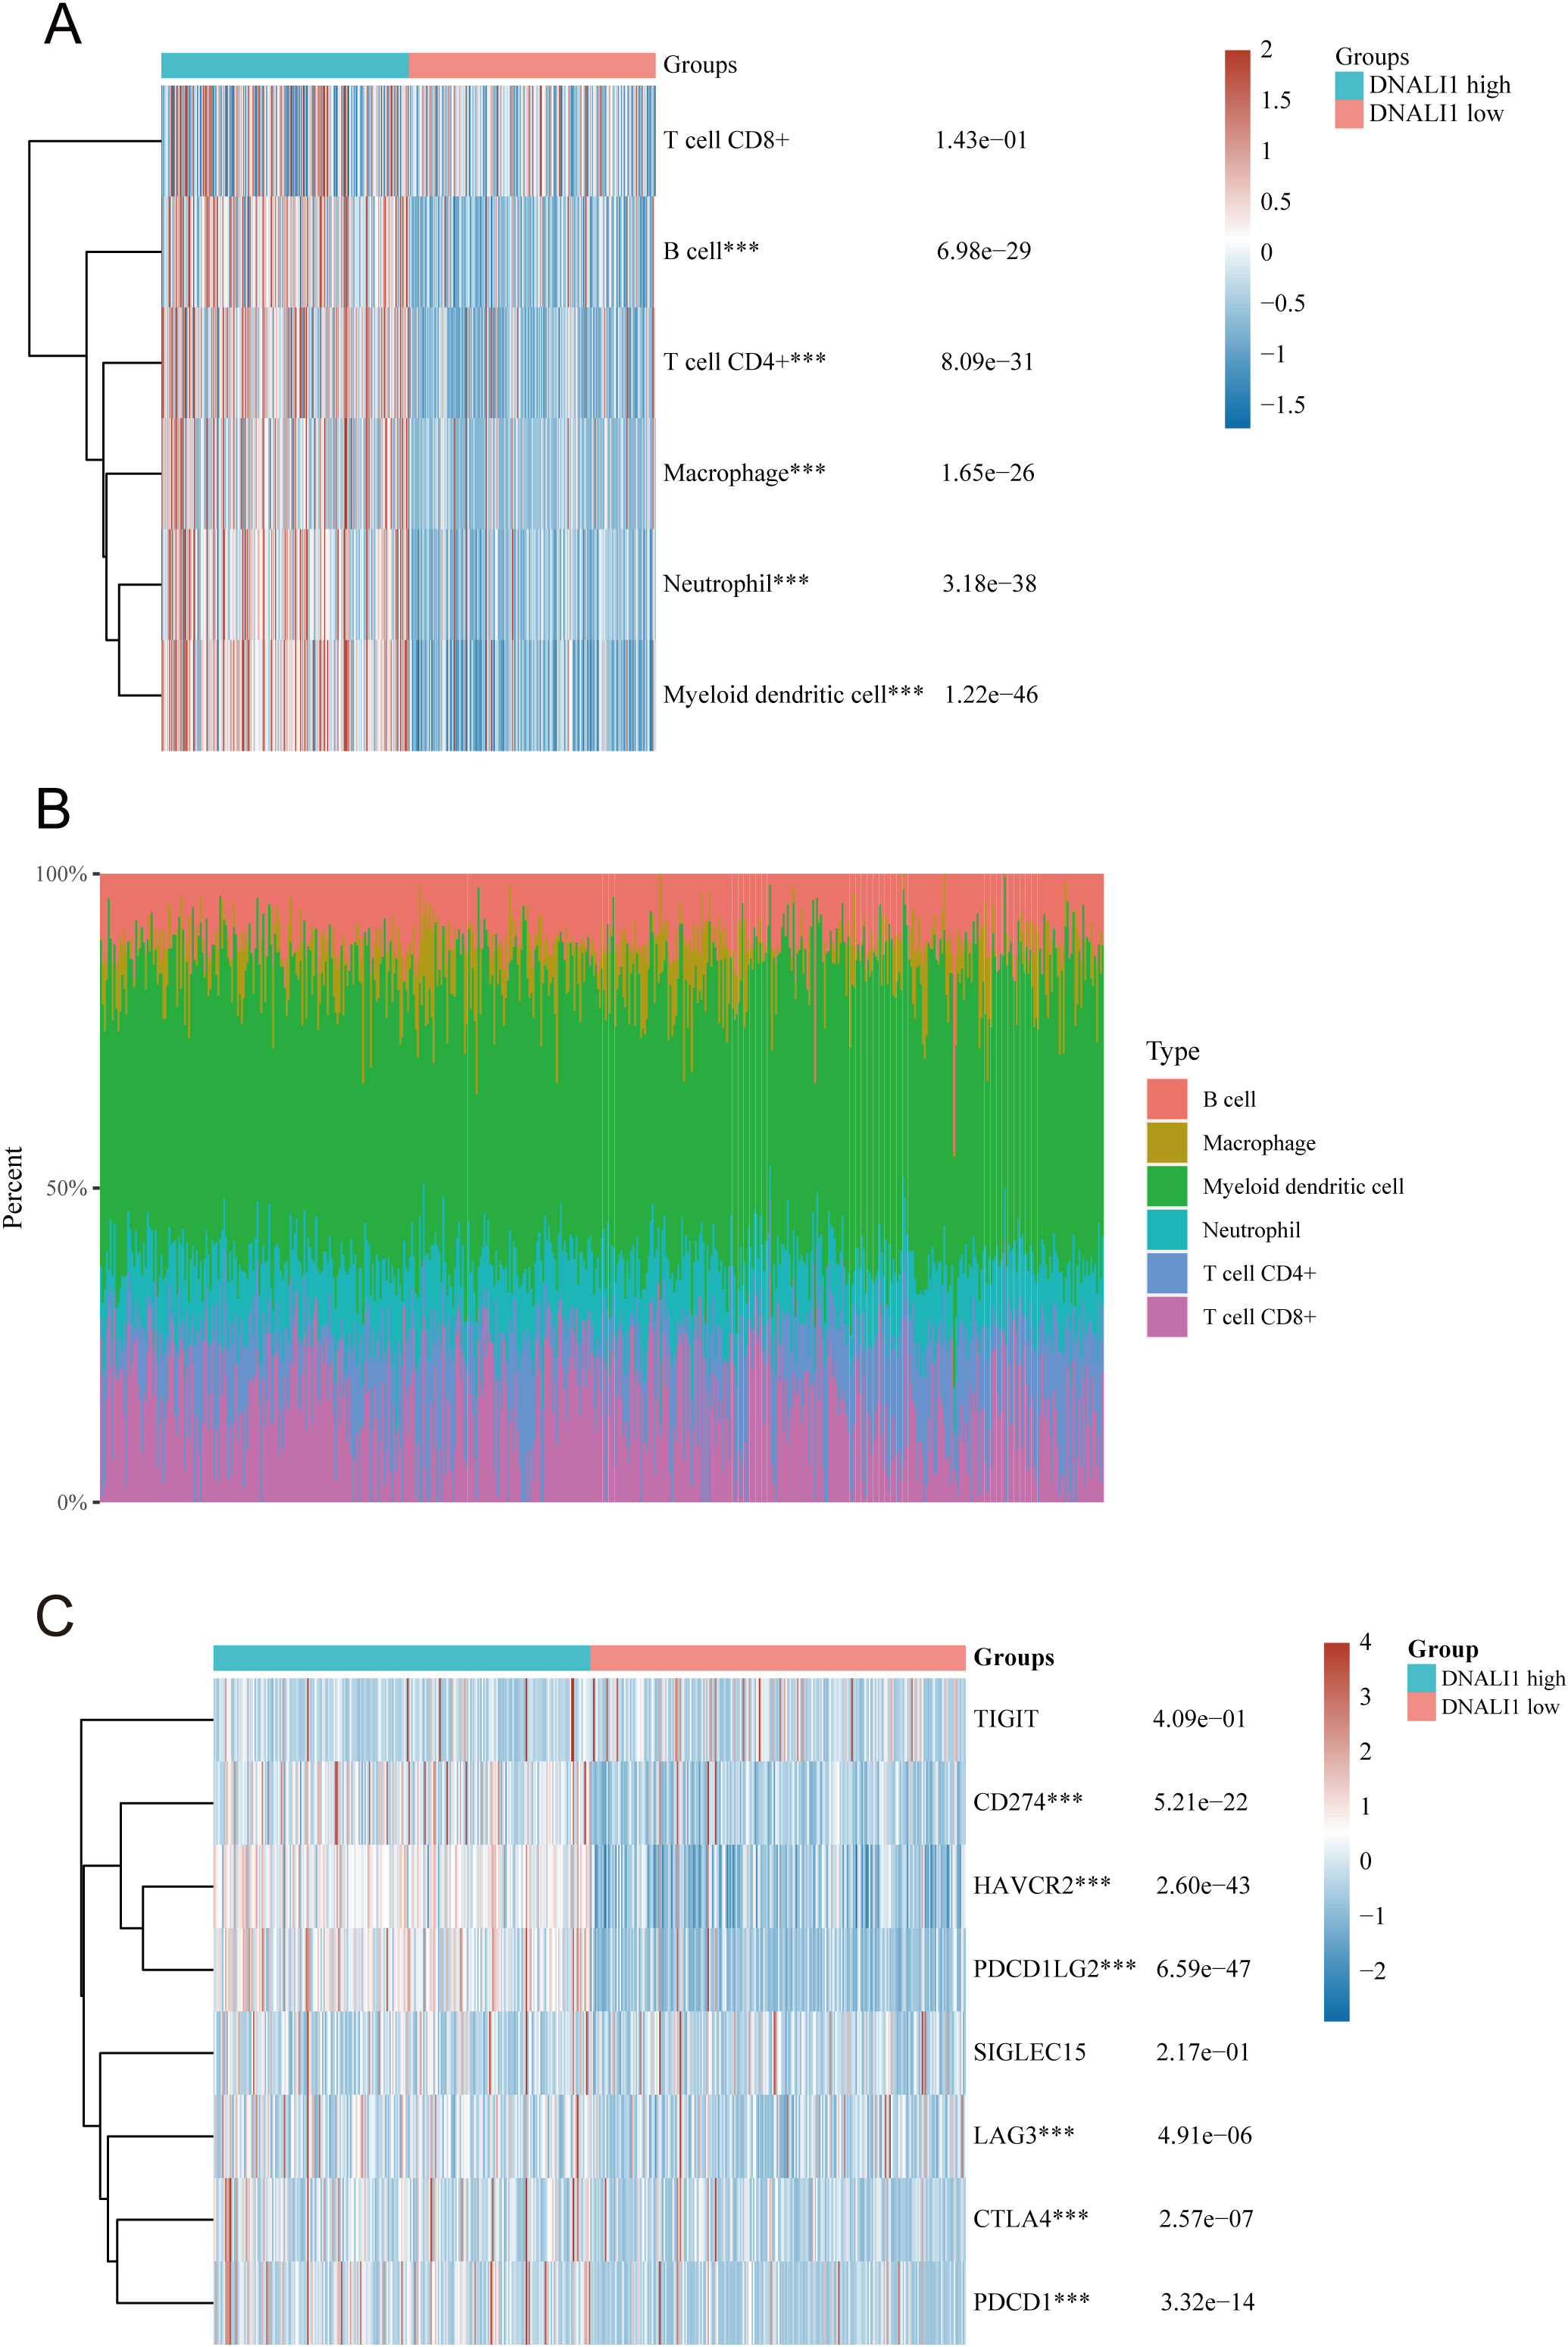
LGG is a primary malignancy of the central nervous system [18]. Although surgical resection combined with chemotherapy and radiotherapy can improve clinical outcomes, more than 50% of patients with LGG gliomas will still evolve into high-grade gliomas over time [19]. Therefore, there is an urgent clinical need to identify new biomarkers of LGG that can be used to guide clinical treatment [20]. The immune microenvironment has been proved to play a crucial role in the development of gliomas [21]. Immunotherapy, including immune checkpoint inhibitors, active or passive immunotherapy and gene therapy, has been used in the clinical management of glioma, confirming the effectiveness of immunotherapy [10]. Therefore, there is a need to identify new biomarkers of the immune microenvironment of LGG to promote immunotherapy for LGG and further improve the clinical outcome of LGG.
It has been reported that DNALI1 is an important part of axonemal dynein and plays a critical role in the growth and development of animals [13]. However, to date, the role of DNALI1 in cancer progression is unclear. In the present study, DNALI1 expression was found to be up-regulated in a variety of tumor tissues by pan-cancer analysis. Especially for LGG, DNALI1 may be a molecular marker reflecting the poor prognosis of patients. Further studies revealed that the mRNA and protein levels of DNALI1 were significantly up-regulated in LGG tumor tissues compared with normal tissues. In particular, DNALI1 was differentially expressed in different grades of glioma, and its expression gradually increased with the progression of glioma, suggesting that DNALI1 may have an important function in the progression of glioma. All the above results were obtained from the analysis of tumor tissue of LGG patients. Given that tumor tissues contain a variety of cell types, it is an important question whether the expression of DNALI1 is cell-specific or not. Therefore, multiple glioma-associated single-cell sequencing datasets were utilized to observe the cell specificity of DNALI1 expression. The results clearly revealed that DNALI1 is predominantly expressed in malignant tumor cells.
In recent years, significant progress has been made in the study of the molecular pathology of glioma, and a series of molecular markers have been identified that are closely related to the clinical features and prognosis of glioma. 1p/19q codeletion and IDH1 mutation can be used as important indicators to determine the sensitivity of chemotherapy and prognosis of glioma patients, and are important references for the development of individualized treatment plans [22, 23]. Interestingly, we found that the IDH wild-type glioma had higher expression of DNALI1 than IDH mutant-type. Furthermore, the expression of DNALI1 in patients with 1p/19q non-codeletion glioma was also significantly higher than that of those with 1p/19q codeletion. More importantly, high DNALI1 expression was closely associated with poor prognosis in LGG and had a high predictive value. Therefore, detection of DNALI1 expression could potentially be developed in the future as an alternative means of predicting the prognosis of LGG patients.
KEGG and GO analysis indicated that the expression of DNALI1 may influence LGG progression through multiple immune-related pathways, including regulation of the proliferation, activation, adhesion, and migration of immune-related cells. Recently, research on the immune microenvironment of LGG has received increasing concern. Elucidating the factors affecting the immune microenvironment of LGG will provide an important theoretical basis for revealing the underlying causes of malignant progression of LGG and improving strategies for immunotherapy of LGG [24]. It has been proved that the immune microenvironment of LGG is characterized by an immunosuppressive state and is involved in the evolution of LGG [25]. GSEA results showed that DNALI1 expression was highly positively correlated with TGFB and IL-10 anti-inflammatory signaling pathways. Among the many immunosuppression-related cytokines, IL-10 and TGF-
TIMER analysis was used to further investigate the effect of DNALI1 on immune infiltration in the TME of LGG. The results indicated that DNALI1 was highly associated with the infiltration of multiple immune cells, including B cell, T cell CD4
Cancer immunotherapy is an important approach to treating cancer by activating the patient’s own immune system to fight the tumor [32]. Currently, cancer immunotherapy has been widely used to treat various tumors with impressive clinical efficacy [33]. Biomarkers are urgently needed for cancer immunotherapy to accurately predict clinical response, and certainly for immunotherapy of LGG [10, 34]. Immune checkpoints and single-gene co-expression heat maps suggested that DNALI1 has a significant positive correlation with the expression of CD274, HAVCR2, PDCD1LG2, LAG3, CTLA4, and PDCD1. It is well-known that LGG patients with high expression of these immune checkpoints may respond better to immune checkpoint blockade [12, 35]. Therefore, the response of LGG patients with high DNALI1 expression to immune checkpoint blockade therapy is worthy of further in-depth study to determine whether DNALI1 could serve as a new marker for immunotherapy response in LGG.
In conclusion, our study shows that the expression of DNALI1 is up-regulated in tumor cells of LGG, which is associated with poor prognosis in LGG patients and is a potential prognostic marker for LGG. High expression of DNALI1 may play an important role in maintaining immunosuppressive microenvironment in LGG by promoting the expression of some immune checkpoints and the infiltration of immunosuppressive cells. Based on bioinformatics, this study revealed the possible role of DNALI1 in the progression of LGG, which could provide a new idea and research direction for subsequent studies.
Footnotes
Acknowledgments
This work was supported by National Natural Science Foundation of China (82271914).
Conflict of interest
The authors declare that there is no conflict of interests.
Author contributions
Conception: Yapeng Lu.
Interpretation or analysis of data: Yapeng Lu, Panpan chang, and Jiangpei Bian.
Preparation of the manuscript: Yapeng Lu.
Revision for important intellectual content: Yapeng Lu and Li Zhu.
Supervision: Li Zhu.