
Abstract
Objective:
This present study aims to investigate the potential prognostic values of dynactin genes (DCTN) for predicting the overall survival (OS) in low-grade glioma (LGG) patients.
Methods:
The DCTN mRNA expression data were downloaded from The Cancer Genome Atlas database containing 518 patients with LGG. The Gene Ontology and Kyoto Encyclopedia of Genes and Genomes analyses for DCTN genes were performed by using Database for Annotation, Visualization, and Integrated Discovery platform, and their enrichment results were verified by using the Biological Networks Gene Ontology tool. Next, the correlations between DCTN genes and LGG were identified by Pearson correlation coefficient analysis. The OS was estimated by Kaplan-Meier survival analysis. The cBio Cancer Genomics Portal was used to analyze the mutations of DCTN genes and their effects on the prognosis of LGG. The correlation between the abundance of immune infiltration and tumor purity of DCTN genes were predicted by The Tumor Immune Estimation Resource.
Results:
Our research showed that the mRNA expression of DCTN4 in tumor tissues was much higher (P < 0.01) than that in normal tissues. Meanwhile, there was a certain correlation between the DCTN genes. Survival analysis showed that the high expression of DCTN1, DCTN3, DCTN4, DCTN6, and their co-expression were significantly correlated with favorable OS in LGG patients (P < 0.05). In DCTN2, a high mutation rate was observed. Further research showed that the genetic alteration in DCTN genes was related to a poor OS and progression-free survival of LGG patients. The expression of DCTN genes had a certain correlation with immune infiltrating cells.
Conclusion:
Our study showed that the high expressions of DCTN1, DCTN3, DCTN4, and DCTN6 were associated with a favorable OS of LGG patients, indicating that these DCTN genes are potential biomarkers for evaluating the prognosis of LGG patients.
Introduction
Low-grade gliomas (LGGs) are classified into grade I or II according to the classification standard of the World Health Organization and account for approximately 20% of all gliomas in the central nervous system. 1 LGG is characterized by slow growth, but it often recurs and causes significant disability and mortality due to its aggressiveness and invasiveness. 2 -4 At present, the primary treatment for LGG is still surgery, supplemented by radiotherapy and chemotherapy. However, the average 10-year survival rate of LGG patients is only 30% if less than 90% of the tumor has been removed. 2 Therefore, the treatment of LGG remains a challenge, and it is of great significance to find effective prognostic biomarkers for the treatment of patients with LGG. In previous studies, some biomarkers including Ki-67, CXCL12, SEMA3G, MIF, CD31, KAZALD1, and STC1 were found to be associated with the development of LGG. 5 -12 Nevertheless, effective biomarkers for evaluating the prognosis of LGG have not been reported yet.
Dynactin (DCTN), a multi-subunit protein complex, is essential for the movement of cytoplasmic dynein. To date, the subunits of DCTN are known to include p150Glued (DCTN1), p50 (DCTN2), p24 (DCTN3), p62 (DCTN4), p25 (DCTN5), p27 (DCTN6), Arp11 (ACTR10), Arp1 (ACTR1A), β-actin, and CapZ α/β. 13 Most of the DCTN structures are involved in the interaction of a variety of cellular structures, particularly those involved in dynein movement. Previous studies confirmed that the DCTN family is associated with a variety of neurodegenerative diseases. 14 -16 More importantly, some studies also showed that the DCTN genes were associated with several cancers. These studies demonstrated that DCTN1 acted as a fusion partner in non-small cell lung cancer (NSCLC), 17 and DCTN2 was up-regulated in the osteosarcoma SJSA-1 cell line. 18 Another study showed that high expression of DCTN4 was significantly related to a favorable prognosis in colon adenocarcinoma (COAD) patients. 19 Moreover, it was reported that the mRNA expressions of down-regulated DCTN1, DCTN2, DCTN5, and the up-regulated DCTN6 were associated with a satisfactory prognosis for cutaneous melanoma. 20 However, there are limited reports on the relationship between the prognosis of LGG, as a neurological tumor, and DCTN genes.
Here, we extracted data from The Cancer Genome Atlas (TCGA; accessed on June 9, 2019 and revisited on May 20, 2020, data were not updated) and the University of California, San Francisco (UCSF; accessed on May 5, 2020) datasets to explore the prognostic values of DCTN genes in LGG and its possible mechanisms.
Materials and Methods
Data Source
The TCGA data about LGG survival were obtained from OncoLnc (http://www.oncolnc.org/; accessed on June 9, 2019 and revisited on May 20, 2020, data were not updated). 21 The data included the ID, age at diagnosis, survival time, living state, and the mRNA expressions of DCTN genes of 518 patients with LGG. In brief, 6 DCTN sub-members (DCTN1, DCTN2, DCTN3, DCTN4, DCTN5, and DCTN6) were first imported into the database. Then, the patients were divided into a percentile of 50:50 based on the expression of each DCTN sub-member, thereby obtaining the survival data of LGG patients.
Characteristics of Gene Expressions
The boxplots that show DCTN sub-members’ expressions in multiple tissues were produced by the Gene Expression Profiling Interactive Analysis (GEPIA: http://gepia.cancer-pku.cn/; accessed on June 9, 2019 and revisited on May 20, 2020, data were not updated) dataset. 22 The obtained TCGA data were used to count the unit of mRNA expression.
Functional Analysis and Co-Expression of DCTN Genes
The Gene Ontology (GO) and Kyoto Encyclopedia of Genes and Genomes (KEGG) pathway enrichment analyses were performed using the Database for Annotation, Visualization, and Integrated Discovery (DAVID: https://david.ncifcrf.gov/tools.jsp, accessed on June 9, 2019 and revisited on May 20, 2020, data were not updated) and the GEPIA datasets. 23 -25 Additionally, Biological Networks Gene Ontology (BiNGO) was used to predict the functionality of the DCTN genes. 26 GO analysis included molecular function (MF), biological process (BP), and cellular component (CC).
The interactions between DCTN family members were analyzed by GeneMANIA (http://genemania.org/; accessed on June 10, 2019 and revisited on May 20, 2020, data were not updated), a gene function prediction tool. 27 And the genetic interaction (GI) network was also established.
The Search Tool for the Retrieval of Interacting Genes/Proteins (STRING: v.11.0: https://string-db.org/, accessed on June 10, 2019 and revisited on May 20, 2020, data were not updated) database and Cytoscape (v.3.6.1) software were used to establish and perform the visualization of the protein-protein interaction (PPI) network, which evaluated the functional and physical relationships between DCTN proteins. 28 Pearson correlation coefficient analysis conducted by R (v.3.6.0) was performed to evaluate the co-expression relationship between DCTN genes.
Survival Analysis
The prognosis of LGG was estimated based on overall survival (OS). Kaplan-Meier estimator with a log-rank test was performed to obtain log-rank P values, thereby evaluating the OS for DCTN genes. All patients were assigned to a high-expression or low-expression group according to the 50th percentile cutoff value of each DCTN mRNA.
Joint-Effect Analysis
The survival analysis was performed to screen significant genes, followed by the stratification and joint-effect analyses of these genes to obtain the prognostic predictors for the DCTN family under different clinical conditions. When the mRNA expression levels of DCTN genes were high in a group, 1 point was obtained, and when the levels were low, 0 points were obtained. The patients were regrouped according to the total score, thus constructing the survival plots using the Kaplan-Meier estimator with a log-rank test.
Mutation Analysis of DCTN Genes in LGG
The cBio Cancer Genomics Portal (cBioPortal: http://cbioportal.org
Immune Infiltration Level Analysis of the DCTN Genes
The Tumor Immune Estimation Resource (TIMER: https://cistrome.shinyapps.io/timer/
Statistical Analysis
R (v.3.6.0) was used to plot the Pearson correlation plot and survival curves. For the analysis of DCTN gene expressions in normal tissue and LGG tissues, P < 0.01 was considered as statistically significant. For other statistical analyses, P < 0.05 was considered as statistically significant.
Results
The mRNA Expression Levels of DCTN Genes in Normal Brain and Cancer Tissues
In the present study, the mRNA expression levels of 6 DCTN genes including DCTN1, DCTN2, DCTN3, DCTN4, DCTN5, and DCTN6 were measured. As shown in Figure 1A to E, the expressions of DCTN1 and DCTN6 were high in normal brain tissues, while the DCTN5 expression was low.

The DCTN gene expressions in multiple normal tissues. The expressions of DCTN1 (A), DCTN2 (B), DCTN3 (C), DCTN4 (D), DCTN5 (E), and DCTN6 (F) in multiple normal tissues. DCTN, dynactin.
As shown in the GEPIA boxplots, there were differences in DCTN gene expressions in the normal and LGG tissues. Specifically, the expression of DCTN1 in tumor tissues was lower than that in normal tissues (Figure 2A); on the contrary, the expressions of the other 5 genes (DCTN2, DCTN3, DCTN4, DCTN5, and DCTN6) in tumor tissues were higher than those in normal tissues (P < 0.01; Figure 2B-F).

The GEPIA boxplot of DCTN gene expressions in normal and LGG tissues. Boxplot for DCTN1 (A), DCTN2 (B), DCTN3 (C), DCTN4 (D), DCTN5 (E), and DCTN6 (F) expressions. GEPIA, Gene Expression Profiling Interactive Analysis; LGG, low-grade glioma.
Functional and Pathway Enrichment Analyses of DCTN Genes
The BP, CC and MF, and KEGG pathways were analyzed using DAVID to identify the biological functions of DCTN genes (Figure 3). The results were consistent with that from BiNGO (Figure 4). As demonstrated by the above-mentioned analyses, the DCTN genes were mainly enriched in the following parts: antigen processing and presentation of exogenous peptide antigen via major histocompatibility complex (MHC) class II (GO: 0019886), endoplasmic reticulum (ER) to Golgi vesicle-mediated transport (GO: 0006888), dynactin complex (GO: 0005869), the centrosome (GO: 0005813), motor activity (GO: 0003774), and vasopressin-regulated water reabsorption (hsa04962).
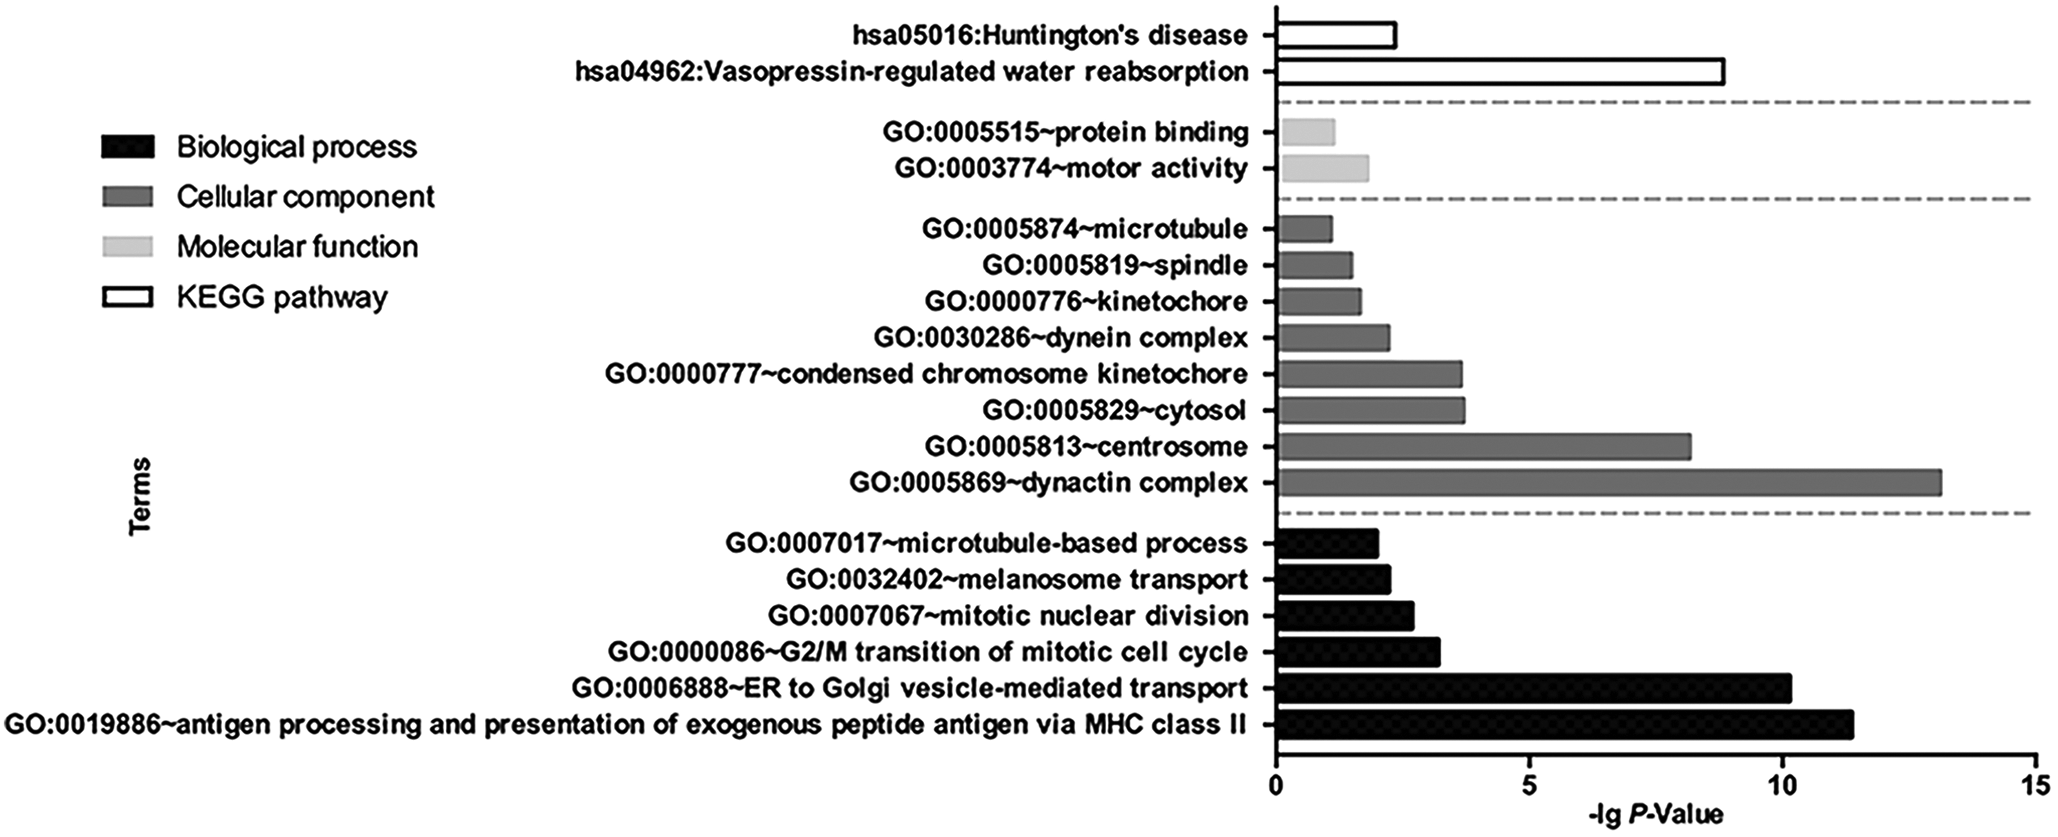
GO and KEGG analyses for DCTN genes by DAVID. GO, gene ontology; KEGG, Kyoto Encyclopedia of Genes and Genomes; DAVID, Database for Annotation, Visualization, and Integrated Discovery; ER, endoplasmic reticulum; MHC, major histocompatibility complex.

GO and KEGG analyses for DCTN genes by BiNGO. (A) CC, (B) BP, (C) MF for DCTN genes by BiNGO. The enriched GO terms were listed in a network according to the hierarchical relationship and colored according to the significance (P-value) of the enrichment. BiNGO, Biological networks gene ontology; BP, biological process; CC, cellular component; MF, molecular function.
The Correlation Between mRNA Expressions of DCTN Genes in Human Tissues
The correlation between mRNA expressions of DCTN genes was identified by using the Pearson correlation coefficient analysis, and its results showed that there were direct or indirect relationships between DCTN1, DCTN3, DCTN4, and DCTN6. Specifically, the DCTN3 expression was related to DCTN4, and they were both correlated with DCTN1, DCTN5, and DCTN6. Among them, DCTN4 and DCTN5 were moderately relevant (r = 0.495, P < 0.01). In addition, the DCTN5 expression was related to DCTN2 (P < 0.05; Figure 5A and Table 1).
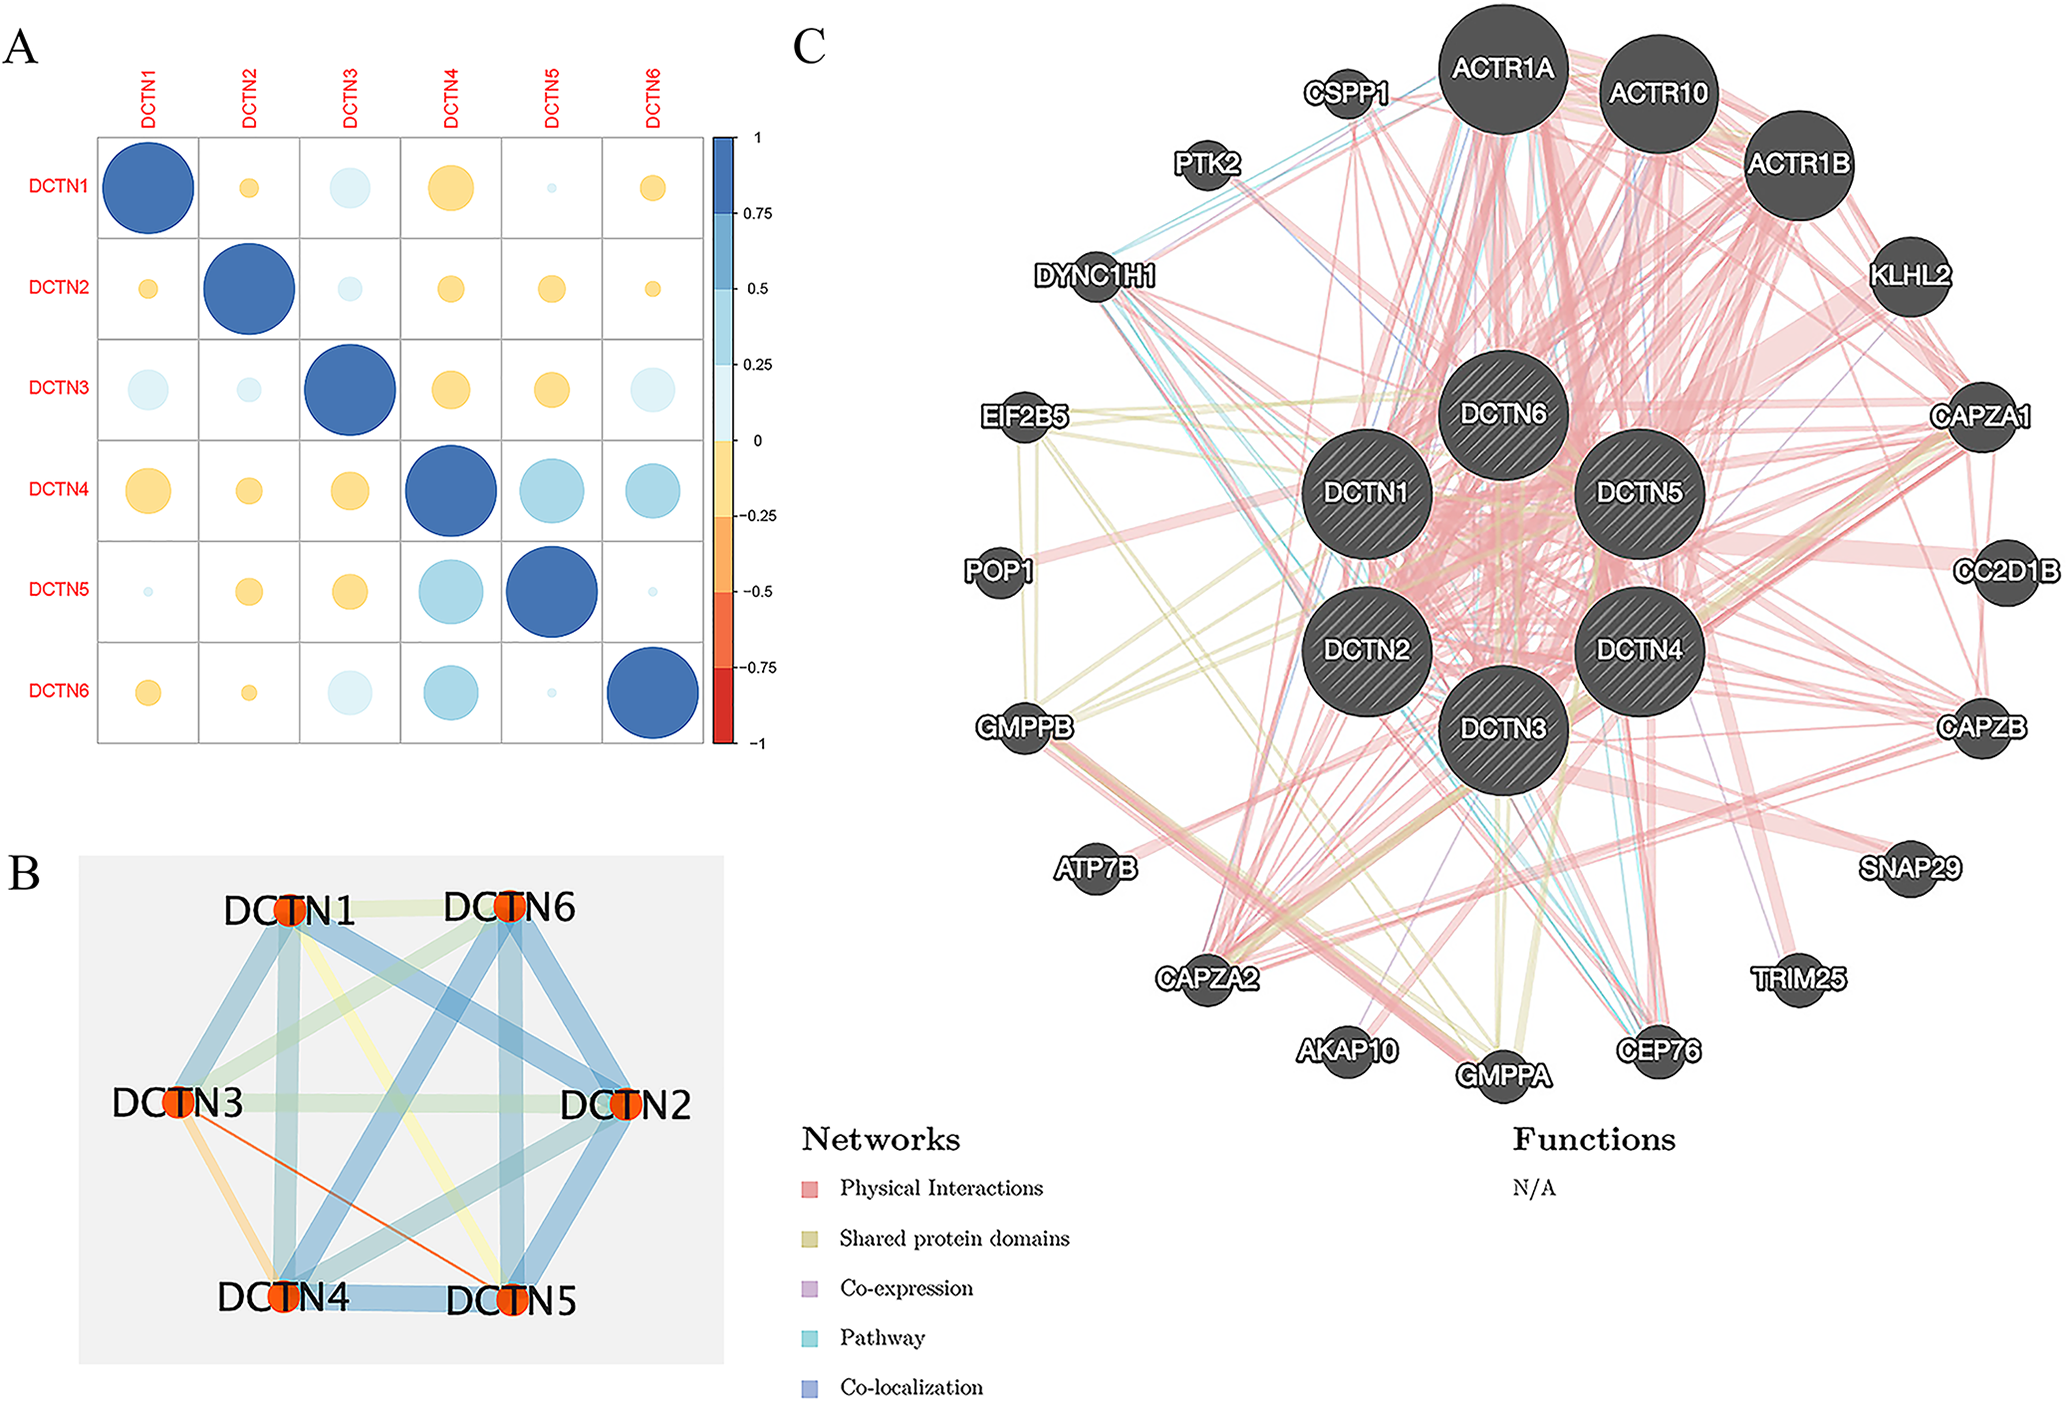
The relationships between DCTN genes. A, Pearson correlation coefficients for the co-expression of DCTN genes. B, The PPI network for physical and functional relationships between DCTN genes. The width of the lines between DCTNs represent the degree of interaction which was measured by the combined score. The stronger the interaction between 2 nodes, the thicker the line between them. C, The GI network for DCTN genes established by GeneMANIA. Each node represents a different protein. The size of the node represents the strength of the interaction between the protein and the DCTNs. Different colored lines indicate different ways of interaction between the nodes. PPI, protein-protein interaction. GI, genetic interaction.
Co-Expression of DCTN Genes at mRNA Level.a

Abbreviations: r, Pearson correlation coefficient; DCTN, dynactin.
aCorrelation of gene mRNA expression in the DCTN genes by using the Pearson correlation coefficient. Values in boldface indicate P < 0.05.
Co-Expression Analyses of DCTN Genes
The PPI network was also established by using the STRING database and Cytoscape software with a confidence score of more than 0.900. It showed strong functional and physical interactions between DCTN proteins (Figure 5B).
The GI network was established by using GeneMANIA and its results showed that there were strong physical interactions between DCTN genes (Figure 5C).
Survival Analysis
The prognostic values of DCTN genes were assessed by using R. As expected, high expressions of DCTN1, DCTN3, DCTN4, and DCTN6 were significantly (P < 0.05) related to the favorable OS of LGG patients (Figure 6A, C, D, and F). However, the remaining 2 DCTN genes (DCTN2 and DCTN5) were not significantly (P > 0.05) related to the OS of LGG patients (Figure 6B and E).

The prognostic values of DCTN genes and the joint-effect analysis. Kaplan-Meier curves for DCTN1 (A), DCTN2 (B), DCTN3 (C), DCTN4 (D), DCTN5 (E), and DCTN6 (F) of LGG patients. (G) The outcomes of joint-effect analysis. The OS was stratified by the expressions of 4 DCTN genes. Group 1 (0 points, n = 43), Group 2 (1 point, n = 126), Group 3 (2 points, n = 177), Group 4 (3 points, n = 116) and Group 5 (4 points, n = 48). Data were analyzed by R.
Joint-Effect Analysis
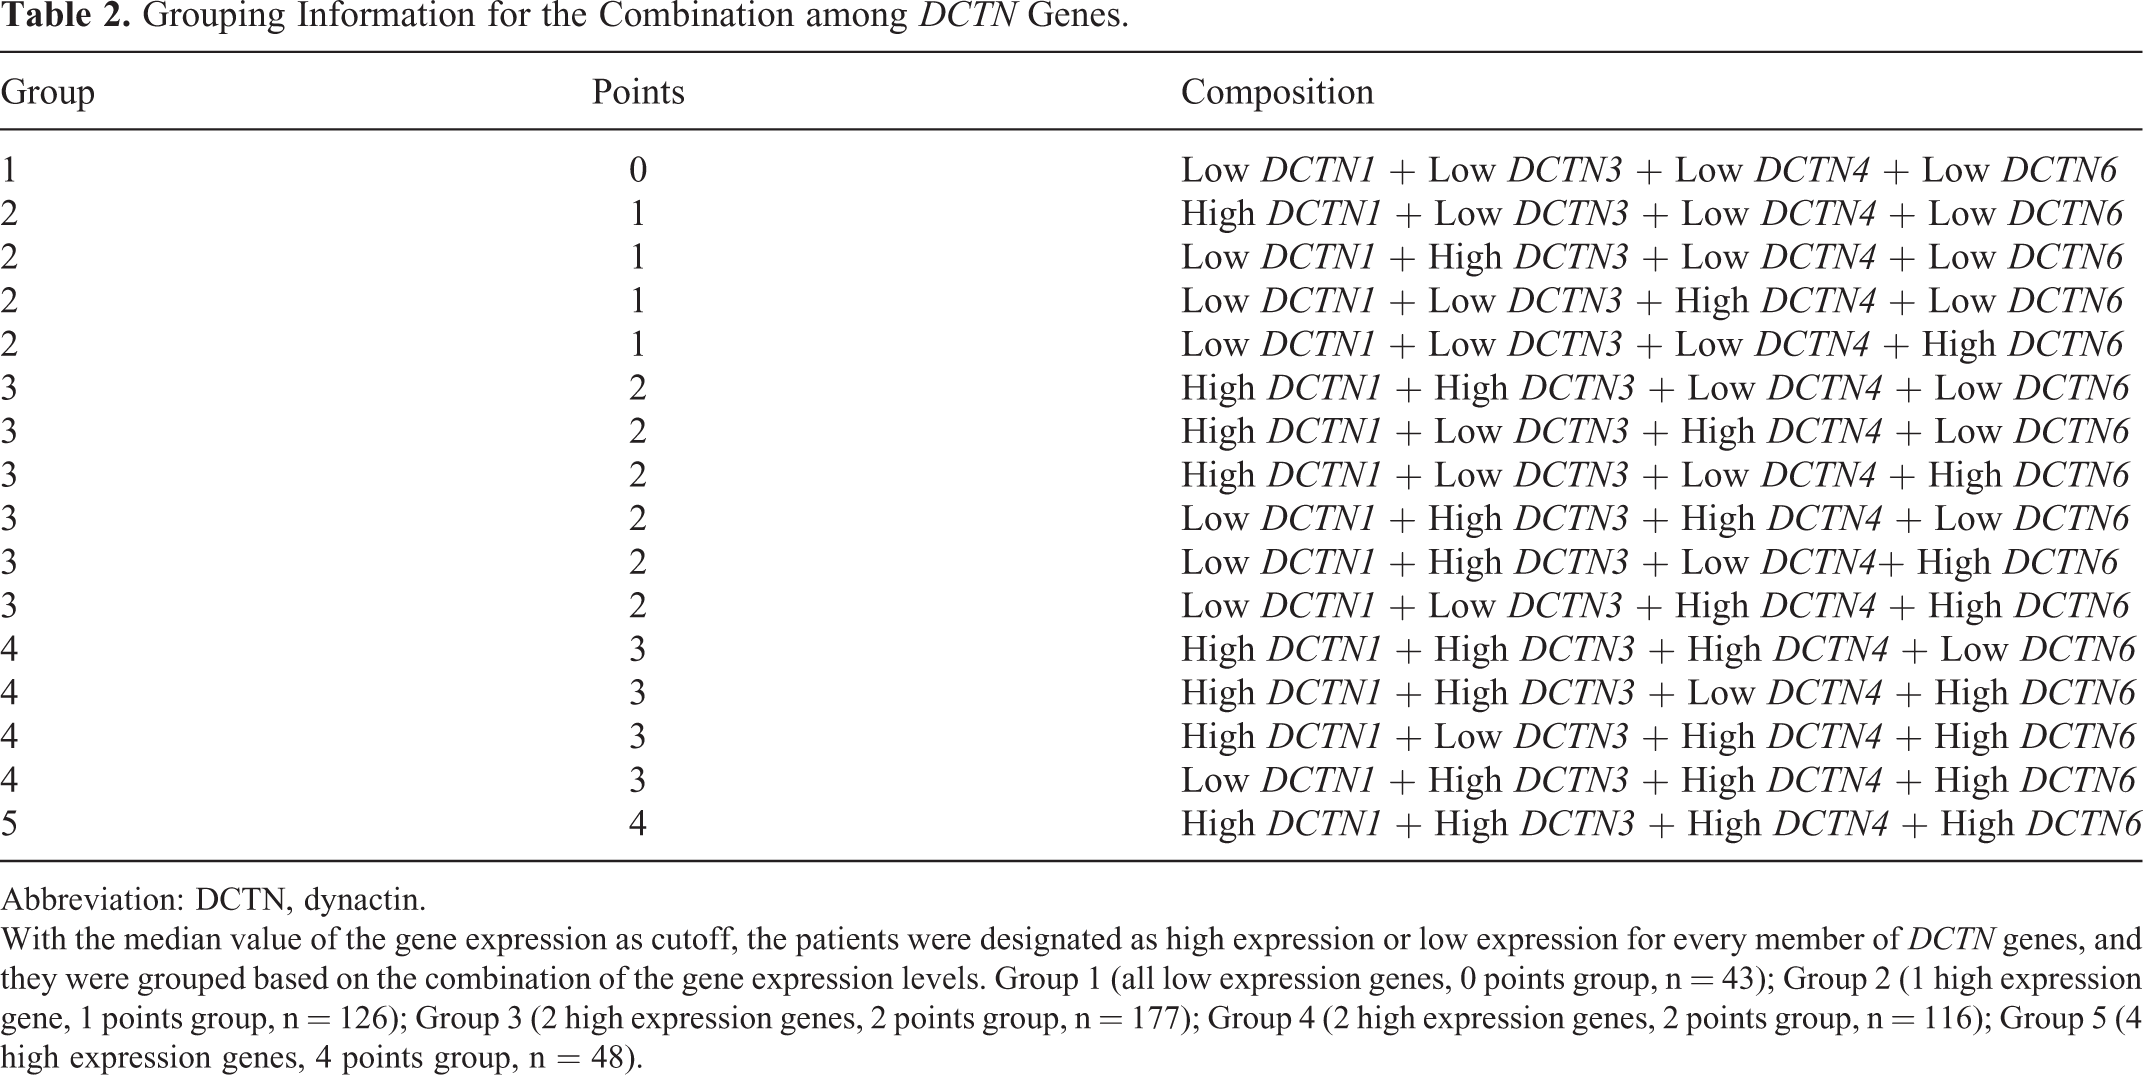
According to the results from survival analysis, 4 significant DCTN genes including DCTN1, DCTN3, DCTN4, and DCTN6 were screened. Based on the mRNA expressions of these 4 DCTN genes, LGG patients were reclassified into 5 groups (Table 2). Subsequently, the prognostic values of these 5 groups were assessed by using the Kaplan-Meier survival analysis with a log-rank test.
Grouping Information for the Combination among DCTN Genes.
Abbreviation: DCTN, dynactin.
With the median value of the gene expression as cutoff, the patients were designated as high expression or low expression for every member of DCTN genes, and they were grouped based on the combination of the gene expression levels. Group 1 (all low expression genes, 0 points group, n = 43); Group 2 (1 high expression gene, 1 points group, n = 126); Group 3 (2 high expression genes, 2 points group, n = 177); Group 4 (2 high expression genes, 2 points group, n = 116); Group 5 (4 high expression genes, 4 points group, n = 48).
Finally, the combined effects of co-expression of DCTN genes on the OS of LGG patients were determined by using the joint-effect analysis. The results indicated that the co-overexpression of DCTN1, DCTN3, DCTN4, and DCTN6 in Group 5 was more highly related to the favorable OS than that in other groups (P < 0.0001); on the contrary, the low expression of DCTN in Group 1 was more highly related to the poor OS than that in other groups (P < 0.0001; Figure 6G).
Mutation Analysis of DCTN Genes
The mutation frequency and mutation type of the DCTN genes are shown in Figure 7A. The results showed that DCTN2 had a higher mutation rate (3%). The remaining genes (DCTN1, DCTN3, DCTN4, DCTN5, and DCTN6) had lower mutation rates (0.4%, 0.1%, 0.6%, 0.4%, and 0.4%, respectively). The mutant forms of DCTN1 and DCTN3 were both missense mutations. Amplification accounted for most of the mutations in the DCTN2. DCTN4 took deep deletion and amplification as the main mutation forms. The gene mutation of DCTN5 included 2 forms of missense mutation and amplification, while the mutation of DCTN6 had only one form of amplification.
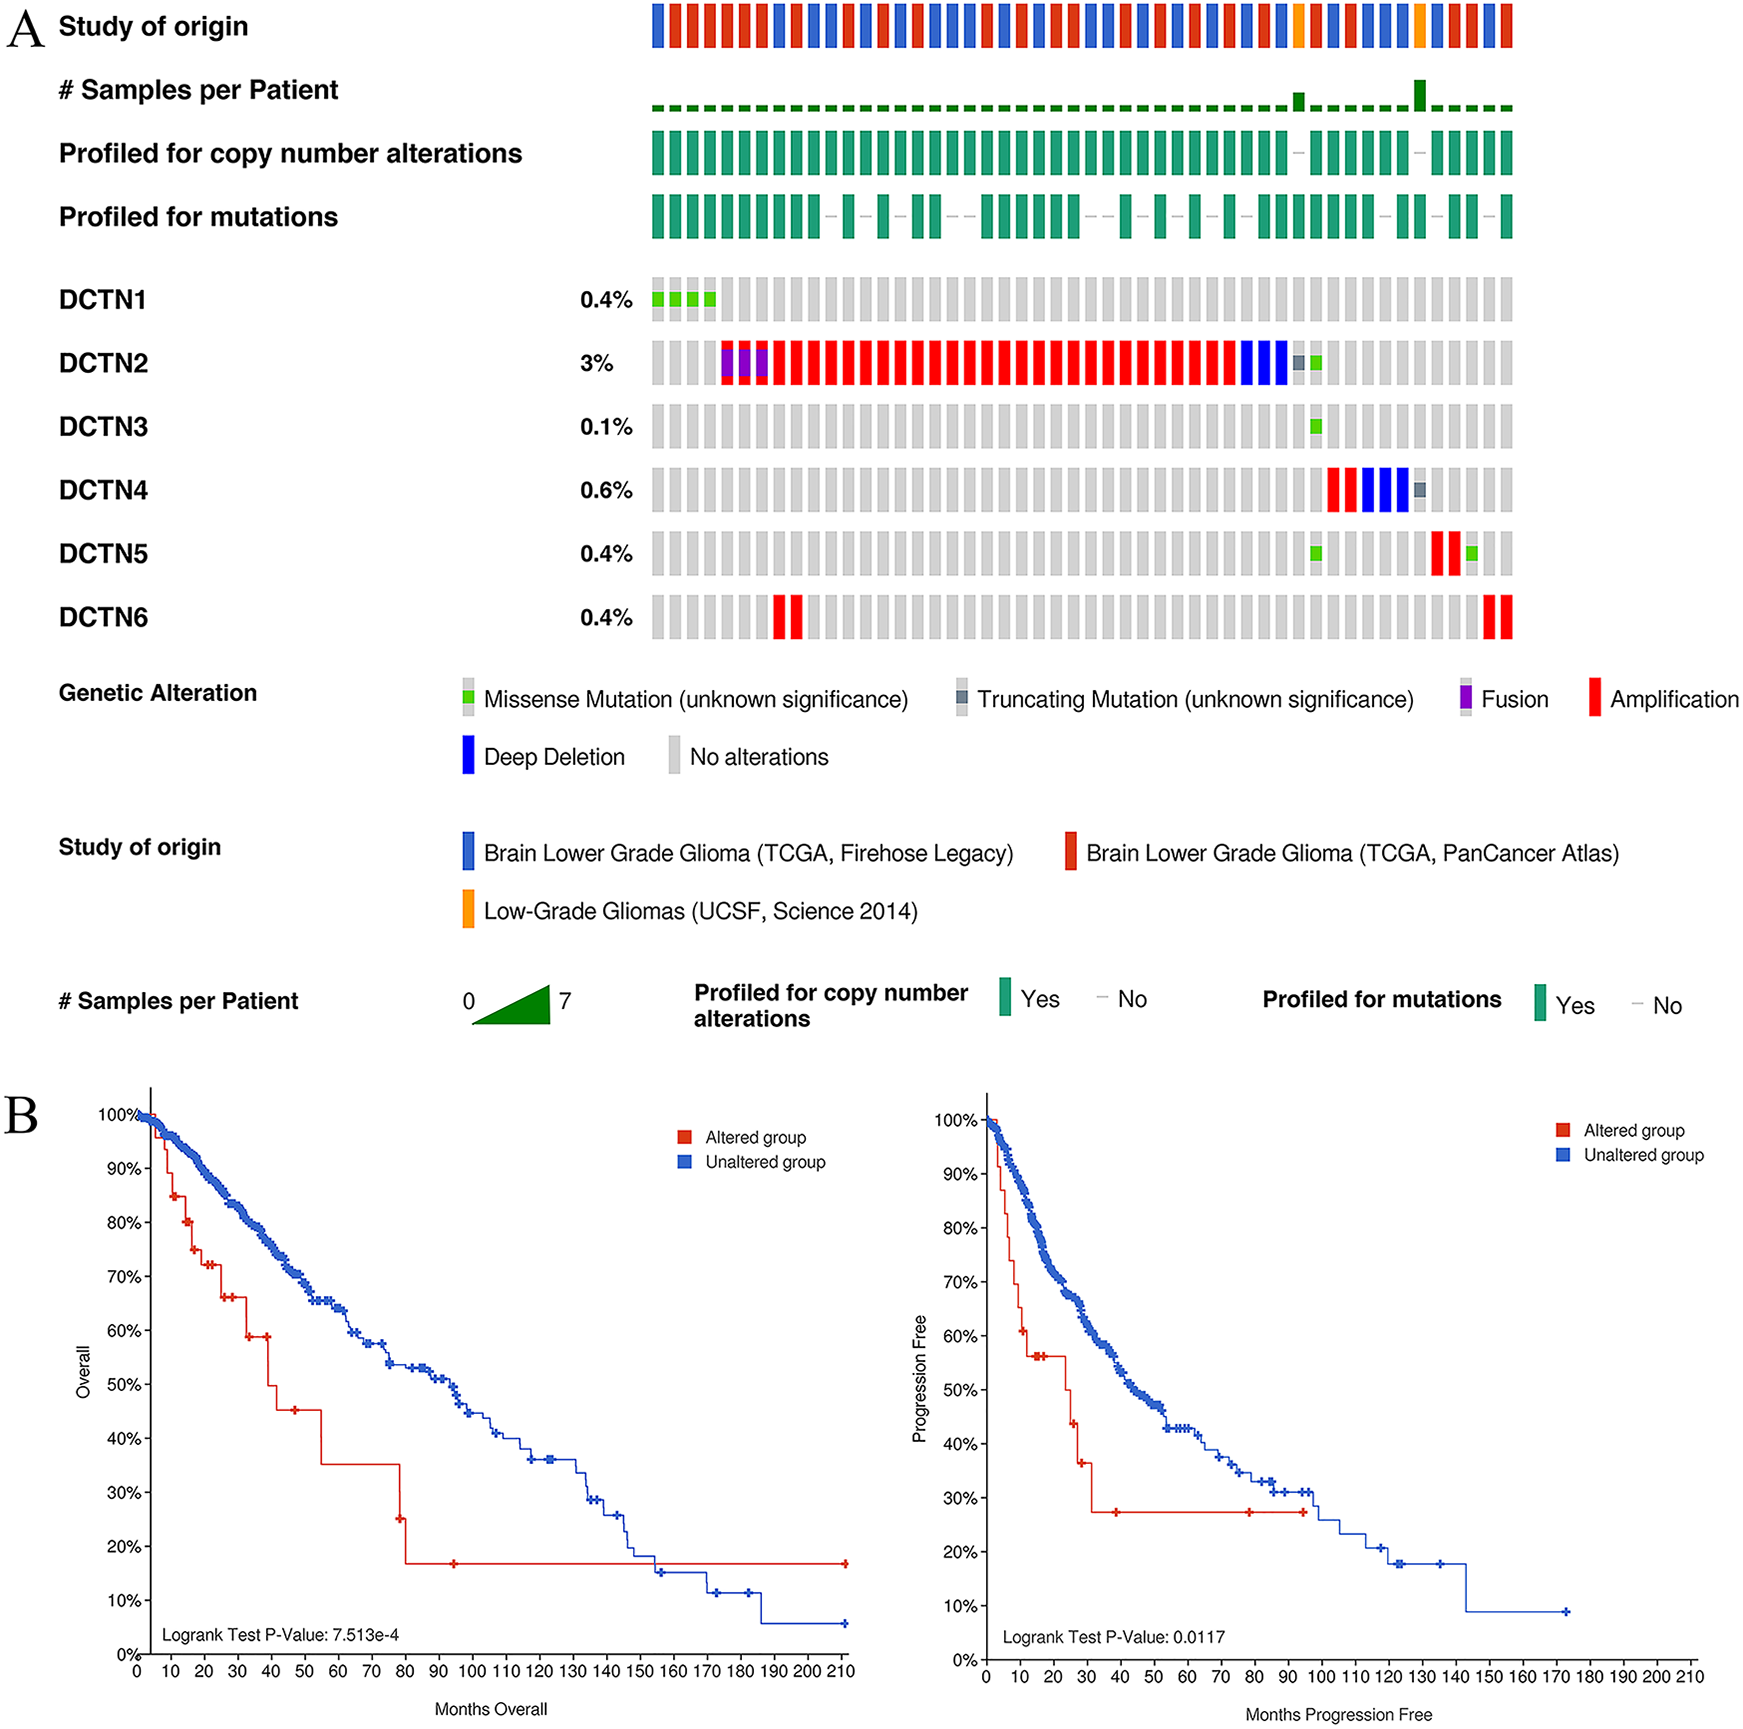
Analysis of mutations of DCTN genes in LGG. A, Mutation rate and types of DCTN genes. Columns without alteration of any single DCTN were not shown. B, Kaplan-Meier plots comparing overall survival and progression-free survival of the altered group and the unaltered group of DCTN genes in LGG.
In this study, OS and progression-free survival were further analyzed based on whether DCTN genes had genetic mutations in LGGs (Figure 7B). The unmutated group was better than the mutant group in both survival conditions (P < 0.05).
Correlation of DCTN Genes with Tumor Purity and Infiltrating Immune Cells
We analyzed the correlation of DCTN genes with tumor purity and 6 types of infiltrating immune cells (Figure 8). Except for DCTN1, the expressions of DCTN2 (r = 0.104, P = 3.08e-01), DCTN3 (r = 0.231, P = 3.29e-07), DCTN4 (r = 0.364, P = 1.74e-16), DCTN5 (r = 0.229, P = 4.2e-07), and DCTN6 (r = 0.253, P = 1.94e-08) were positively correlated with the tumor purity of LGG.

Correlation of DCTN genes with tumor purity and 6 types of infiltrating immune cells.
The expression of DCTN1 was not related to the infiltration of CD8 + T cells, but was inversely related to the infiltration level of B cells (r = −0.15, P = 1.01e−03), CD4+ T cells (r = −0.349, P = 4.16e−15), macrophages (r = −0.328, P = 2.32e−13), neutrophils (r = −0.255, P = 1.81e−08), and dendritic cells (r = −0.27, P = 2.16e−09). DCTN2 was only positively related to the infiltration of CD8 + T cells (r = 0.177, P = 1.01e−04). DCTN3 was negatively correlated with the 6 types of immune cells, including B cells (r = −0.172, P = 1.54e−04), CD8+ T cells (r = −0.1, P = 2.92e−02), CD4+ T cells (r = −0.173, P = 1.49e−04), macrophages (r = −0.248, P = 4.44e−08), neutrophils (r = −0.135, P = 3.10e−03), and dendritic cells (r = −0.143, P = 1.82e−03). DCTN4 was positively correlated with CD8 + T cells (r = 0.312, P = 2.92e-12)and negatively correlated with CD4 + T cells (r = -0.096, P = 3.65e-02). DCTN5 was positively correlated with B cells (r = 0.187; P = 3.86e−05) and CD8 + T cells (r = 0.456, P = 5.58e−26). DCTN6 was positively correlated with CD8 + T cells (r = 0.096, P = 3.53e−02), while negatively correlated with CD4 + T cells (r = −0.182, P = 6.72e−05), neutrophils (r = -0.172, P = 1.69e−04), and dendritic cells (r = −0.147, P = 1.34e−03).
Discussion
In our study, the data about mRNA expression of DCTN genes were downloaded from the TCGA dataset, and then bioinformatics analysis was conducted to investigate the function of these DCTN genes. Furthermore, a PPI network was established to evaluate the functional and physical relationships between DCTN proteins. These analyses showed that the function of DCTN genes was related to the cell cycle, substance transportation, and protein binding in cells. Subsequently, the Kaplan-Meier curve was plotted to predict the prognostic values of DCTN genes in LGG. The results revealed that high expressions of DCTN1, DCTN3, DCTN4, and DCTN6 were closely associated with a good OS in all LGG patients.
DCTN1 encodes the largest subunit of the DCTN family. This subunit interacts with the dynein intermediate chain by directly binding its domains to dynein and microtubules via a highly conserved glycine-rich cytoskeleton-associated protein (CAP-Gly) domain in its N-terminus, thereby participating in the maintenance of cellular structure and motility functions.13,32 DCTN1 acts as a binding partner of adenomatous polyposis coli (APC) that regulate microtubule polymerization, spindle development, and chromosome alignment. 33 -35 The transcriptional dysregulation of DCTN1 may disrupt retrograde axonal transport thereby leading to neuronal dysfunction. 36 Previous studies indicated that DCTN1 was also associated with a variety of cancers including colon tumors, cutaneous melanoma, and lung cancer. 17,19,20 However, the relationship between DCTN1 and LGG remains unknown to date. Our results indicated that high expression of DCTN1 is related to a better prognosis in patients with LGG, but the specific mechanism of action is still unclear. Previous studies have shown that DCTN1 can be cleaved by caspases during apoptosis 37 and that dynein-dynactin interaction is required in the early membrane trafficking step of autophagosome formation. 38 DCTN1 can also act as the binding partner of Ambra1 to participate in the spatial regulation of Src/FAK-mediated cancer cell invasion. 39 Based on these functional and structural features, we hypothesize that DCTN1 may be involved in multiple complex pathways that influence LGG progression.
DCTN3 is located at the moving granules and spindle poles during mitosis and at the centrosome during the intercellular phase. It encodes the smallest subunit of the DCTN family, p24. 40 Like most other dynactin subunits, DCTN3 exists only as a part of the dynactin complex. A previous study found that DCTN3 was significantly overexpressed in lymph node metastasis of primary breast cancer and breast-invasive ductal carcinomas recurring within 6 years, 41 suggesting that DCTN3 overexpression may play a role in breast cancer progression. Furthermore, it has been demonstrated that p24 is related to the metastasis of breast cancer, and patients with p24-positive tumors had a longer survival period. 42 Therefore, we hypothesize that DCTN3 may have similar effects on LGG, which explains why the high expression of DCTN3 is related to a better prognosis in LGG patients. However, the specific mechanism of action needs to be further studied.
Previous studies indicated that DCTN4 was involved in the regulation of the nuclear factor kappa-B (NF-κB) signaling pathway, which plays key roles in cancer progression, metastasis, and drug resistance, 43 -45 and may be related to the cancer development pathway. Previous studies have already shown that high expression of DCTN4 was related to a satisfactory OS of COAD, which is consistent with our results and suggest that a similar mechanism may also exist in LGG. 19
The protein encoded by DCTN6 contains an RGD (Arg-Gly-Asp) motif in the N-terminal region, which confers adhesive properties to macromolecular proteins like fibronectin. 46 And changes in adhesion are often related to the aggressiveness of cancer cells. 39 SPRIGHTLY lncRNA is encoded in the Drosophila gene homolog Sprouty-4 intron, and its aberrant expression is associated with a variety of cancers, such as human melanoma. In addition, it was proven to interact with the intron region of the pre-mRNA of DCTN6. 47 Our Kaplan-Meier curves showed that high expression of DCTN6 was related to a favorable prognosis in LGG patients. Therefore, we hypothesize that DCTN6 may also affect the prognosis of LGG via a similar mechanism.
It was demonstrated that the combination of DCTN1, DCTN3, DCTN4, and DCTN6 improves the sensitivity for predicting OS in LGG patients. In our study, the results of the joint-effect analysis showed that high expressions of DCTN1, DCTN3, DCTN4, and DCTN6 were associated with a favorable OS in LGG patients. On the contrary, low level co-expression of these genes was linked to poor OS in LGG patients.
We used cBioPortal to evaluate the mutation of DCTN genes in LGG. The results showed that mutations in the DCTN genes were related to a poor prognosis of LGG. At the same time, DCTN2 had a higher mutation rate in LGG, which suggested that DCTN2 may play a major role in it. A previous study showed that genetic atypical Parkinson’s disease, a neurological disease, was associated with mutations in DCTN1. 48 However, relationships between DCTN genes mutations and tumors of the nervous system have rarely been reported. Our research contributes to the understanding of the potential roles of DCTN genes mutations in tumor development.
Most predictive models in previous studies on LGG prognosis, based on differential gene expression between tumor tissue and normal tissue, ignored the important role that immune cells may play in glioma development. Studies had shown that some subsets of CD4+ T cells, especially regulatory T cells and T follicular helper (TFH) cells, can promote tumor growth by inhibiting tumor immunity. 49 -51 We found through survival analysis that high expression of DCTN1, DCTN3, DCTN4, and DCTN6 and low infiltration of CD4+ T cells were associated with a better prognosis for LGG. At the same time, we also found that the expression profile of these 4 genes was negatively correlated with the immune infiltration status of CD4+ T cells. This implied that the increased expression of DCTN1, DCTN3, DCTN4, and DCTN6 might inhibit the growth of tumor cells by inhibiting the infiltration of regulatory T cells and TFH cells, which may lead to a better prognosis.
There was a study which showed that tumor-associated macrophages (TAMs) promote tumor proliferation. 52 In our study, the expression of DCTN1 and DCTN3 were negatively correlated with macrophage infiltration and associated with a better prognosis for LGG. This suggested that DCTN1 and DCTN3 may reduce the proliferation of LGGs by reducing TAM infiltration in tumors which allows patients to have a better prognosis. Macrophage and dendritic cell infiltration has been associated with poorer OS in glioma patients, 53 which is similar to the findings of the present study. The expression of DCTN1, DCTN3, and DCTN6 was found to be negatively correlated with dendritic cell infiltration. These results strongly suggest that the effect of the DCTN genes on LGG prognosis may include a mechanism of immune infiltration. This paper complements the research on LGG prognostic markers and provides new ideas for monitoring tumor progression through the status of immune cells in the circulatory system.
It should be noted that there were several limitations in the present study. Firstly, the data used in our study were based on what was already reported in the online databases and we did not use our clinical samples to verify these findings. Secondly, the predicted functions were not actually the functions for DCTN in LGG because we did not perform the cellular and animal experiments to verify how the DCTN genes act on LGG. Thirdly, a larger sample size is needed to improve the reliability of the results. Therefore, our hypothesis still needs to be demonstrated by further experimental and clinical studies.
Conclusions
In the present study, the genes DCTN1, DCTN3, DCTN4, and DCTN6 were found to be significantly up-regulated in LGG tissues. Joint-effect analysis showed that this up-regulation was linked to a better prognosis of LGG patients. In addition, mutation analysis of the DCTN genes and its association with immune cell infiltration showed an impact on the prognosis of LGG. These results suggest that these DCTN genes are potential biomarkers for evaluating the prognosis of LGG patients.
Footnotes
Acknowledgment
We were particularly grateful to the National Natural Science Foundation of China (NO. 81860222) for its support of this work.
Data Availability Statement
Our research was based on the analysis of online databases and the data is available here: The Cancer Genome Atlas (TCGA): https://cancergenome.nih.gov/ and The cBio Cancer Genomics Portal (cBioPortal): ![]() . More details can be found in the paper.
. More details can be found in the paper.
Declaration of Conflicting Interests
The author(s) declared no potential conflicts of interest with respect to the research, authorship, and/or publication of this article.
Ethical Statement
Our study did not require an ethical board approval because it did not contain human or animal trials.
Funding
The author(s) disclosed receipt of the following financial support for the research, authorship, and/or publication of this article: This work was supported by the National Natural Science Foundation of China (NO. 81860222).