
Abstract
Low-grade glioma is the most common type of primary intracranial tumor. In the last 3 years, new observations of molecular precursors in adults with gliomas have led to a modification in the histopathologic classification of these brain tumors. Among the biomarkers that have been highlighted, we have the micro RNAs (miRNAs) which play a crucial role in the regulation of gene expression and the long noncoding RNAs (lncRNAs) controlling various cellular and metabolic pathways. In our study, large-scale data on sequenced RNA and miRNAs from 516 patients were obtained from the Cancer Genome Atlas database by the TCGAbiolinks package. We identified the differential expression of miRNAs and genes using the Limma package and then we used the ClusterProfiler package for annotations of the biological pathways of the expressed genes, the survival package to estimate the survival analysis, and the GDCRNATools package to determine miRNAs-genes and miRNAs-lncRNAs interactions. We obtained a significant correlation between the miRNAs identified and the overall survival of the patients (log-rank P < .05) and we have theoretically proposed a novel network of miRNAs involved in low-grade gliomas, specifically astrocytomas and oligodendrogliomas, which combine both genes and lncRNAs.
Introduction
Low-grade glioma (LGG) is a brain tumor that arises from the glial cells that support and protect the nervous system of the brain; they cause considerable difficulty and represent a therapeutic challenge due to the heterogeneity of their clinical behavior.1,2
The recent World Health Organization classification of 2016 updated the definition of these tumors to include isocitrate dehydrogenase mutation and 1p / 19q codeletion as an essential biomarker that characterizes gliomas. Indeed, it has become crucial to identify and characterize other candidate glioma biomarkers using bioinformatic analysis, such as genome scanning to detect cancer-specific mutations and the identification of altered epigenetic landscapes in cancer cells or by exploring the differential expression of genes, micro RNAs (miRNAs), and proteins by transcriptomics and proteomics techniques.1-4,5
Among these high-throughput techniques, RNA sequencing (RNA-seq) is an effective method for robust characterization of the tumor microenvironment. The increasing use of RNA-seq in clinical and scientific contexts offers a powerful opportunity to access new therapeutic biomarkers such as miRNAs which are small noncoding RNAs of approximately 19 to 25 nucleotides in length. They can regulate various target genes and are therefore involved in the regulation of a variety of biological and pathological processes. Deregulated miRNAs have been shown to affect characteristics of cancer, including maintenance of proliferative signaling, bypassing growth suppressors, resistance to cell death, activation of invasion and metastasis, and induction of angiogenesis. Micro RNAs are recognized as potential biomarkers for the diagnosis of human cancer, prognosis and the development of precise therapeutic tools.6,7 Some research has shown, for example, hsa-mir-21 is upregulated in gliomas and promotes invasion targeting specific inhibitors of the matrix metalloproteases 8 or hsa-mir-7 is downregulated in gliomas and inhibits angiogenesis. 9 We also have long noncoding RNAs (lncRNAs) which constitute a large class of transcripts ⩾200 nucleotides in length; lncRNAs can act as enhancers, scaffolds, or decoys by physically interacting with other RNAs or proteins, which has a direct impact on cell signaling cascades. They are regulators of cis or trans transcription and modulators of processing of mRNA, posttranscriptional control and protein activity, and organization of nuclear domains. They also have an implication in the cancer landscape based on their influence on the gain or loss of oncogenic signatures.4,10 For example, some researchers have shown that HOXA transcript at the distal tip is a key factor in hypoxia and glioma metastases, 11 or metastasis-associated lung adenocarcinoma transcript 1 (MALAT1) is associated with gliomas, with growth regulated by the extracellular signal-regulated kinase (ERK) and activated protein kinase. 12 Micro RNAs do not hybridize perfectly with their targets, so they can target thousands of genes and lncRNAs whose protein products work in a variety of signaling pathways, therefore can affect multiple pathways and networks in carcinogenesis.
The huge data repositories in the TCGA database offer the possibility of analyzing these epitranscriptomic data. However, other studies have worked on the single-axis mechanism of miRNAs, lncRNAs, and genes. Therefore, it is important to study the involvement of the network in the regulation of other biomarkers such as genes and lncRNAs. In this study, we analyzed gene expression and we have theoretically proposed a new network that describes the association of differentially expressed miRNAs with genes and lncRNAs involved in LGGs.
Materials and Methods
Data processing
The RNA expression and miRNA datasets of 516 patients with LGGs, including astrocytomas and oligodendrogliomas, were downloaded from TCGA (https://gdc-portal.nci.nih.gov) by the TCGAbiolinks R package version 2.12.6. 13
The data were derived from the Illumina HiSeq RNASeq and the Illumina HiSeq miRNASeq platforms. The data have been postprocessed and standardized in R software.
RNA sequence analysis
Differentially expressed analysis
Compared with the normal group with LGGs, the Limma package version 3.42.0 in R software 14 was used to identify differentially expressed genes (DEGs; Figure 1A and B) with thresholds of a P value < .05 and fold change |FC| > 1 (Figures 2A, 3A and Table 1) and differentially expressed miRNAs with a P value < .01 and fold change |FC| > 2 (Figure 4 and Table 2).

(A) Diagramme de volcan des DEG. (B) Diagramme à colonnes des DEG. (C) Diagramme à points de l’analyse d’enrichissement des OG. DEG indicates differentially expressed gene; FDR, false discovery rate; ncRNA, noncoding RNA

(A) Highly expressed genes. (B) Kaplan-Meier curves for overall patient survival according to highly expressed genes.

(A) Low expressed genes. (B) Kaplan-Meier curves for overall patient survival according to low expressed genes.
Top 8 highly expressed genes and low expressed genes in low-grade gliomas.

Abbreviation: FDR, false discovery rate.
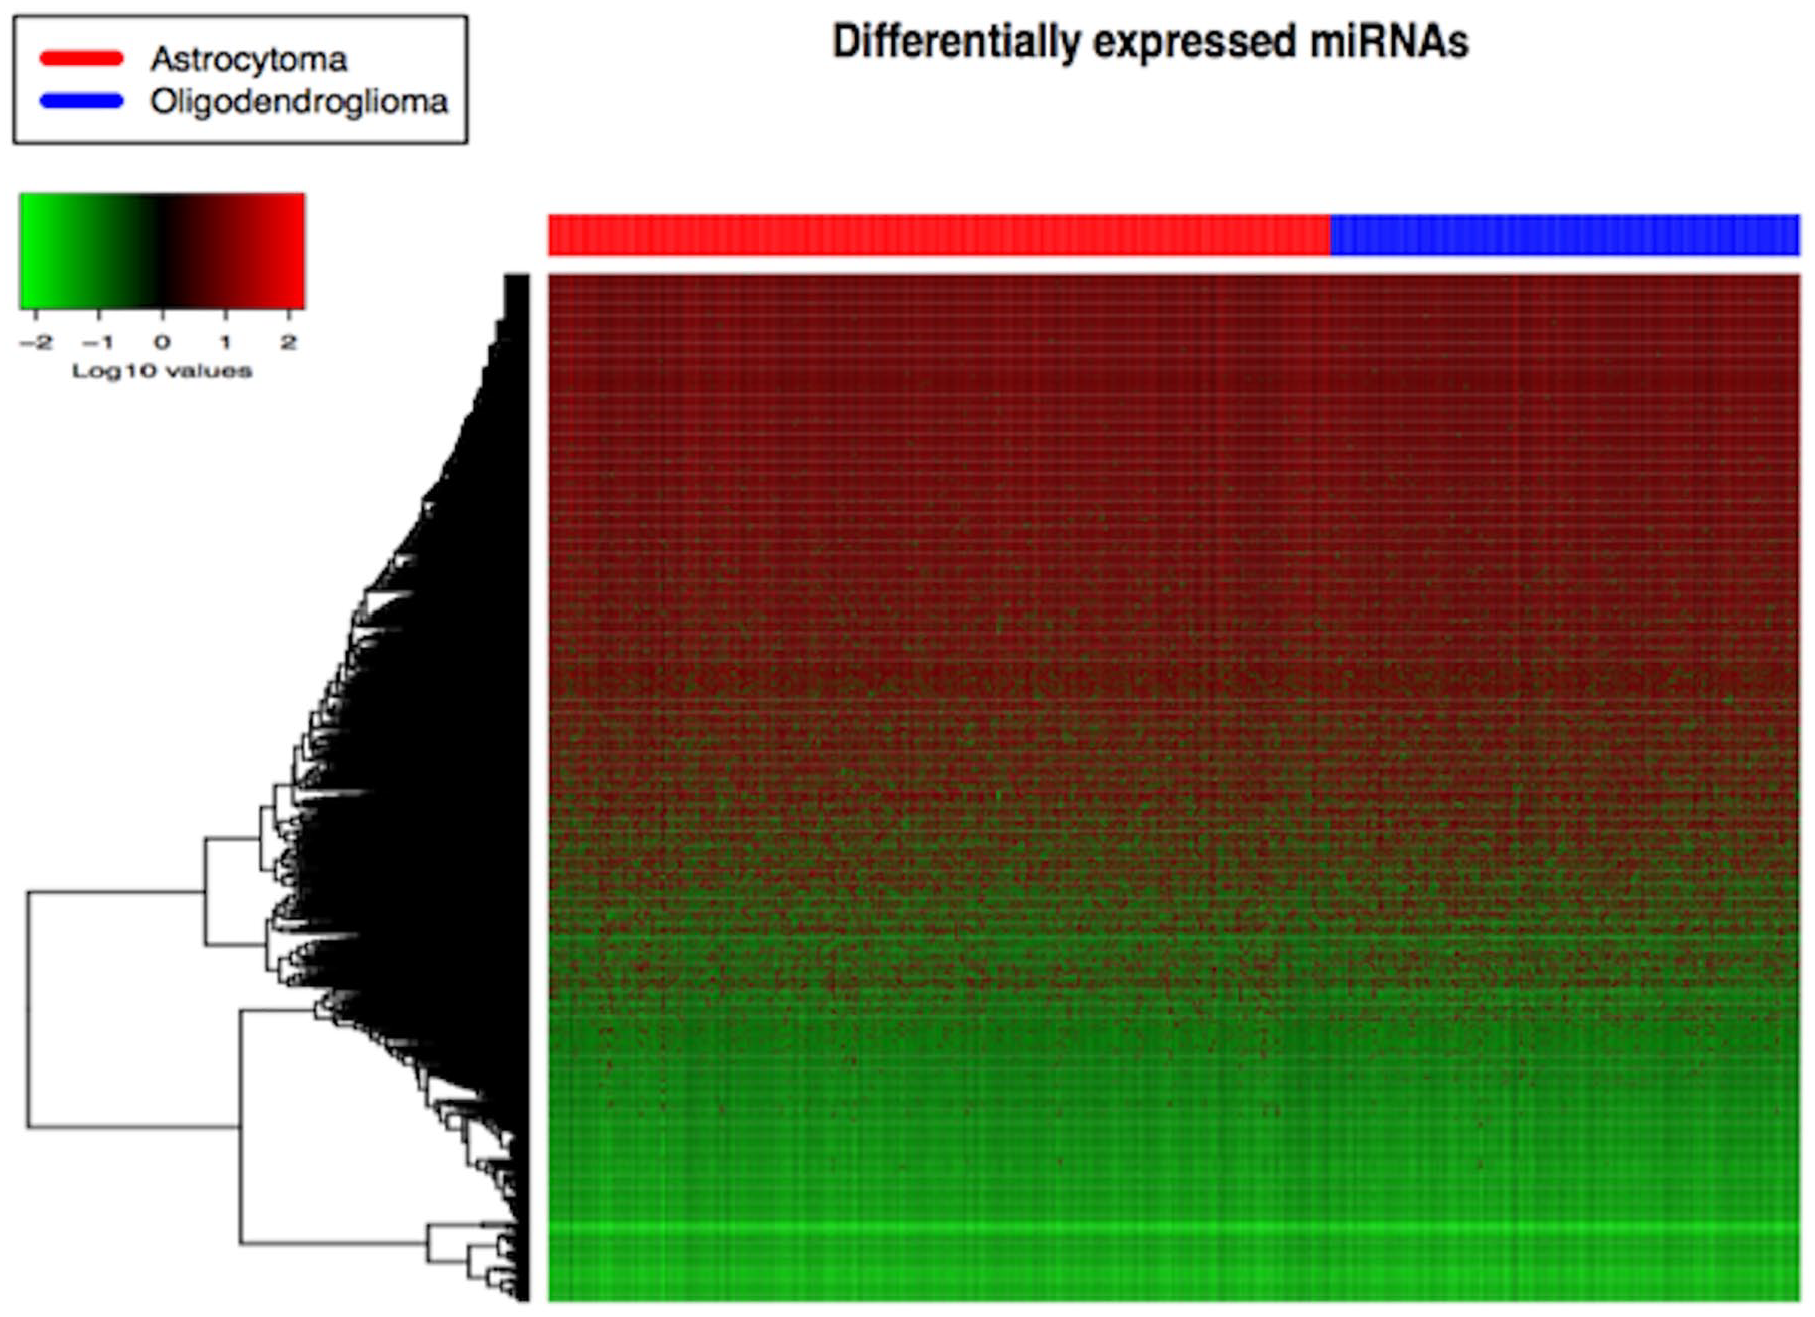
Heatmap of the differentially expressed miRNAs involved in low-grade gliomas. miRNAs indicates micro RNAs.
Top 8 highly expressed miRNAs and low expressed miRNAs in low-grade gliomas.

Abbreviations: FDR, false discovery rate; miRNAs, micro RNAs.
Functional enrichment analysis
To analyze gene ontology biological processes (BPs) and functional enrichment, ClusterProfiler software in R 15 was used with a significant level (P value < .01; Figure 1C).
Survival analysis
To identify the prognostic values of genes (Figures 2B and 3B) and miRNAs (Figure 5) found by combining data from clinical patients, Kaplan-Meier “survival” software in R 16 was used with a P value < .05.

(A) Kaplan-Meier curves for overall patient survival according to highly expressed miRNAs. (B) Low expressed miRNAs. miRNAs indicates micro RNAs.
Construction of the genes and miRNA network
We built the gene expression network involved in LGGs by the GeneMANIA Cytoscape platform (http://www.genemania.org). 17 The network of miRNAs was founded on the reasoning that these noncoding RNAs can interact in the regulation of gene activity. 18
To determine the interactions between miRNAs-genes and miRNAs-lncRNAs, the GDCRNATools version 1.7.0 package 19 in R software was used to integrate data from StarBase v2.0, miRcode, spongeScan, and miRTarBase v7.0. Finally, the miRNA network has been plotted with Cytoscape version 3.6.0 20 (Figure 4).
Results
Identification of DEGs and miRNAs
We explored 1082 genes (593 highly expressed genes and 489 low expressed genes; Figure 1A, B). The top 8 hyper expressed genes are DSCAML1, PEA15, ALDOC, PTPRT, LUZP2, NDRG2, MASP1, and BCAN (Figure 2A); on the other hand, the top 8 low expressed genes are VEGFA, NAP1L1, COL1A1, NKD2, NNMT, ITGA2, ANXA1, and LOX (Figure 3A; Table 1). Among the genes identified for LGGs, we notice a different expression of the genes between astrocytomas and oligodendrogliomas. The MASP1, LOX, ITGA2, LUZP2, ANXA1, COL1A1, and NNMT genes are more expressed in patients with astrocytomas compared with patients with oligodendrogliomas. Otherwise, patients with oligodendrogliomas are characterized by a strong expression of the DSCAML1, NDRG2, ALDOC, BCAN, PEA15, PTPRT, NAP1L1, and NKD2 genes compared with patients with astrocytomas. However, the VEGFA gene is expressed in the same way for both tumor subtypes (Figures 2A and 3A). Indeed, we have identified 1954 miRNAs (1343 highly expressed miRNAs and 611 low expressed miRNAs) which similarly expressed between the 2 subtypes of LGGs, including astrocytomas and oligodendrogliomas (Figure 4).
Pathway analysis of DEGs
We annotated the DEGs to provide systematic and complete information on pathways and biological functions. This analysis showed that changes in BPs, which are a complex of changes in the granularity of the cell, were significantly enriched in histone lysine demethylation, histone demethylation, protein demethylation, protein dealkylation, demethylation, and translational initiation. Changes in the cell component of DEGs, which is the complex structure from which cells are formed, were mainly enriched in the histone methyltransferase complex and methyltransferase. Changes in molecular function that modulates the activity of a gene complex, such as enzyme regulators and channel regulators, were mainly enriched in histone demethylase activity, demethylase activity, and dioxygenase activity (Figure 1C).
Patient survival analysis
The analysis of the overall survival of the patients as a function of the DEGs showed that patients who have a low expression of the LOX and NAP1L1 genes present a long survival; on the other hand, patients who are characterized by a low expression of the NKD2 and COL1A1 genes and high expression of the NAP1L1 gene show a poor survival.
For miRNAs, the overall survival of the patients was analyzed according to the 8 top highly expressed miRNAs (hsa-mir-18a-5p, hsa-mir-155-5p, hsa-mir-128-3p, hsa-mir-21-5p, hsa-mir-124-3p, hsa-mir-137, hsa-mir-451a, and hsa-mir-221-3p) and 8 top low expressed miRNAs (hsa-mir-31-5p, hsa-mir-222-3p, hsa-mir-17-5p, hsa-mir-330-5p, hsa-mir-330-3p, hsa-mir-346, hsa-mir-125b-5p, and hsa-mir-16-5p) which were expressed significantly differentially in the survival tests (Figure 3A and B; Table 1). The prognostic value of the miRNAs identified was examined by the Kaplan-Meier method and the log-rank test according to clinical characteristics. It was found that hsa-mir-18a-5p, hsa-mir-330-3p, hsa-mir-15-5p, and hsa-mir-137 have a better prognosis than the other miRNAs identified.
Construction of the gene and miRNA networks
We have built 2 networks: the first (Figure 6A) contains low expressed genes and the second (Figure 6B) contains highly expressed genes. These networks are characterized by several types of interaction between the identified genes and other genes. We find in the network (Figure 6A), physical interactions (pink color), shared protein domains (dark gray color), colocalization of genes (blue color), genes involved in the same pathway (light gray color), and predicted functional relationships between genes (orange color).

(A) The network of low expressed genes. (B) The network of highly expressed genes.
The network (Figure 6B) is characterized by other types of interaction such as the coexpression of genes (purple color) and the genetic interaction between genes (green color).
We constructed the network based on miRNA expression patterns in patients with LGGs (Figure 7). For the highly expressed miRNAs, a total of 8-node miRNAs, 22 gene nodes, and 90 edges were identified as differentially expressed profiles; on the other side, 8-node miRNAs, 22 nodes of lncRNAs, and 60 edges were identified as differentially expressed profiles (Figure 4A). For low expressed miRNAs, a total of 8-node miRNAs, 22 gene nodes, and 80 edges were identified as differentially expressed profiles; however, the other part of the network has 8-node miRNAs, 22 nodes of lncRNAs, and 55 edges which were identified as differentially expressed profiles.

The miRNA network. (A) The red squares indicate highly expressed miRNAs, the dark blue circles represent genes, and the light blue circles represent lncRNAs. (B) The green squares indicate low expressed miRNAs, the dark blue circles represent genes, and the light blue circles represent lncRNAs. lncRNAs indicates long noncoding RNAs; miRNAs, micro RNAs.
Discussion
The development of omics approaches such as transcriptomics and epigenetics opens up new fields in the understanding of carcinogenesis. The overall content of RNA expression and miRNAs involved in LGGs, downloaded from the TCGA database, was analyzed using different types of large-scale methods, different numbers of tumor samples analyzed, as well as various reference samples (nontumor brain tissue). In this study, we have identified the DEGs involved in LGGs including astrocytomas and oligodendrogliomas. We find some genes, such as LUZP2, LOX, NNMT, and MASP1, which are more expressed in astrocytomas compared with oligodendrogliomas and genes, such as NKD2, PTPRT, ALDOC, and BCAN, which are strongly expressed in oligodendrogliomas (Figures 2A and 3A). We identified the pathways and functions in which differential gene expression is involved. Previous studies have shown that some of the annotated pathways were associated with other types of cancer such as lung cancer, medulloblastoma, breast cancer, and bladder cancer.20-22 The overall survival analysis showed that patients who have high expression of the NAP1L1 gene and low expression of the NKD2 and COL1A1 genes have poor survival, in contrast to patients who are characterized by low expression of the LOX and NAP1L1 genes with a long survival (Figures 2B and 3B). Indeed, we identified 16 miRNAs that were significantly related to the overall survival of patients with LGGs (Figure 5). However, it is becoming increasingly evident that cancer can rarely be attributed to a single genomic mutation. For example, genes are associated with other types of biomarkers in biological signaling pathways in the form of “networks.”
The network which links the DEGs identified shows several types of interactions. The link between the NKD2 and FUS genes is a physic interaction in which 2 gene products interact in a protein-protein interaction, or the colocalization link between the VEGFA and KDR genes means that the 2 genes are linked if they both are expressed in the same tissue or if their gene products are both identified in the same cellular location. The interaction of the 2 genes COL1A1 and GH1, which participate in the same reaction, is also found within a carbohydrate metabolism pathway. We have other types of interaction such as the functional relationships predicted between the genes as in the case between the NAP1L1 gene with both the HP1BP3 and H2AFJ genes (Figure 6A). The binding of the coexpression of the genes reveals that the 2 genes have similar levels of expression; it is presented both between the DSCAML1 gene and the PTPRT gene and between the LUZP2 gene and the PEA15. We note the presence of genetic interaction between the BCAN gene and the 2 genes MLC1 and GPR68, which indicates that the genes are functionally associated if the effects of the disturbance of a gene have been shown to be modified by disturbances of a second gene (Figure 6B). This new reasoning suggests that all transcripts should be combined through shared miRNA response elements (MREs), which could clarify the interactions between biomarkers and their implications for disease. A thorough analysis of the miRNAs can clarify the LGG’s progress, so we have built a network of RNAs based on large-scale TCGA data. Many studies have reported that miRNAs form complex regulatory networks in cell development, differentiation, and homeostasis. They intervene by binding to other RNAs to regulate their secondary structures, targeting them for splicing, transport, translation, and degradation. Deregulation of miRNA function is associated with an increasing number of human diseases, in particular, glioma.23-25 Each network contains MREs for a combination of different miRNAs, and therefore, they can have an impact on several genes and target lncRNAs.23,26
In this study, 16 miRNAs interact with 44 genes and 44 lncRNAs (Figure 7). Some miRNAs are cited in other studies as hsa-mir-18a-5p which was identified by Chen et al 27 as upregulated in brainstem gliomas. Roberta et al 28 have shown that hsa-mir-155-5p has antiapoptotic effects and regulates the sensitization of glioma to antitumor drugs. Then, Huo et al 29 have identified miR-128-3p as an inhibitor of glioma growth by attacking the neuronal pentraxin 1 protein. Also, Wu et al 30 have mentioned that has-mir-124-3p represses cell growth and cell motility by targeting EphA2 in glioma. Mahmoudi and Cairns 31 have revealed that mir-137 contributes to several types of cancer, such as neuroblastoma and glioblastoma multiforme. Roberta et al 28 cited that gliomas express 2 miRNAs, mir-155-5p and mir-221-3p, and that these are linked to antiapoptotic effects. The miRNAs displayed in the network (Figure 7) interact with genes and lncRNAs for examination; the PTEN gene is linked with has-mir-221-3p, has-mir-18a-5p, has-mir-21-5p, has-mir-155-5p, and has-mir128-3p. In other studies, Wong et al 32 have shown that mir-21 inhibition has been shown to enhance the chemosensitivity of human glioblastoma to Taxol, to activate caspase-3 and -9, and to suppress growth in glioma cells independently of PTEN regulation. Also, we find that Zhang et al 33 have indicated that miR-137 may target the 3’-UTR of the epidermal growth factor receptor (EGFR) to reduce its protein translation, resulting in suppression of EGFR signaling in glioblastoma cells. Concerning the SIRT1 gene, it is linked in our network with has-mir-221-3p, hsa-mir-18a-5p, hsa-mir-124-3p, and hsa-mir-155-5p. On the other hand, Romeo et al 34 have suggested a role for miRNA-34a, miRNA-132, and miRNA-217 in the epigenetic control of SIRT1 during gliomagenesis and progression. In Figure 7, the CCND1 gene is bound with hsa-mir-330-5p, hsa-mir-16-5p, and hsa-mir-17-5p, and in the study by Munoz et al, 35 they have identified mir-19, 23a/b, 93b, 193, and 373 as an individual target of CCND1. There are also interactions between miRNAs and lncRNAs such as KCNQ1OT1 which acts as a regulator of mir-504.36-38 Zhou et al 24 discovered that KCNQ1OT1 could cause the development of squamous cell carcinoma of the tongue and inhibit the sensitivity of the tumor to cisplatin. Other important biomarkers are MALAT1, which plays a role in promoting cell proliferation and inactivate ERK/MAPK (mitogen-activated protein kinase) signaling,39,40 and HOTAIR, which binds to EZH2 and promote cell growth.41,42 XIST promotes cell migration and interacts with mir-152. 42 In our network, it interacts with hsa-mir-137, hsa-mir-21-5p, hsa-mir-18a-5p, and Gas5, which exerts tumor-suppressive functions in human glioma cells by targeting mir-222. 43 Micro RNA interactions with genes and lncRNAs could be potential diagnostic and prognostic biomarkers of LGGs. Some of these key transcripts have also been found in other networks involved in other types of cancer. 44 However, the study was based on a bioinformatic analysis using public data from the TCGA database and no further experimental validation was performed. Transcript research is still under development, and many aspects need improvement. Several miRNAs must be clinically validated for use in the diagnosis and prognosis of LGGs.
Conclusions
In conclusion, this study has successfully applied bioinformatic analysis of epitranscriptomics data to establish a specific miRNA network in LGGs, which should help us to better understand the regulation of genes and lncRNAs by miRNAs and to have a clear idea of the interactions between these biomarkers involved in the gliomagenesis of these cerebral tumors.
Supplemental Material
Spp_Mat_analysis – Supplemental material for Bioinformatics Analysis of Differentially Expressed Genes and miRNAs in Low-Grade Gliomas
Supplemental material, Spp_Mat_analysis for Bioinformatics Analysis of Differentially Expressed Genes and miRNAs in Low-Grade Gliomas by Mohammed Amine Bendahou, Azeddine Ibrahimi and Mahjouba Boutarbouch in Cancer Informatics
Supplemental Material
Supp_Mat_edges_and_nodes – Supplemental material for Bioinformatics Analysis of Differentially Expressed Genes and miRNAs in Low-Grade Gliomas
Supplemental material, Supp_Mat_edges_and_nodes for Bioinformatics Analysis of Differentially Expressed Genes and miRNAs in Low-Grade Gliomas by Mohammed Amine Bendahou, Azeddine Ibrahimi and Mahjouba Boutarbouch in Cancer Informatics
Footnotes
Funding:
The author(s) disclosed receipt of the following financial support for the research, authorship, and/or publication of this article: This work was performed under National funding from the Moroccan Ministry of Higher Education & Scientific Research (PPR program) to IA. This work was also supported by a grant from the National Institutes of Health for H3Africa BioNet to IA and Institut Research of the Foundation Lalla Salma, and scholarship of excellence from the National Center for Scientific and Technical Research in Morocco.
Declaration of Conflicting Interests:
The author(s) declared no potential conflicts of interest with respect to the research, authorship, and/or publication of this article.
Author Contributions
MAB conceptualized the study, conducted the formal analysis and investigation, and wrote the original draft of the article; IA and MB supervised the study; and all authors developed the study methodology and reviewed and edited the article.
Supplemental Material
Supplemental material for this article is available online.
References
Supplementary Material
Please find the following supplemental material available below.
For Open Access articles published under a Creative Commons License, all supplemental material carries the same license as the article it is associated with.
For non-Open Access articles published, all supplemental material carries a non-exclusive license, and permission requests for re-use of supplemental material or any part of supplemental material shall be sent directly to the copyright owner as specified in the copyright notice associated with the article.