
Abstract
BACKGROUND:
Immunometabolism plays an important role in neuroblastoma (NB). However, the mechanism of immune-metabolism related genes (IMRGs) in NB remains unclear. This study aimed to explore the effects of IMRGs on the prognosis, immune infiltration and stemness of patients with NB using machine learning methods.
METHODS:
R software (v4.2.1) was used to identify the differentially expressed IMRGs, and machine learning algorithm was used to screen the prognostic genes from IMRGs. Then we constructed a prognostic model and calculated the risk scores. The NB patients were grouped according to the prognosis scores. In addition, the genes most associated with the immune infiltration and stemness of NB were analyzed by weighted gene co-expression network analysis (WGCNA).
RESULTS:
There were 89 differentially expressed IMRGs between the MYCN amplification and the MYCN non-amplification group, among which CNR1, GNAI1, GLDC and ABCC4 were selected by machine learning algorithm to construct the prognosis model due to their better prediction effect. Both the K-M survival curve and the 5-year Receiver operating characteristic (ROC) curve indicated that the prognosis model could predict the prognosis of NB patients, and there was significant difference in immune infiltration between the two groups according to the median of risk score.
CONCLUSIONS:
We verified the effects of IMRGs on the prognosis, immune infiltration and stemness of NB. These findings could provide help for predicting prognosis and developing immunotherapy in NB.
Introduction
Neuroblastoma (NB) is a kind of neuroendocrine tumor derived from primitive cells of the sympathetic nervous system [1]. It is the most frequent tumor during infancy and accounts for about 15% of pediatric oncological deaths [2]. Despite spontaneous tumor regression observed in infants, its high mortality and malignancy remained a challenge for NB treatment. With the development of the novel discovery of the biological and genetic features of NB, various staging schemes for NB were used in the past. Age at diagnosis, stage, MYCN status, 1p and/or 11q status, INPC category, and individual histologic components were all considered to be an important risk classification factor [3]. With a prevalence rate of around 22% in NB patients [4], MYCN amplification is one of the alterations that correlates with poor prognosis and rapid tumor progression [5]. Although advanced progress has been made in NB treatment for low-risk and intermediate-risk patients, the five-year EFS and OS of high-risk cases remain low compared with other tumors, even after multimodal therapy, such as chemotherapy, surgery, radiotherapy, and Autologous Stem Cell Transplant (ASCT) [3, 6, 7]. Furthermore, late-onset adverse effects of current therapy have impacts on long-term survivors in all risk groups and are the barriers yet to be overcome [8, 9, 10]. Therefore, better treatments and further studies about tumorigenesis should be carried out to improve the prognosis of NB patients.
Immunotherapy is a revolutionary milestone in cancer treatment. With the development and thriving of modern immunology, researchers have established efficient and advanced therapies to bring benefits to cancer patients, including immune checkpoint inhibitors (ICIs) and adoptive cell transfer (ACT) [11]. However, different cancer may have different efficacies [12]. Pediatric tumors like NB seem to be insensitive to these implications. This result may be due to several facts, such as low mutation load and lack of MHC-1 expression, inactive tumor infiltration, and specific immune evasion strategies [13]. Although Jabbari et al. [14] demonstrated that the anti-GD2 antibody Dinutuximab is an effective NB treatment through molecular studies, the outcome is still frustrating. Nevertheless, the latest study once again shows us the hope of immunotherapy for NB. A phase I/II trial has revealed the promising activity of GD2-CART01. The GD2-CART01 cells expanded in 26 of 27 patients and persisted at detectable levels for a median of 3 months. Objective responses occurred in 17 patients (63%), including 9 (33%) with a complete response. Among patients treated at the recommended dose, 3-year event-free survival and overall survival were 36% and 60%, respectively [15]. As an emerging frontier, immunometabolism mainly focuses on the crosstalk between the immune cells and metabolism [16, 17]. Mathis et al. [18] suggested that immunometabolism play an important role in the field of obesity and type 2 diabetes initially. Recently, it has been discovered to be closely related to a variety of cancer [19, 20, 21]. It is generally acknowledged that the immune cells activate and infiltrate into tumors in response to their abnormal growth. To escape from immune surveillance and maintain sustainable growth, tumor cells compete with immune cells in nutrients, secrete metabolites or cytokines, and form tumor microenvironment (TME) after proliferation [22]. These distinct differences between cancer and normal cells require a series of reprogramming of cell metabolism. Warburg effect is one of the most classic, and it describes the elevated consumption of glucose in glycolysis rather than oxidative phosphorylation, even in the presence of physiological oxygen conditions in cancer cells [23]. Therefore, targeting the immune system to conquer the suppression caused by TME may be a vital opportunity for us to optimize the treatment of tumors. However, there are only studies about the impact of single immune or metabolic related genes on tumors at present [24, 25, 26]. Few noticed the importance of combined immune-metabolism related genes (IMRGs). Thus, a further understanding of immunometabolism may bring new insights and strategies for immunotherapy in NB.
Cancer stem cells (CSCs) are a group of tumor cells that keep generating new tissues consistently and lead to tumor growth [27]. With the revival of this concept, abundant evidence of the relationship between CSCs and tumor recurrence, metastasis or therapy resistance has been found [28, 29, 30, 31]. Moreover, it gives researchers innovative ideas for targets and therapies in the treatment of refractory tumors [32, 33]. A stemness index score (mRNAsi) is recently introduced to measure tumor stemness [34]. However, few studies concentrate on the correlation between CSCs and immunometabolism.
Machine Learning (ML), a major subfield of Artificial Intelligence (AI), enables computers to perform particular tasks after learning from a large amount of data automatically. Scientists have applied it to cancer research over the past decades. Models created by ML have contributed to the prediction of cancer types, prognosis, risk factors and treatment [35, 36]. In this study, we used datasets like GEO to establish a novel prognostic model based on IMRGs and analyze IMRG function in cancer stemness and immune infiltration. We will provide new insights into the role of IMRGs in NB, as well as the targets and clues for the diagnosis and treatment of NB.
Materials and methods
Data acquisition
“NB” and “Neuroblastoma” is used as a keyword to screen qualified gene data sets according to strict inclusion/exclusion criteria. The inclusion criteria are as follows: (1) Patients with sporadic NB; (2) clinical information of patients with NB, including MYCN status; (3) Test samples from the data set of human tissues. The exclusion criteria are: patients who have participated in clinical trials of drugs or other treatments. After filtering and comparison, according to strict inclusion/exclusion criteria, three gene datasets were selected from GEO (
Differentially expressed analysis
The amplification of MYCN was one of the earliest biomarkers found in NB and is still considered to be one of the most reliable predictors of clinical manifestation [37]. As the amplification status of MYCN had a tremendous impact on the clinical phenotype of NB patients, the 932 NB samples after removal of batch effect were divided into two groups according to whether MYCN gene was amplified or not, including 173 MYCN-amplified patients and 759 MYCN non-amplified patients. The differentially expressed genes between the two groups were analyzed with the R package “limma” and the up-regulated and down-regulated genes were labeled. Performing intersection with immune-metabolism related genes obtain differentially expressed IMRGs.
Enrichment analysis
The R software “clusterProfiler” was used for Gene Ontology (GO) and Kyoto Encyclopedia of Genes and Genomics (KEGG) enrichment analysis of differentially expressed IMRGs. Additionally, we explored the quantitative relationship of genes among different enrichment pathways from website Metascape (
Screening of prognostic genes
The “survival” package of R software was used for univariate Cox regression analysis of the differentially expressed IMRGs. STRING (version 11.0,
Identification of prognostic gene feature
Principal component analysis (PCA) was performed on the genotyping effect of prognostic genes in clinical phenotypes of patients with NB using R software “factoextra” and “FactoMineR” packages. We also analyzed the association of prognostic genes with immune checkpoints (ICs).
Construction of prognosis model
We chose the E-MTAB-8248 dataset as the train set (
Validation of prognostic models
According to the median prognostic risk score acquired from prognostic model, the patients were divided into high-risk group and low-risk group. We used the “ROCR” and “timeROC” packages to calculate the 5 years’ Receiver operating characteristic (ROC) curve of the train set and the test set, and used the “survminer” package to calculate the K-M curve. Eventually, by means of the “rms” package, we built the nomogram and verified its accuracy.
Immune infiltration and stemness analysis
Stemness and immune infiltration are indicators of survival, classification and disease progression in cancer patients. Analysis of the two dimensions would help us to comprehend the mechanism of tumors’ action further. CIBERSORT is a method for characterizing cell composition of complex tissues from their gene expression profiles [38]. The patient’s immune infiltration was calculated by gene expression through the package “CIBERSORT”. The package “estimate” was applied to calculate the patient’s Stromal Score, Immune Score, ESTIMATE Score, Tumor Purity. The stemness index of a tumor can be predicted by gene expression. The one-class logistic regression machine learning algorithm (OCLR) extracted a set of transcriptomics and epigenetic features from untransformed pluripotent stem cells and their differentiated descendants to obtain a stemness index [34]. The model was built from the syn3156503 dataset in the “synapser” package, and the model was used to predict the stemness index of the train set and the test set, respectively.
Correlation analysis of IMRGs with immune score and stemness index
The operation of weighted gene co-expression network analysis (WGCNA) included clustering analysis of expression spectra and calculation of association between each cluster module and clinical phenotype [39]. We analyzed the correlation of the NB patient’s Stromal Score, Immune Score, ESTIMATE Score, Tumor Purity, and stemness index with the “WGCNA” package. The genes in the modules with most significant scores were analyzed for GO, KEGG, and Gene set enrichment analysis (GSEA) enrichment. By dint of Cytohubba plug-in in Cytoscape software [40], the genes with the most significant interactions were screened out.
Statistical analysis
Univariate Cox regression analysis, LASSO analysis, SVM-RFE and RF were selected to construct the prognosis model. The K-M survival curve was used to compare the prognosis differences between different risk groups. The ROC curve and Area Under Curve (AUC) values were used to assess the accuracy of the IMRGs-based prognostic model. All statistical analyses in this study were performed in R (v4.2.1). A
Results
Study cohort
A total of 1323 patients were enrolled in this study from 5 data sets of 3 databases. After data cleaning, the clinical data of 1296 patients were left for statistical analysis. The Shapiro-Wilk normality test was employed to assess the normal distribution and levene test was used to assess the homogeneity of variance of clinical data [41]. Results showed that Age and INSS stage did not follow a normal distribution, and therefore, Wilcoxon and Kruskal-Wallis tests were used for their respective analyses. Conversely, the t-test and ANOVA were employed for other indices since they are normally distributed. The outcomes demonstrated that only the clinical data distribution of Risk group exhibited a significant difference (Table 1). The study was conducted in accordance with the Reporting Recommendations for Tumor Marker Prognostic Studies (REMARK) guidelines [42].
Characteristics of study cohort
Characteristics of study cohort
Abbreviations: TERT-RA, TERT rearrangement; SCA, segmental chromosome aberrations.
Identification of differentially expressed genes. (A) Data-uncorrected expression data. (B) Data-corrected expression data. C. Volcanic map of differentially expressed genes. D. Heatmap of gene expression for 932 NB patients.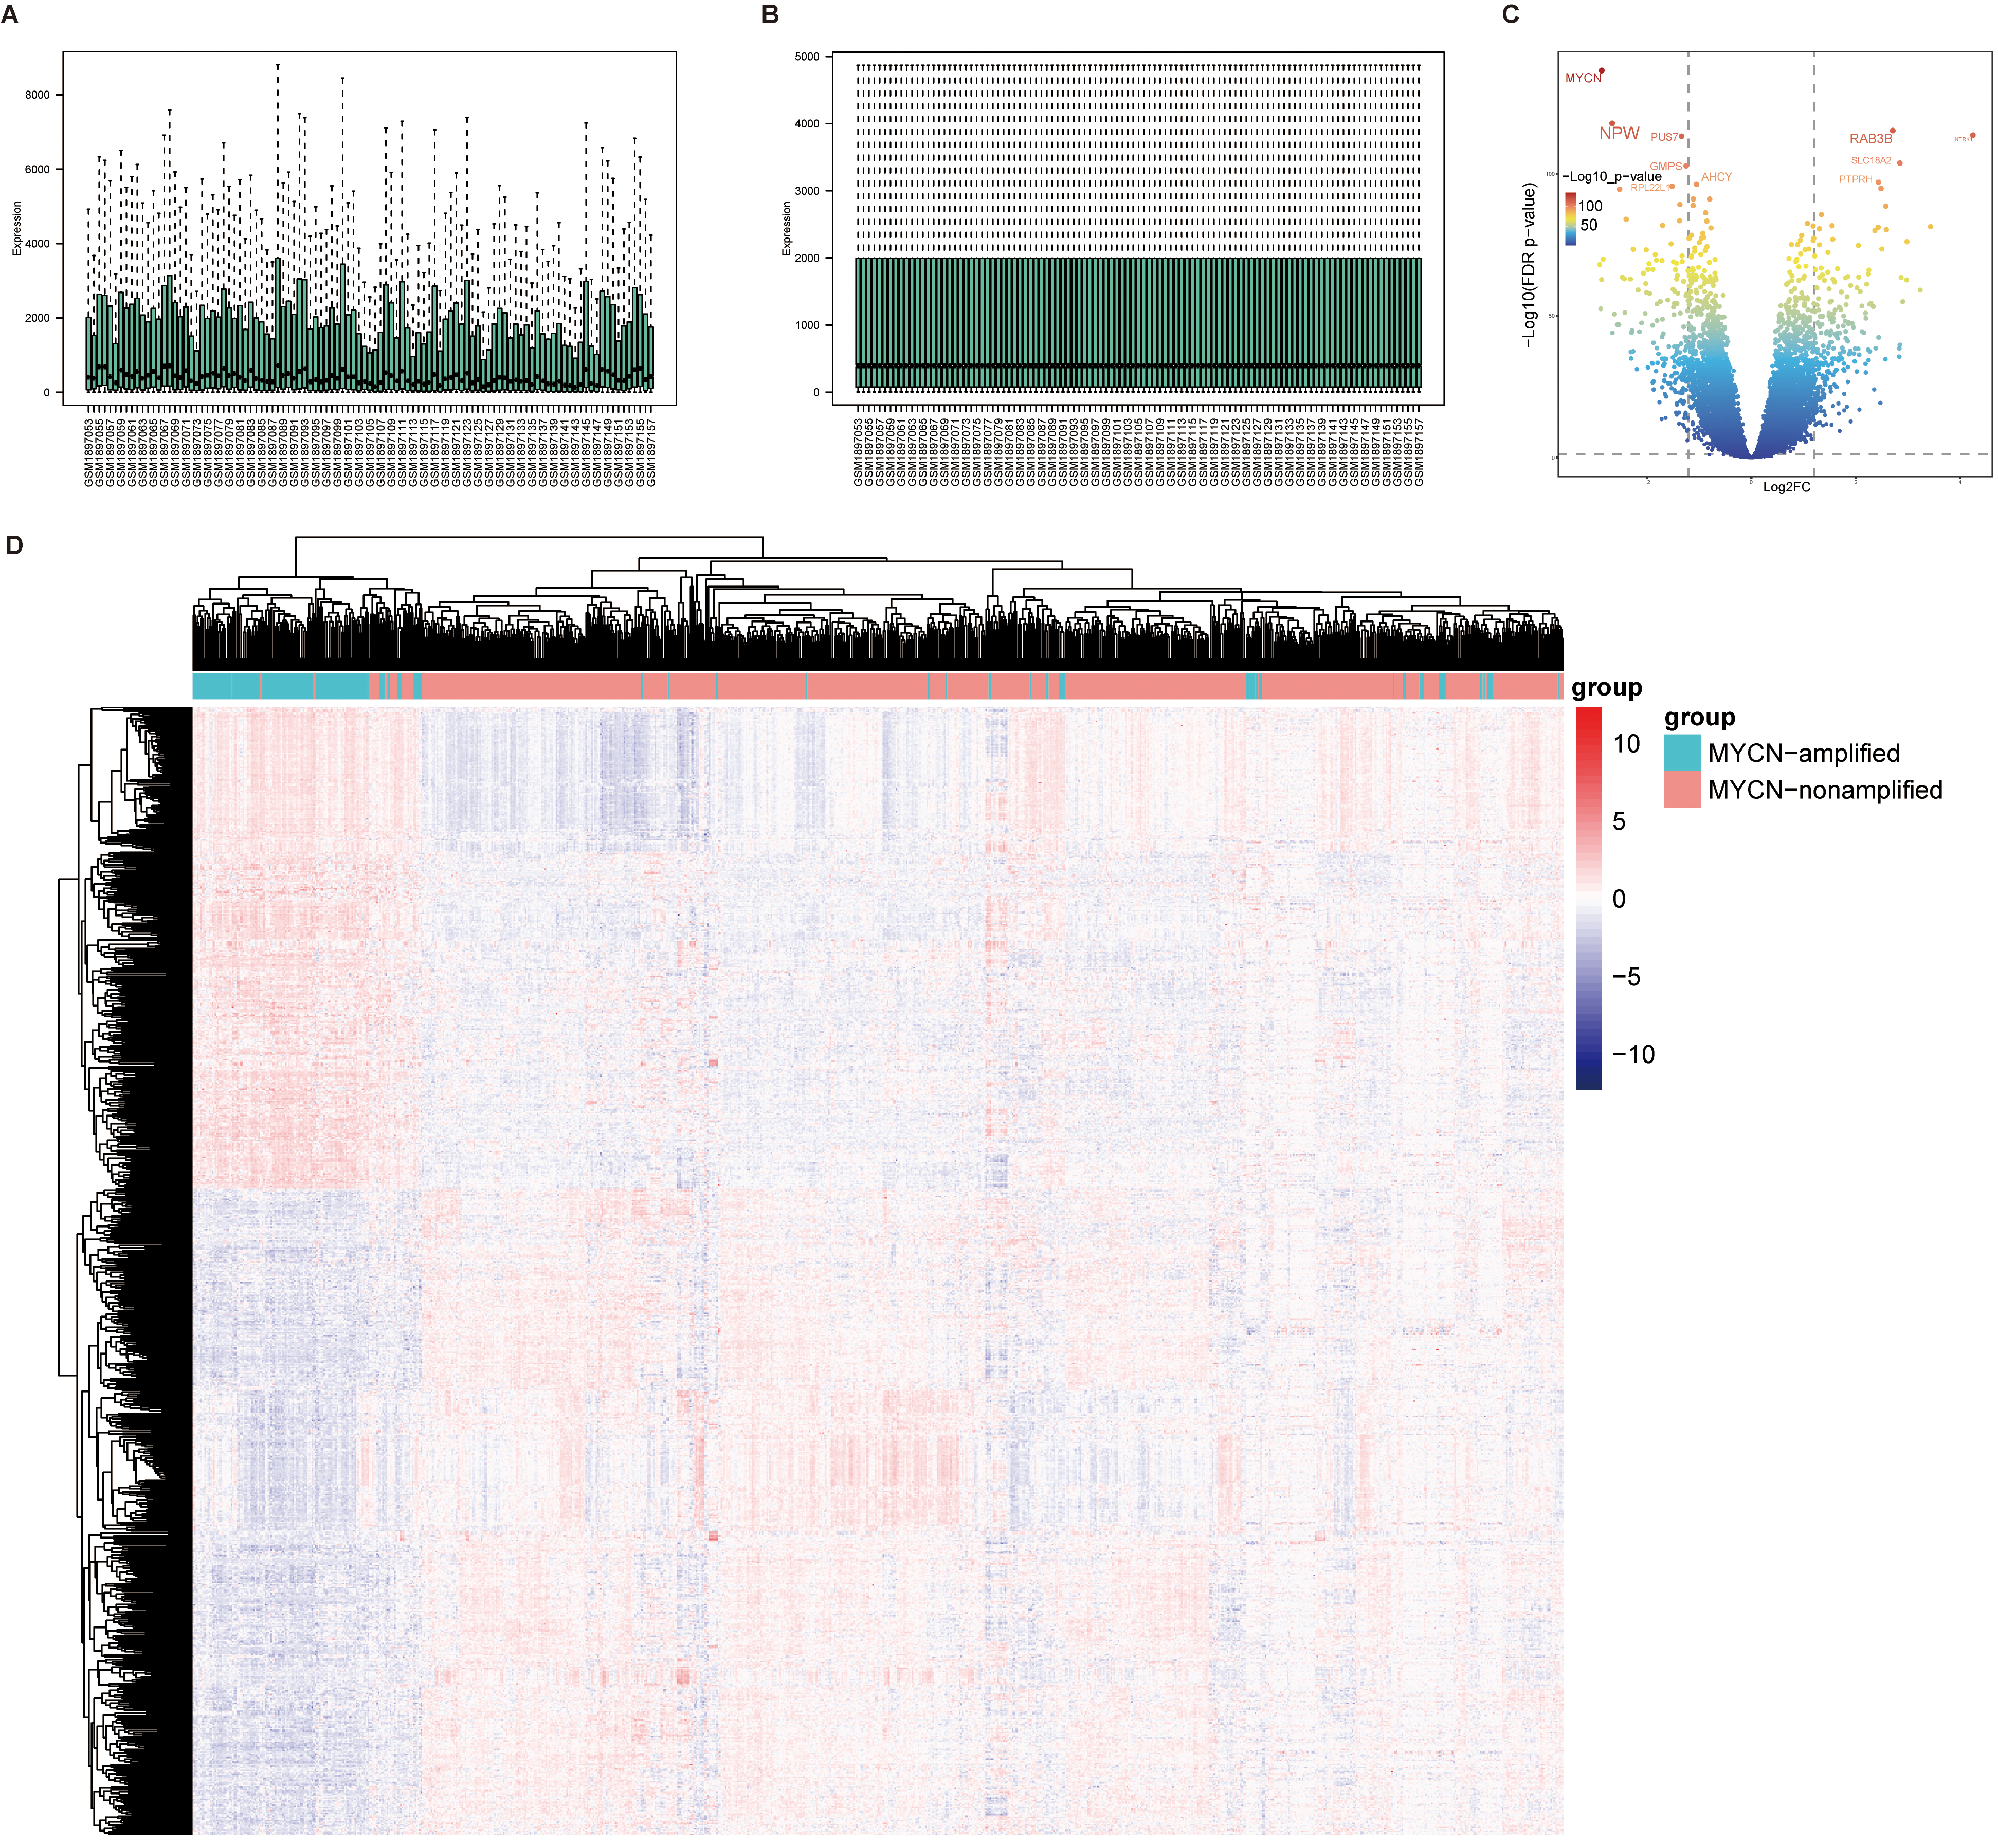
To identify differentially expressed IMRGs, we analyzed three datasets, GSE120559 (
Enrichment analysis of differentially expressed IMRGs. (A) GO enrichment analysis. The outermost ring is the enrichment pathway; The second circle is the number of genes enriched into the pathway; The third circle is the gene expression; The innermost circle is the enrichment significant degree. (B) KEGG enrichment analysis. On the right are the enrichment pathways, and on the left are the top 15 most significant genes involved in enriching each pathway. (C) GO enrichment BP pathway results. GO Cluster generates a circular dendrogram of the clustering using by default euclidean distance and average linkage. The inner ring displays the color coded logFC while the outside one encodes the assigned terms to each gene. (D) GO enrichment results of Metascape database. The points represent the enrichment pathway. The larger the point, the more genes enriched into the pathway. The larger the line between the points, the more common genes between the points.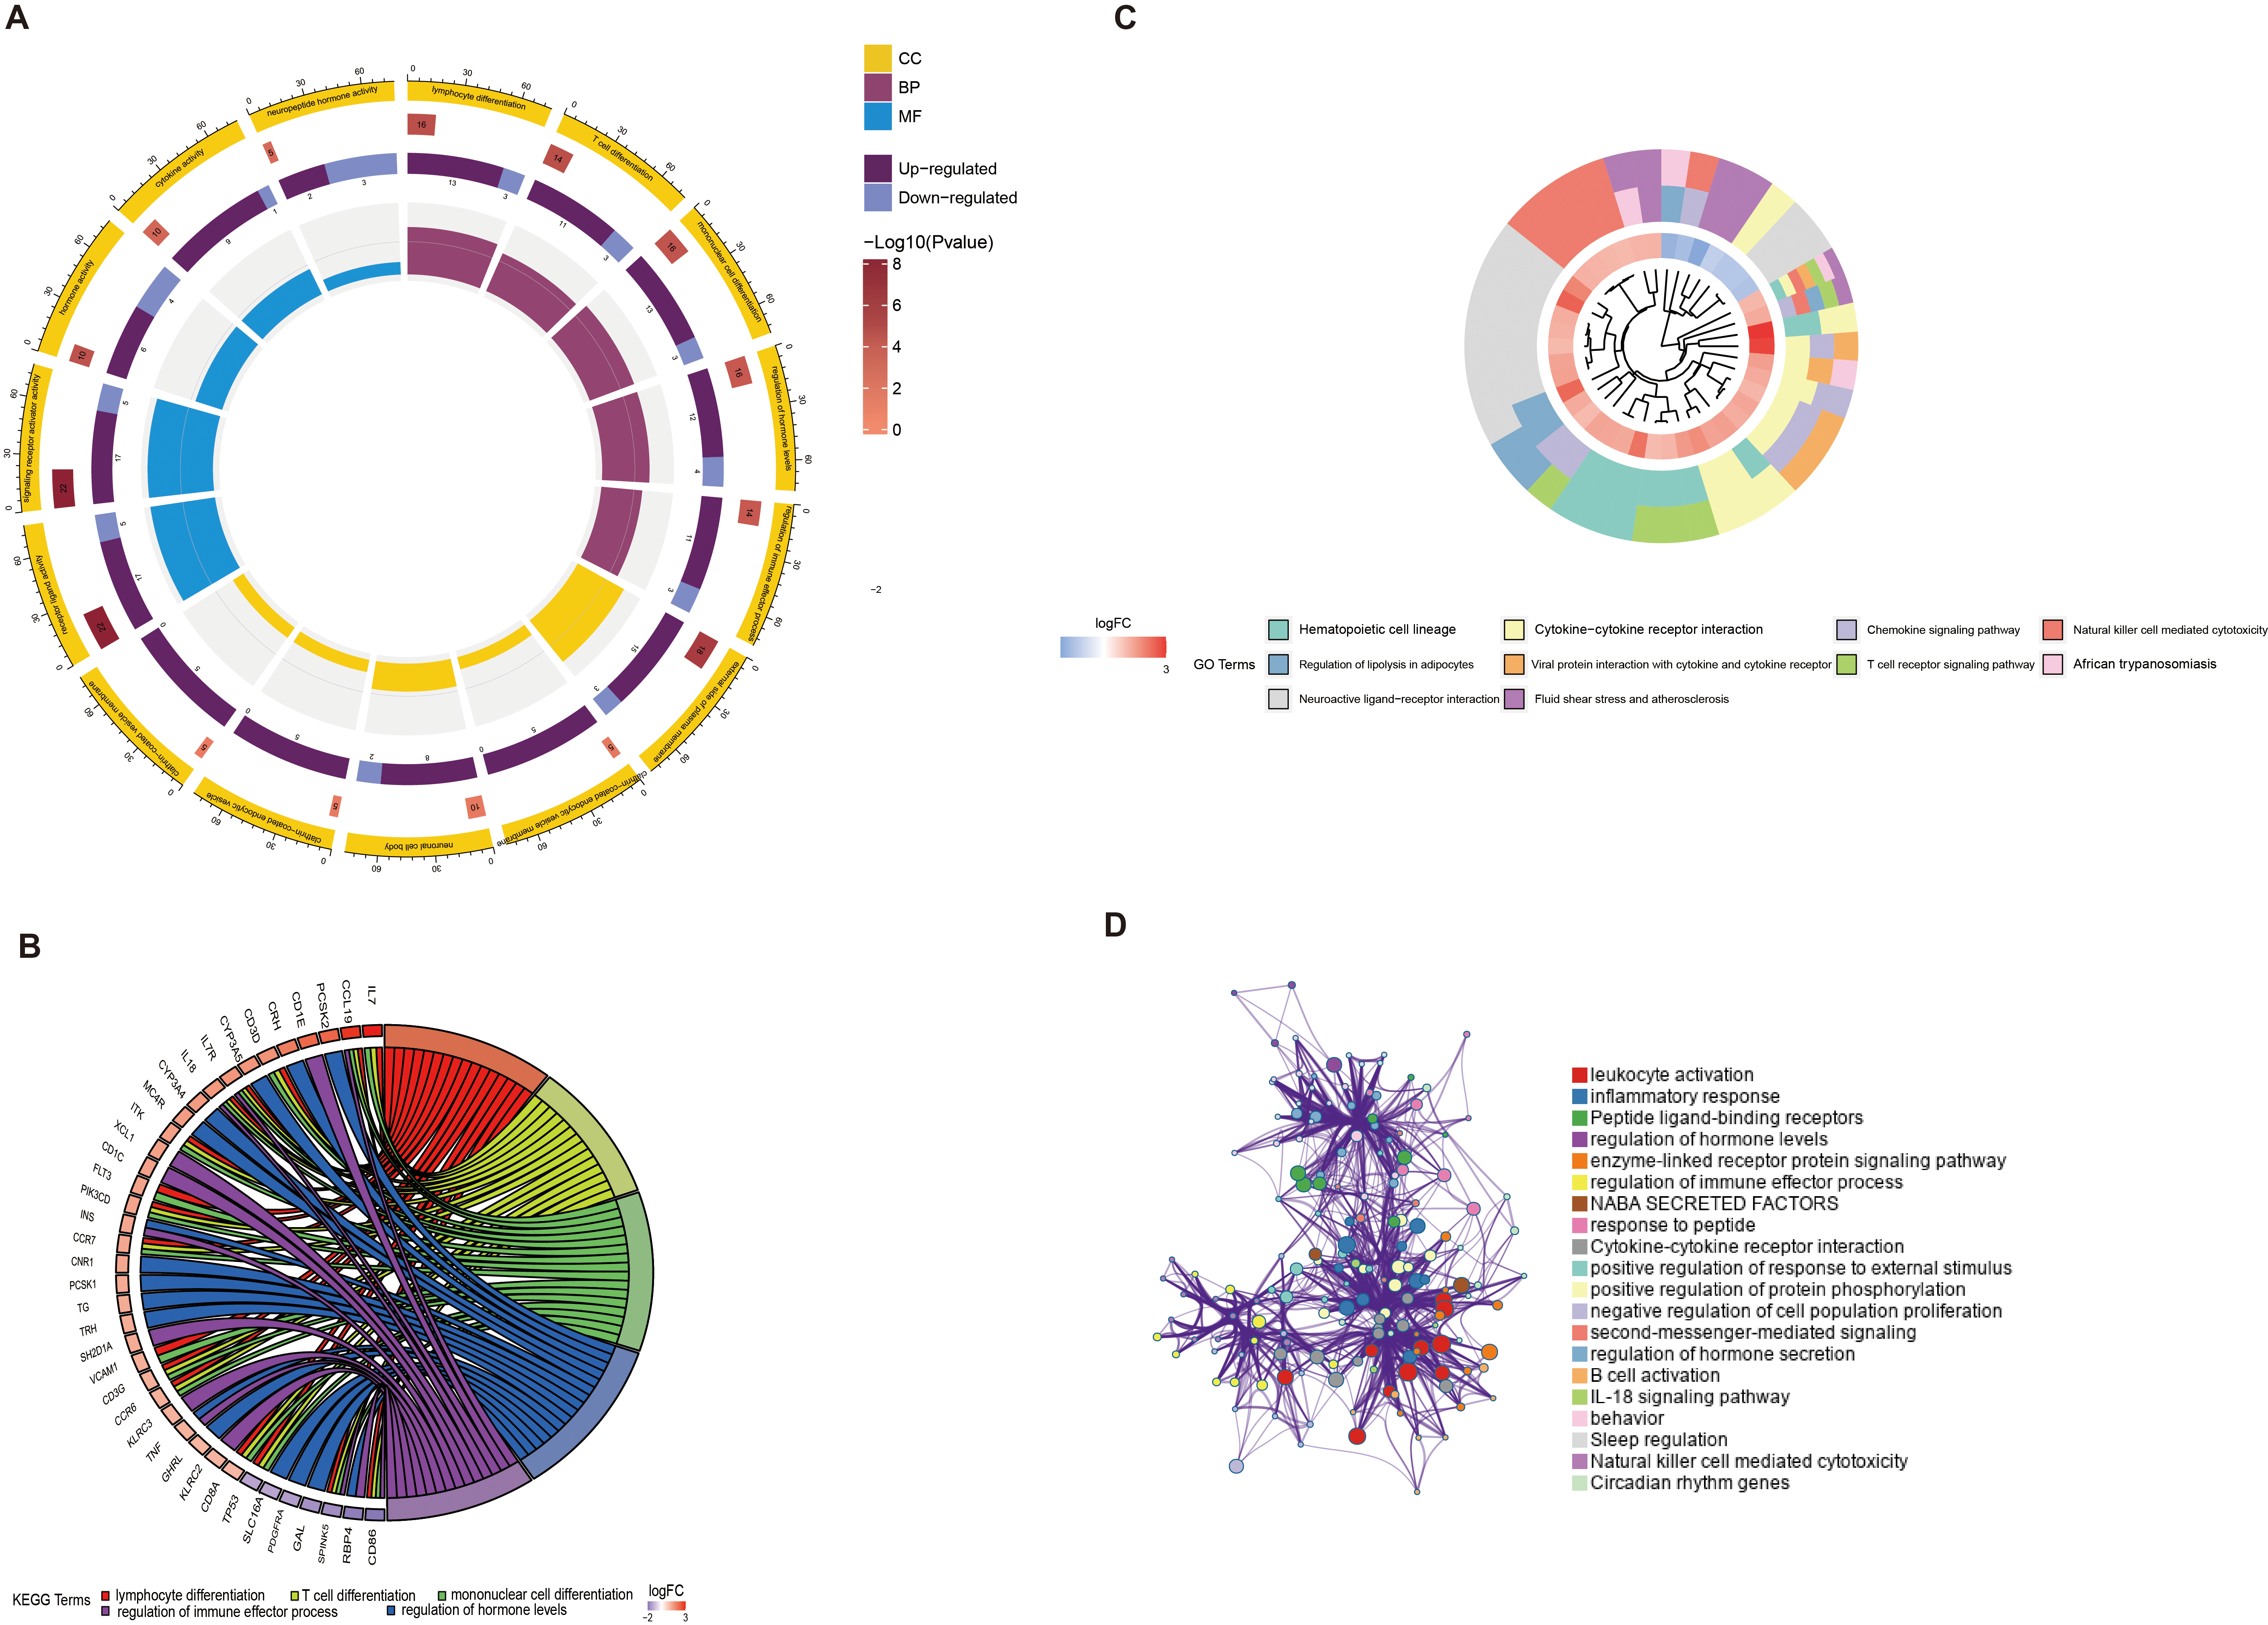
To further explore the biological effects of the differentially expressed IMRGs, enrichment analysis was performed on the 89 genes (Fig. 2A). GO enrichment analysis showed that in biological processes (BP), the differential genes were enriched in 1116 pathways, including lymphocyte differentiation, T cell differentiation, and monocyte differentiation (Fig. 2B); In cellular components (CC), differential genes were enriched in 10 pathways, including the alpha-beta cell receptor complex; In molecular functions (MF), the differential genes were enriched in 129 pathways, including the cytokine activity, Signaling Receptor Activity. The KEGG enrichment analysis manifested differentially expressed IMRGs enrichment in hematopoietic cell lines, chemokine signaling pathways, cytokine interactions, and T cell receptors (Fig. 2C). The analysis from website Metascape showed that leukocyte activity had the largest number of differentially expressed IMRGs and relevant pathways (Fig. 2D).
Screening of prognostic genes
Screening of prognostic genes. (A) The optimal number of parameters using SVM-RFE algorithm. (B) The optimal value using random forest algorithm. (C) The prognostic genes using random forest algorithm. (D) Top 20 genes most related to prognosis in univariate Cox regression analysis results. (E) Protein-protein interaction network diagram of top 15 and other 74 genes in univariate Cox regression analysis results. (F) Prognosis genes obtained by combining the SVM-RFE algorithm, the RF algorithm and the univariate Cox regression.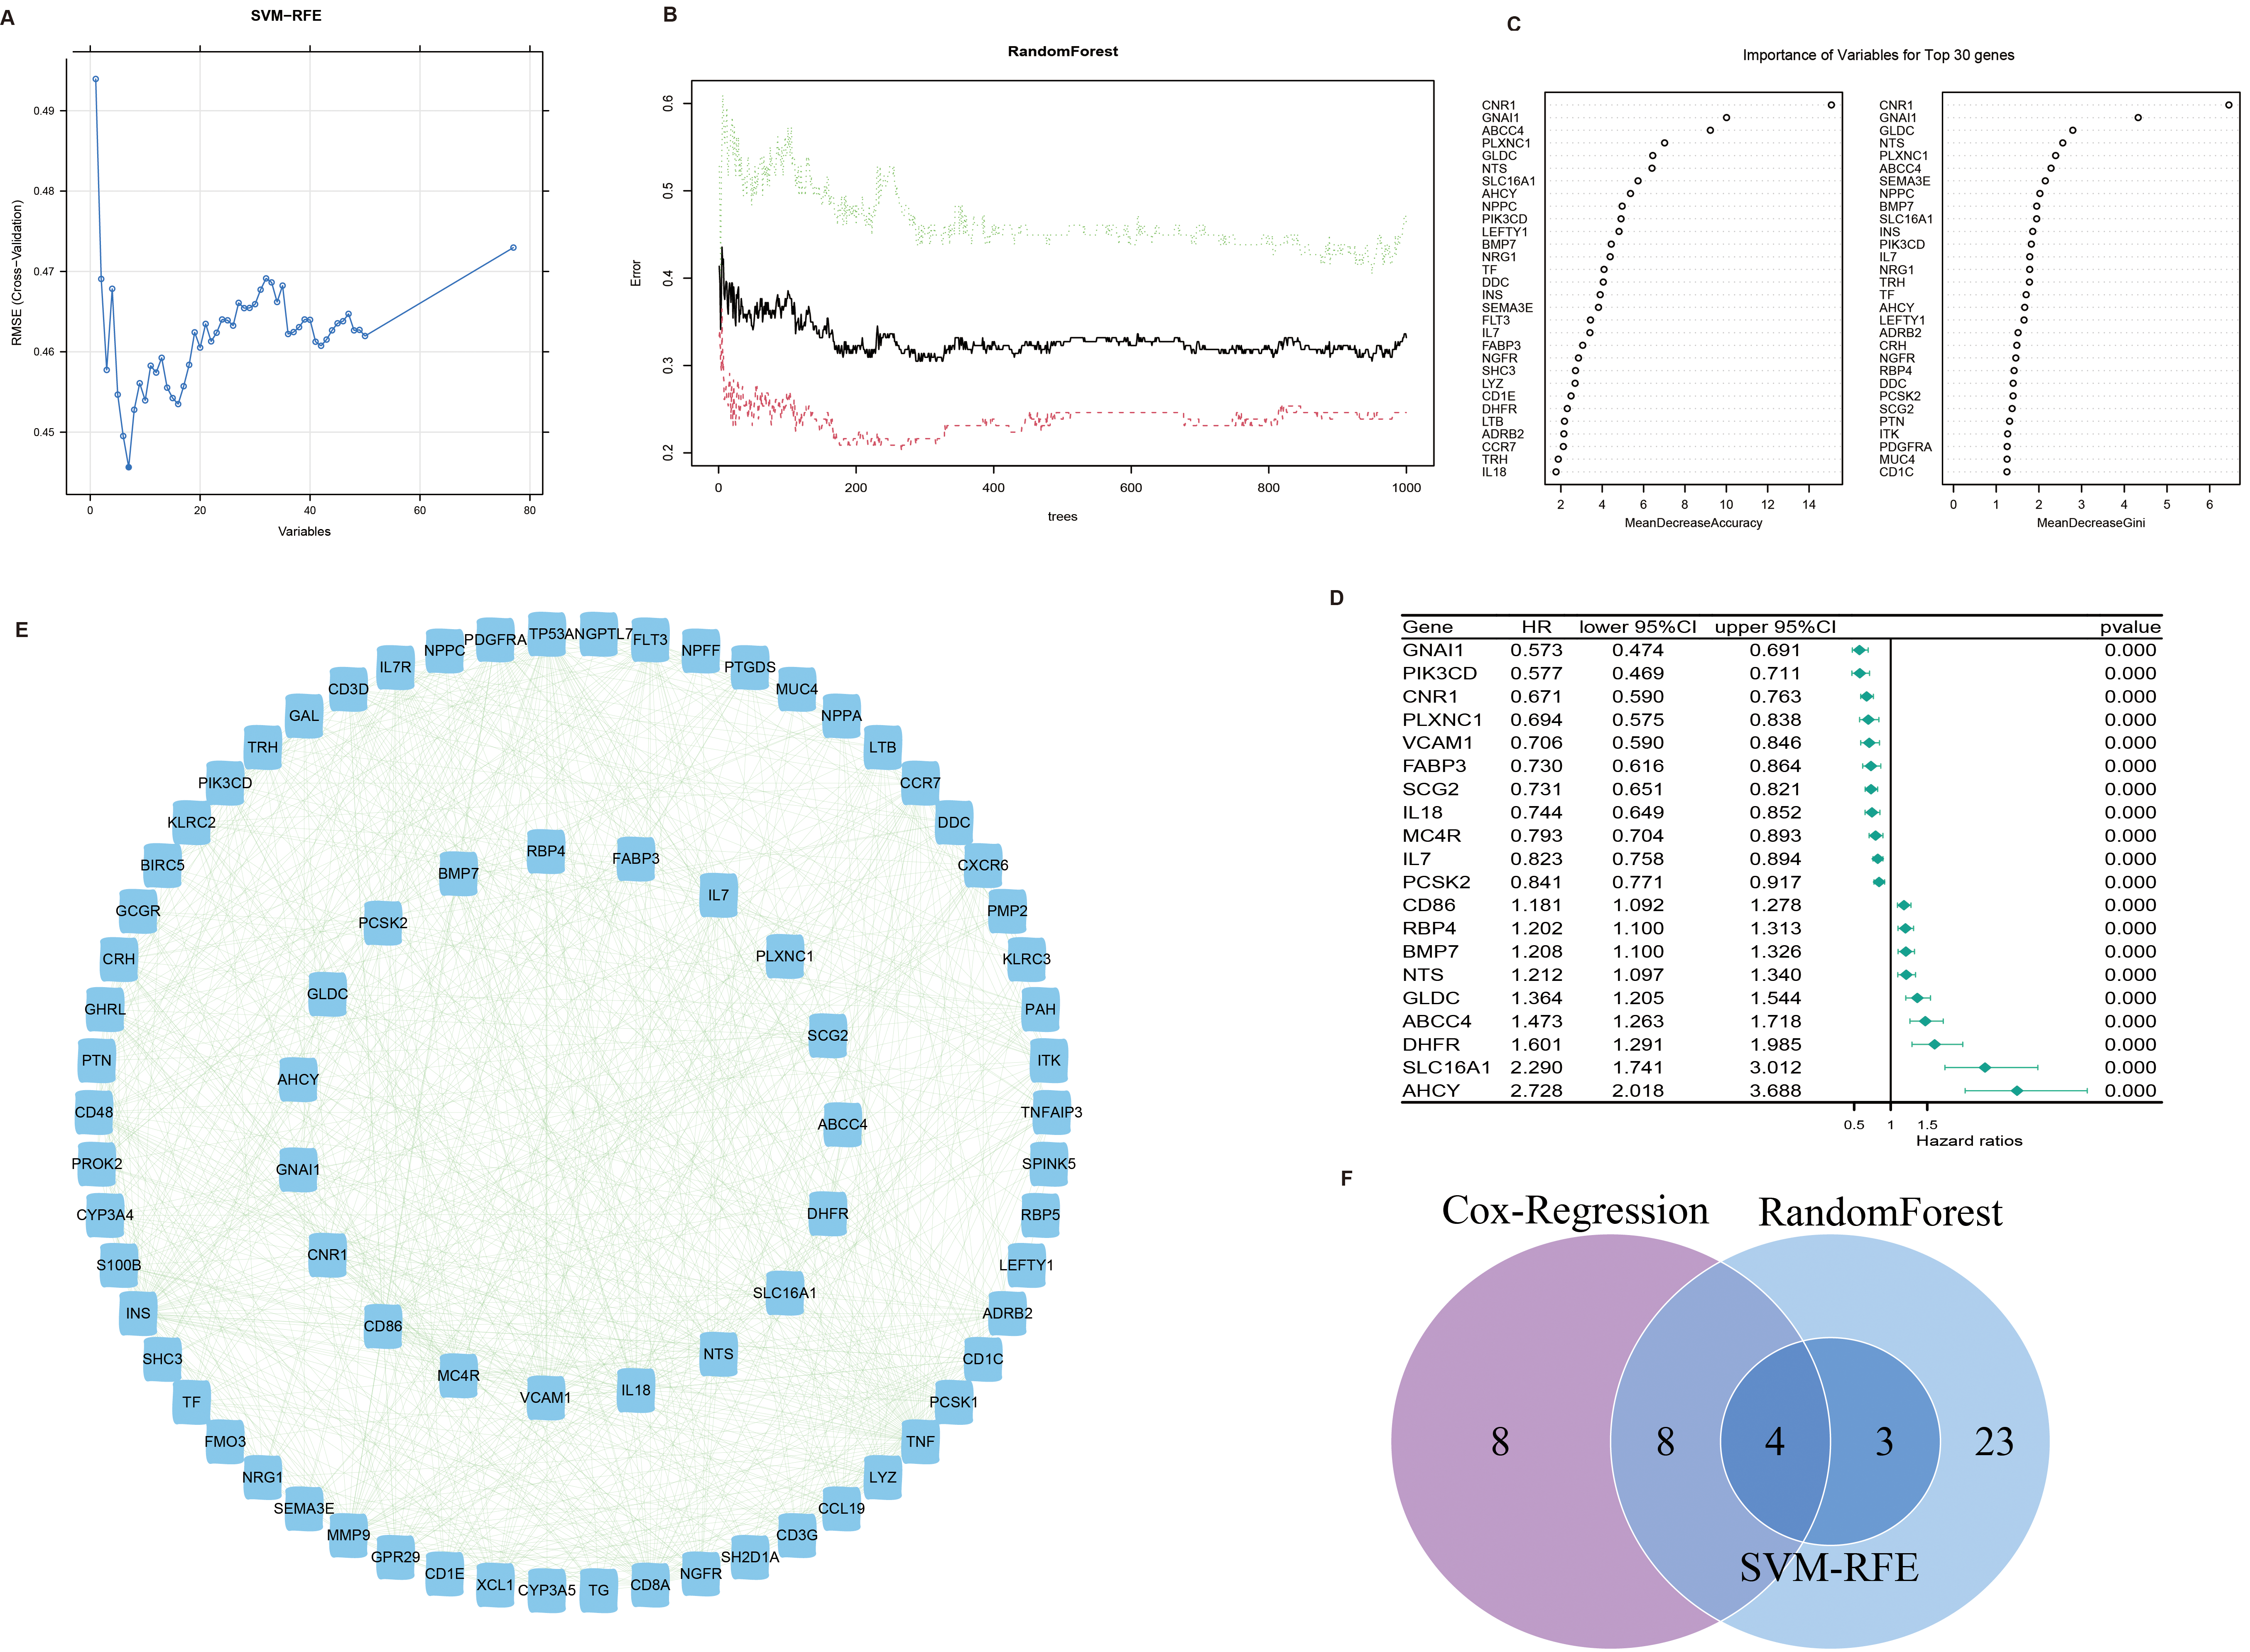
In order to screen out the genes most related to the prognosis of patients with NB to construct a prognosis model, we adopted machine learning method to select genes. We use the function “rfe” in the “caret” package of R software, and set the train method as “svmRadial”. The results showed that the expression data of seven genes selected best predicted the prognosis of the patients (Fig. 3A). Using the “randomForest” package of R software, the optimal number of decision trees and parameters were calculated (Fig. 3B), and these optimal parameters were then used to construct a model that obtained 37 genes (Fig. 3C). Furthermore, 20 genes most associated with the prognosis of patients with NB were selected using univariate Cox regression (Fig. 3D), and the protein-protein interaction of these genes with the differentially expressed IMRGs was shown in a network diagram (Fig. 3E). Finally, we screened out four prognostic genes by intersecting the genes selected by SVM-RFE, RandomFrorest and univariate Cox regression, of which CNR1 and GLDC were metabolism-related genes, while GNAI1 and ABCC4 were immune-related genes (Fig. 3F).
Correlation analysis between prognostic genes and clinical features and immune checkpoints of NB patients. (A–C) Clustering effect of four prognostic genes on TERT gene mutation, MYCN gene amplification and tumor staging using PCA. (D) Correlation of four prognostic genes with five immune checkpoints in the train set. The color of the line represents the correlation between the two, ranging from 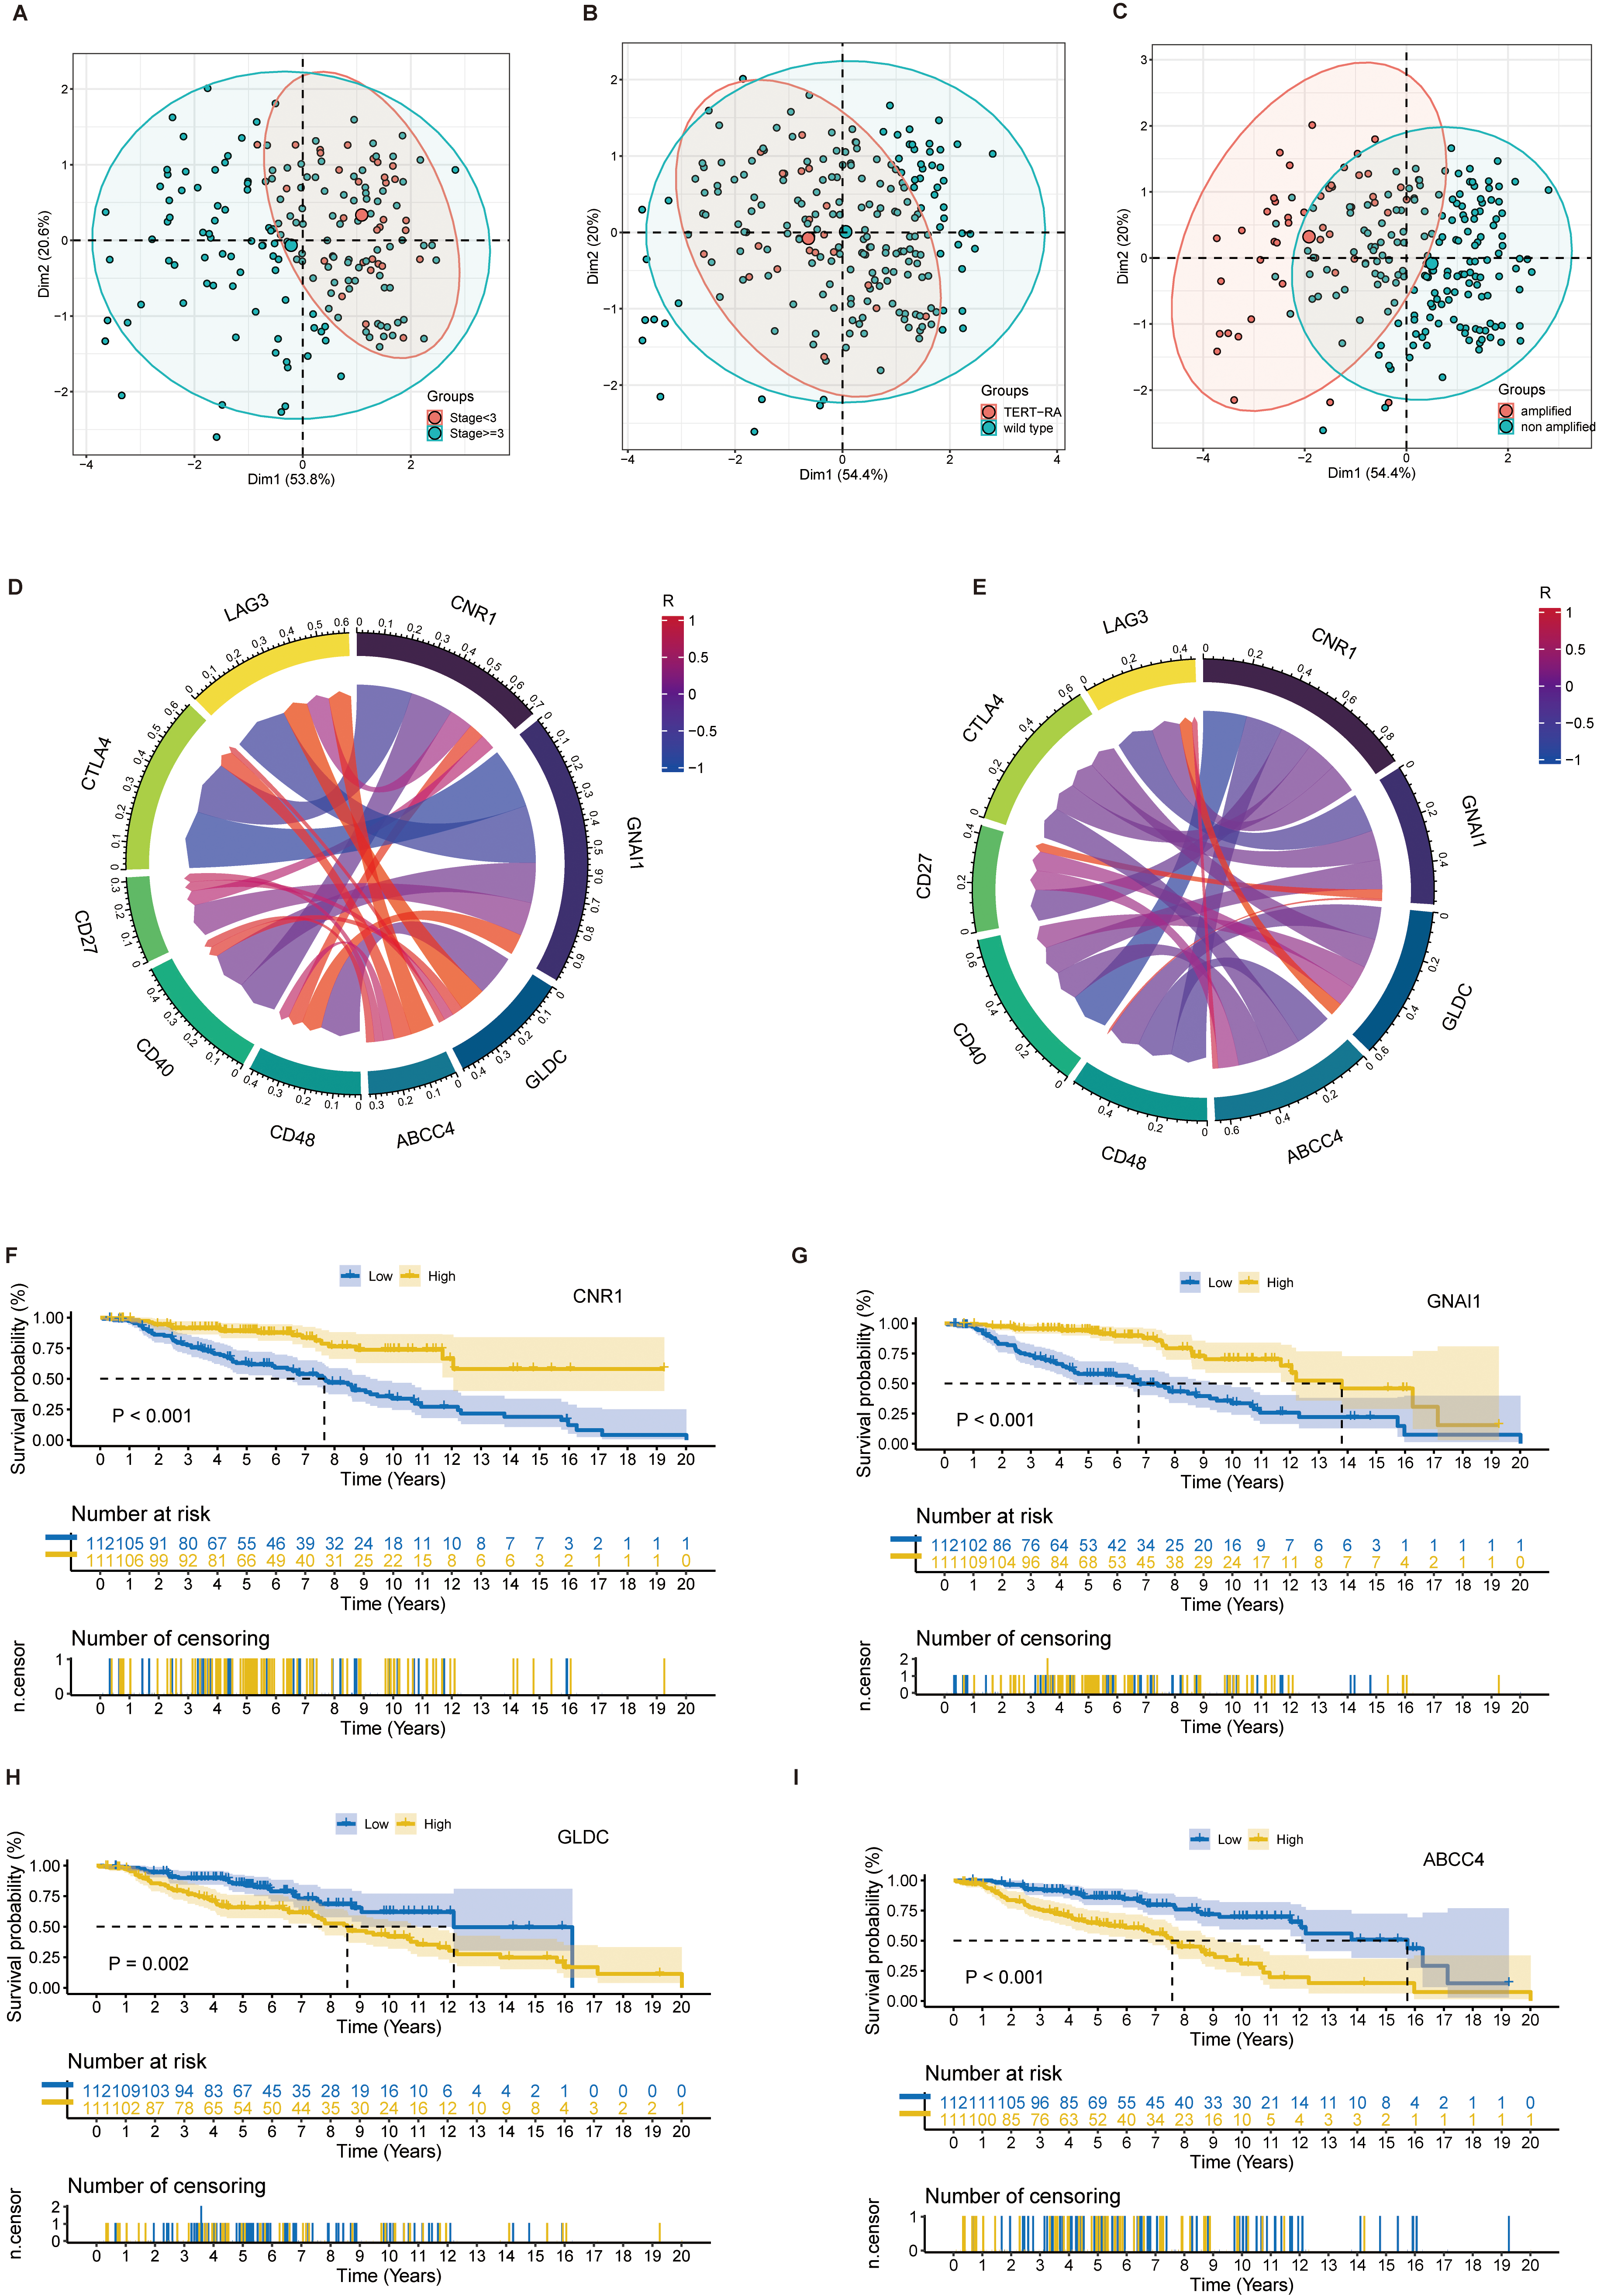
To further explore the role of the four prognostic genes in patients with NB, PCA was used to identify the effect of classification of 4 prognostic genes on the clinical features of NB patients (Fig. 4A–C). The correlation between immune checkpoints (ICs) CD27, CD40, CD48, CTLA4, and LAG3 and the expression of prognostic genes showed that CNR1, GNAI1 tended to be negatively correlated with ICs’ expression, while GLDC and ABCC4 tended to be positively correlated with ICs’ expression in train set (Fig. 4D–E). The Kaplan-Meier (K-M) survival curves of 4 prognostic genes and NB patients were plotted using R software (Fig. 4F–I). The results showed that high expression of GLDC and ABCC4 might lead to poor prognosis in NB patients, while low expression of CNR1 and GNAI 1 might lead to poor prognosis in NB patients.
Establishment of prognostic model. (A) Process of establishing prognostic model using LASSO regression. Each curve in the graph represents the change trajectory of the coefficient of each independent variable, with the ordinate being the value of the coefficient, the lower abscissa being log(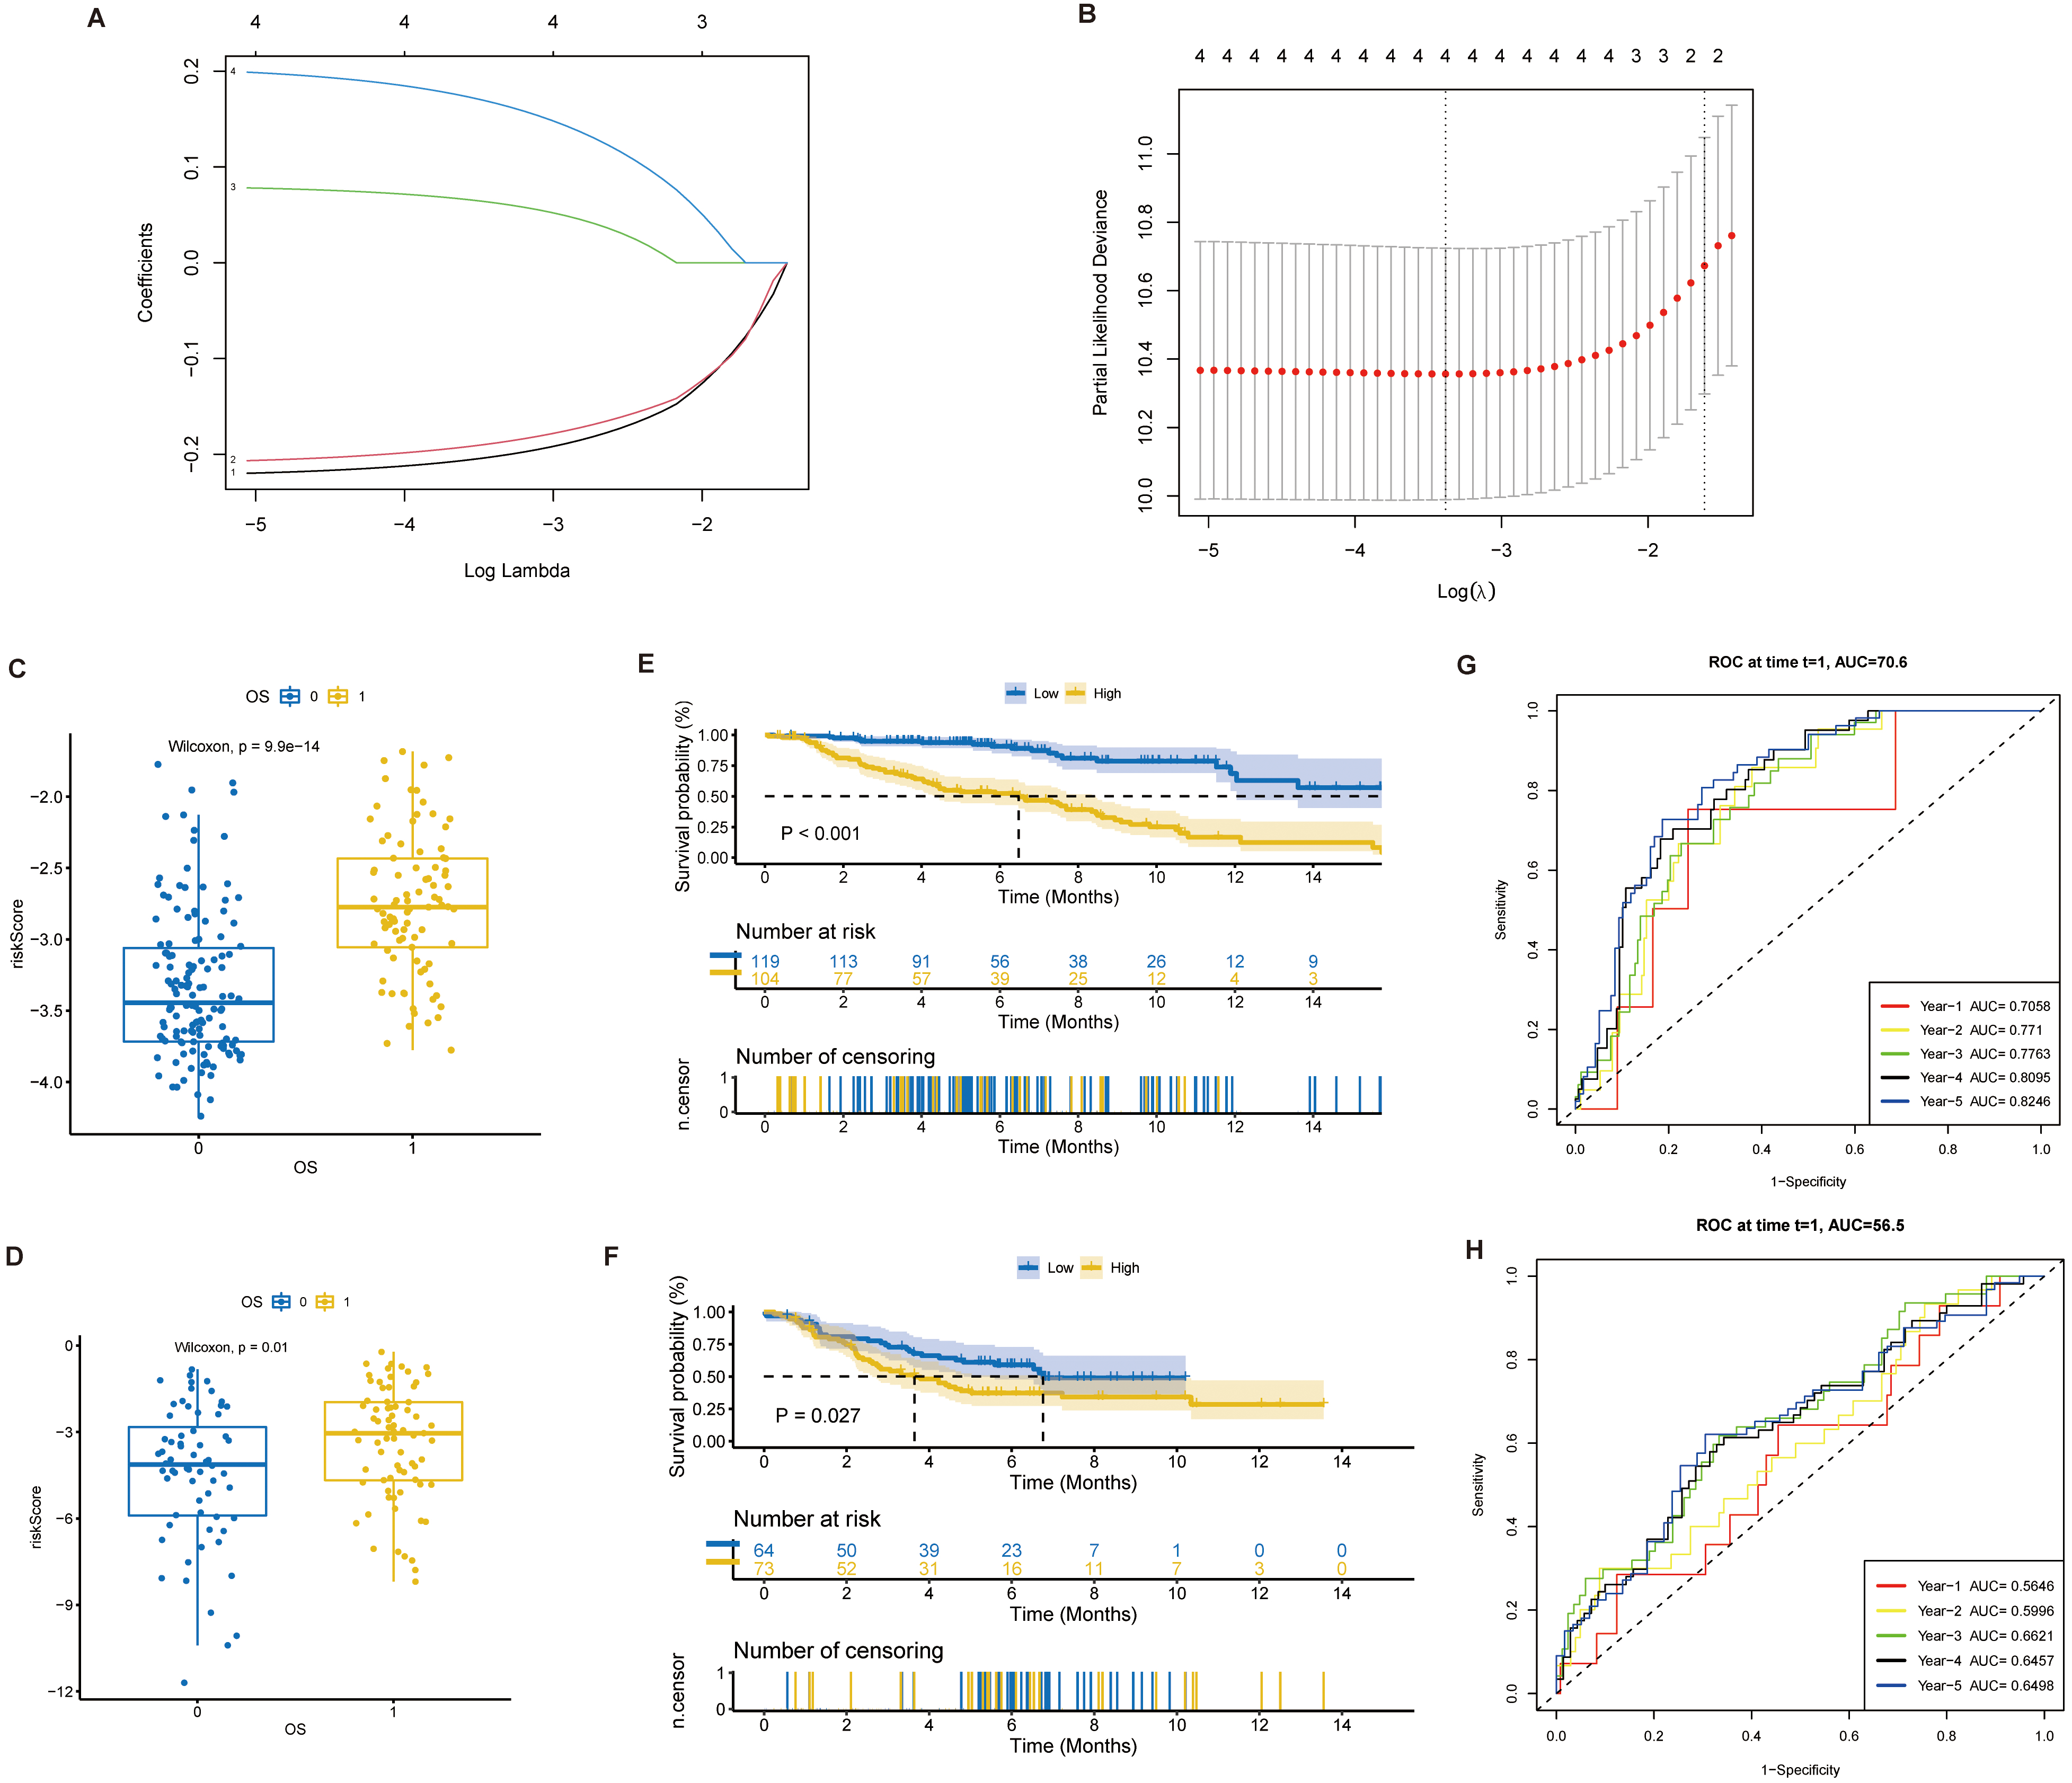
Analysis of prognostic risk scores and clinical features. (A) Correlation between clinical information in train set and test set of univariate Cox regression analysis, risk score and prognosis of NB patients. (B) Nomograms constructed using clinical information and risk scores. (C) Accuracy of nomograms in predicting the prognosis of patients with NB. The abscissa is the Predicted risk, and the ordinate is the Observed risk, ranging from 0 to 1, which can be understood as the incident rate (percentage). The dashed diagonal line is the reference line, that is, the predicted value = the actual value. The red line is a curve fitting line, and the colored parts on both sides are 95%CI. (D, E) Mulberry plots show the distribution of clinical information and risk scores in the train and test sets.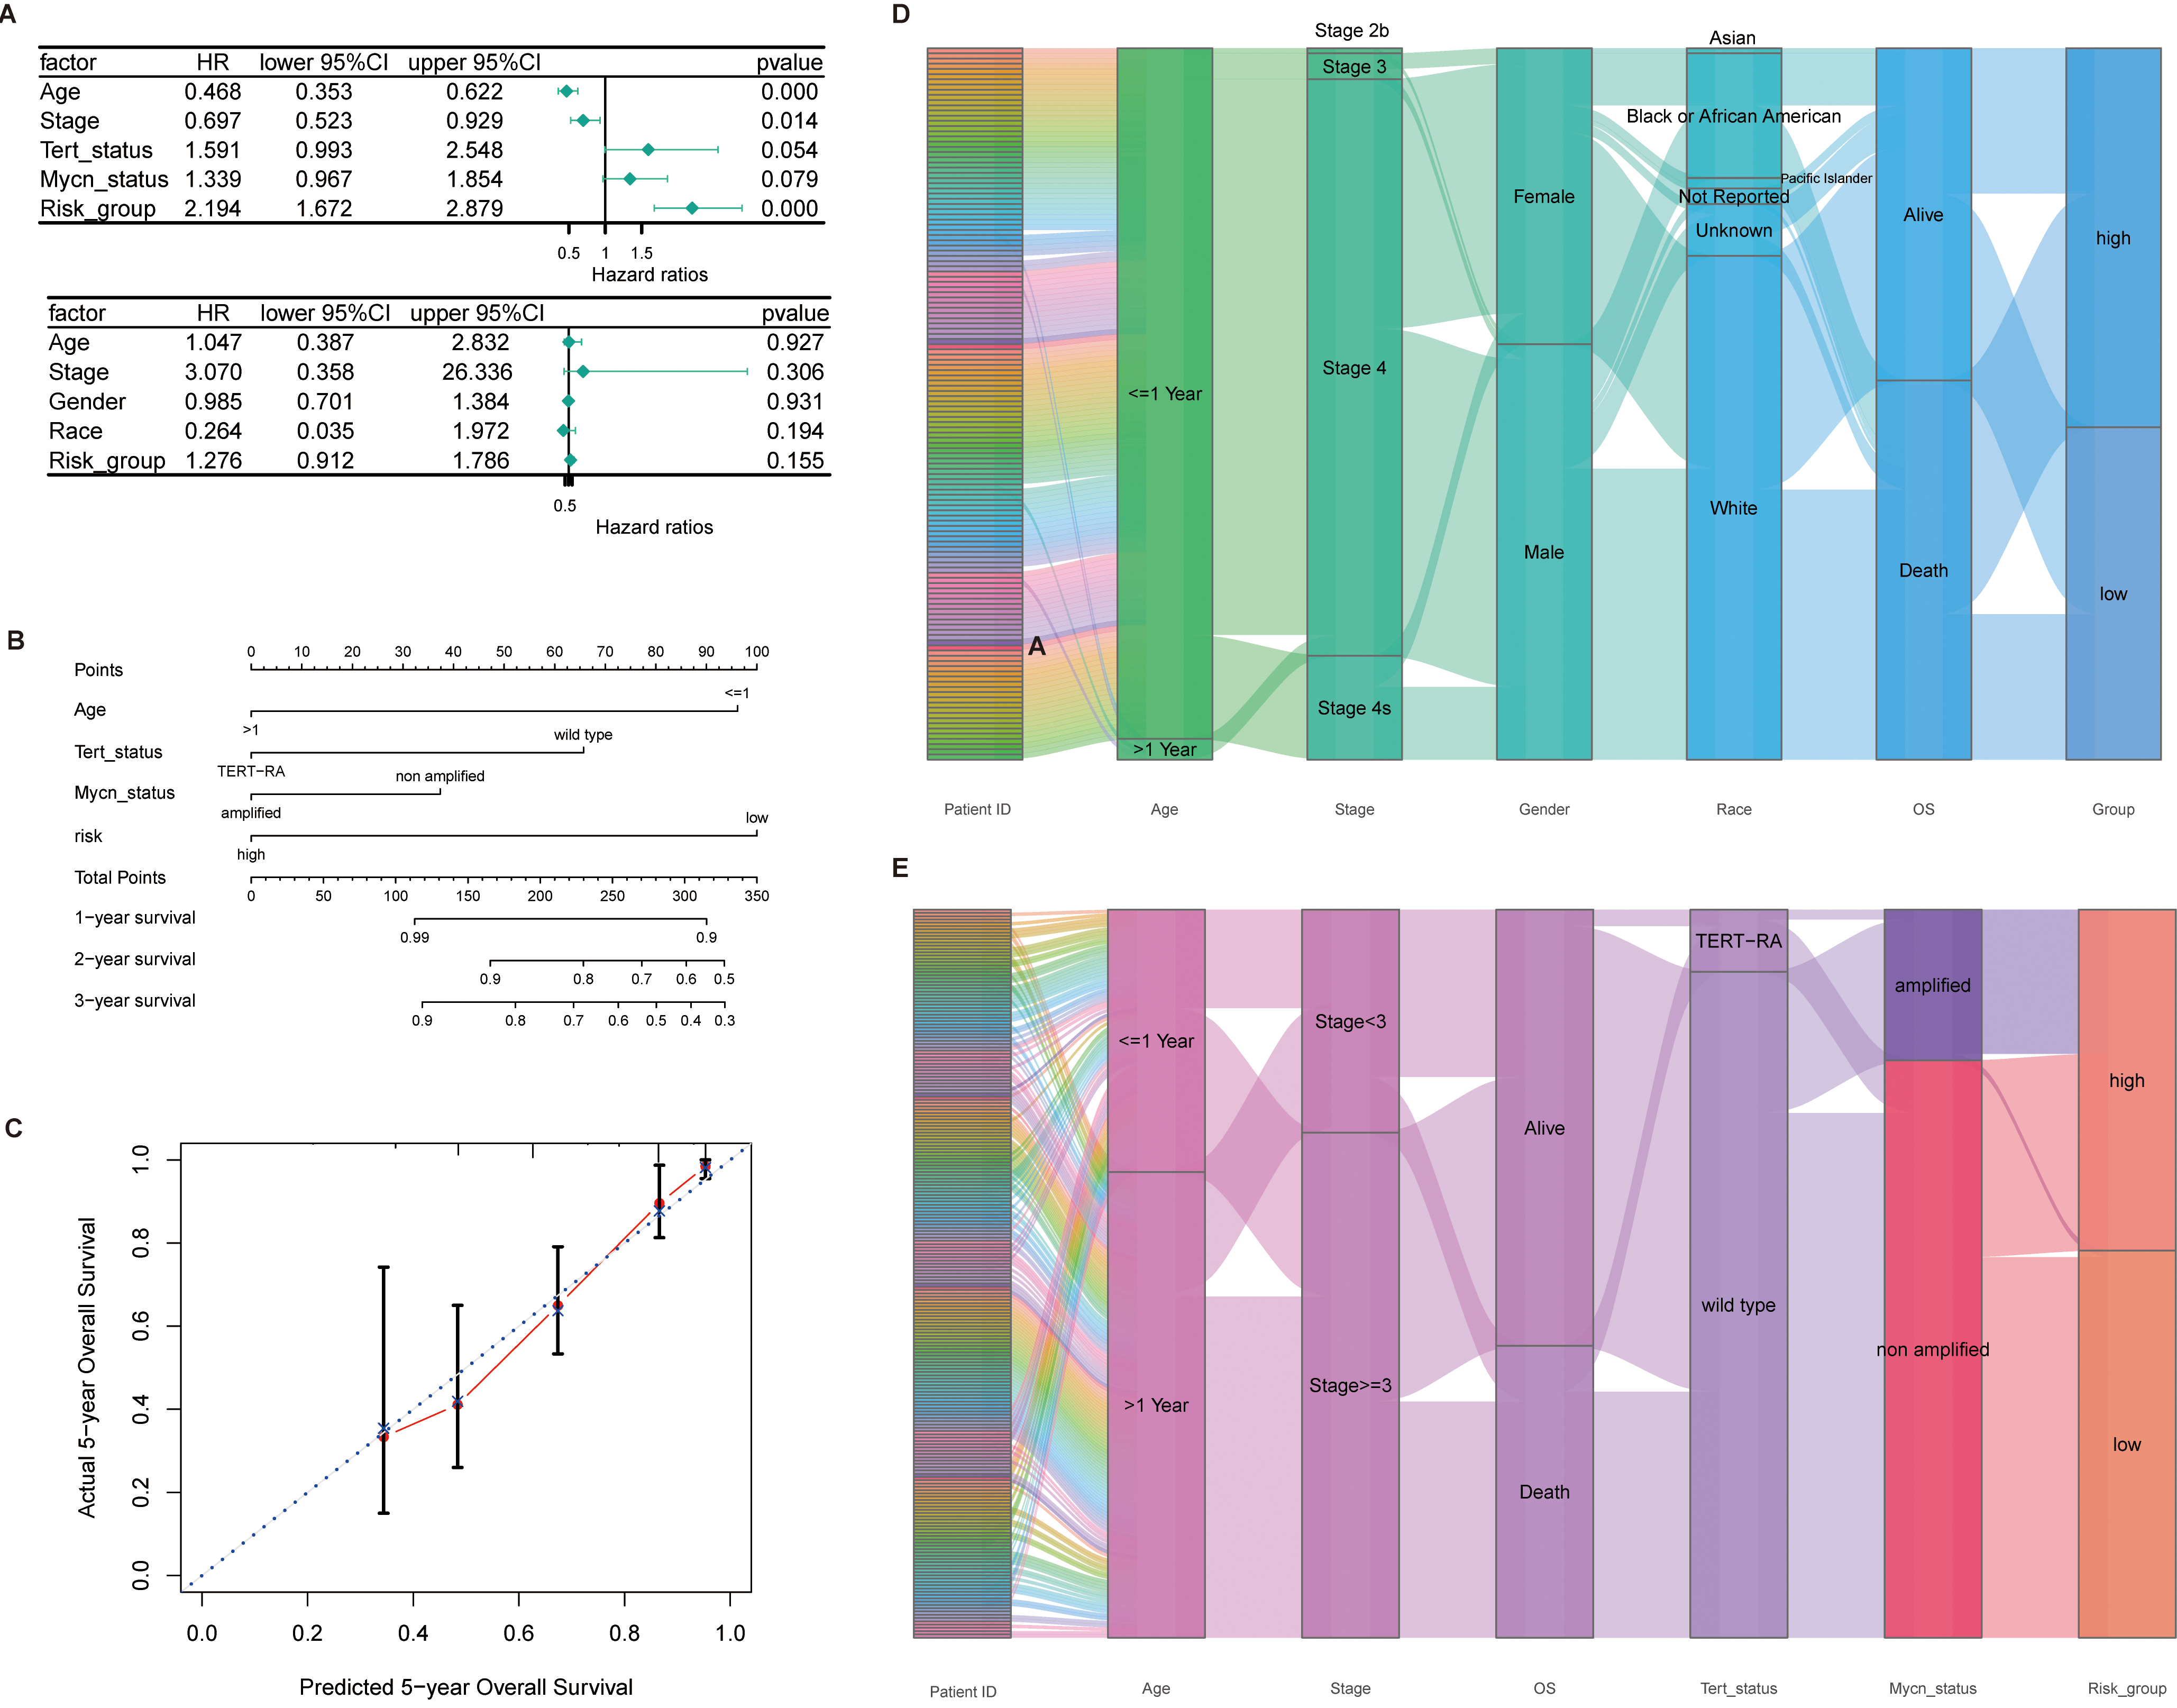
Aiming to further analyze the prognostic role of prognostic genes in NB patients, a prognostic prediction model was constructed using 4 prognostic genes and LASSO regression. The E-MTAB-8248 data set was selected as the train set (
Analysis of immune infiltration. (A, B) Percentage of immune cells in train set and test set. (C, D) Difference of immune cell infiltration between NB patients with higher risk score and lower risk score in train set and test set. (E, F) Stromal Score, Immune Score, ESTIMATE Score, Tumor Purity in the train set and test set.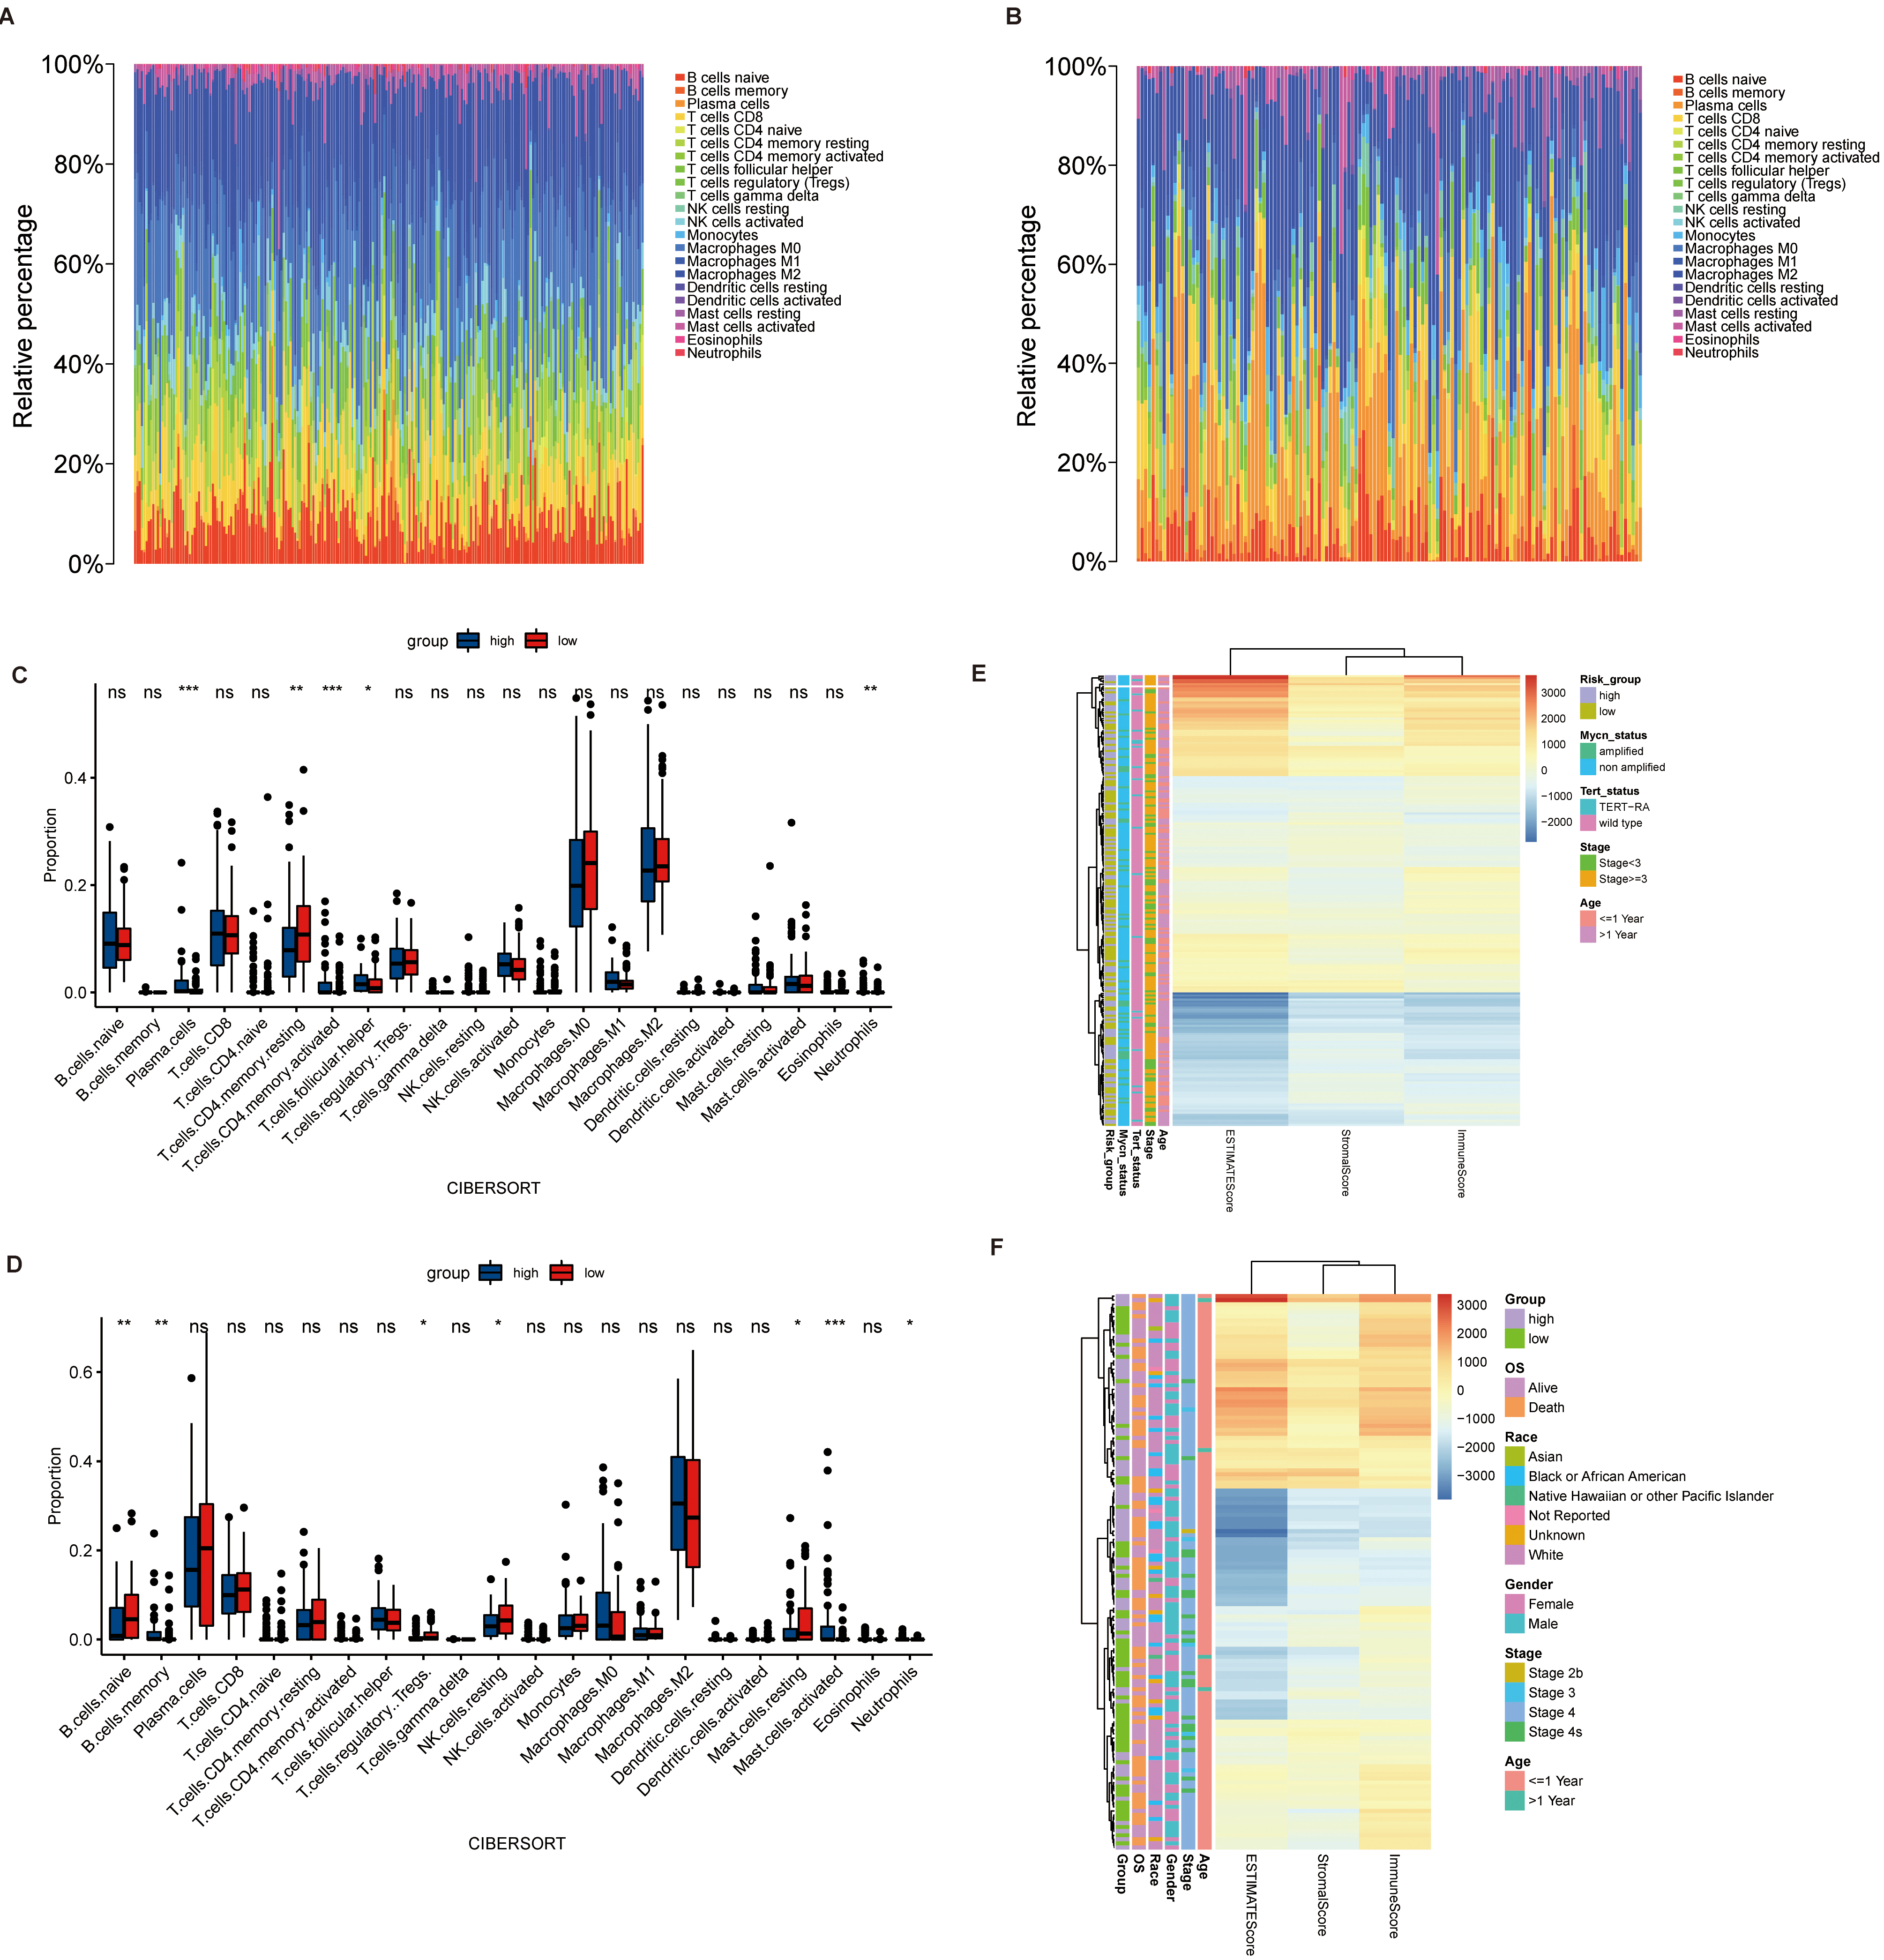
Correlation analysis between prognosis gene and prognosis of NB patients and immune infiltration. (A) Mantel’test analysis of prognosis of NB patients and immune infiltration. (B, C) Risk scores in the train and test sets were higher than the stemness index for NB patients with low risk scores. (D, E) Radar diagram of correlation between four prognostic genes and immune score, matrix score, estimated score and stemness index in the train set and test set. (F) Correlation network diagram of four prognostic genes and 22 immune cells.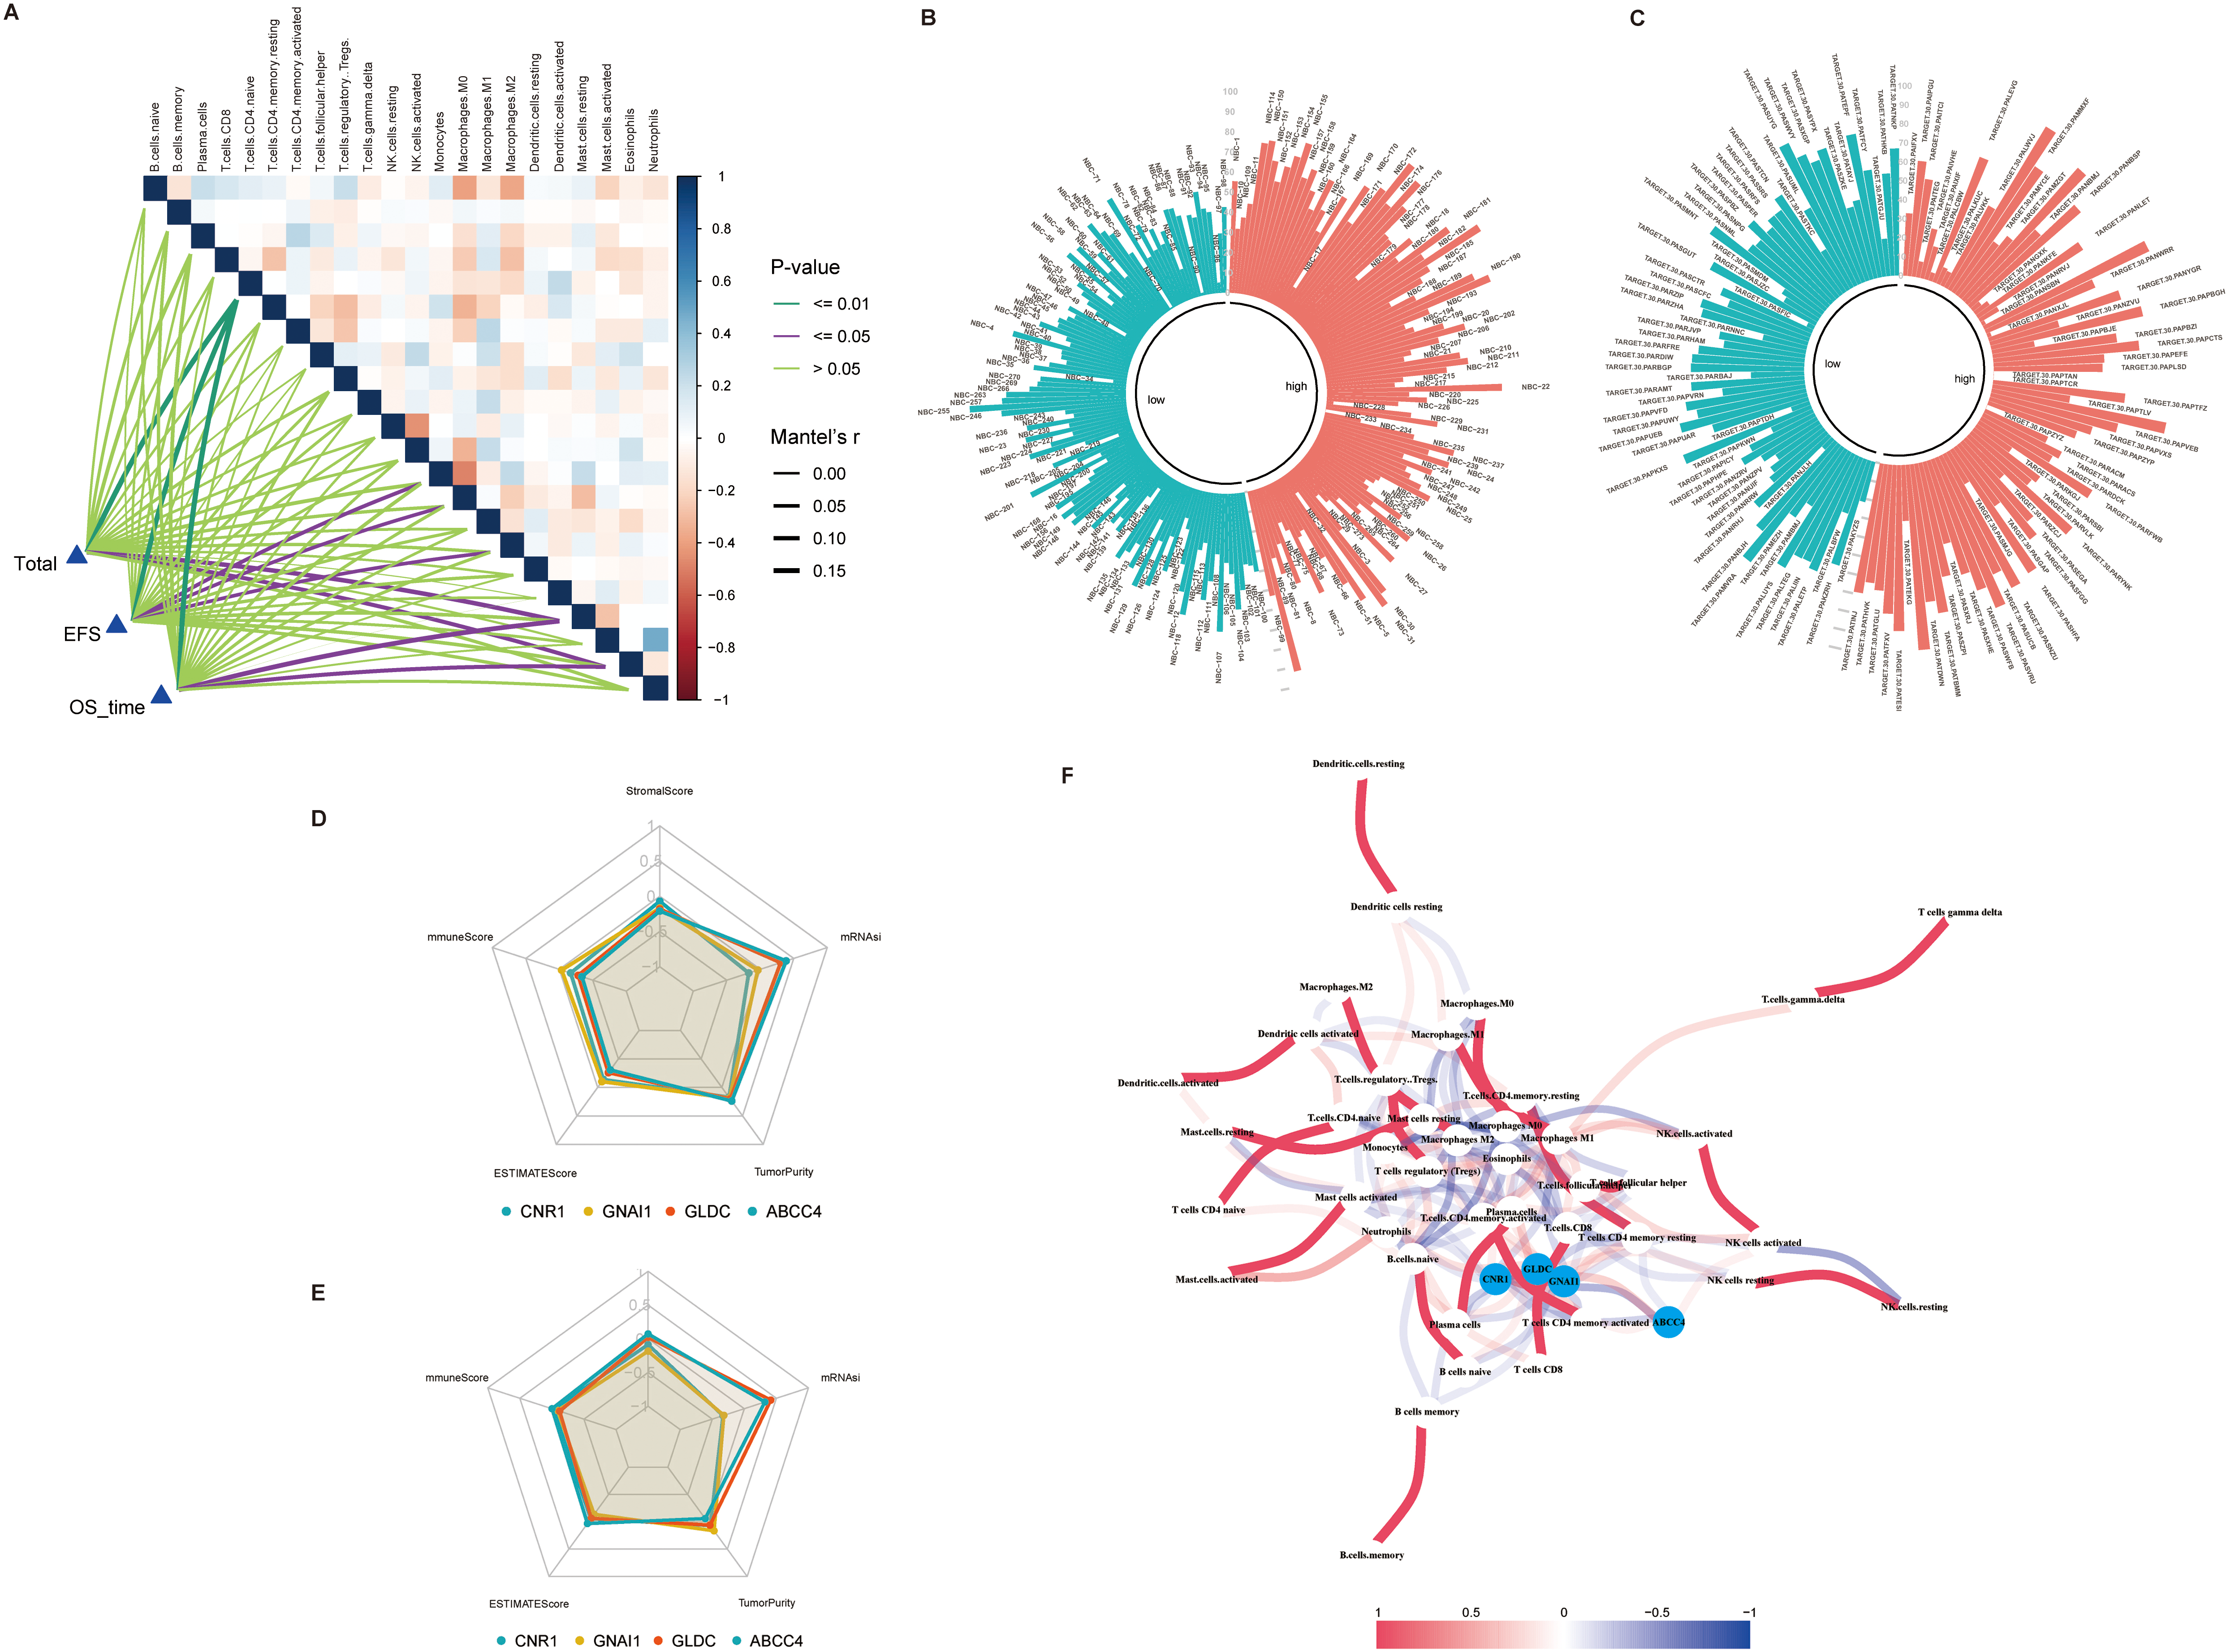
The analysis of immune infiltration and stemness in patients with NB can provide new ideas for the pathogenesis and treatment of NB. The immune infiltration of NB patients was calculated using the R package “CIBERSORT” (Fig. 7A–B). By grouping the prognosis models, we compared the differences in immune infiltration between the two groups, which shows that in the train set, the infiltration of Plasma cells, T.cells.CD4.memory.resting, T.cells.CD4.memory.activated, T.cells.follicular.helper and Neutrophils was significantly different between the two groups, while B.cells.naive, B.cells.memory and T.cells.regulatory and Tregs differ significantly in the test set (Fig. 7C–D). The “estimate” package was used to calculate the Stromal Score, Immune Score,ESTIMATE Score and Tumor Purity for patients with NB. The relationship of these scores to the clinical features of NB patients was also shown (Fig. 7E–F). The correlation between immune infiltration cells and the patient’s prognosis was analyzed via mantel’test, which showed that T.cells.CD4.naïve was most relevant to the prognosis of patients with NB (Fig. 8A). Besides, the stemness index of NB patients was calculated by the stemness index calculation model (Fig. 8B–C), which revealed a trend towards higher stemness index in NB patient with a high risk score. At last, we analyzed the association of the 4 prognostic genes with the Stromal Score, Immune Score, ESTIMATE Score, Tumor Purity and stemness index (Fig. 8D–F).
Screening of key genes for immune infiltration and stemness
Genes related to Stromal Score, Immune Score, ESTIMATE Score, Tumor Purity and stemness index screened using WGCNA. (A) Determination of soft threshold and power values. To determine the optimal soft threshold, we mainly refer to the left figure, that is, the scale-free fit index (Y axis) under different soft thresholds (X axis). The red line indicates the value of the subjectively selected scale-free fitting index, as shown in figure 0.9. When the scale-free fitting index is 0.9, the minimum soft threshold for constructing scale-free network is 4, so 4 can be selected as the optimal soft threshold for subsequent analysis. The figure on the right shows the network connectivity under different soft thresholds. (B) Cluster tree diagram of the patient’s gene. Each branch in the diagram represents a gene, and each color below represents a co-expression module. (C) clustering tree diagram of NB patients and correlation heat diagram of clinical characteristics. (D) Heatmap of modules correlation with Stromal Score, Immune Score, ESTIMATE Score, Tumor Purity and stemness index. (E) GO enrichment analysis of Brown and Turquoise modules.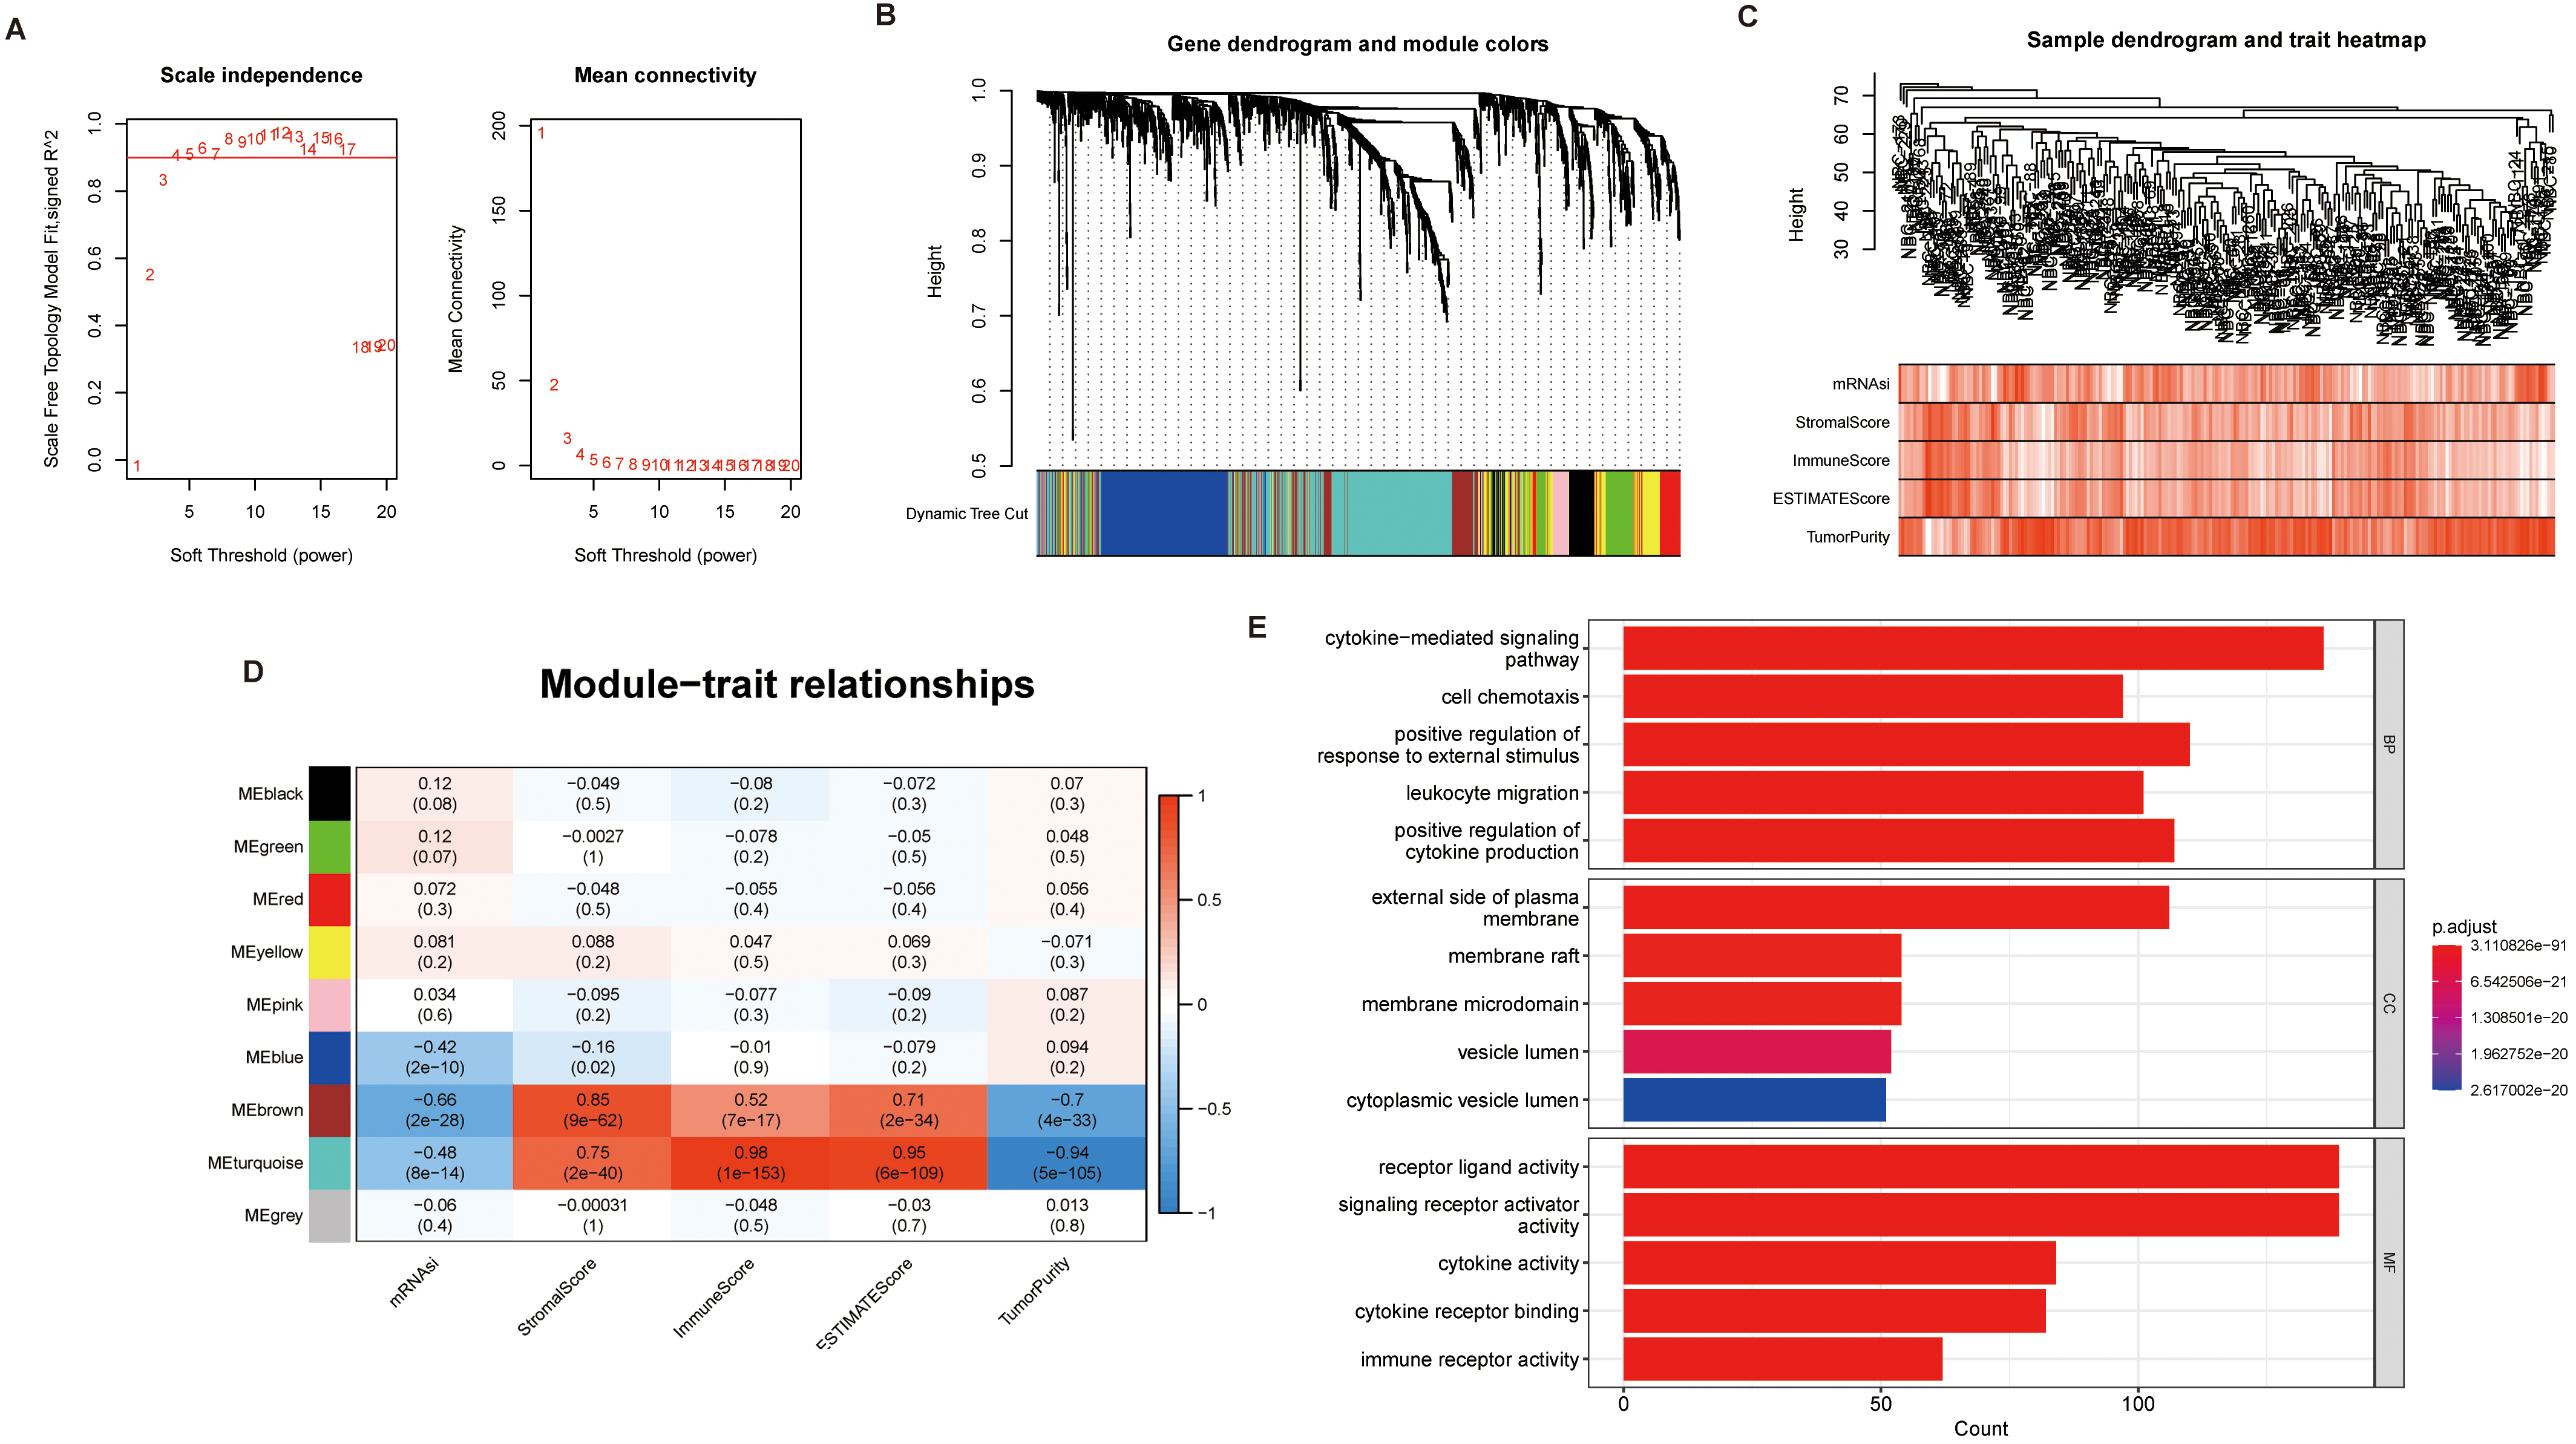
Enrichment analysis of the genes selected by WGCNA. (A) KEGG Analysis Results. (B) GSEA Results. (C) Protein-protein interaction network diagram for the 10 genes with the highest MCC scores calculated by the “Cytohubba” plug-in.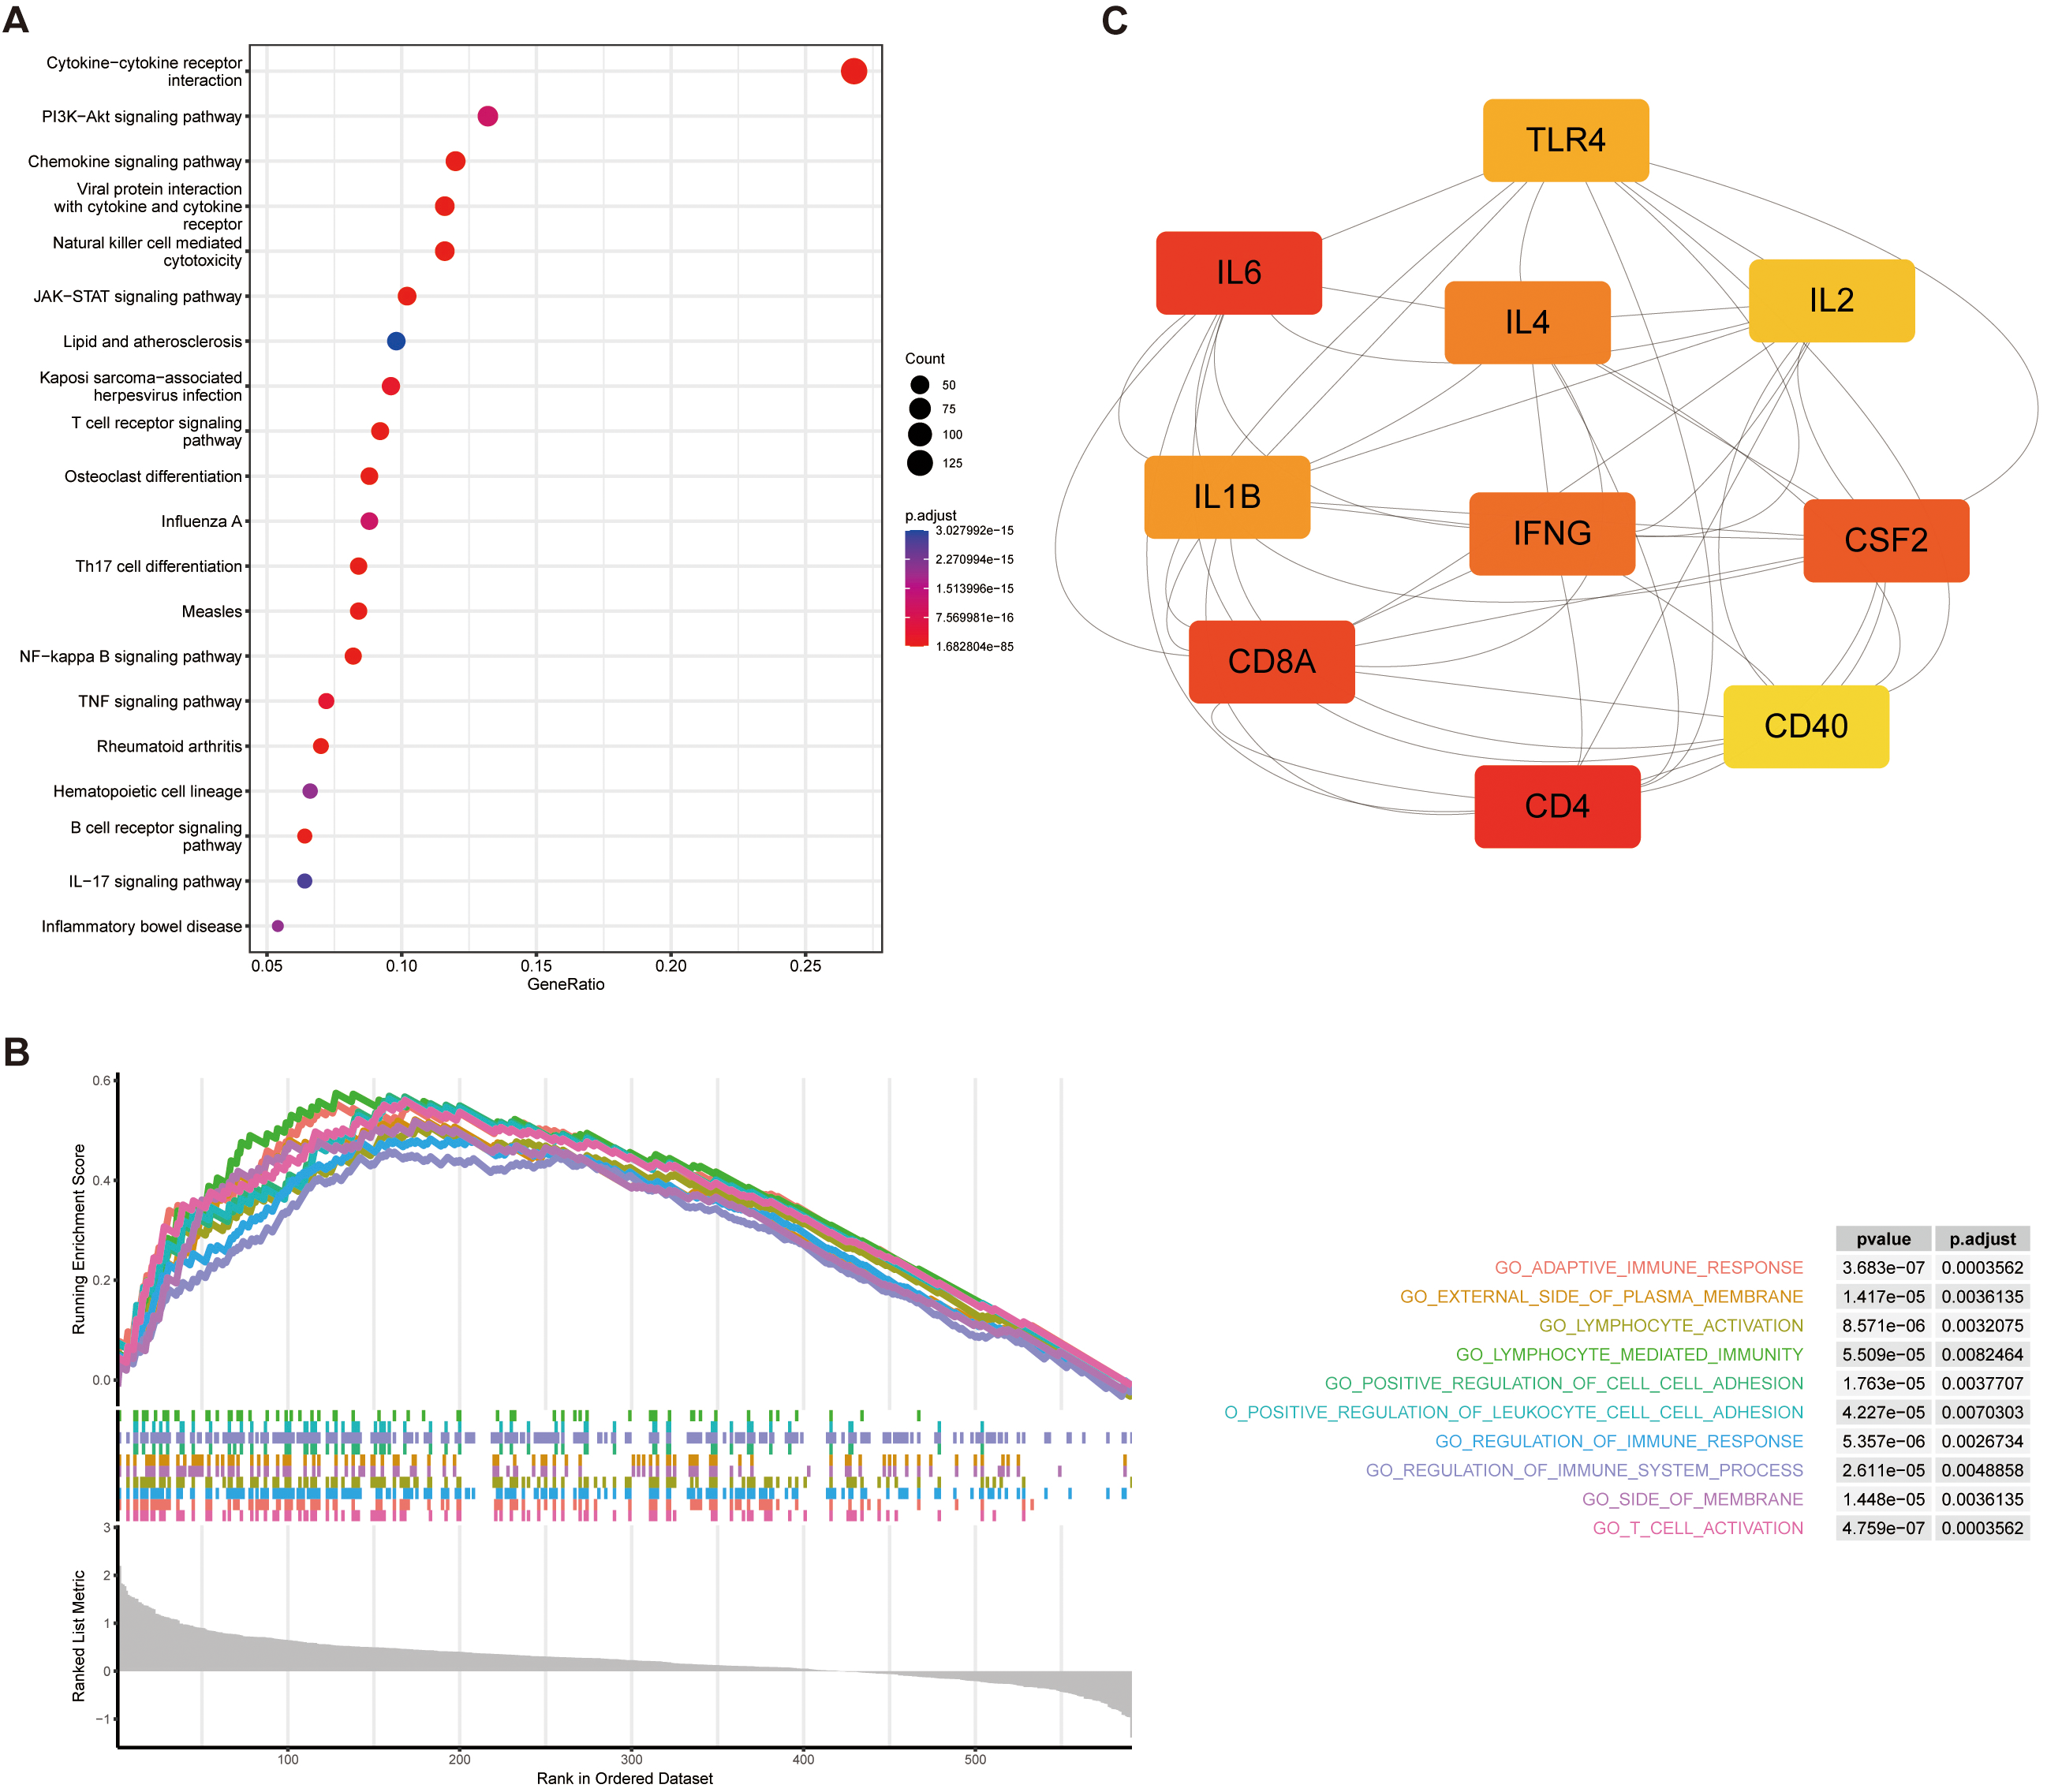
The identification of key genes may provide potential targets for the treatment of patients with NB. The IMRGs were clustered into different modules, each containing multiple genes, using the R software “WGCNA” package. To begin with, the best soft threshold was found and set to 5 (Fig. 9A) and the adjacency matrix and TOM are established accordingly (Fig. 9B). Subsequently, the clustering of NB patients and the correlation analysis between immune infiltration and stemness were performed (Fig. 9C). Then, a total of 9 modules were identified. Correlation Analysis between each module and the immune infiltration and stemness showed that the module brown and turquoise had a significant positive correlation with the Stromal Score, Immune Score, ESTIMATE Score, and a significant negative correlation with the Tumor Purity and stemness index (Fig. 9D). We selected genes from the brown module and turquoise module, and conducted gene enrichment analysis using GO enrichment analysis, KEGG enrichment analysis, and GSEA. GO enrichment results showed that the two modular genes were mainly enriched in the cytokine-mediated signaling pathway and receptor ligand activity (Fig. 9E). The KEGG enrichment results showed that the two modular genes were mainly enriched in the cytosine receptor interaction, PI3K-Akt signaling pathway, Chemokine signaling pathway (Fig. 10A). GSEA results showed genes enriched in lymphocyte-activated, lymphocyte-mediated immunity (Fig. 10B). The Cytoscape software Cytohubba plug-in was used to select the key genes. According to results analyzed by the ‘Cytohubba’, the top 10 genes with the highest MCC scores were selected as the hub genes (Fig. 10C).
NB is a cancer of the sympathetic system and represents the most common extracranial solid tumor in childhood [43, 44]. Although spontaneous regression is observed in certain cases, others with MYCN amplification metastasize rapidly and result in a large number of deaths [45]. These high-risk metastatic NBs have characteristics of cold tumors since the native immune response is considered inactive in the anti-tumor process. With a better understanding of NB, novel immunotherapy using anti-GD2 antibody has been invented, opening a new era for NB treatment [46]. The survival rate of high-risk NBs has increased to 50% while most patients suffer from adverse effects after multimodal treatment like chemotherapy, surgical resection or radiotherapy [47]. Moreover, relapse and substantial neuropathic pain caused by anti-GD2 antibody are still challenges [48]. Cancer metabolism was a concept popularized by Otto Warburg nearly 100 years ago. Nowadays, researchers realize that it is not only comprised of intrinsic metabolic alterations of cancer cells but involved with metabolic demands of immune and other normal cells in the tumor microenvironment (TME) [49]. The interaction of metabolic reprogramming between cancer and immune cells is regarded as a pivotal determinant in anti-tumor immune response [50]. Therefore, a meticulous study on IMRGs in NB may give us an opportunity to have insights into tumorigenesis and help us develop innovative immunotherapy and improve the prognosis of NB patients.
In this study, we first identified differentially expressed IMRGs and performed enrichment analysis on them. Then, machine learning algorithm was used to screen out the possible prognostic genes and LASSO regression was used to establish a prognostic model, and the prognostic risk score was calculated using the prognostic model. In addition, as much progress has been made in tumor studies with tumor stemness and immune infiltration, the genes most significantly associated with NB stemness index and immune score were identified with WGCNA.
Enrichment analysis results showed that the differentially expressed IMRGs were enriched in the lymphocyte differentiation, T cell differentiation, and monocyte differentiation pathways. Significant inhibition of CD4+T lymphocyte differentiation has been shown in 9,10-secosteroids [51]; dendritic cell 2 analog iloprost treated with prostaglandin I promotes antigen-specific regulatory T-cell differentiation in mice [52]; the QKI subtype controls cell differentiation by regulating alternative splicing, mRNA stability, and translation [53]. What’s more, analysis of immune infiltration also revealed significant differences in CD4+T cell infiltration between the two groups with different risk scores. The above results indicated that there were specific drugs to regulate immune cell differentiation, which might also be a potential target for drug treatment of NB.
We constructed a prognostic model based on four IMRGs (CNR1, GNAI1, GLDC, and ABCC4). Results illustrated through the KM survival curve show that low CNR1 and GNAI1 expression or high expression of GLDC and ABCC4 is related to poor prognosis in NB patients. CB1, expressed by CNR1, is a cannabinoid receptor in the endocannabinoid system (ECS) and a member of the G-protein coupled receptor (GPCR) family [54]. Researchers found that CB1 receptors are expressed by various immune cells and may regulate liver metabolism [55]. Its ligand endocannabinoid (EC) impacts tumorigenesis and immune response [56]. Moreover, CB1-specific agonists suppress proliferation and vascularization while enhancing apoptosis in non-small cell lung cancer (NSCLC) by inhibiting phosphorylation of AKT [57], indicating CB1 may be a novel target in NSCLC treatment. A similar correlation between CB1 expression and the AKT signaling pathway is also observed in prostate cancer [58]. However, no study has elucidated the mechanism of CNR1 in NB development. Further study should be investigated on the relationship between CNR1 and NB. The guanine nucleotide-binding protein G(i),
Cancer stem cells (CSCs) can maintain tumors by manipulating genetic and non-genetic factors to metastasize, resist treatment, and maintain the tumor microenvironment. Understanding the key features and mechanisms of CSCs is conducive to improve patients’ prognosis by improving prognostic models and treatments [80]. In recent years, there have been many reports on the interaction between immunity and stemness in tumors. For example, cancer cells evade the immune system by epigenetic reprogramming to increase stemness [81]. In our study, WGCNA was used to identify the gene modules with the most significant correlation with NB stemness index and immune score, and the selected gene modules were found to be significantly positively correlated with Stromal Score, Immune Score, and significantly negatively correlated with stemness index and Tumor Purity, indicating that the genes contained in these modules might lead to a good prognosis for patients.
Conclusion
In conclusion, we developed an IMRGs-based model for the prognosis of NB patients and has a brilliant effect of prediction. Further, the pivotal genes which also play a crucial role in the immunity and stemness of NB were screened out, which may be used as new sites for the research on the mechanism of NB in the future. The above results illustrate the primary role of IMRGs in NB. However, these conclusions are based on the analysis of data from public databases, and further large-scale experiments are needed to verify them in further studies.
Abbreviations
Data and code availability
This study analyzed publicly available data sets. 3 datasets were selected from GEO (
Author contributions
J.M. contributed to research design and data analysis. J.G. assisted editing and sorted data. P.L. and M.Z. assisted in the revision of manuscripts and documentation of references. K.W directed the project, revised the manuscript, and provided writing guidance. All authors contributed to the revision of the manuscript and read and approved the submitted version.
Funding
This study was supported by the Guangdong Basic and Applied Basic Research Foundation of China (Grant No. 2019 A1515011086) and College Students’ Entrepreneurship and Innovation Training Program (Grant No. 2022 12121229).
Ethics approval and consent to participate
Not applicable.
Consent for publication
Not applicable.
Competing interests
The authors declare that they have no competing interests.
Supplementary data
The supplementary files are available to download from
sj-xlsx-1-cbm-10.3233_CBM-230119.xlsx - Supplemental material
Supplemental material, sj-xlsx-1-cbm-10.3233_CBM-230119.xlsx
sj-xlsx-2-cbm-10.3233_CBM-230119.xlsx - Supplemental material
Supplemental material, sj-xlsx-2-cbm-10.3233_CBM-230119.xlsx
Footnotes
Acknowledgments
Not applicable.