
Abstract
Background
Neuroblastoma (NB) development is significantly impacted by telomere maintenance where telomerase activation acts as the triggering factor. The study demonstrated the practical use of telomerase activation-related genes in the diagnosis and prognosis of NB.
Methods
Weighted Gene Co-expression Network Analysis (WGCNA) and differential analysis were used to screen for prognostic-related genes in NB. Telomerase activation-related genes (TARG) were identified using Genecard and then intersected with the prognostic-related genes to obtain telomerase activation-related NB prognostic genes. The key prognosis genes were pinpointed by random forest and Lasso Cox analysis and confirmed by bioinformatics methods. Then RT-PCR experiments were employed to verify the differences in WNT4 and RPL22L1 gene expressions in tissue samples. The impact of the risk gene on NB cell proliferation, migration, and invasion was confirmed using CCK-8, Wound-healing assay, and Transwell assay.
Results
PRPH, RPL22L1, ODC1, ALK, NTRK1, ALCAM, and WNT4 were the seven key telomerase prognostic genes that were found by Lasso cox analysis and confirmed by external datasets in NB. Their expression levels varied in INSS stages, age, and high-risk and low-risk groups, as indicated by the validation results. Subsequently, two previously unverified genes, RPL22L1 and WNT4, were selected to construct a multifactor regression model combined with various clinical features to predict the mortality risk. RPL22L1 was ultimately chosen and confirmed to promote NB cell proliferation, migration, and invasion in vitro.
Conclusion
Telomerase activation is strongly linked to the onset and progression of NB. A multivariate regression model using the genes RPL22L1 and WNT4 proved effective in evaluating the prognosis of NB. The new molecular marker RPL22L1 can inhibit the NB cell proliferation, migration, and invasion, making it beneficial for the early diagnosis of high-risk NB.
Introduction
Neuroblastoma (NB) is a heterogeneous solid tumor that originates from the sympathetic nervous system. It is the most common extracerebral solid tumor in children, accounting for about 6% of all children's malignancies.1,2 Advancements in radiotherapy, chemotherapy, precise surgical treatment, immunotherapy, and CART treatment have greatly increased the survival rate of NB. Yet, the mortality rate of advanced-stage NB remains significant due to its high degree of malignancy and insidious onset. Especially for high-risk patients, the prognosis is poor despite the use of multiple intensive treatments. Hence, it is necessary to explore the pathogenesis of NB from a new perspective, find new therapeutic targets, and develop new treatments that are less toxic and more effective.3–5
Telomerase activity targeting is a new approach to treating high-risk NB. 6 Telomere maintenance (TM) is crucial for the unlimited proliferation of cancer cells. 7 Telomeres consist of short, repetitive, non-transcribed sequences (TTAGGG) and several associated proteins, forming a unique structure that protects chromosome ends from fusion and degradation. Telomeres are closely related to cell apoptosis, transformation, and immortalization, typically maintained through the activation of telomerase. 8 The top three genetic alterations in high-risk NB (MYCN amplification, TERT promoter rearrangement, and ATRX inactivation) stimulate increased telomerase expression. MYCN, as a transcription factor that induces transcriptional and epigenetic reprogramming, shows high expression of TERT in NB with this gene amplification. 9 This gene can stimulate TERT transcription by directly binding to the promoter of TERT. In addition, in a subgroup of high-risk NB, rearrangement of the loci on chromosome 5 can lead to the phenomenon of “enhancer hijacking”, where proximal enhancers are juxtaposed with TERT, thereby inducing high expression of TERT. 10 ALT, as one of the two major mechanisms by which most cancer cells activate the TMM to elongate telomeric DNA, 11 is mostly positive in high-risk NB and patients with high mortality in adolescent NB, while mutations in ATRX can make ALT more easily activated.12,13 Yu et al. 14 have found that high telomere pruning activity and high levels of DNA damage are present in many HR-NB, and these phenomena will result in the continued production of short telomeres, making HR-NB more dependent on the TMM. Additionally, telomerase dysregulation is strongly related to a poor prognosis. 15 Molecular targeted therapy aimed at activating telomerase still needs further study. 16 Thus, systematic analysis of telomerase-associated genes in NB and thorough investigation of relevant data are essential for discovering new therapeutic approaches for NB.
Combining machine learning and genomics is becoming more important in disease diagnosis, prognosis assessment, and mechanism exploration. More and more machine learning methods are being applied to medical research. Nevertheless, selecting and evaluating the stability and accuracy of these methods and establishing the most appropriate prognostic model remains challenging. In NB, numerous predictive models based on various gene expression profiles have been constructed to assess risk, predict outcomes, and develop individualized treatment strategies. Therefore, further research is needed to figure out the prognostic significance of telomerase-related genes.
In our study, telomerase activation-related prognostic genes (TARPG) in NB were identified by machine learning techniques, and relevant predictive models were constructed. The study aims to provide evidence for elucidating the role of TARP genes in NB and establish relevant models to guide NB prognostic assessment and treatment.
Materials and methods
Data collection
Patients’ clinical information and expression datasets for NB were obtained from the GEO website (https://www.ncbi.nlm.nih.gov/geo/). Training sets GSE45547 (n = 649) and GSE49710 (n = 498) were selected, whereas external verification sets GSE73517 (n = 105) and GSE 19247 (n = 138) were chosen. 3614 telomerase activation-related genes (TARG) were obtained from the GeneCards website (https://www.Genecards.org).
Differential gene analysis
649 samples from the training set GSE45547 were divided into two groups based on their MYCN amplification status. The amplified group consists of 93 samples, while the non-amplified group consists of 550 samples, with 6 samples excluded due to missing relevant clinical information. The R package limma (version 3.40.6) was used to perform differential analysis to obtain differentially expressed genes.
Weighted gene co-expression network analysis
The dataset GSE45547 was retrieved from the GEO database, and the top 50% of genes with the lowest MAD were removed. Outliers of genes and samples were eliminated using the goodSamplesGenes function in the R package WGCNA. The minimum power (soft threshold) for a scale-free topology model fit close to 0.9 was identified as 4 through the pickSoftThreshold function. β was selected as 4, and the Co-expression adjacency and topological overlap matrix (TOM) were calculated using the adjacency function and TOMsimilarity function. Clustering was performed using TOM and implemented through the hclust function. The minimum value of the module was set to 30. The dendrogram was pruned using the cutreeDynamic() function. The co-expression similarity of the entire module was quantified, their eigengenes were calculated and clustered based on their correlation. A height cut of 0.5, corresponding to a correlation of 0.5, was selected for merging. The correlation between the module and clinical characteristics, as well as their P-values, were calculated using the cor and corPValueStudent functions. Visualization was carried out using the labeledHeatmap function.
Preliminary selection of telomerase activation-related genes in Nb
Genes obtained from differential analysis, Weighted Gene Co-expression Network Analysis (WGCNA), and 3614 Tumor Amplification Related Genes (TARG) were intersected to screen the TARG in NB. The gene matrix was extracted from GSE49710 and divided into a training set and a test set in a 7:3 ratio. The R software “randomForest” package was used to calculate the ideal number of decision trees and parameters. The optimal mtry parameter was to be set to 8, with the default ntree being 500 for constructing the model. Finally, the final genes were identified by combining the MeandecreaseAccuracy and MeanDecreaseGini metrics.
LASSO-COX constructs prognosis prediction model
The key genes were integrated into the survival time, survival status, and gene expression data in the dataset GSE49710 using the R software package “glmnet”. And the cox model was constructed through the function glmnet, where x was the gene matrix containing the independent variables, and y was the dependent variable vector, that was, the survival information of the sample, with family = “cox”. Then, 10-fold cross-validation was performed through the function cv.glmnet, and the optimal Lambda.min = 0.0339548181572029 and lambda.1se = 0.0860878402803935 were selected. Finally, 7 genes were obtained by taking Lambda.min. Then, the obtained genes were combined with multiple clinical feature information to construct a multi-clinical factor clustering heat map through the R package pheatmap.
Prognostic thermogram and ROC curve analysis
An analysis was conducted to explore the relationship between different risk scores and the patient's follow-up time, survival outcome, and the expression levels of selected genes following LASSO screening. The ROC curve was generated using the R software package pROC (version 1.17.0.1). Furthermore, pROC was used to analyze the ROC at 365, 1095, and 1825 days. The ci function of pROC was also applied to evaluate the Area Under the Curve (AUC) and Confidence Interval (CI).
Survival analysis
The R software package “survival” was used to integrate survival time, survival status, and key predictive gene expression data via Lasso regression. The Cox method was then used to evaluate the influence of each gene on the prognosis of NB following Lasso regression.
Validation of key gene expression
The expression of the seven key genes obtained from LASSO regression was compared in different risk groups, INSS stages (Stage 1 vs. Stage 4), and age groups (>1.5 years or <1.5 years) in the training set GSE49710. Similarly, the gene expression difference in these groups was confirmed by analyzing the merged external validation datasets GSE73517 and GSE19247 after batch correction.
Prognostic pan-cancer analysis of key genes
A pan-cancer dataset including data from TCGA, TARGET, and GTEx (PANCAN, N = 19131, G = 60499) was obtained from UCSC (https://xenabrowser.net/) and standardized. Gene expression data for RPL22L1 and WNT4 genes were extracted. The high-quality prognostic data from TCGA, as previously published in Cell, 17 were used. The follow-up data for TARGET were obtained from the UCSC Cancer Browser (https://xenabrowser.net/datapages/) as supplementary information. Samples with follow-up periods of fewer than 30 days were excluded. A Log2(x + 0.001) transformation was applied to each expression value, and cancer types with fewer than ten samples were excluded.
The Cox proportional hazards regression model was built using the coxph function in the R software survival package to analyze the prognostic relationship between gene expression and tumor type. The prognostic significance was assessed using the Logrank test.
Drawing a column plot for multi-factorial survival regression
The survival information and sample data from the GSE49710 dataset were selected. The R software package rms was used to intergrade the survival time, survival status, and six characteristic data, including age, INSS stage, high-risk score, NMYC gene amplification, RPL22L1 expression, and WNT4 expression. The Cox regression model was fitted by the cph function. Then, the nomogram was constructed and visualized. Finally, the risk score was calculated by the R package nomogramFormula. The calibrate function was used to establish the calibration curves of the model for 1, 3, and 5 years. The pROC and readxl packages were used to construct the multi-factor ROC curve and calculate the AUC area and CI value. The time-dependent ROC curve was drawn by the survival ROC package. An external dataset TARGET-NB (n = 249) was selected as the test set, and six samples with NA in the clinical information were removed. Similarly, a Cox model of the test set was constructed, and its ROC curve was drawn to calculate the AUC area to evaluate the performance of the model.
Immune infiltration analysis
A feature gene set of 28 immune cells was obtained from a published paper 18 and sample data from GSE49710 were used. Immune cell scores were predicted using ssGSEA in the R software. Subsequently, a correlation analysis was conducted between the immune scores of each sample and the expression levels of core genes using the cor function in R.
Immune checkpoint analysis
A list of 79 genes of immune checkpoints was obtained from the published paper, 19 and the gene matrix of RPL22L1 and immune checkpoints was extracted from GSE49710. After that, the data were log2 transformed, and the mean value was calculated by averpes function. The correlation coefficients between the target genes and the immune checkpoint genes were calculated by cor function and pearson analysis, cor.mtest function was used to calculate the p-value and finally visualized as a correlation heatmap by the corrplot function.
Drug sensitivity analysis
The GSE49710 expression file was read in R and the data were matrixed. The training set gene expression matrix file (GDSC2_Expr.rds) and drug processing information file (GDSC2_Res.rds) were obtained from the Genomics of Cancer Drug Sensitivity (https://www.cancerrxgene.org/) database. The sensitivity of 198 drugs in each sample was obtained by the function calcPhenotype in the oncoPredict package. The samples were divided into high expression and low expression groups according to the median expression of the gene RPL22L1 as the boundary, and the cyclic analysis was carried out according to each drug, with the p-value <0.01 set, and finally visualized by the ggboxplot function.
Construction of protein-protein interaction networks and miRNA-mRNA-TF regulatory network
Based on the 24 telomerase-related genes identified during the initial screening, a protein interaction network was constructed using an online functional protein association network tool. The final visualization was performed using Cytoscape software. The microRNAs (miRNAs) and transcription factors associated with the RPL22L1 and WNT4 genes were predicted using the mirNet database (https://www.mirnet.ca/Secure/NetworkBuilder.xhtml). After generating the corresponding gene relationships, the regulatory networks were visualized using Cytoscape software.
Clinical tissue samples
The specimens were collected from the Department of Pediatric Surgery of Zhujiang Hospital of Southern Medical University from May 2022 to August 2023, and all tissues were verified through pathological examination. The tissue samples were immersed in a tissue RNA preservation solution (New Cell & Molecular Biotechnology, China) and stored at - 80 °C. The study was approved by the Ethics Committee of Zhujiang Hospital of Southern Medical University. The research was restricted by the Helsinki Declaration and informed consent was obtained from patients’ guardians.
RT-PCR
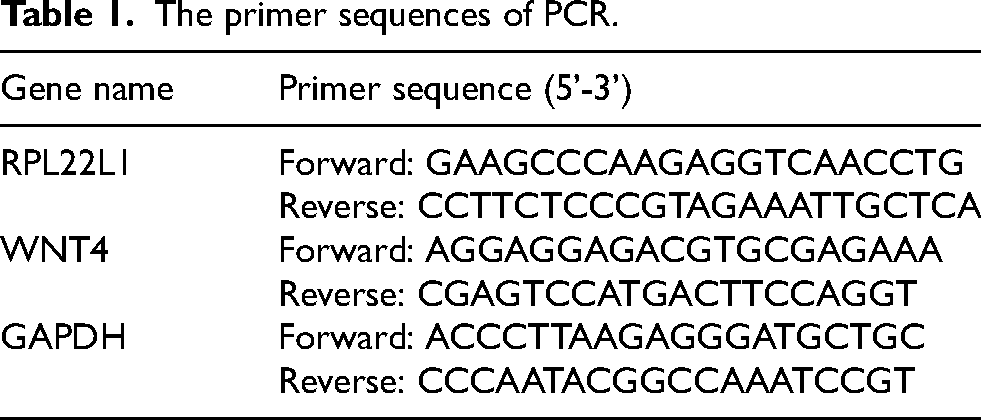
Total RNA was extracted from tissue samples or cells using Trizol reagent (Accurate Biology, Hunan, China). The cDNA was synthesized using the Evo-M-MLV RT Kit II (including gDNA removal reagent) (Accurate Biology, Hunan, China). The PCR reactions were performed using the SYBR Green qPCR Mix fluorescent quantitative PCR kit (Biosharp, Anhui, China), with GAPDH as the reference gene. The PCR amplification protocol involved an initial pre-denaturation at 95 °C for 5 min, followed by 45 cycles of denaturation at 95 °C for 10 s, annealing at 72 °C, and extension for 30 s. The primer sequences (RayBio Biotech, Guangzhou, China) are shown in the following Table 1.
The primer sequences of PCR.
Cell culture and transfection
Human neuroblastoma cell lines SK-N-AS (Hycyte, Soochow, China) and SH-SY5Y (Hycyte, Soochow, China) were cultured. The small interfering RNA (si-RPL22L1) and negative control (si-NC) were purchased from Tsingke Biotech (Beijing, China). The sequence of si-RPL22L1 is 5'-CCCAAGAGGTCAACCTGGAGGTTTA-3’, and the sequence of si-NC is 5'-TTCTCCGAACGTGTCACGT-3’. The overexpression plasmid, pcDNA3.1(+)-RPL22L1, was constructed by Tsingke Biotech (Beijing, China). The cells were transfected with Beyotime Lipo8000TM transfection reagent (Beyotime, Shanghai, China) following the manufacturer's instructions. After 48 h, the transfected cells were collected for further experiments, and the knockdown and overexpression efficiency were verified using RT-PCR.
CCK-8
Cell viability was assessed by CCK8. SK-N-AS and SH-SY5Y cells were inoculated into 96-well plates and transfected with si-RPL22L1 and RPL22L1 overexpression plasmid. 10μl CCK-8 reagent (GlpBio, LA, USA) was added at 0 h, 24 h, 48 h, and 72 h. After that, the cells were incubated in the incubator for 90 min in the absence of light. The optical density (OD) was measured at the 450 nm wavelength using a spectrophotometer (Tecan, Mechelen, Belgium).
Wound-Healing assay
SK-N-AS and SH-SY5Y cells were plated into a 6-well plate and cultured in a full medium until they reached approximately 90% confluence. The monolayer was scratched using a 200μL pipette tip and rinsed with a serum-free medium to remove detached cells. Then, the cells were cultured in a medium with only 4%FBS and transfected with si-RPL22L1 and RPL22L1 overexpression plasmid. Scratch healing was observed and imaged at 0 h, 24 h, and 48 h using an inverted Nikon ECLIPSE Ts2 microscope (Nikon, Japan). The images were later processed with Image J software (National Institutes of Health, USA).
Transwell assay
Transfected SK-N-AS and SH-SY5Y cells (5 × 10⁴/ml) were resuspended in serum-free medium and inoculated 250μL to the upper chamber of transwell 24-well plates (Corning, New York, USA) with 8μm pore filters and 500μL medium containing 10% FBS was added to the lower chamber. After 48 h incubation, the cells attached to the upper surface of the filter membranes were removed. The migrated cells of the lower surface were fixed with 4% paraformaldehyde (Biosharp, Anhui, China) and stained with 0.1% crystal violet (BKMAMLAB, Hunan, China) for 20 min. Five randomly selected fields of view were captured using an inverted Nikon ECLIPSE Ts2 microscope (Nikon, Japan), and cell counting was performed with Image J (National Institutes of Health, USA).
Statistical analysis
All bioinformatic analyses were performed with the R software (version 4.2.3, New Zealand). GraphPad (version 9.4.1, USA) and Image J (version 1.53e, USA) were used to analyze the experimental data and draw statistical charts. P value < 0.05 was considered statistically significant.
Results
Genes related to the prognosis of NB
The samples from GSE45547 were divided into MYCN amplification group and non-MYC amplification group to screen out the prognostic genes related to NB. The soft threshold was determined to be 4 (β = 4). Scale independence and average coherence (Figure 1A-B) were drawn to ensure the network's adherence to a scale-free network and maintain its connectivity. Additionally, WGCNA revealed the most relevant gene block (brown) containing 788 genes (Figure 1C-D).
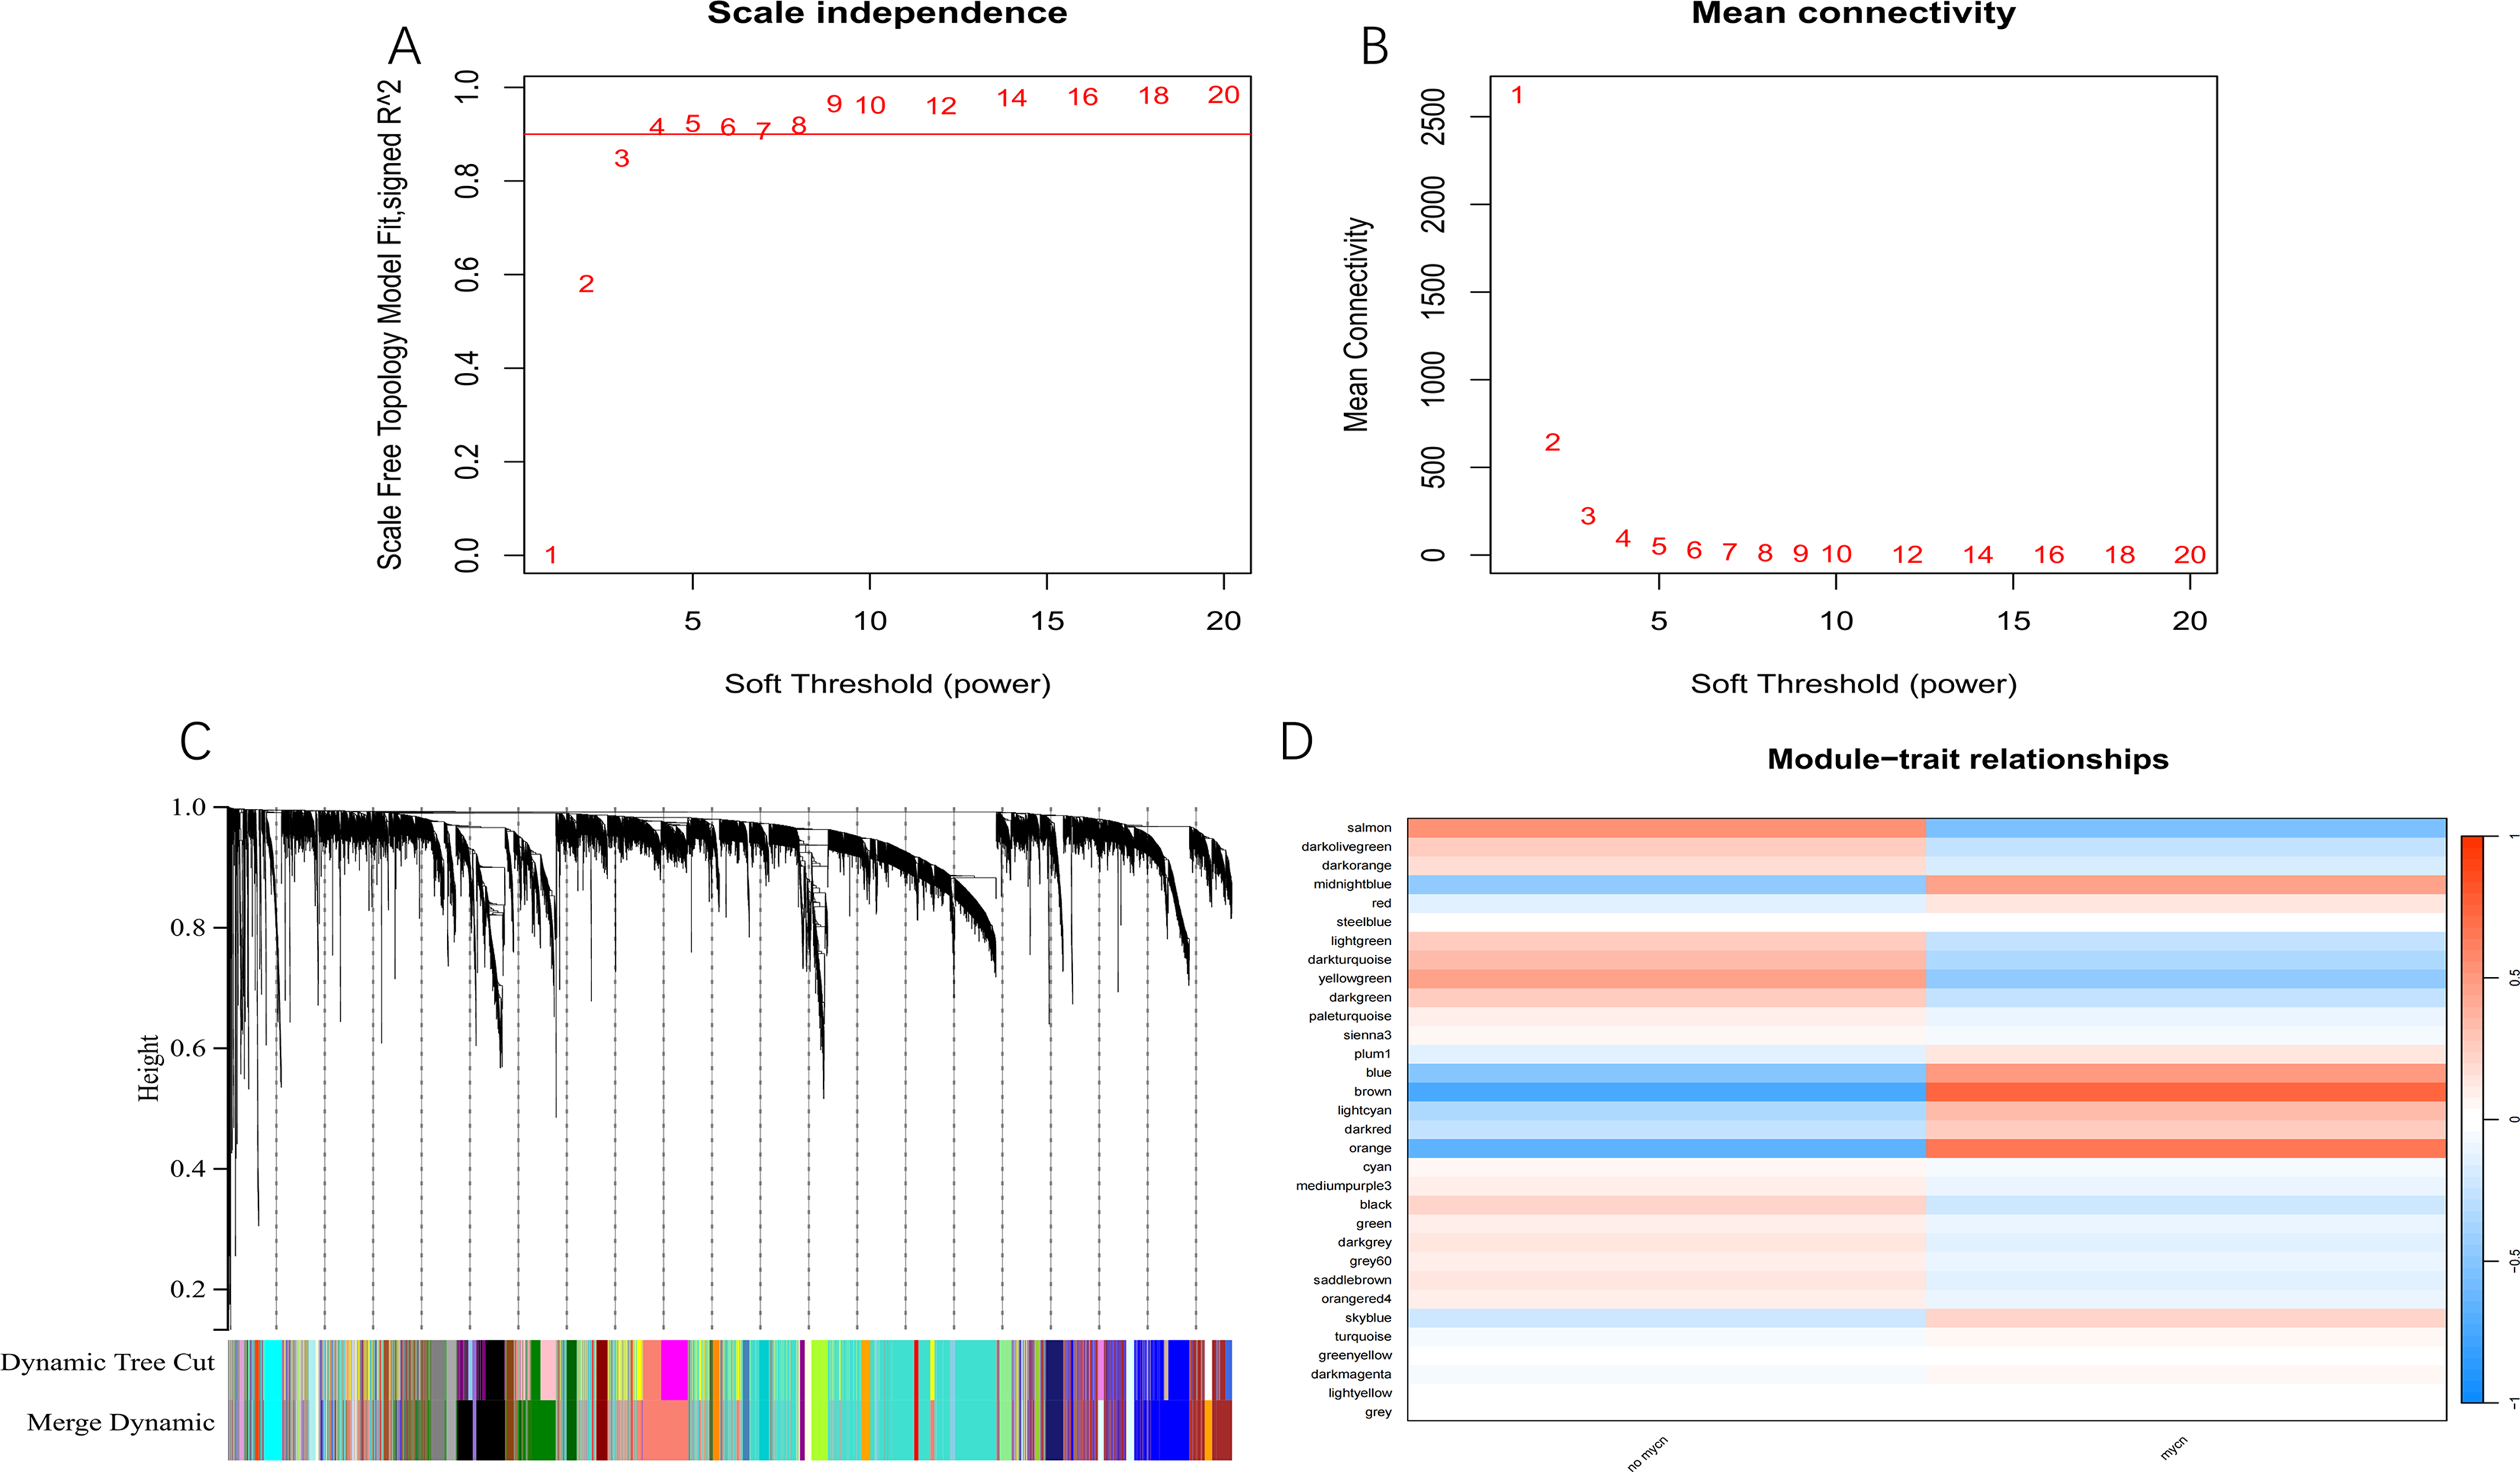
Genes related to the prognosis of NB were identified by WGCNA. (A, B) Network topology analysis of WGCNA evaluated relative scale independence and average connectivity with a soft threshold β value of 4. (C) Genes were divided into distinct sections based on the best soft threshold β = 4. (D) Heat map of the correlation between gene module and MYCN amplification.
Differential analysis
Excluding six cases with incomplete information, 643 cases were divided into two groups based on MYCN amplification: 93 samples in the MYCN amplification group and 550 samples in the non-MYCN amplification group. The difference analysis revealed that 1477 genes differed between the two groups. 659 were up-regulated, while 818 were down-regulated (Figure 2A, B). The prognostic genes screened by the differential genes Degs and WGCNA were intersected with 3614 TARG obtained from GeneCards (Figure 2C). Finally, 24 Tumor Amplification Related Genes (SMAD3, TWIST1, DDR2, BAMBI, MYCN, PUS7, PDGFRA, DPP6, GNL3, ALCAM, WNT4, RPUSD4, SNRPE, BAZ1A, DBH, KIT, NTRK1, SPON1, ALK, DLEU1, ODC1, PRPH, KRT19, RPL22L1) were identified.
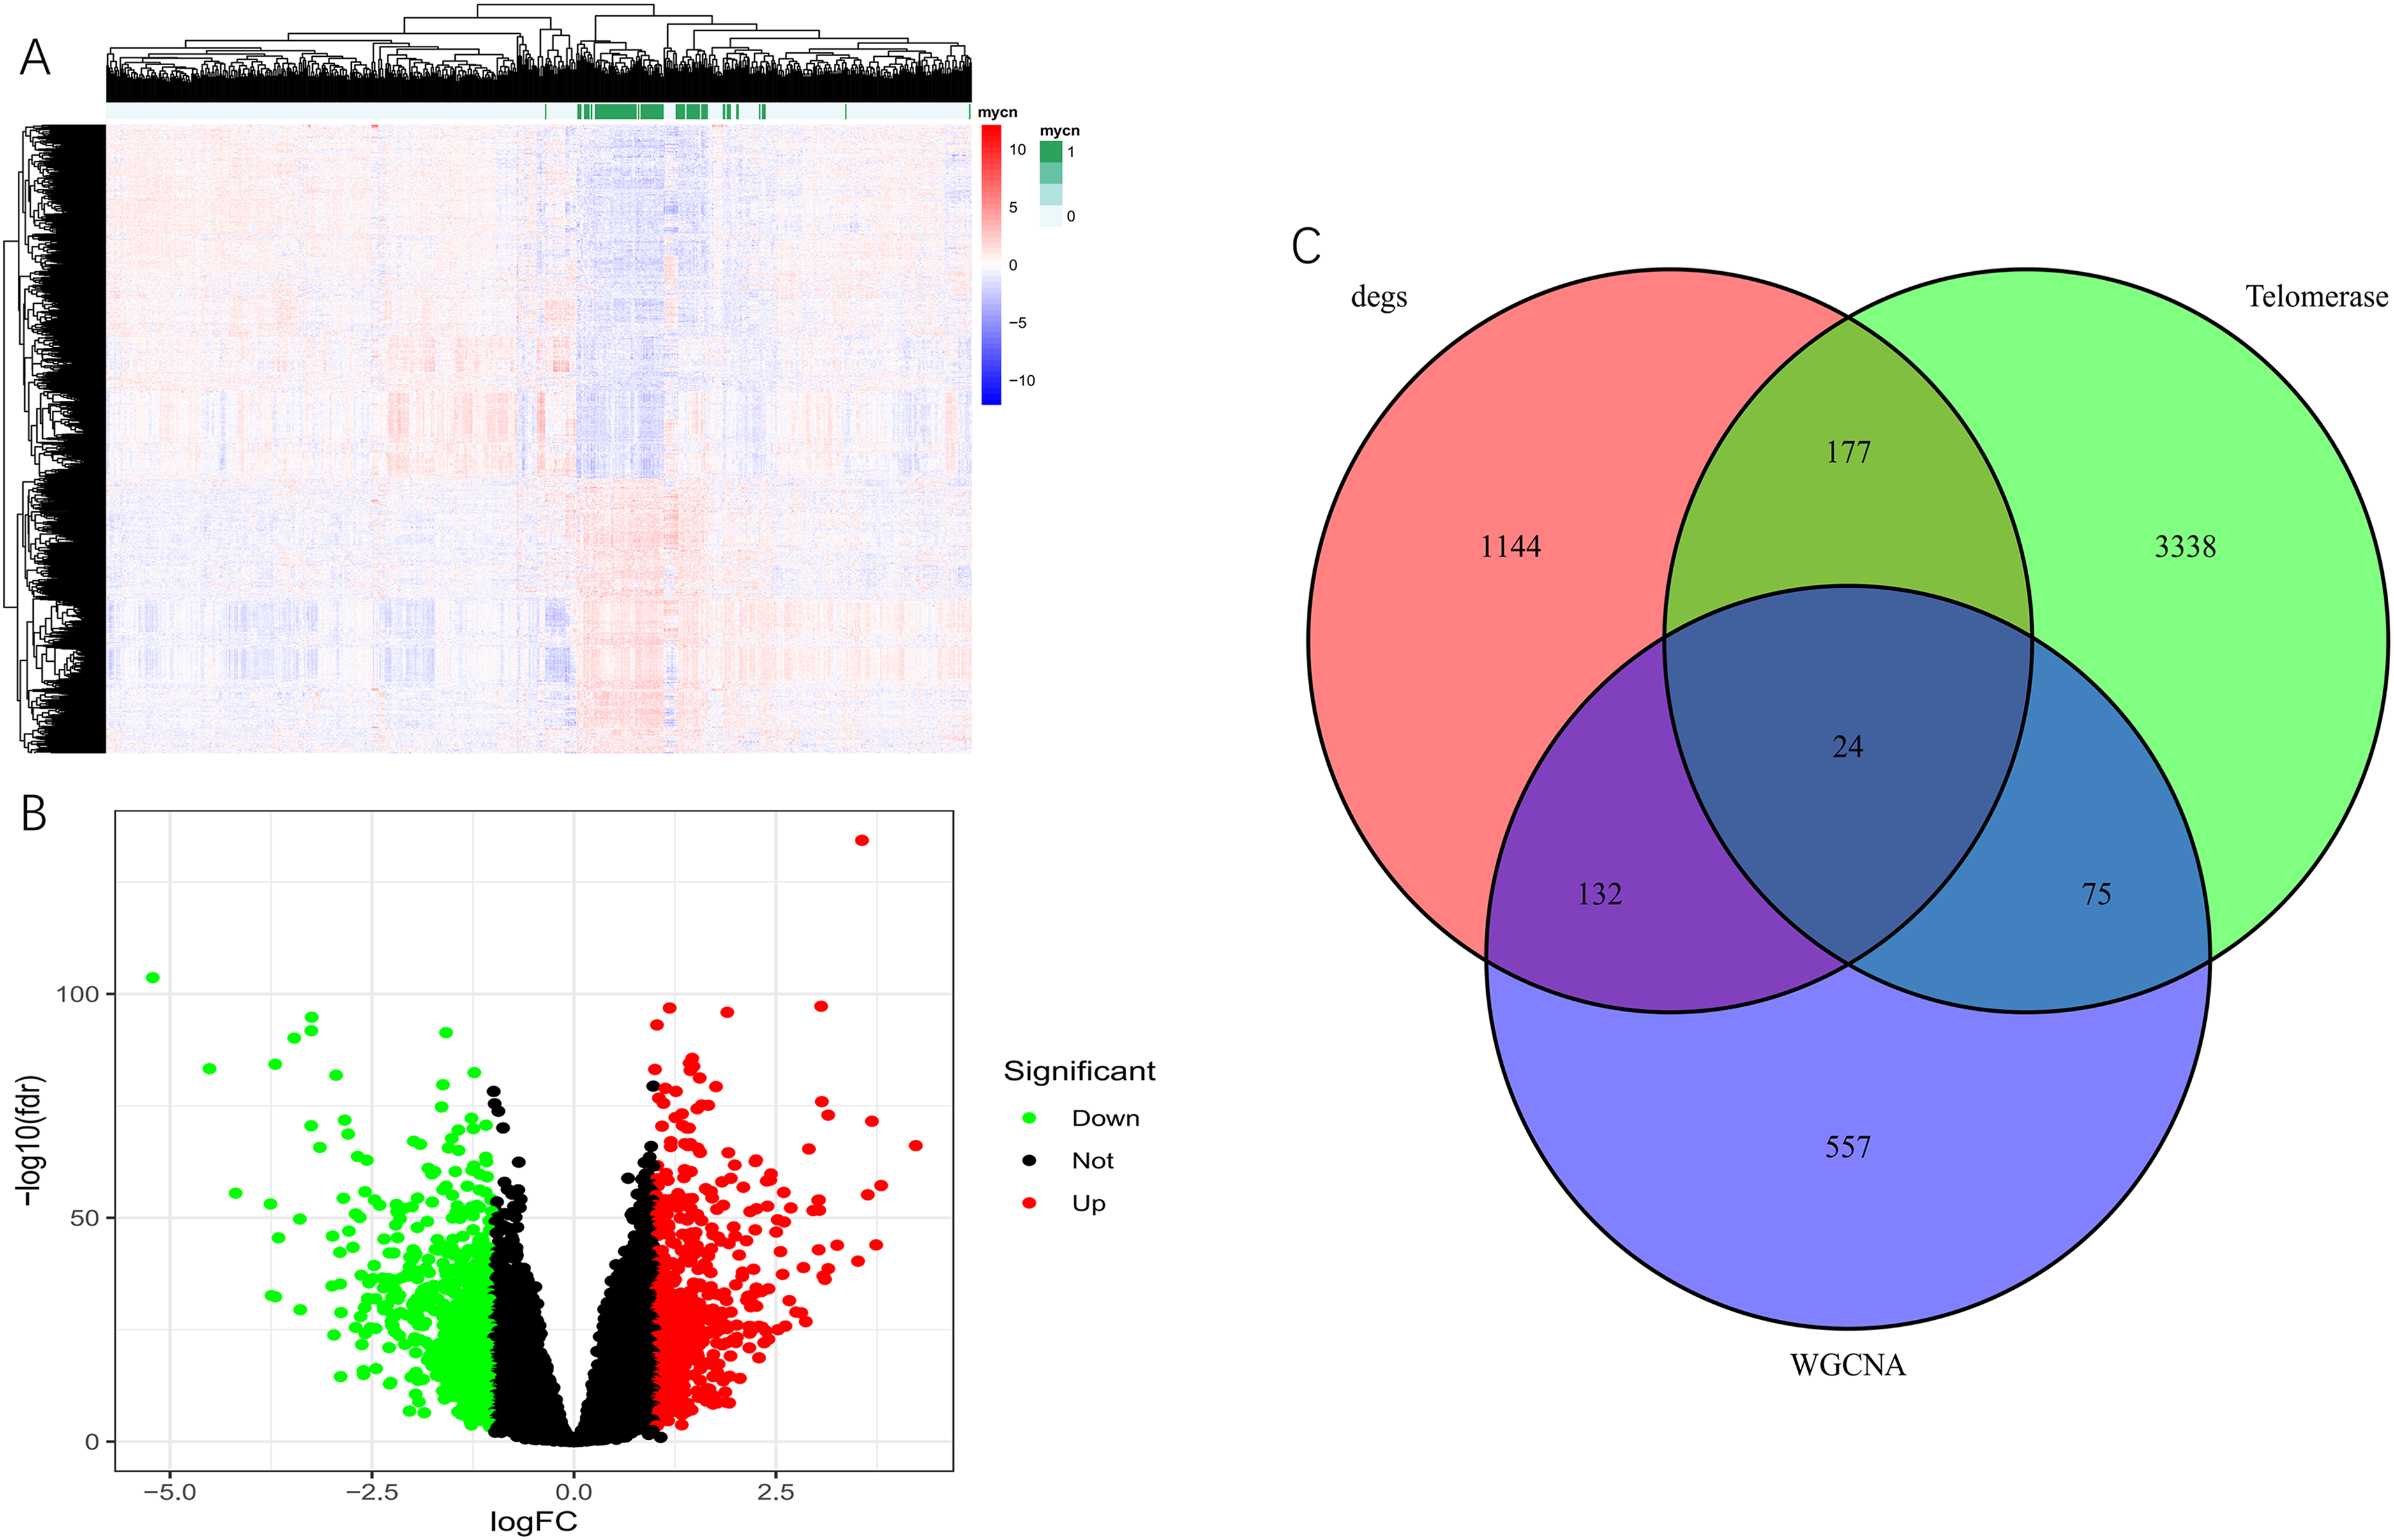
Differential analysis and Venn diagram in GSE45547. (A) Heat map of differential gene between MYCN amplification and non-MYCN amplification group. (B) Volcano plot of differential genes. (C) Venn diagram showed the intersection of genes screened by Degs, WGCNA, and TARG.
Re-Screened key prognostic genes
The random forest method was used to extract the matrix of 24 genes from the GSE49710 dataset. The optimal number of parameters and decision trees were calculated (Figure 3A-B) and used to construct a model. By combining the 15 genes identified from MeanDecreaseAccuracy and MeanDecreaseGini metrics, 17 genes (PRPH, RPL22L1, DDR2, KRT19, ODC1, DPP6, MYCN, ALK, NTRK1, GNL3, ALCAM, TWIST1, PDGFRA, SMAD3, PUS7, WNT4, DBH) (Figure 3C) were obtained.
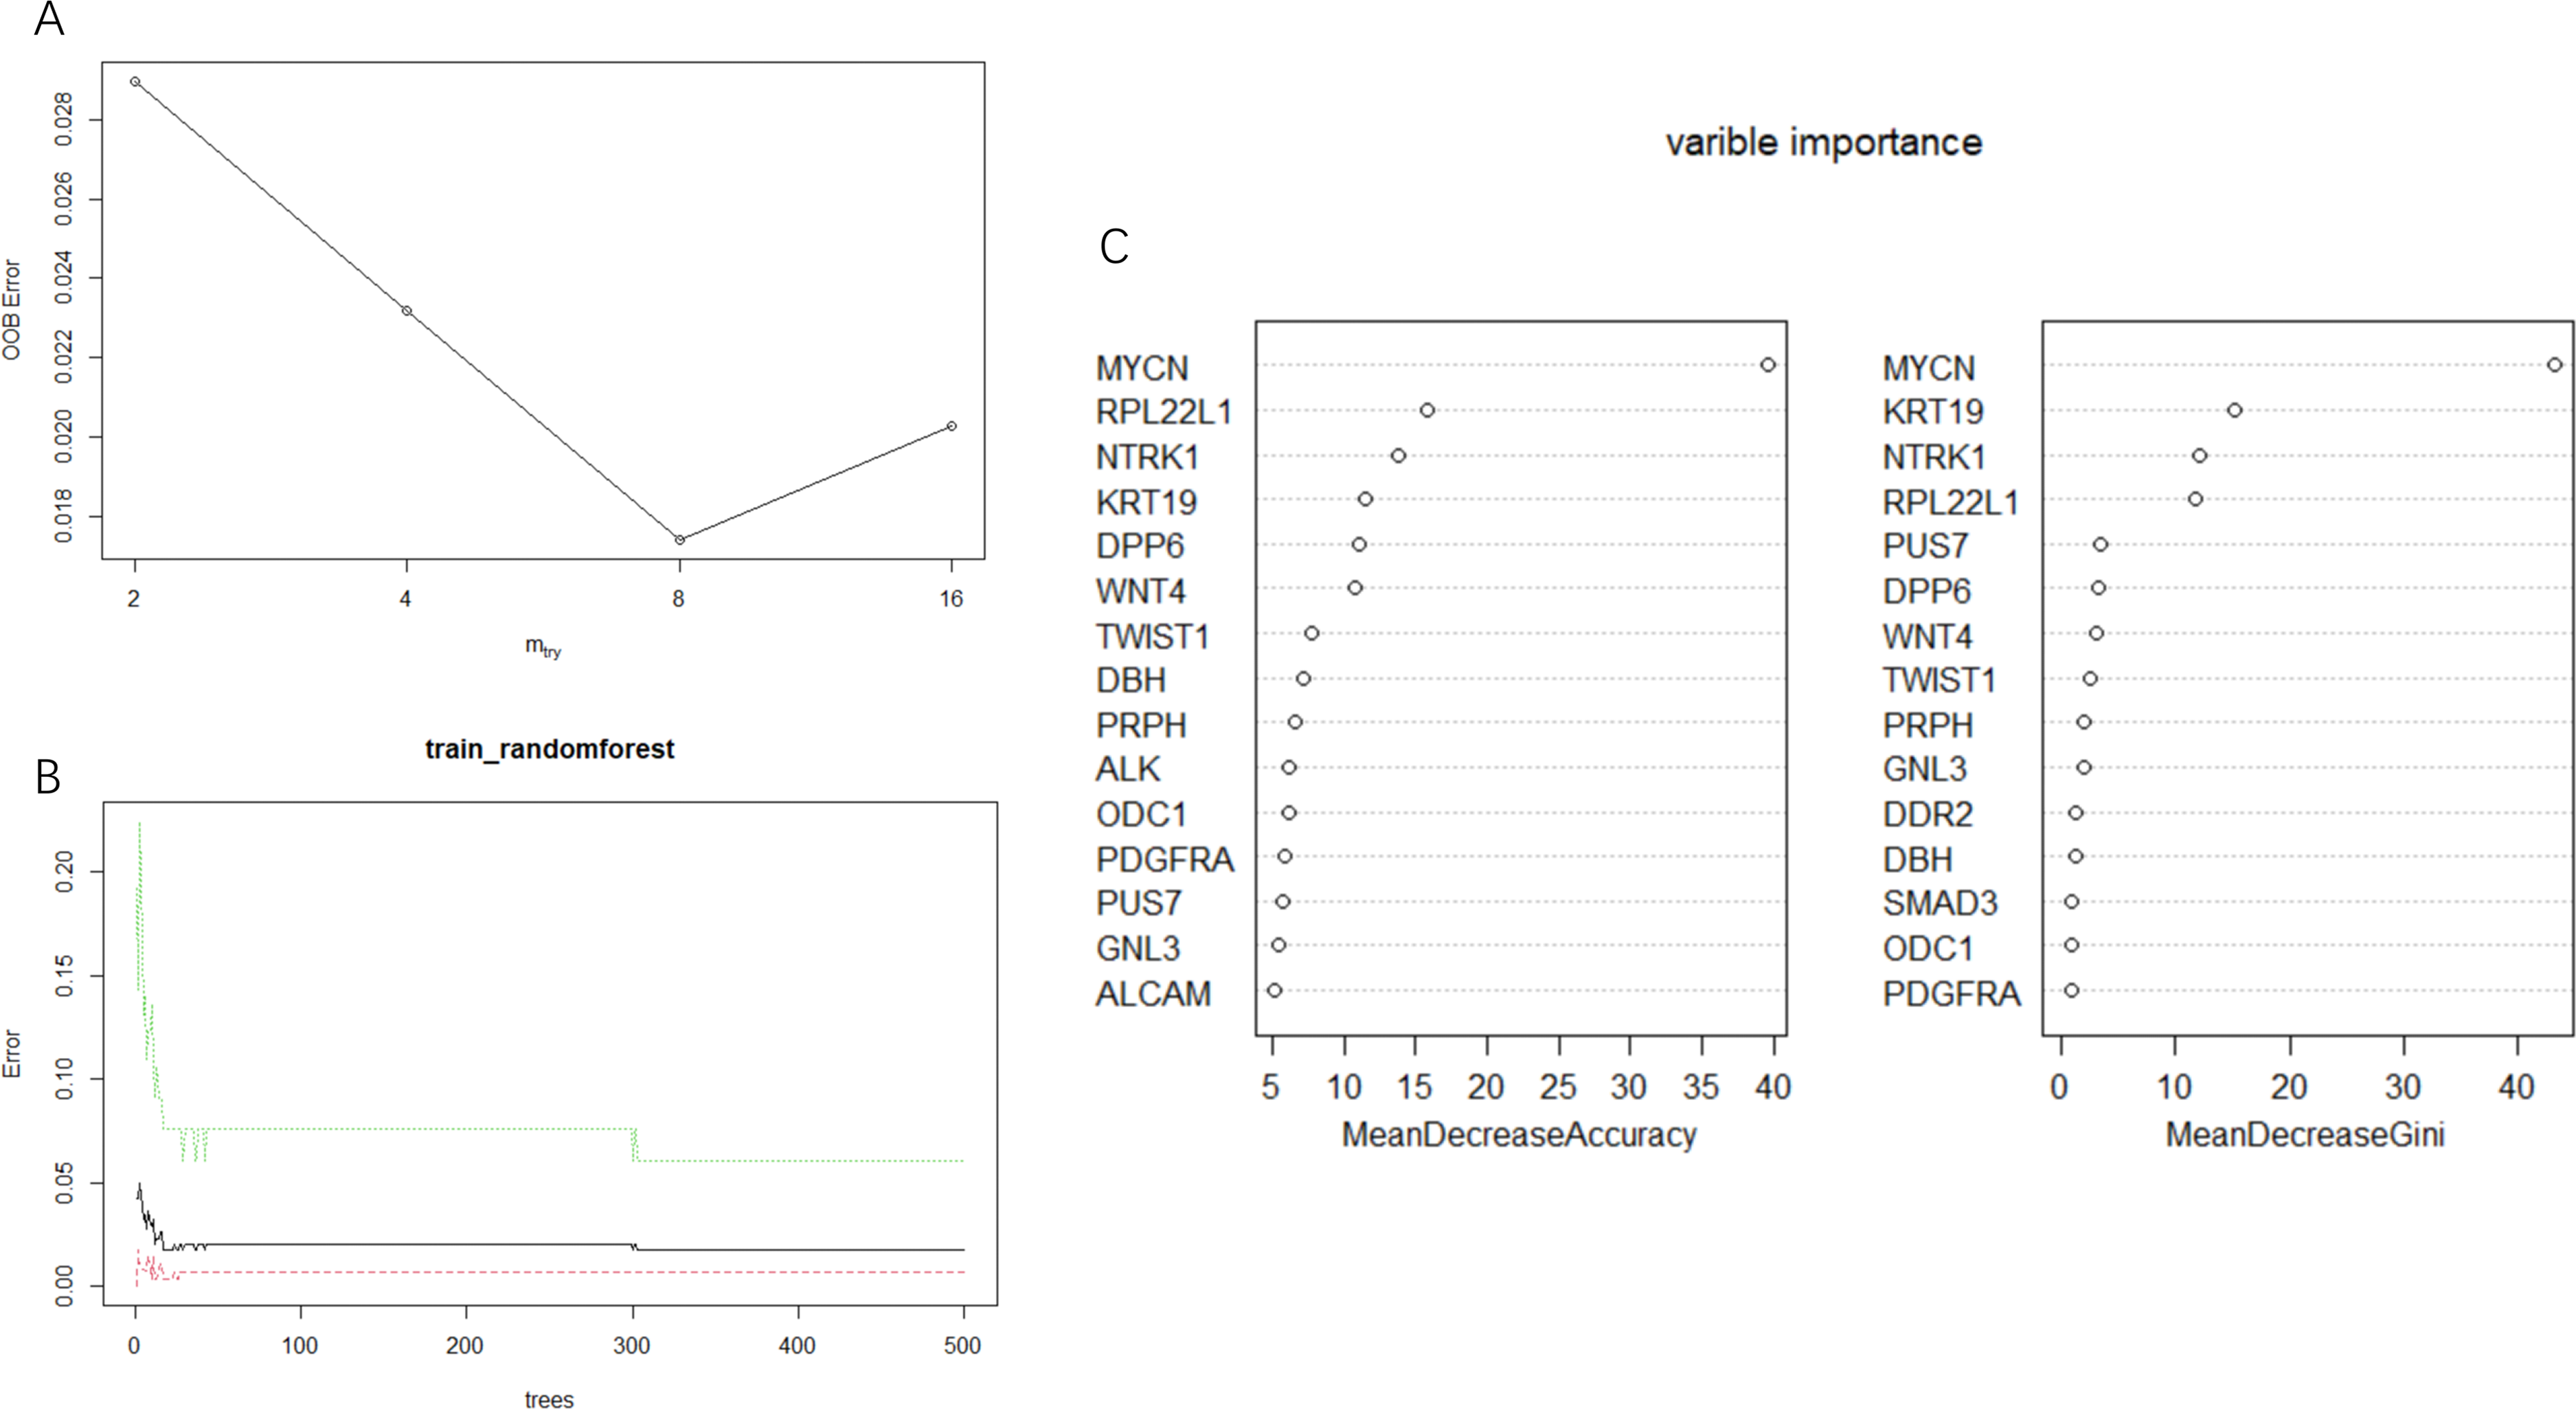
Random forest analysis was carried out in dataset GSE49710. (A) The optimal Mtry parameter value is 8, with the lowest out-of-bag error rate (oob error). (B) The number of optimal decision trees was ntree = 50. (C) 15 characteristic variables were selected according to MeanDecreaseAccuracy and MeanDecreaseGini.
Prognosis model
To further analyze the prognostic value of the screened prognostic genes, the Lasso-Cox method was applied for the genetic variable screening of 17 genes. A prognostic prediction model was constructed and the optimal λ value was determined as 0.03 (Figure 4A). Finally, seven key prognostic genes (PRPH, RPL22L1, ODC1, ALK, NTRK1, ALCAM, and WNT4) were confirmed (Figure 4B).
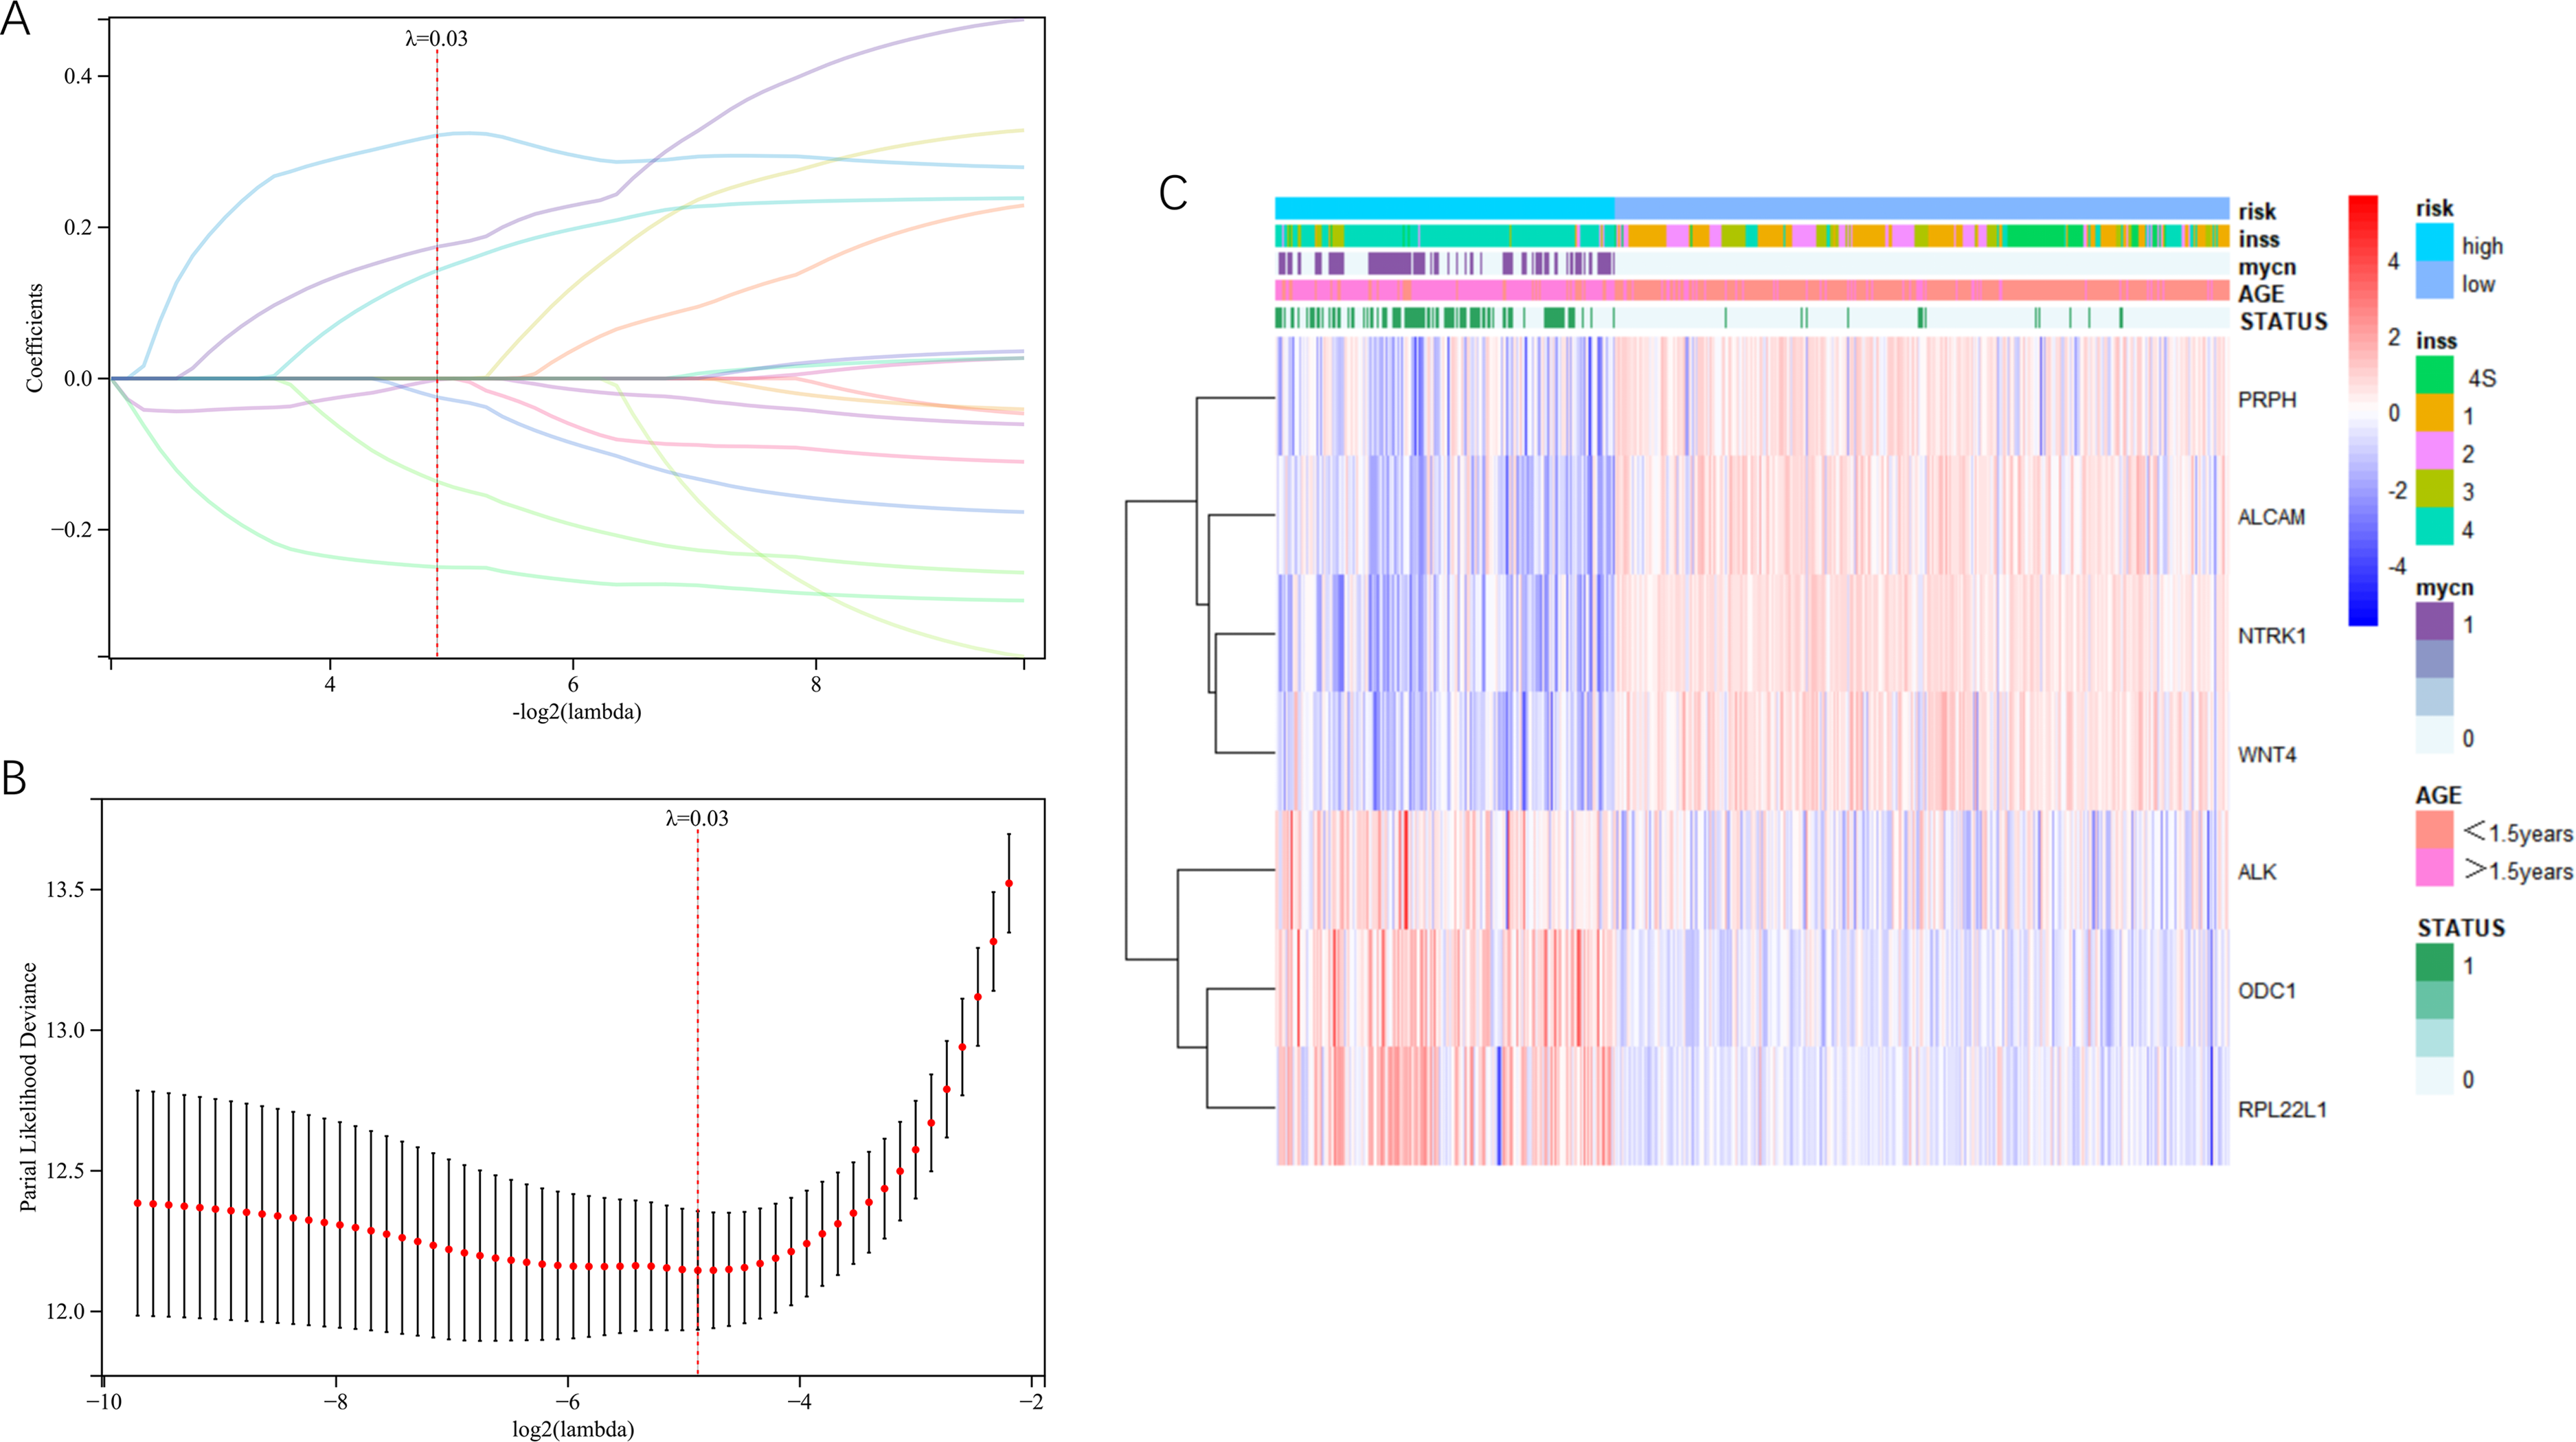
Prognosis model constructed by lasso-cox regression analysis in GSE49710. (A) Partial-likelihood deviance was changed with Log(λ). The partial-likelihood deviance was minimized when lambda. min = 0.0339548181572029. (B) Lasso coefficient curve of 17 variables. By object(λ) sequence generation coefficient profile, seven potential predictors were screened out by the best λ. (C) Heatmap for multicategorical clinical clustering.
The patients were divided into a high-risk group and a low-risk group based on the original grouping of clinical information in the dataset, integrating data on multiple clinical characteristics and survival outcomes to draw a multi-clinical factor clustering heat map (Figure 4C). NTRK1, ALCAM, PRPH, and WNT4 genes were identified as protective factors because their expression was negatively correlated with risk clinical factors. Meanwhile, ALK, RPL22L1, and ODC1 genes were identified as risk factors because their expression was positively correlated with risk clinical factors.
Survival analysis
To further verify the prognostic significance of each gene, a survival analysis was performed on seven prognostic genes. The results were visualized using a Kaplan-Meier curve and forest plot (Figure 5). Patients with high expression levels of NTRK1, ALCAM, PRPH, and WNT4 had a higher survival rate compared to those with low expression. Similarly, patients with lower expression levels of ALK, RPL22L1, and ODC1 had higher survival rates (P < 0.05).
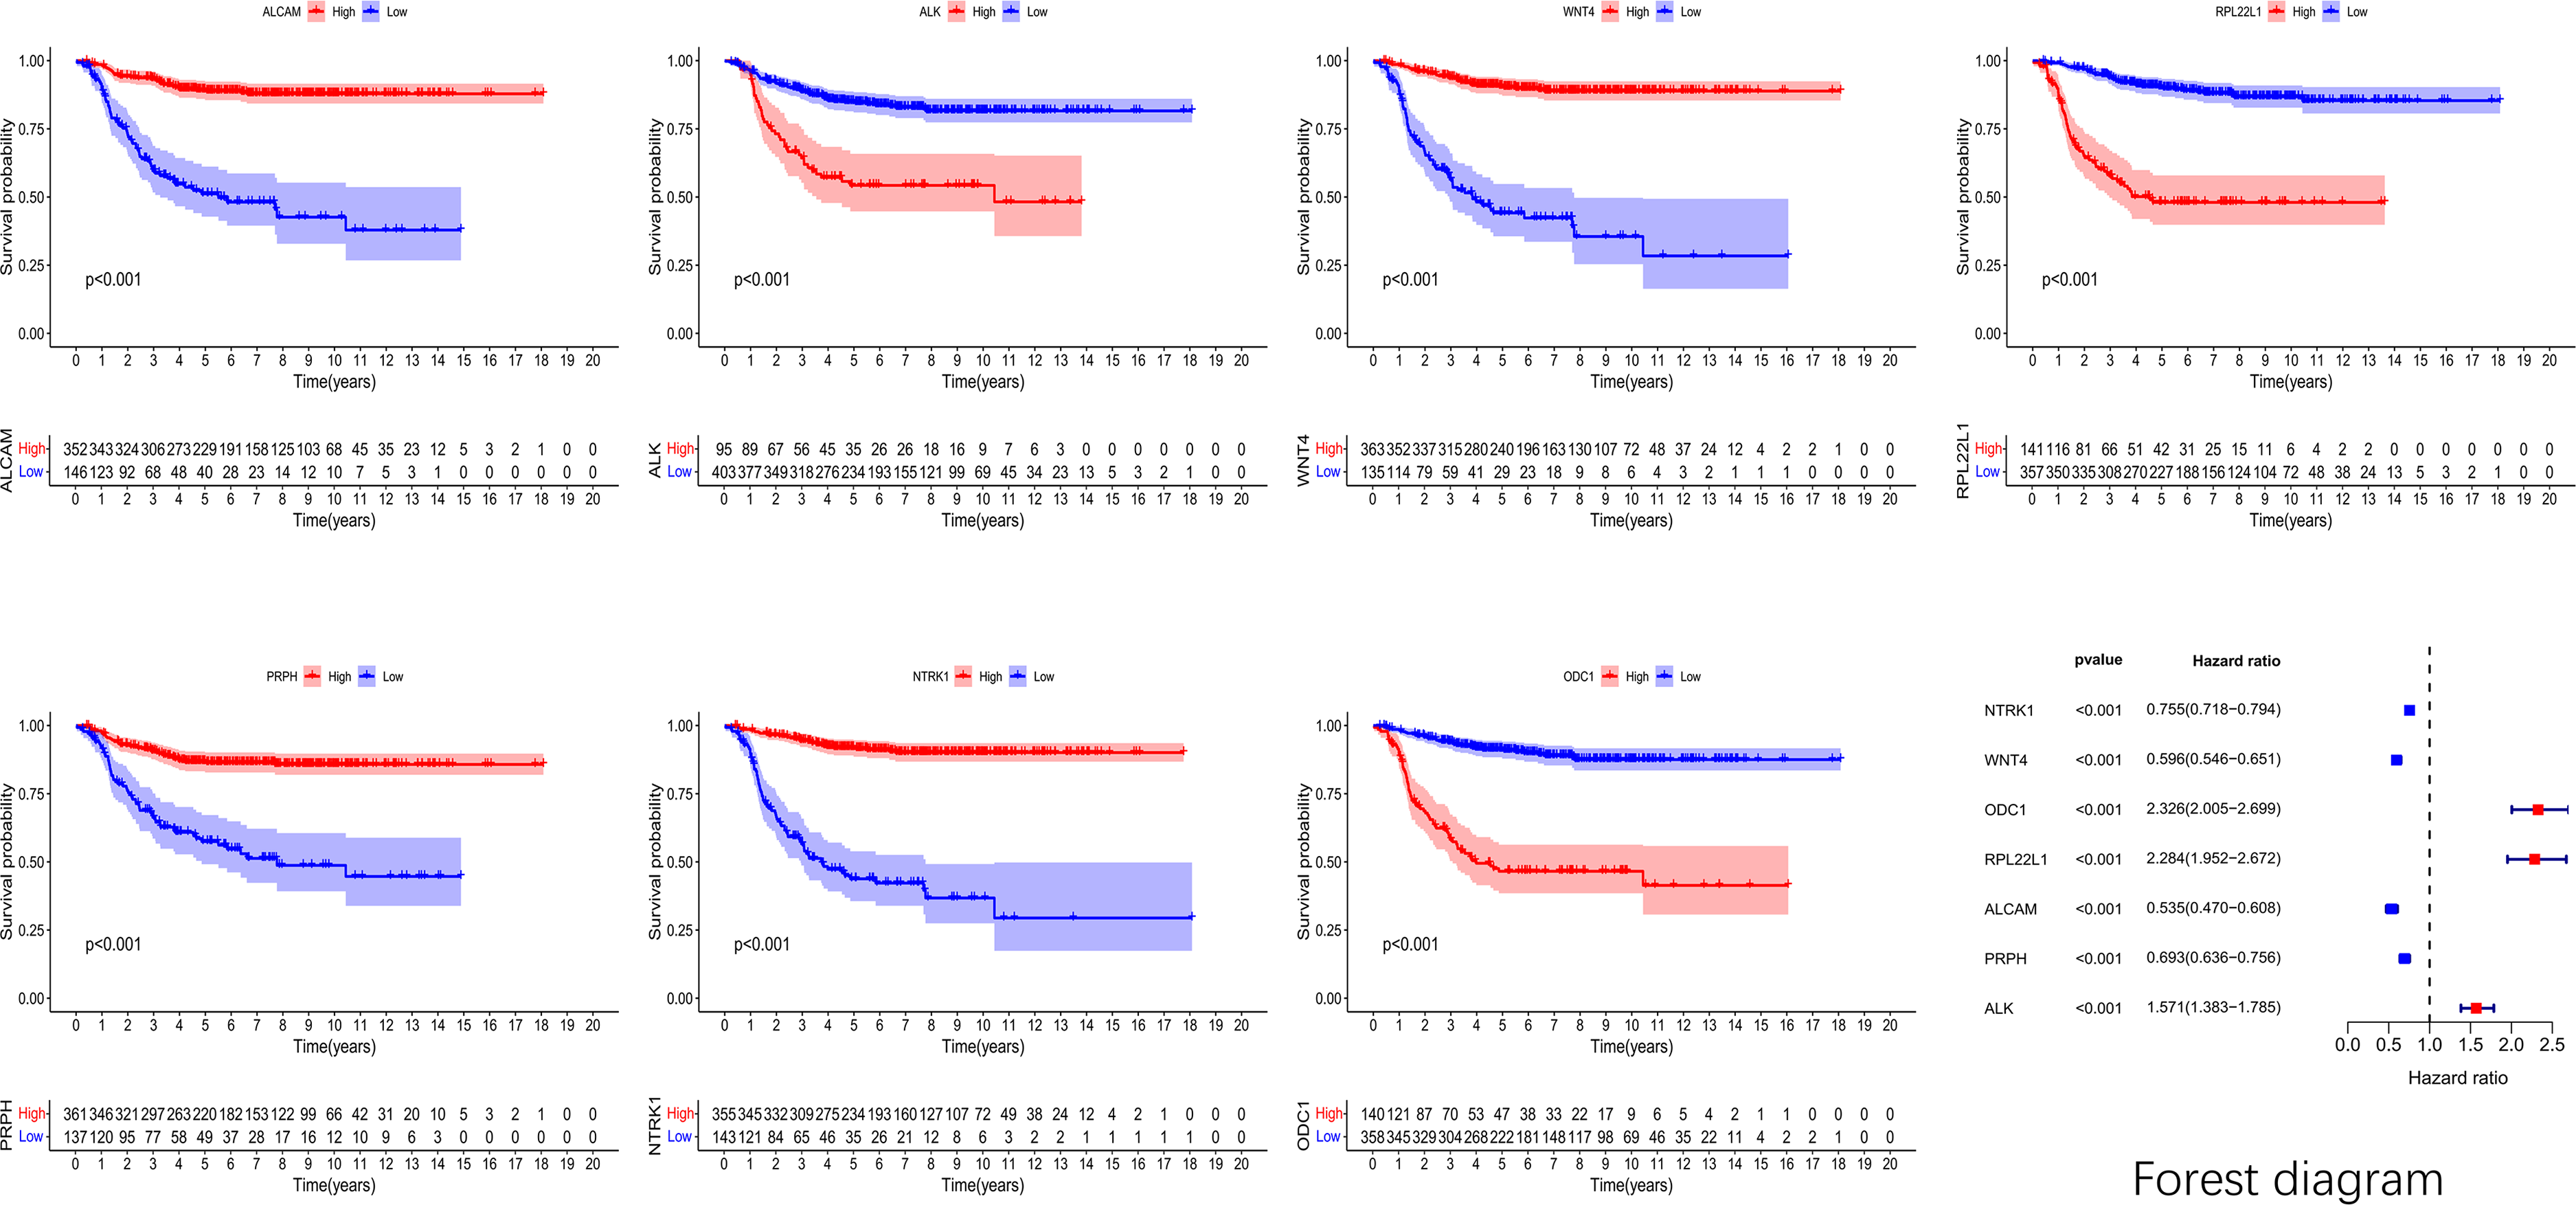
K-M curve and forest map based on GSE49710. The survival curve for genes ALK, ODC1, and RPL22L1 showed that the high-expression group had a lower curve compared to the low-expression group. In the forest map, these three variables were located to the right of the invalid line, suggesting a positive correlation with the death outcome. The curves of the high-expression groups of NTRK1, ALCAM, PRPH, and WNT4 genes were all above the low-expression group. In the forest map, the above four variables were all on the left side of the invalid line, indicating a negative correlation with the death outcome.
Differences in expression levels of key target genes
The clinical features of the INSS stage, high-risk and low-risk scores, and age, which were closely related to the prognosis of NB, were used as criteria for grouping to compare the expression of each prognostic gene. The datasets GSE49710, GSE73517, and GSE19247 were selected and merged to eliminate the batch effect by the R software SilicoMerging package. After eliminating the batch effects, the data distribution of each dataset became consistent, with the median on one line (Figure 6B and D). In the UMAP plot, samples from each dataset formed distinct clusters at first. However, samples intertwined and clustered after eliminating the batch effects (Figure 6A and C). The dataset, which was free of batch effects, was used as the validation set.
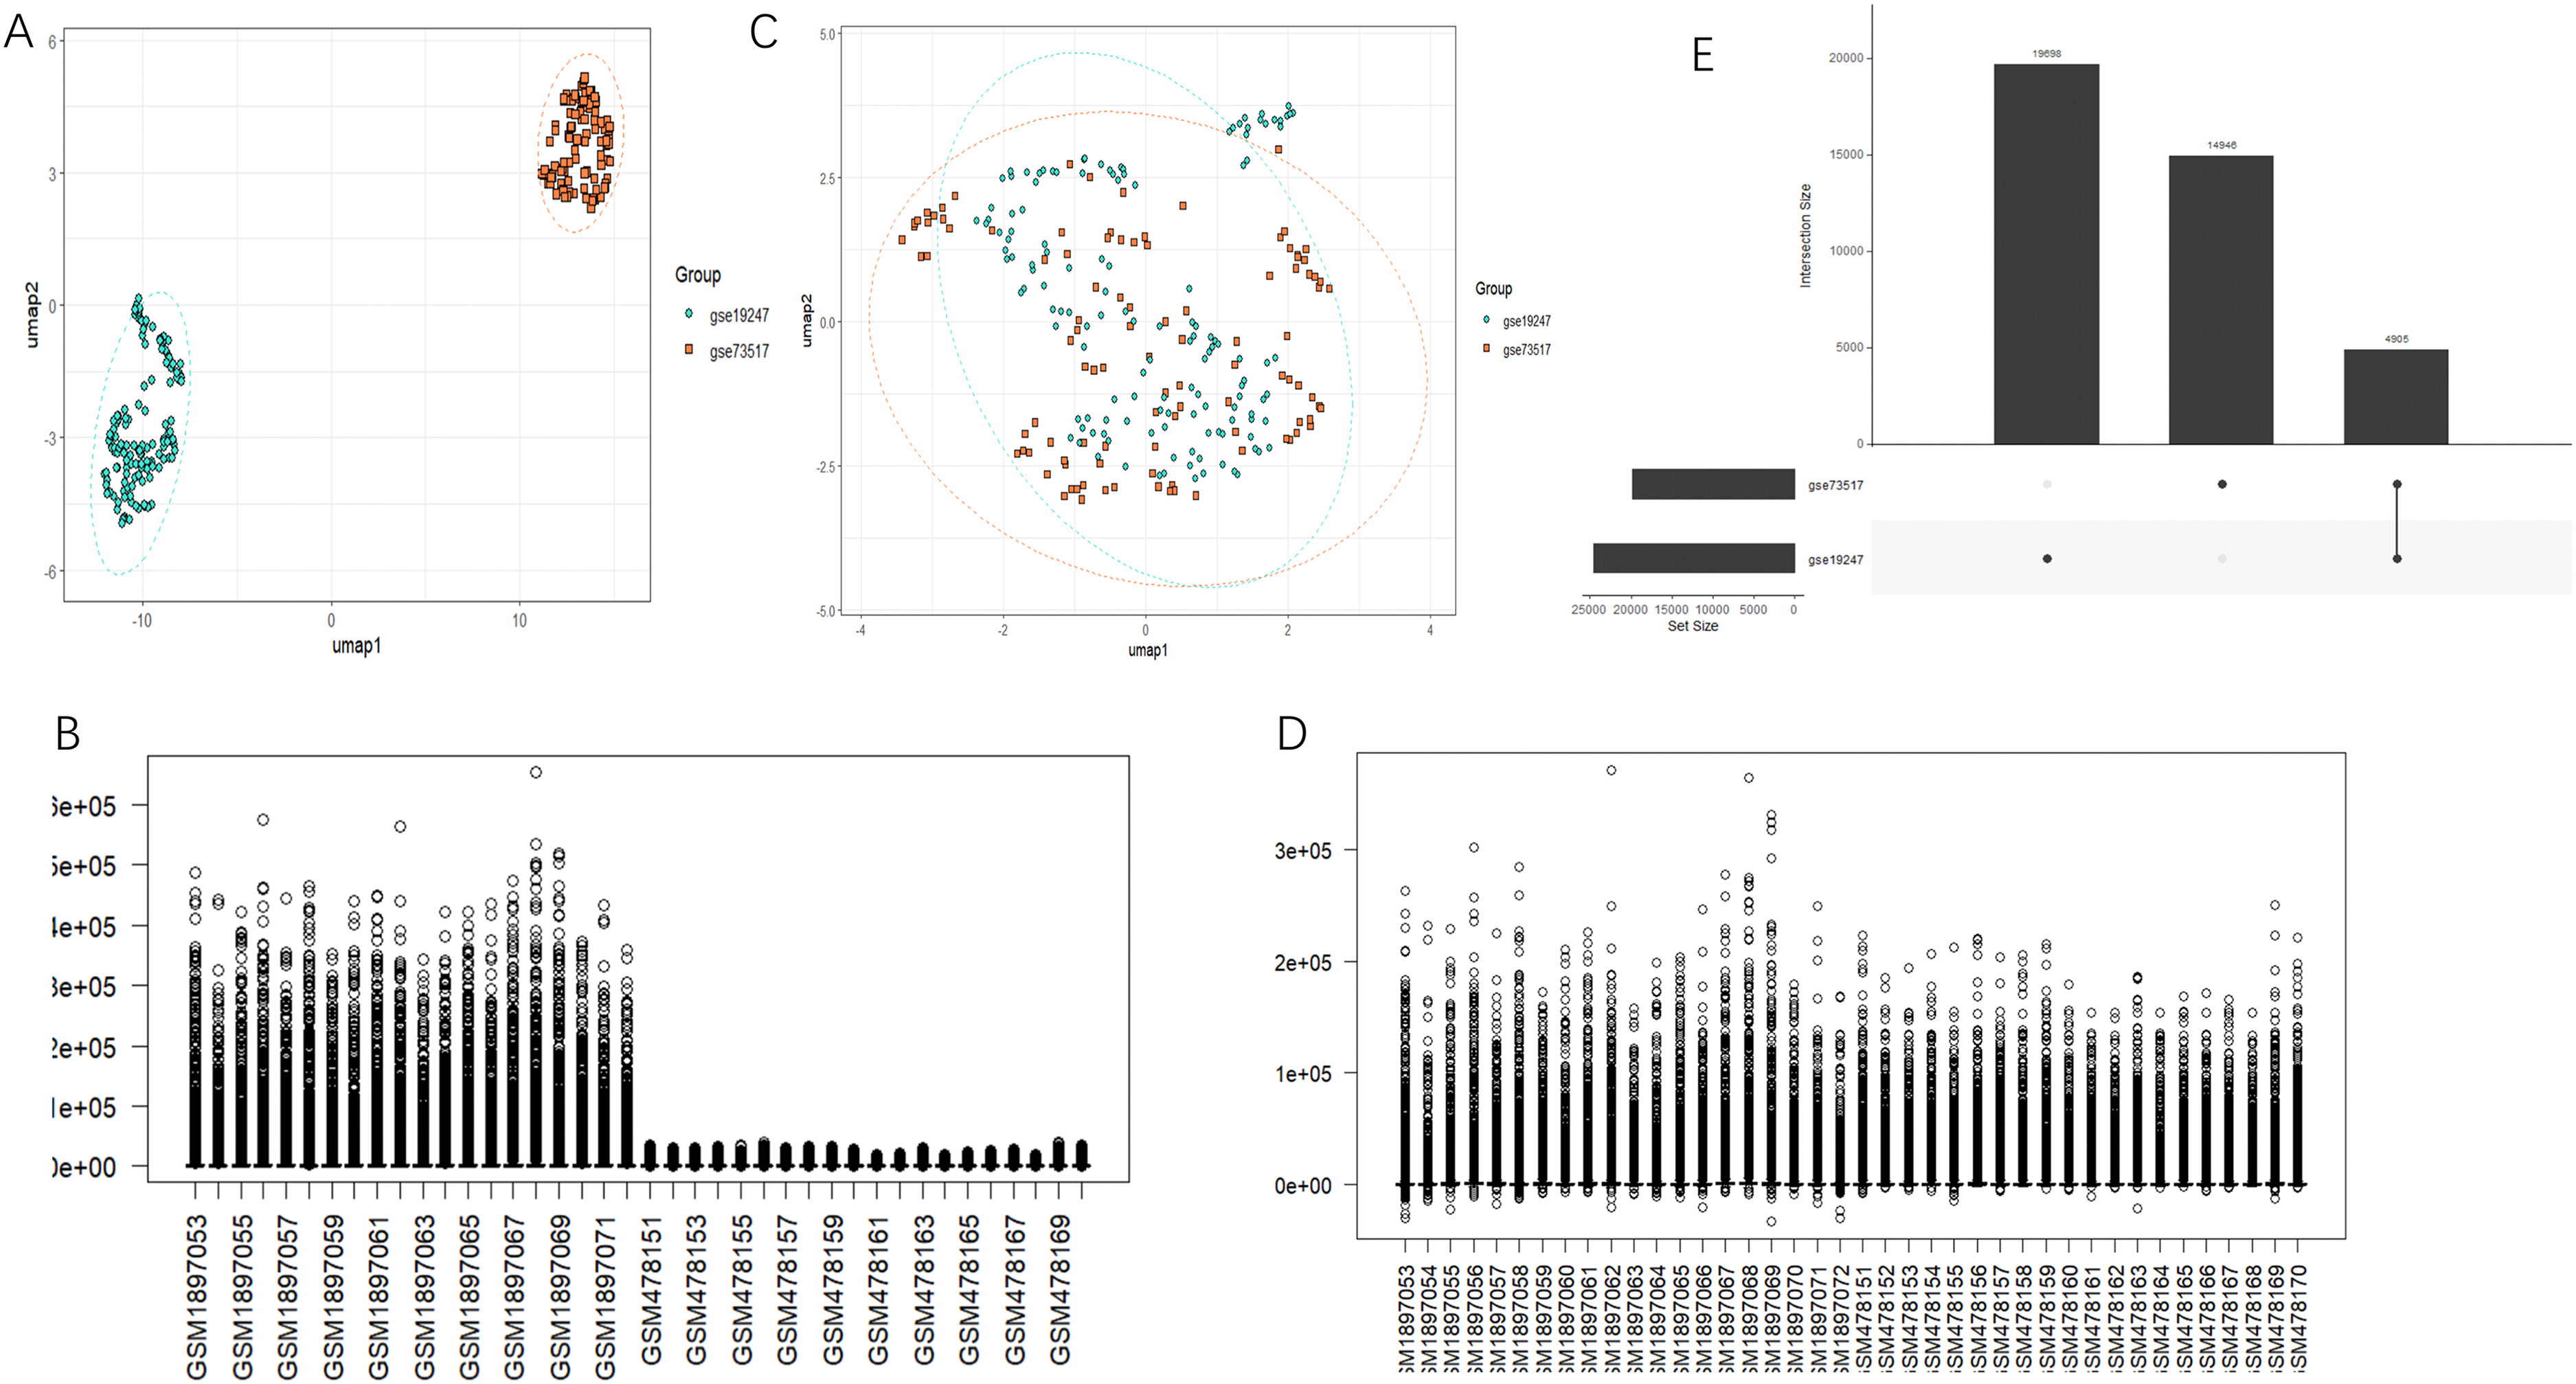
Integration and batch effect correction of datasets GSE73517 and GSE19247. (A and C) UMAP plots before and after merging the two datasets and eliminating batch effects. (B and D) Data distribution plots before and after merging the two datasets and eliminating batch effects. (E) An overview of dataset intersection.
The relevant gene data were extracted from the dataset. Each gene's expression was compared based on the INSS stage (stages 1 and 4), age (>1.5 years and <1.5 years), and high-risk/low-risk groups, and box plots were drawn (Figure 7). Genes NTRK1, ALCAM, PRPH, and WNT4 had elevated expression levels in stage 1 compared to stage 4, and their expression was also higher in individuals aged < 1.5y than in individuals aged > 1.5y, and their expression was also higher in the low-risk group than in the high-risk group in the GSE49710 dataset. On the contrary, ODC1, ALK, and RPL22L1 displayed the opposite (P < 0.05) (Figure 7A-C). In the validation set, the expression levels of NTRK1, ALCAM, PRPH, and WNT4 were consistently higher in INSS stage 1 than in stage 4, higher in the low-risk group than in the high-risk group, and higher in individuals aged < 1.5y than those aged > 1.5y. Conversely, genes RPL22L1 and ODC1 showed the reverse pattern (Figure 7D-F). Thus, WNT4 is a protective gene related to telomerase activation that affects the prognosis of NB, while RPL22L1 is a risk gene.
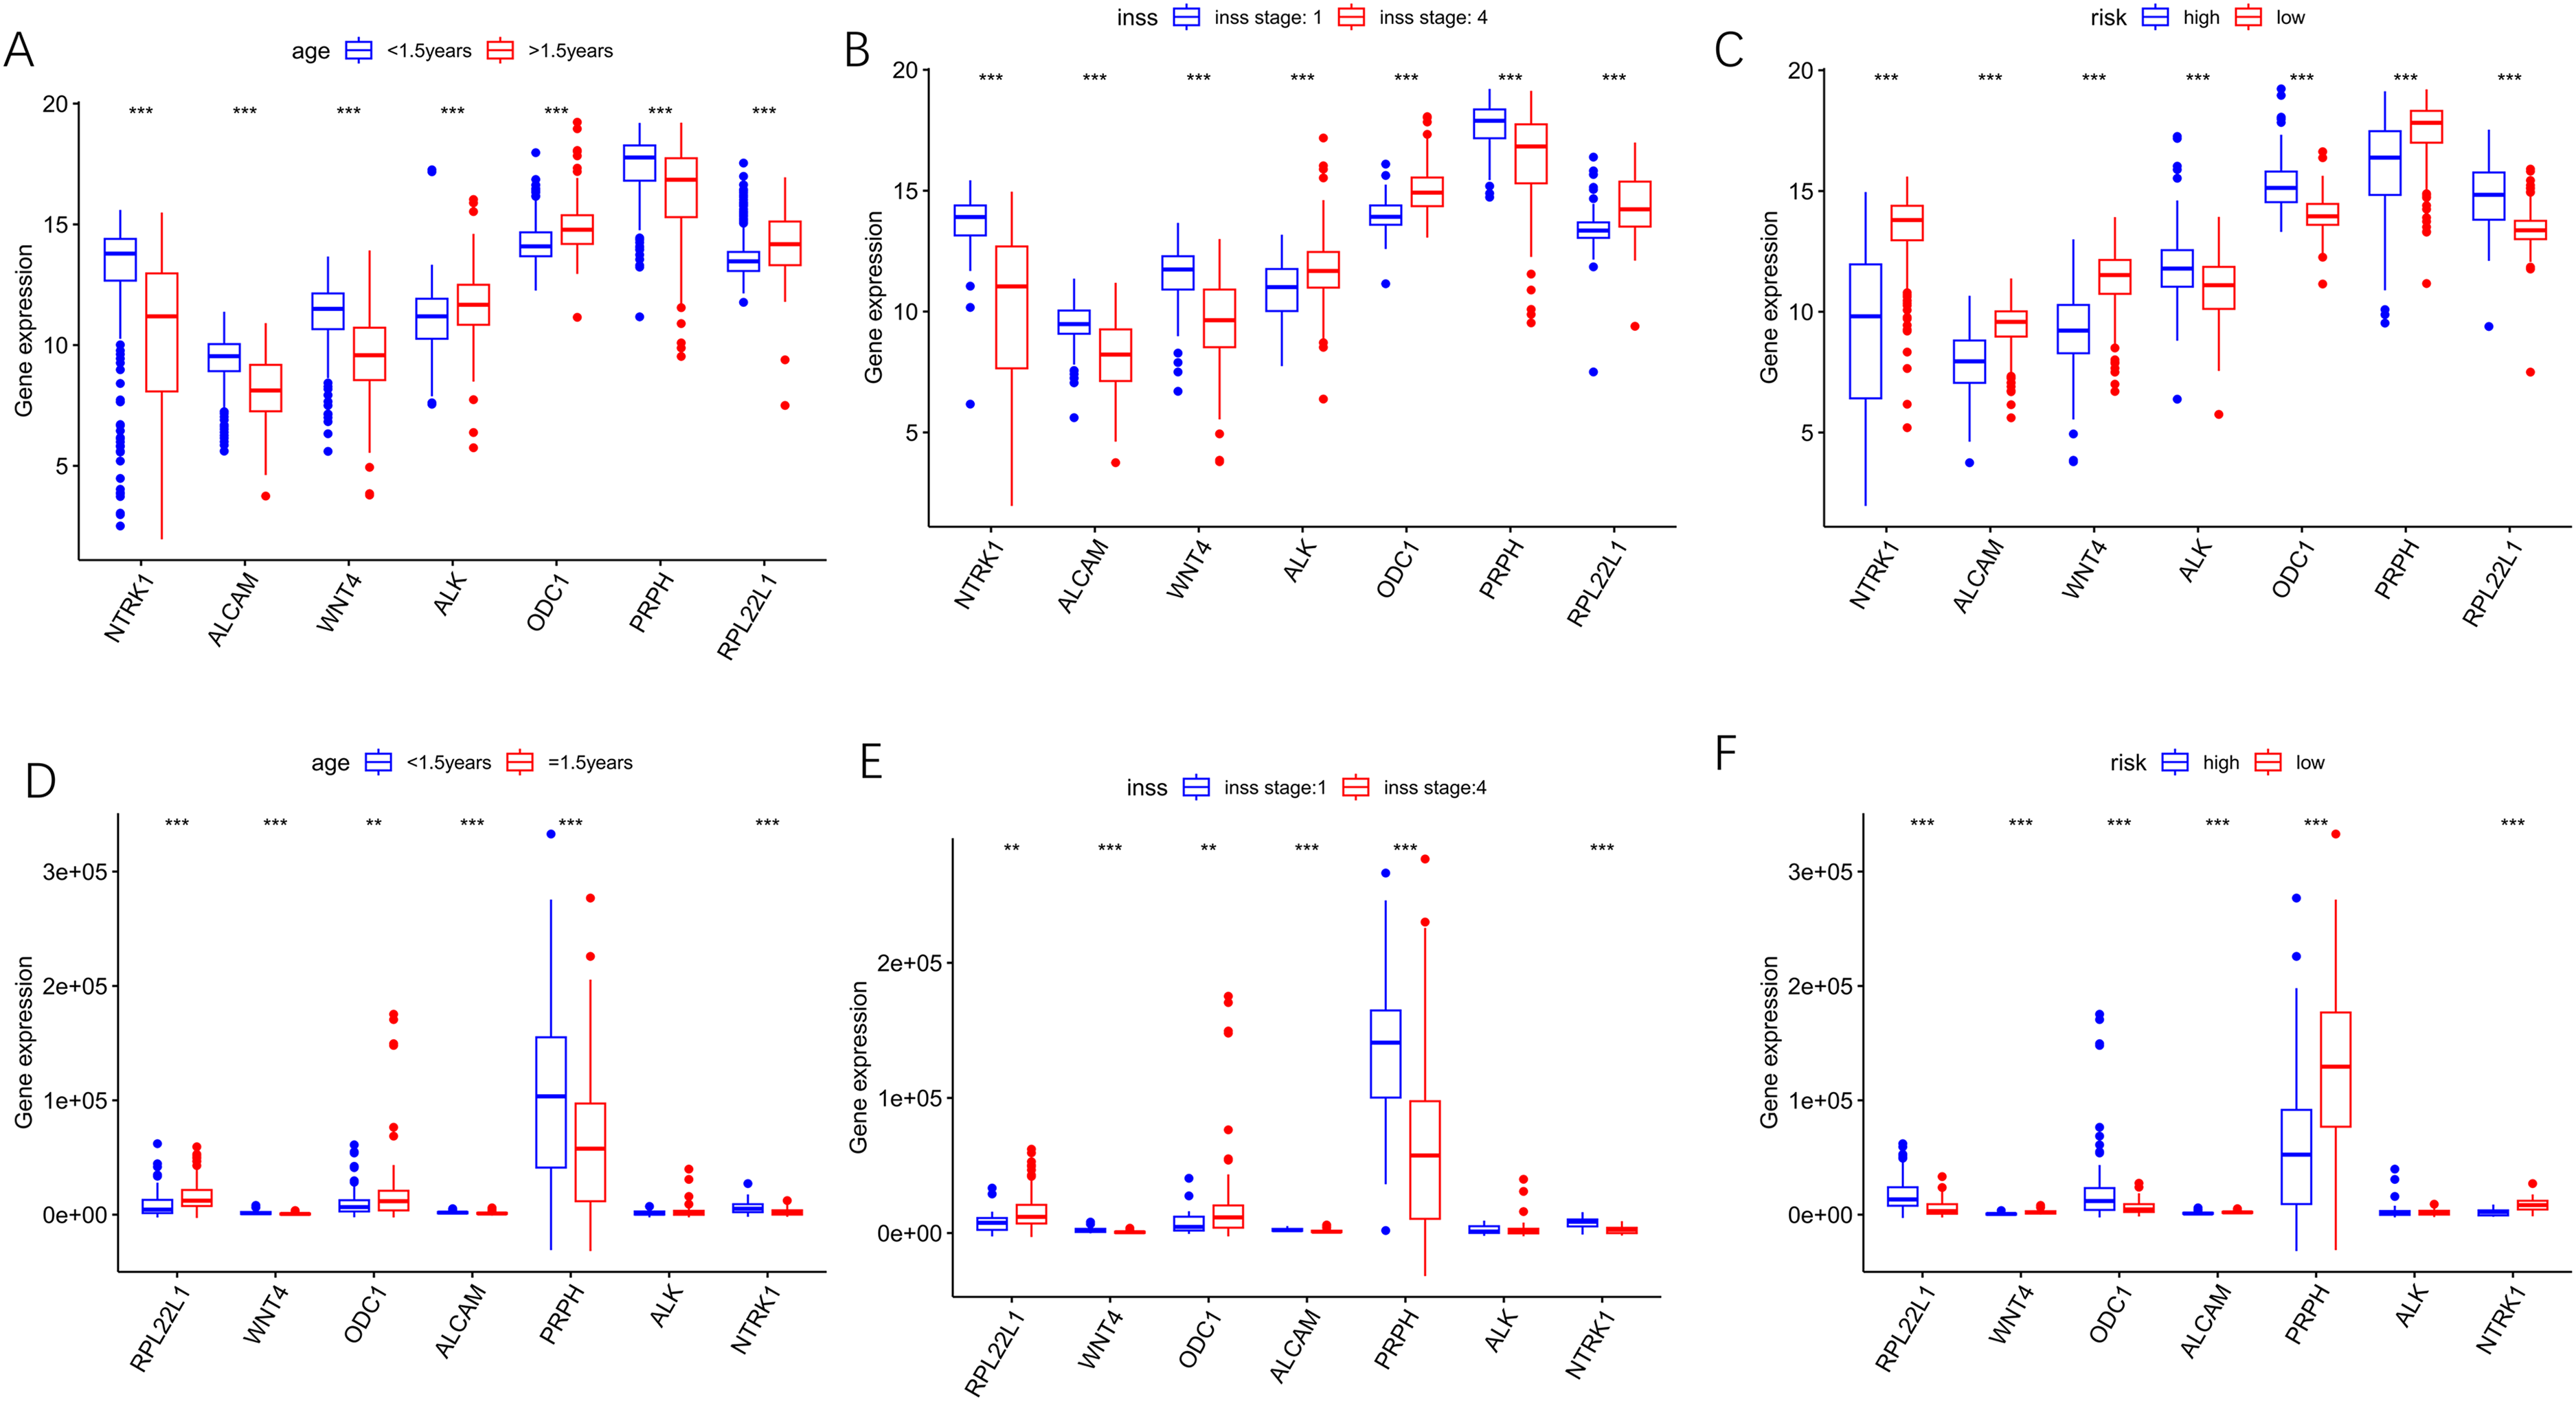
A box chart showing the variation in expression levels of 7 prognostic genes. (A-C) The boxplot based on GSE49710. (D-F) The boxplot based on the validation set.
Prognostic pan-cancer analysis of core genes
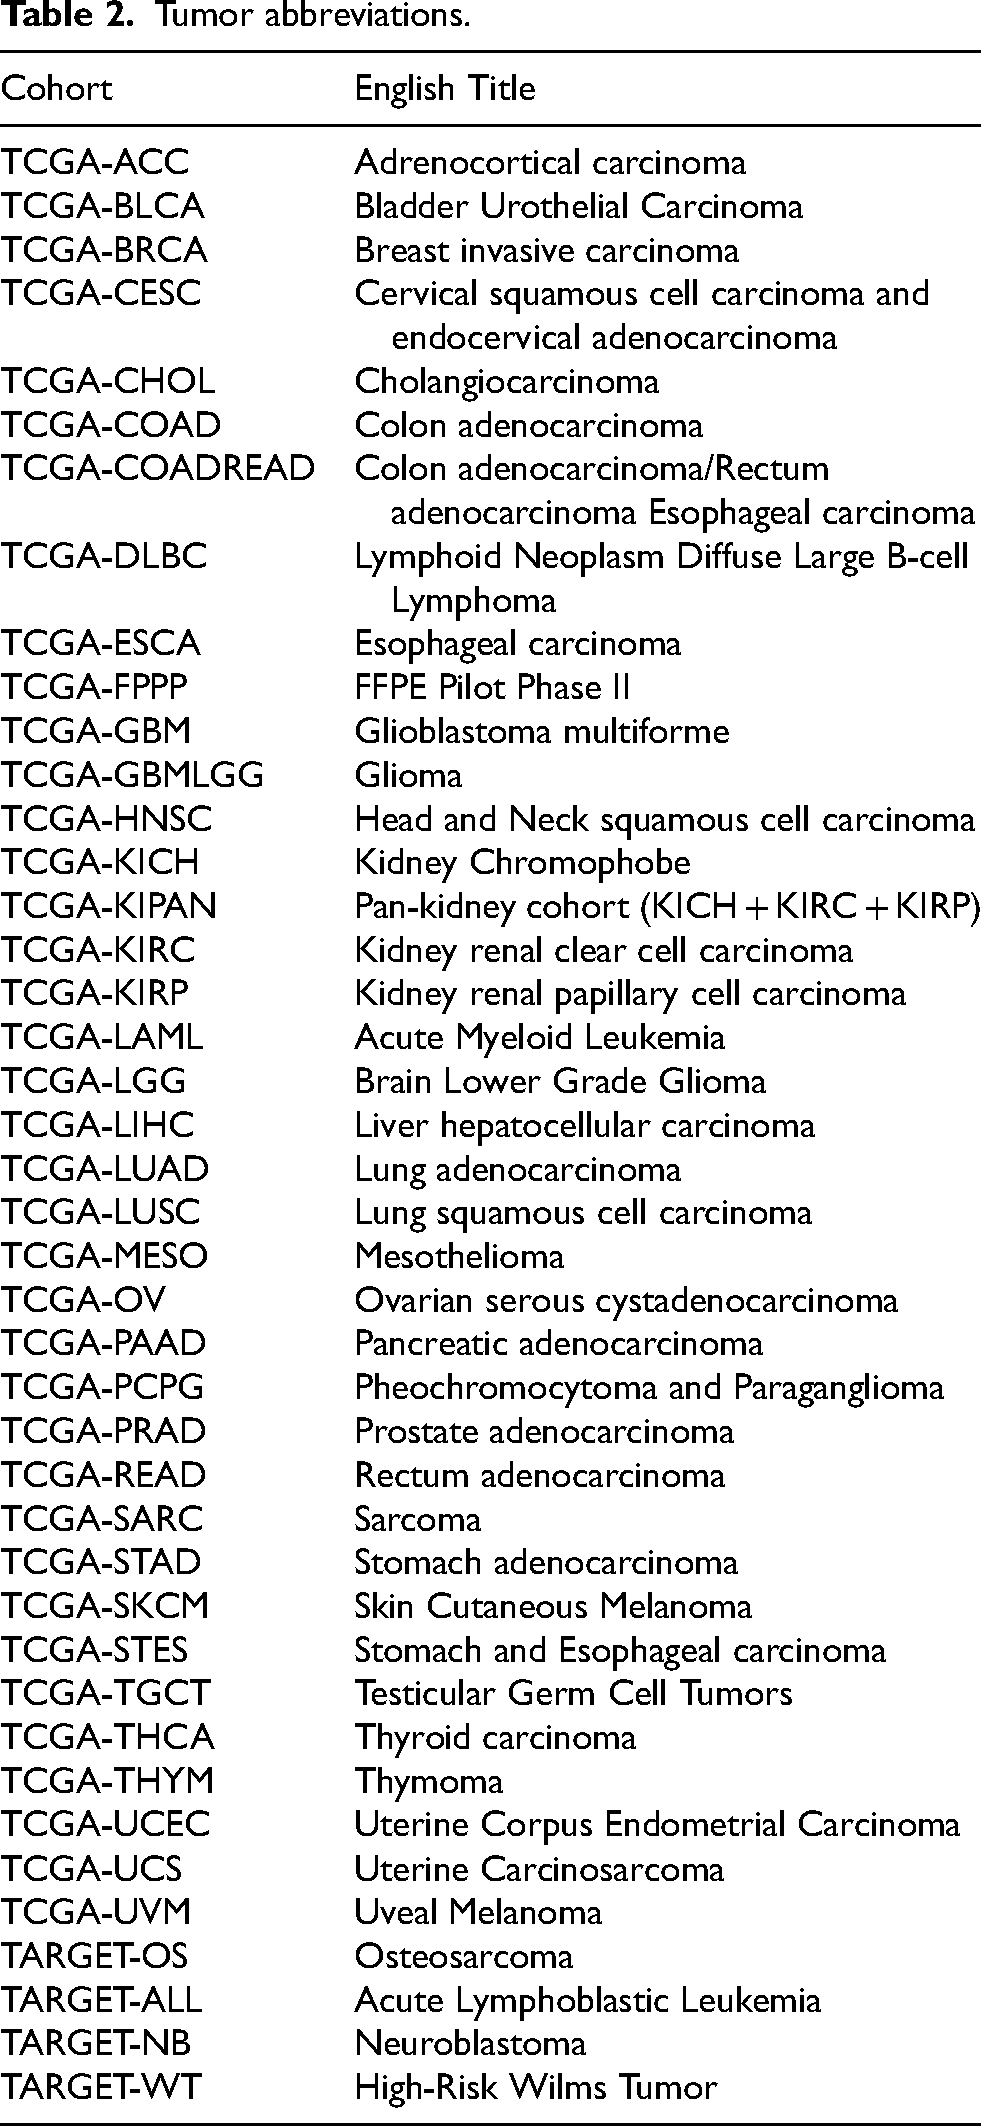
The pan-cancer analysis for genes RPL22L1 and WNT4 resulted in the expression data and corresponding overall survival data of 44 cancer types (TCGA-GBM, TCGA-GBMLGG, TCGA-LGG, TCGA-UCEC, TARGET-LAML, TCGA-BRCA, TCGA-CESC, TCGA-LUAD, TCGA-ESCA, TCGA-STES, TCGA-SARC, TCGA-KIRP, TCGA-KIPAN, TCGA-COAD, TCGA-COADREAD, TCGA-PRAD, TCGA-STAD, TCGA-HNSC, TCGA-KIRC, TCGA-LUSC, TCGA-THYM, TCGA-LIHC, TARGET-WT, TCGA-SKCM-P, TCGA-SKCM, TCGA-BLCA, TCGA-SKCM-M, TCGA-THCA, TARGET-NB, TCGA-MESO, TCGA-READ, TCGA-OV, TCGA-UVM, TCGA-PAAD, TCGA-TGCT, TCGA-UCS, TCGA-LAML, TARGET-ALL, TCGA-PCPG, TCGA-ACC, TARGET-ALL-R, TCGA-DLBC, TCGA-KICH, TCGA-CHOL). The Tumor Abbreviations are shown in the following Table 2.
Tumor abbreviations.
It was observed that high expression of gene RPL22L1 was associated with poor prognosis in 10 tumor types (e.g., TCGA-KIRP, TCGA-KIPAN, TCGA-PRAD, TCGA-HNSC, TCGA-KIRC, TARGET-NB, TCGA-MESO, TCGA-PAAD, TCGA-ACC, TCGA-KICH), while low expression was linked to poor prognosis in 2 tumor types (e.g., TCGA-OV, TCGA-LAML). Likewise, high expression of gene WNT4 was associated with poor prognosis in 4 tumor types (e.g., TCGA-KIRP, TCGA-KIRC, TCGA-LAML, TCGA-ACC), whereas low expression was linked to poor prognosis in 3 tumor types (e.g., TCGA-COADREAD, TARGET-NB, TCGA-PAAD) (Figure 8).
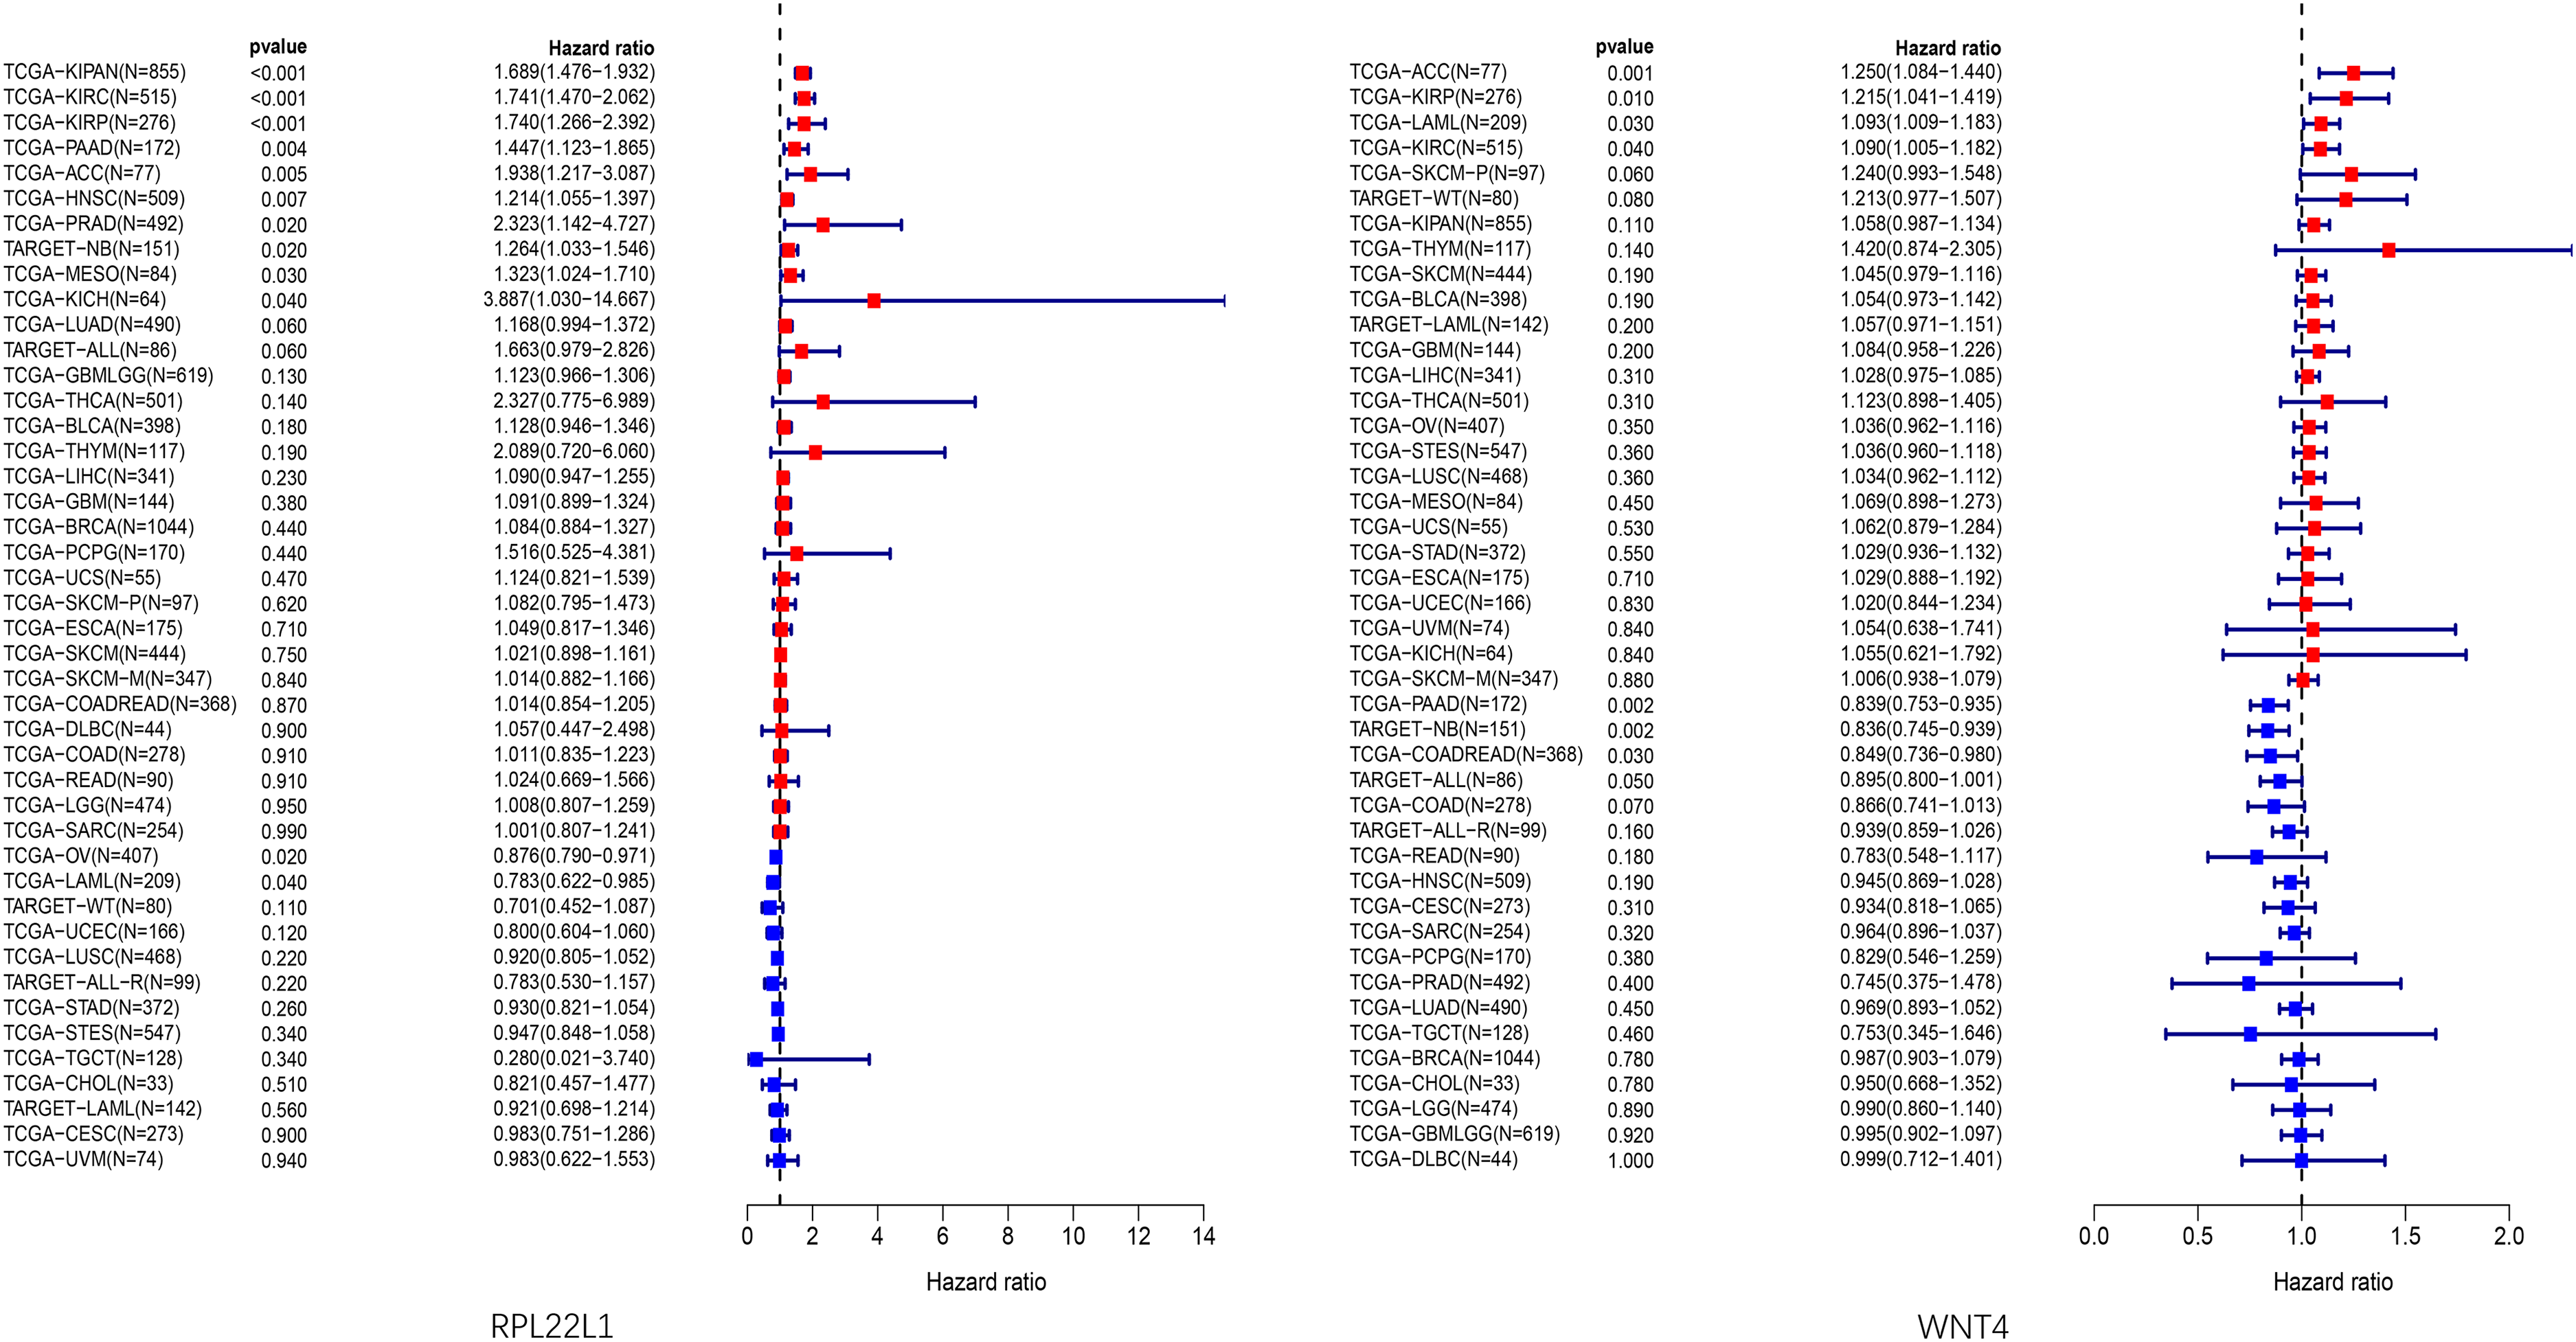
Prognostic forest plot of core genes in pan-cancer analysis.
Except for associations with the prognosis of various other cancer types, both core genes showed significant differences in gene expression in the prognosis of NB, consistent with previous analyses.
Risk prediction of outcome events by nomograms
A multifactorial regression model was constructed and used to visualize the value of prognostic genes in individual risk evaluation through Nomograms (Figure 9A). The model showed a positive correlation between RPL22L1 expression and a rising score, while WNT4 exhibited the opposite trend. The correction curve and ROC curve were used to evaluate the model's discrimination, and the predicted 3-year survival rate aligned with the actual results (Figure 9B-D). The AUC areas of both the time-dependent ROC curve and the multi-factor ROC curve were greater than 0.5, indicating good model performance. Among them, the AUC area of the risk score was the largest, and the ROC curve of this variable was the most ideal (Figure 9E-F). The AUC area of the ROC curve of the model constructed from the test set was also above 0.5, and the ROC curves of each variable were basically consistent with those of the training set, further enhancing the credibility of the model (Figure 9G-H).
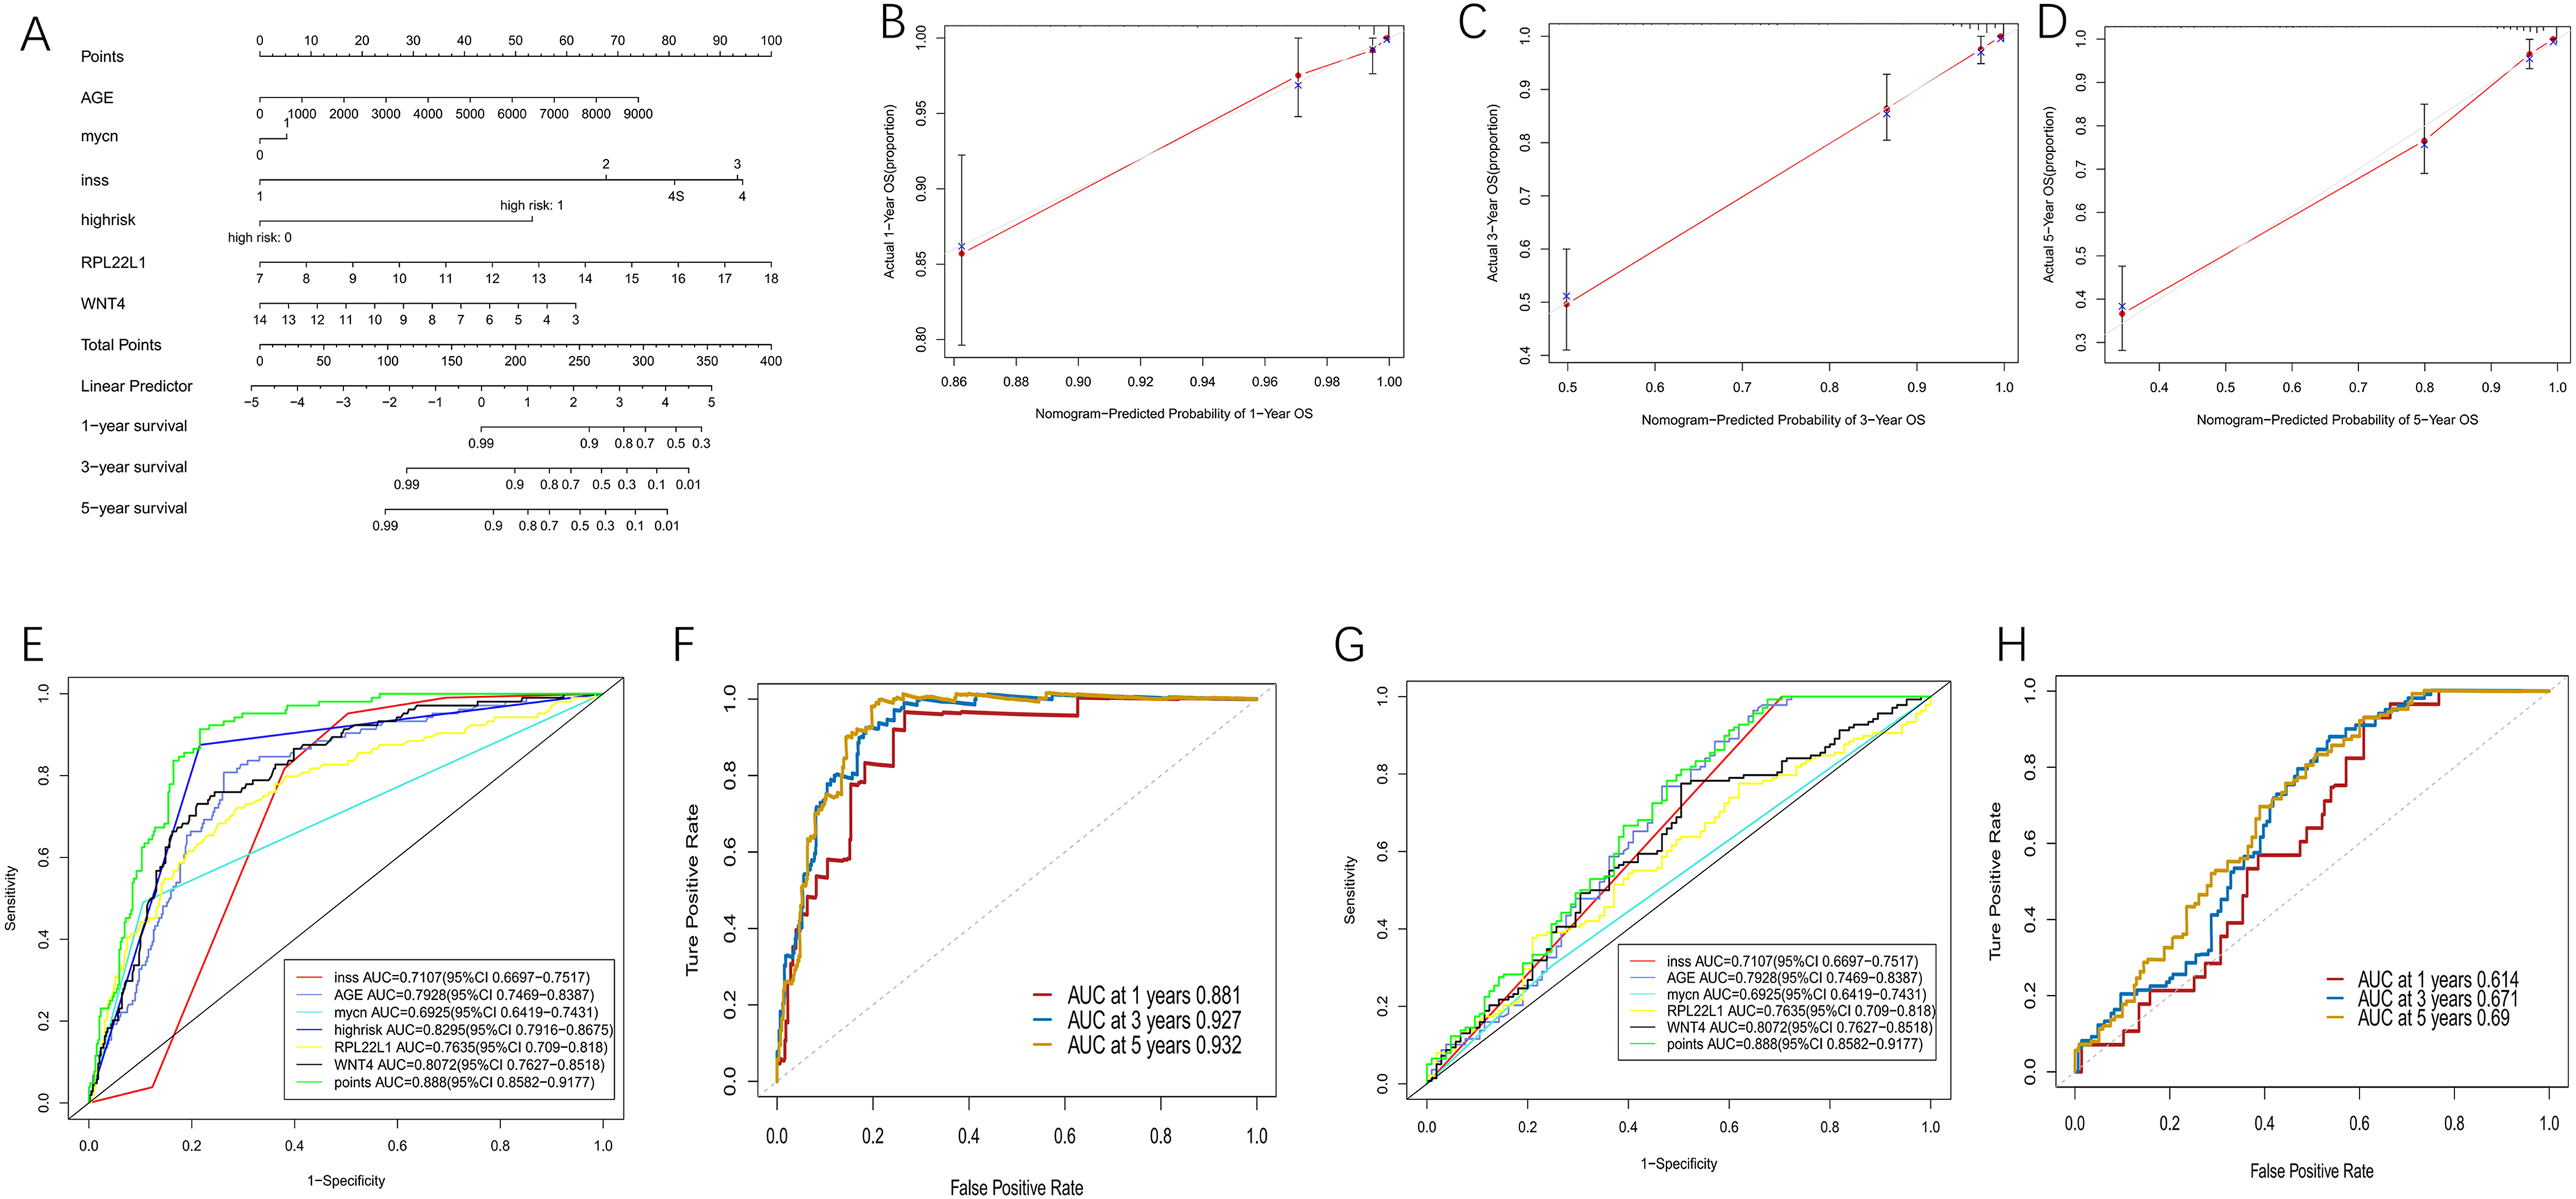
Multi-factor regression analysis based on GSE49710. (A) The nomogram was drawn by integrating age, MYCN amplification, INSS staging, high-risk groups, and expression of RPL22L1 and WNT4 genes. (B-D) Correction curve of nomogram in 1-year, 3-year, 5-year. (E)Multivariate ROC curve for training set. (F) NOMOGRAPH ROC curve of 1-year, 3-year, and 5-year for training set. (G)Multivariate ROC curve for testing set. (H)NOMOGRAPH ROC curve of 1-year, 3-year, and 5-year for testing set.
Immune infiltration analysis
The samples of GSE49710 were divided into high-risk and low-risk groups according to the median risk score obtained from the Cox line chart model. The ssGSEA algorithm quantified the degree of immune cell infiltration in 28 types of immune cells for both groups (Figure 10A). Notable differences in immune cell infiltration were observed between the high-risk group and the low-risk group, such as activated CD4 T cells, activated dendritic cells, immune dendritic cells, monocytes, natural killer cells, and memory B cells. The low-risk group was mainly distinguished by infiltration of dendritic cells, immune dendritic cells, natural killer cells, and monocytes, while the high-risk group showed the opposite pattern.
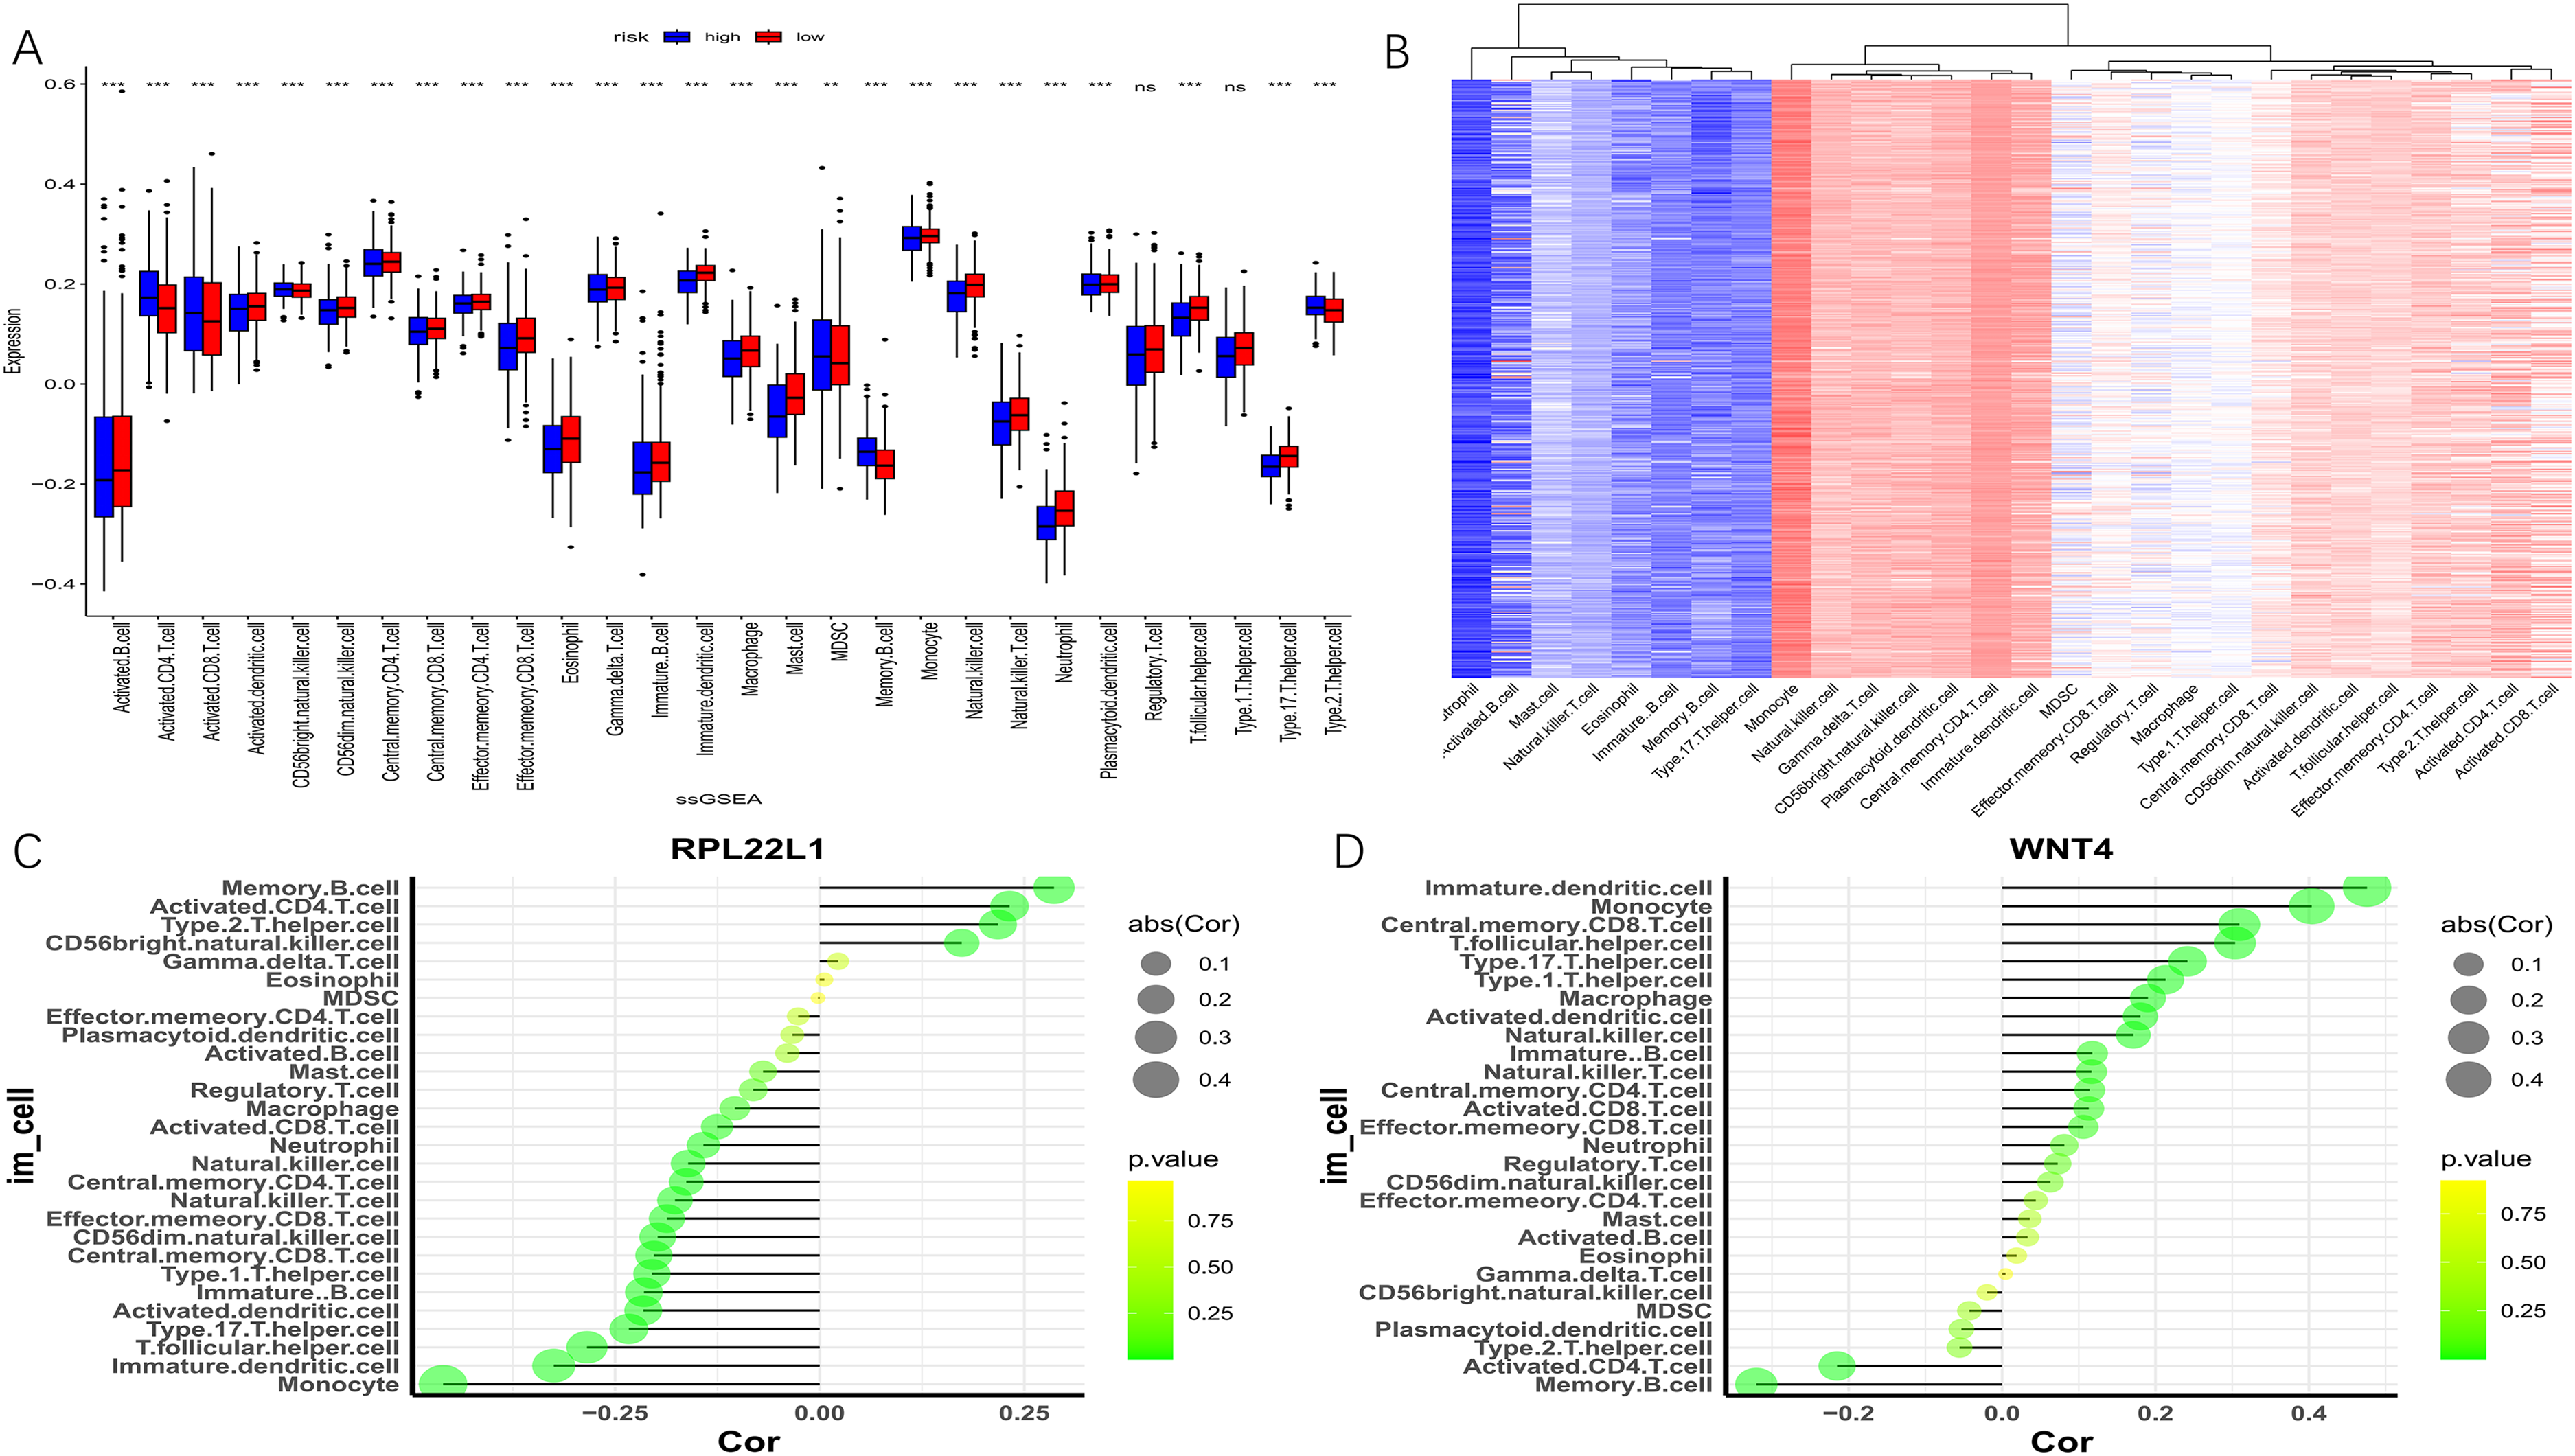
Immune infiltration analysis based on GSE49710. (A) Box plot analysis of differences in immune cell infiltration between high-risk group and low-risk group for 28 immune cells. (B) Heat map showing the abundance distribution of 28 immune cell types. (C-D) Dot plots illustrating the correlation of core genes RPL22L1 and WNT4 with immune cells.
The core gene RPL22L1 exhibited a negative correlation with helper T follicular cells, monocytes, immune dendritic cells, natural killer cells, and natural killer T cells while showing a positive correlation with activated CD4 T cells, memory B cells, and type 2 helper T cells (Figure 10C). On the other hand, gene WNT4 exhibited a negative correlation with activated CD4 T cells, memory B cells, and type 2 helper T cells, but a positive correlation with helper T follicular cells, monocytes, immune dendritic cells, and natural killer cells (Figure 10D). Overall, the two core genes exhibited markedly distinct patterns of immune cell infiltration.
Immune checkpoint analysis
A matrix of 71 immune checkpoint genes was extracted from the dataset GSE49710, and as shown by the correlation analysis with the target gene RPL22L1, among the 71 immune checkpoint genes, RPL22L1 had the greatest correlation with PVR, with a correlation coefficient of 0.44, which was positively correlated. And it was negatively correlated with most of the other immune checkpoint genes (Figure 11).
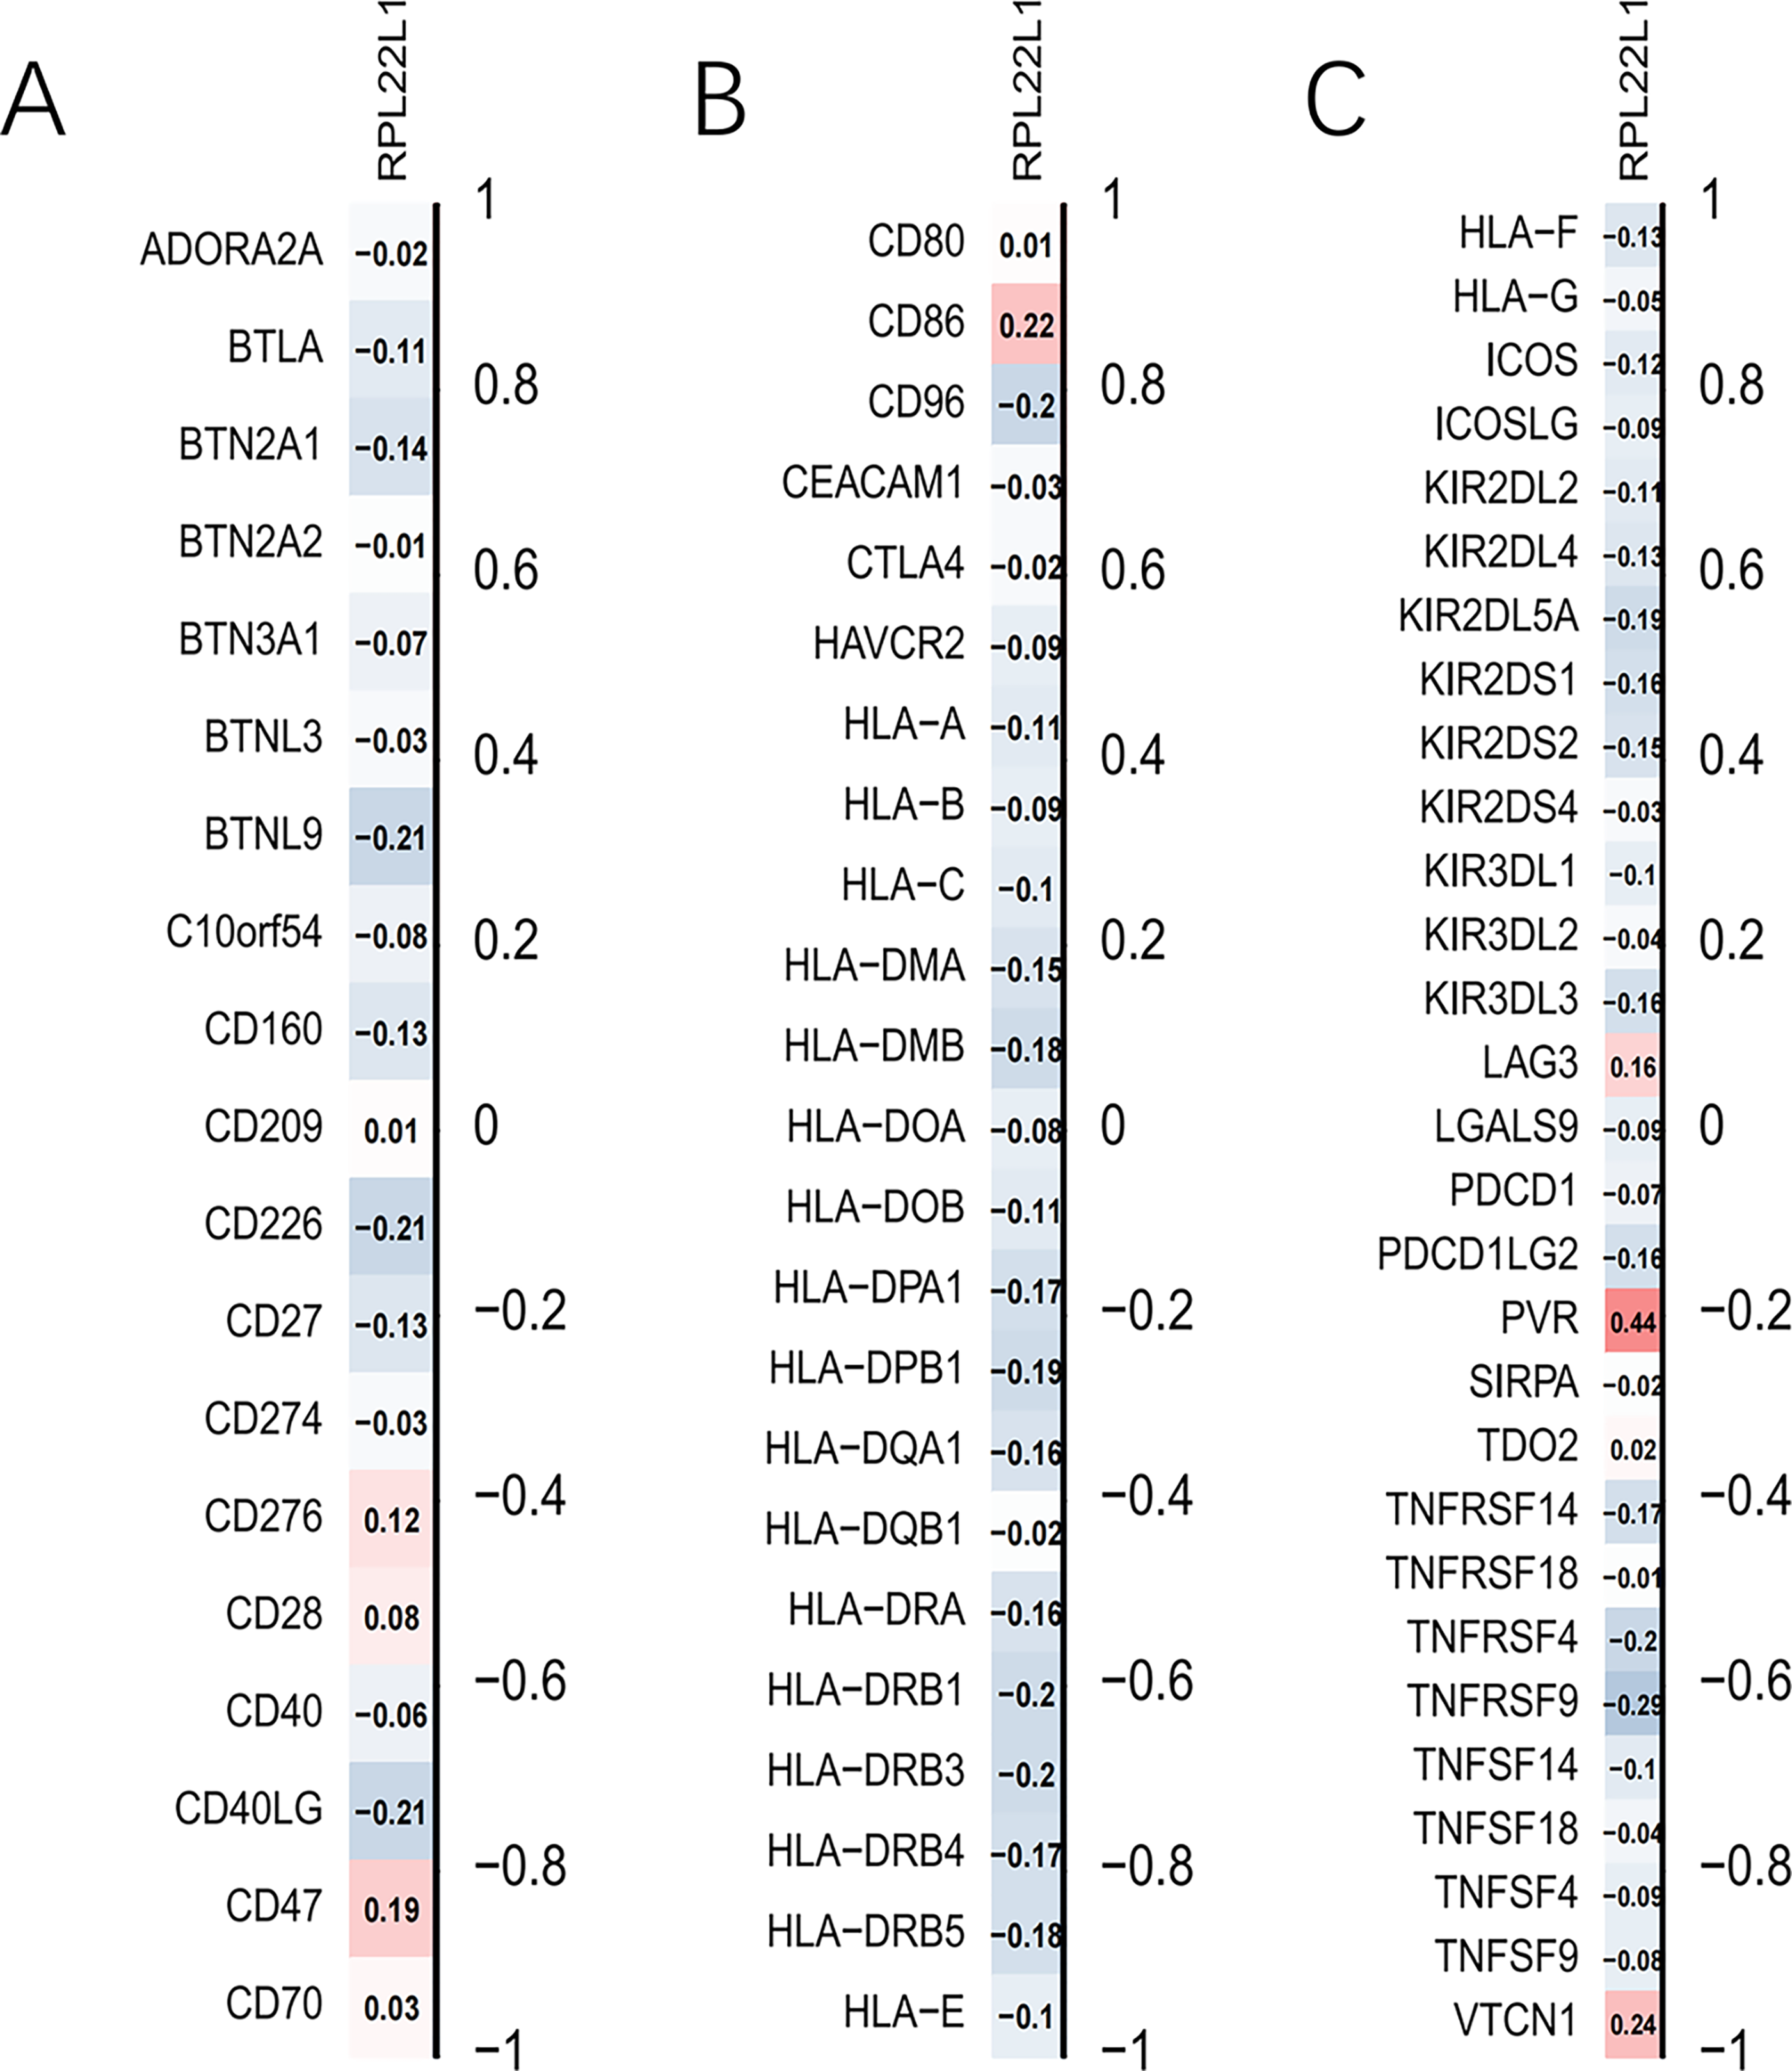
Correlation analysis of single genes with immune checkpoints.
Drug sensitivity analysis
The p-value of 153 of the 198 drugs in the drug sensitivity analysis was less than 0.01, and most of the drugs were more sensitive to samples with low RPL22L1 expression and included certain telomerase inhibitors, such as Telomerase Inhibitor IX_1930, AZD5153 (Figure 12J-K), and others. Nine drugs were more sensitive to patients with high RPL22L1 expression (Figure 12A-1). ERKi, Sorafenib, etc. as drugs known to be associated with reduced resistance to tumors and RPL22L1 overexpression, their high drug sensitivity was also more pronounced in the low expression group (Figure 12L-N).
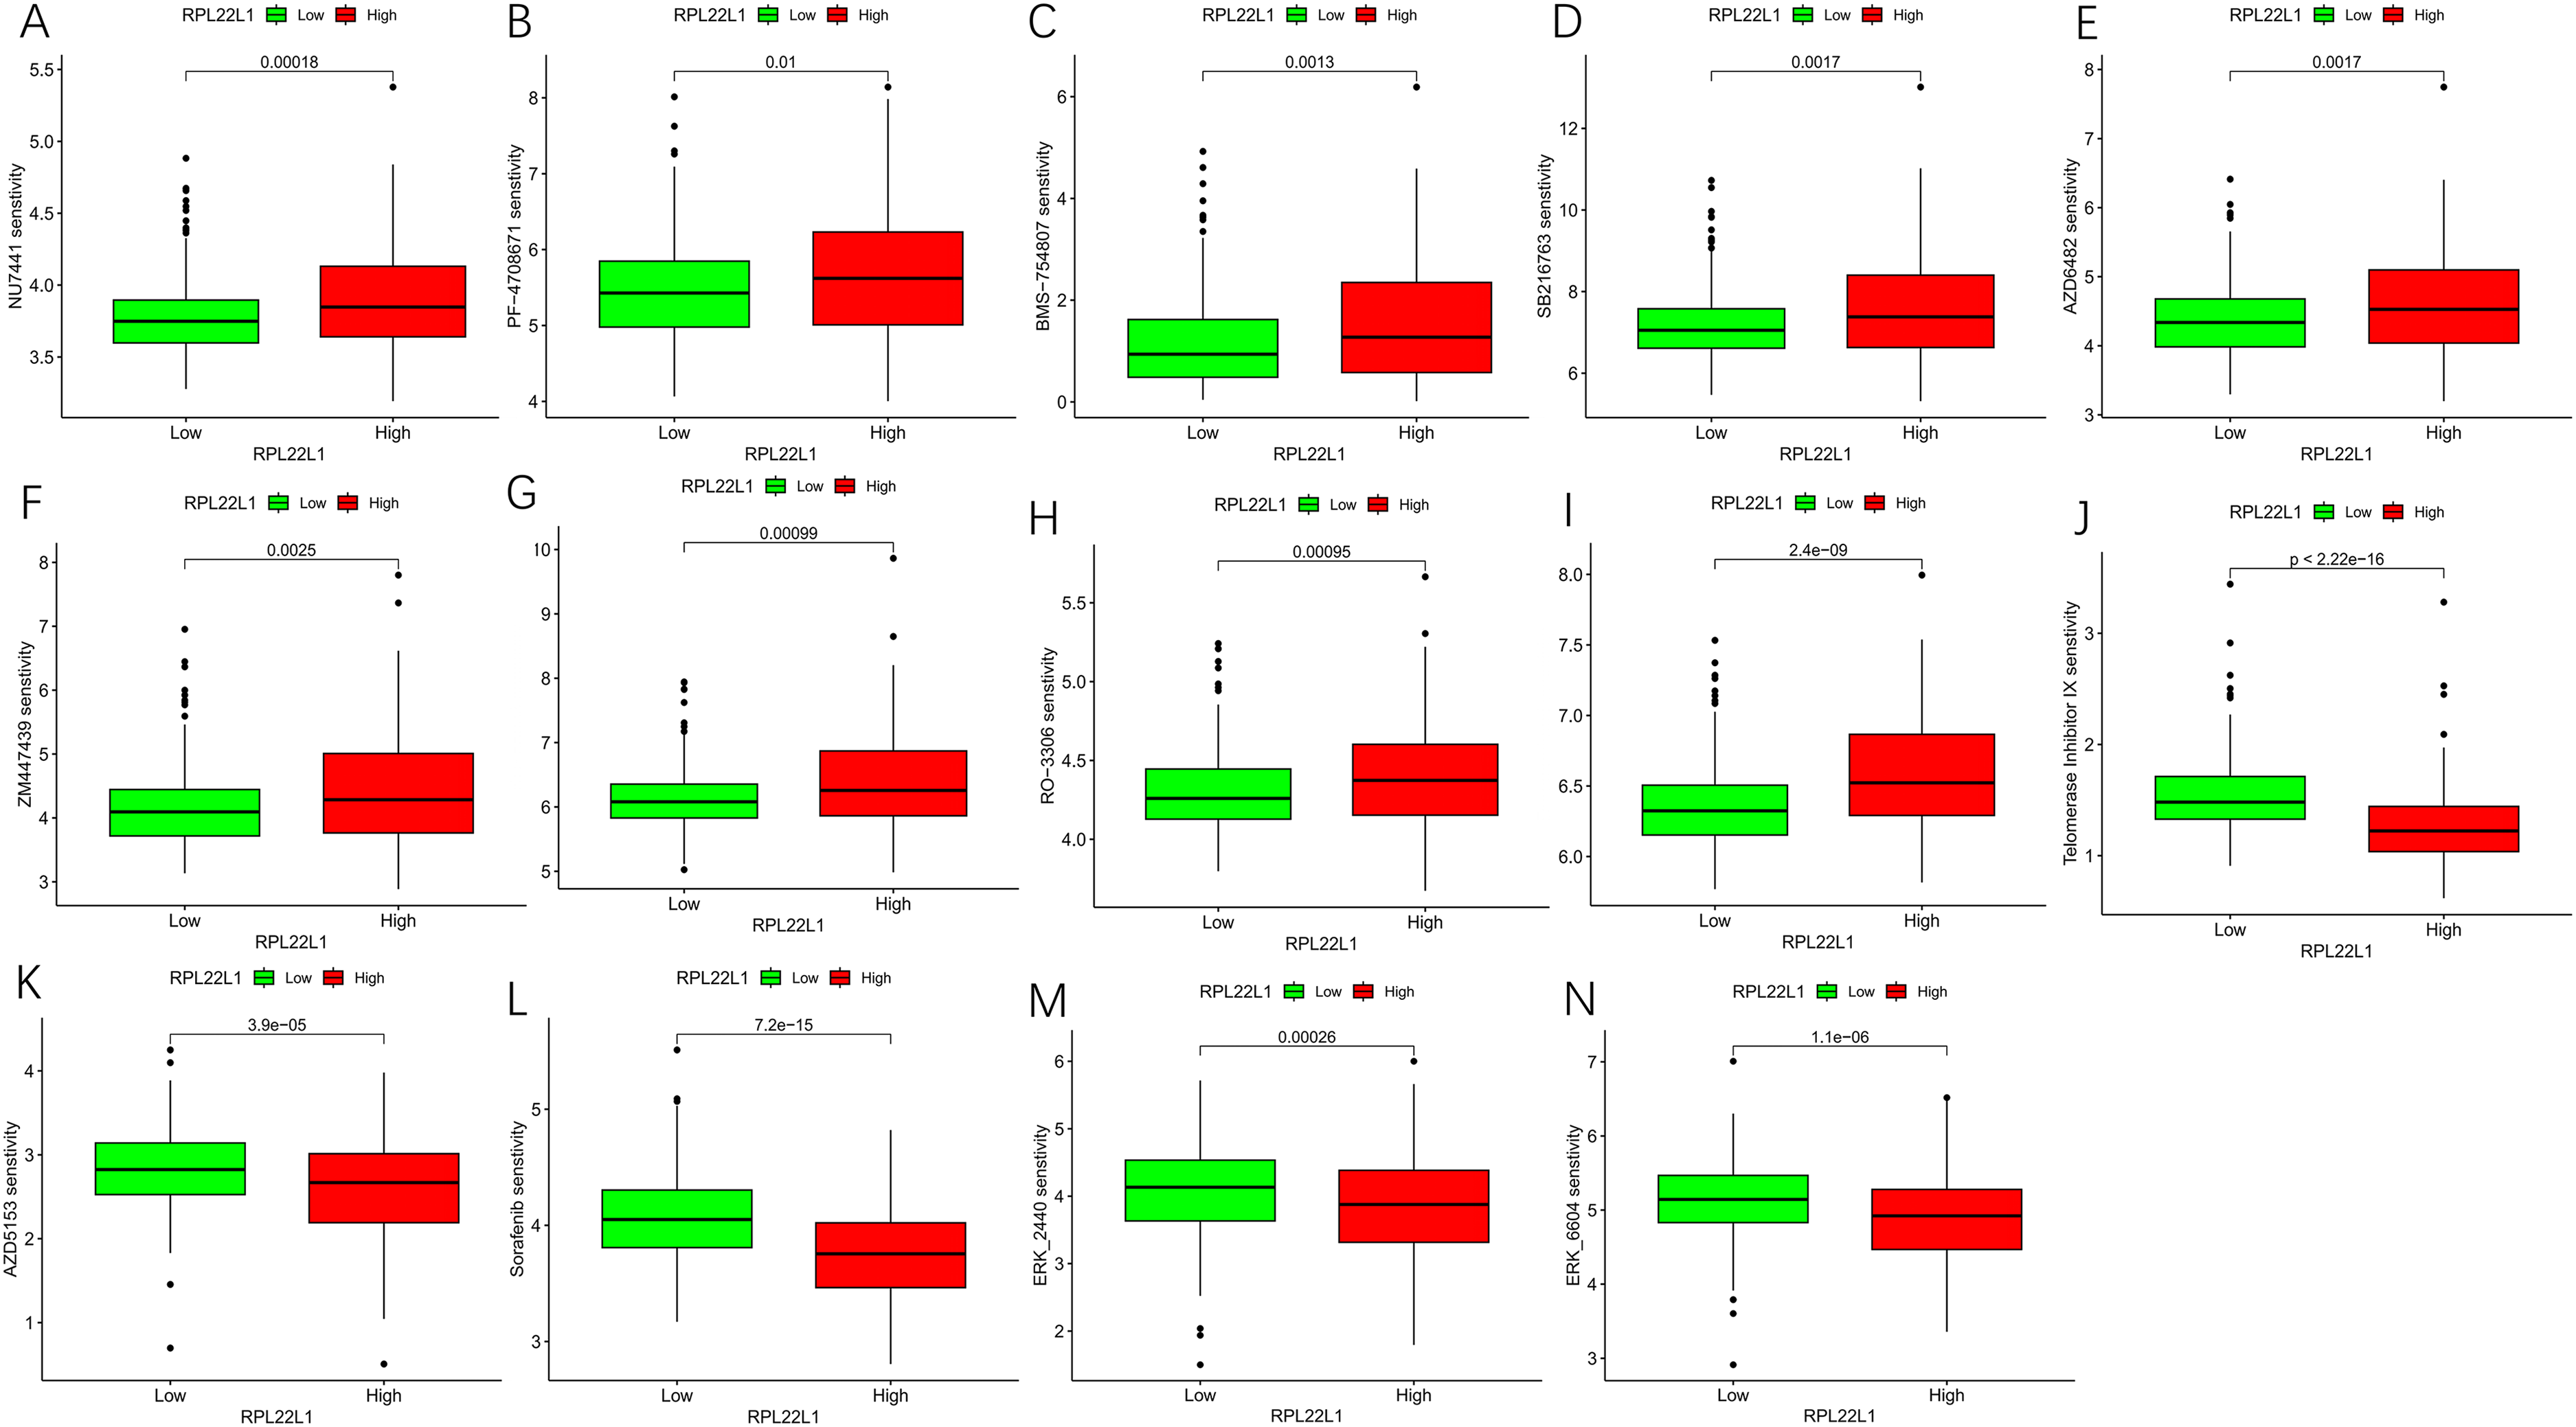
Box plots of drug sensitivity analysis. (A-I) Box plots of 9 drugs more sensitive to high RPL22L1 expression. (J-K) Box plots of 2 telomerase inhibiting drugs. (L-N) Box plots of 3 Drugs with reduced resistance to tumors associated with RPL22L1 overexpression.
Construction of protein-protein interaction networks and miRNA-mRNA-TF regulatory network
The PPI consists of 23 nodes and 81 edges, with a PPI enrichment p-value of 4.43E-10 and an average local clustering coefficient of 0.727 (Figure 13A). A total of 194 miRNA-target relationships and 3 TF-target relationships were identified in the mirNet database, among which 12 miRNAs interacted with both core genes RPL22L1 and WNT4 (Figure 13B). Notably, hsa-mir-16-5p has interactions with two genes, MYCN and DMRT2, which have been found to play an important role in NB.20,21
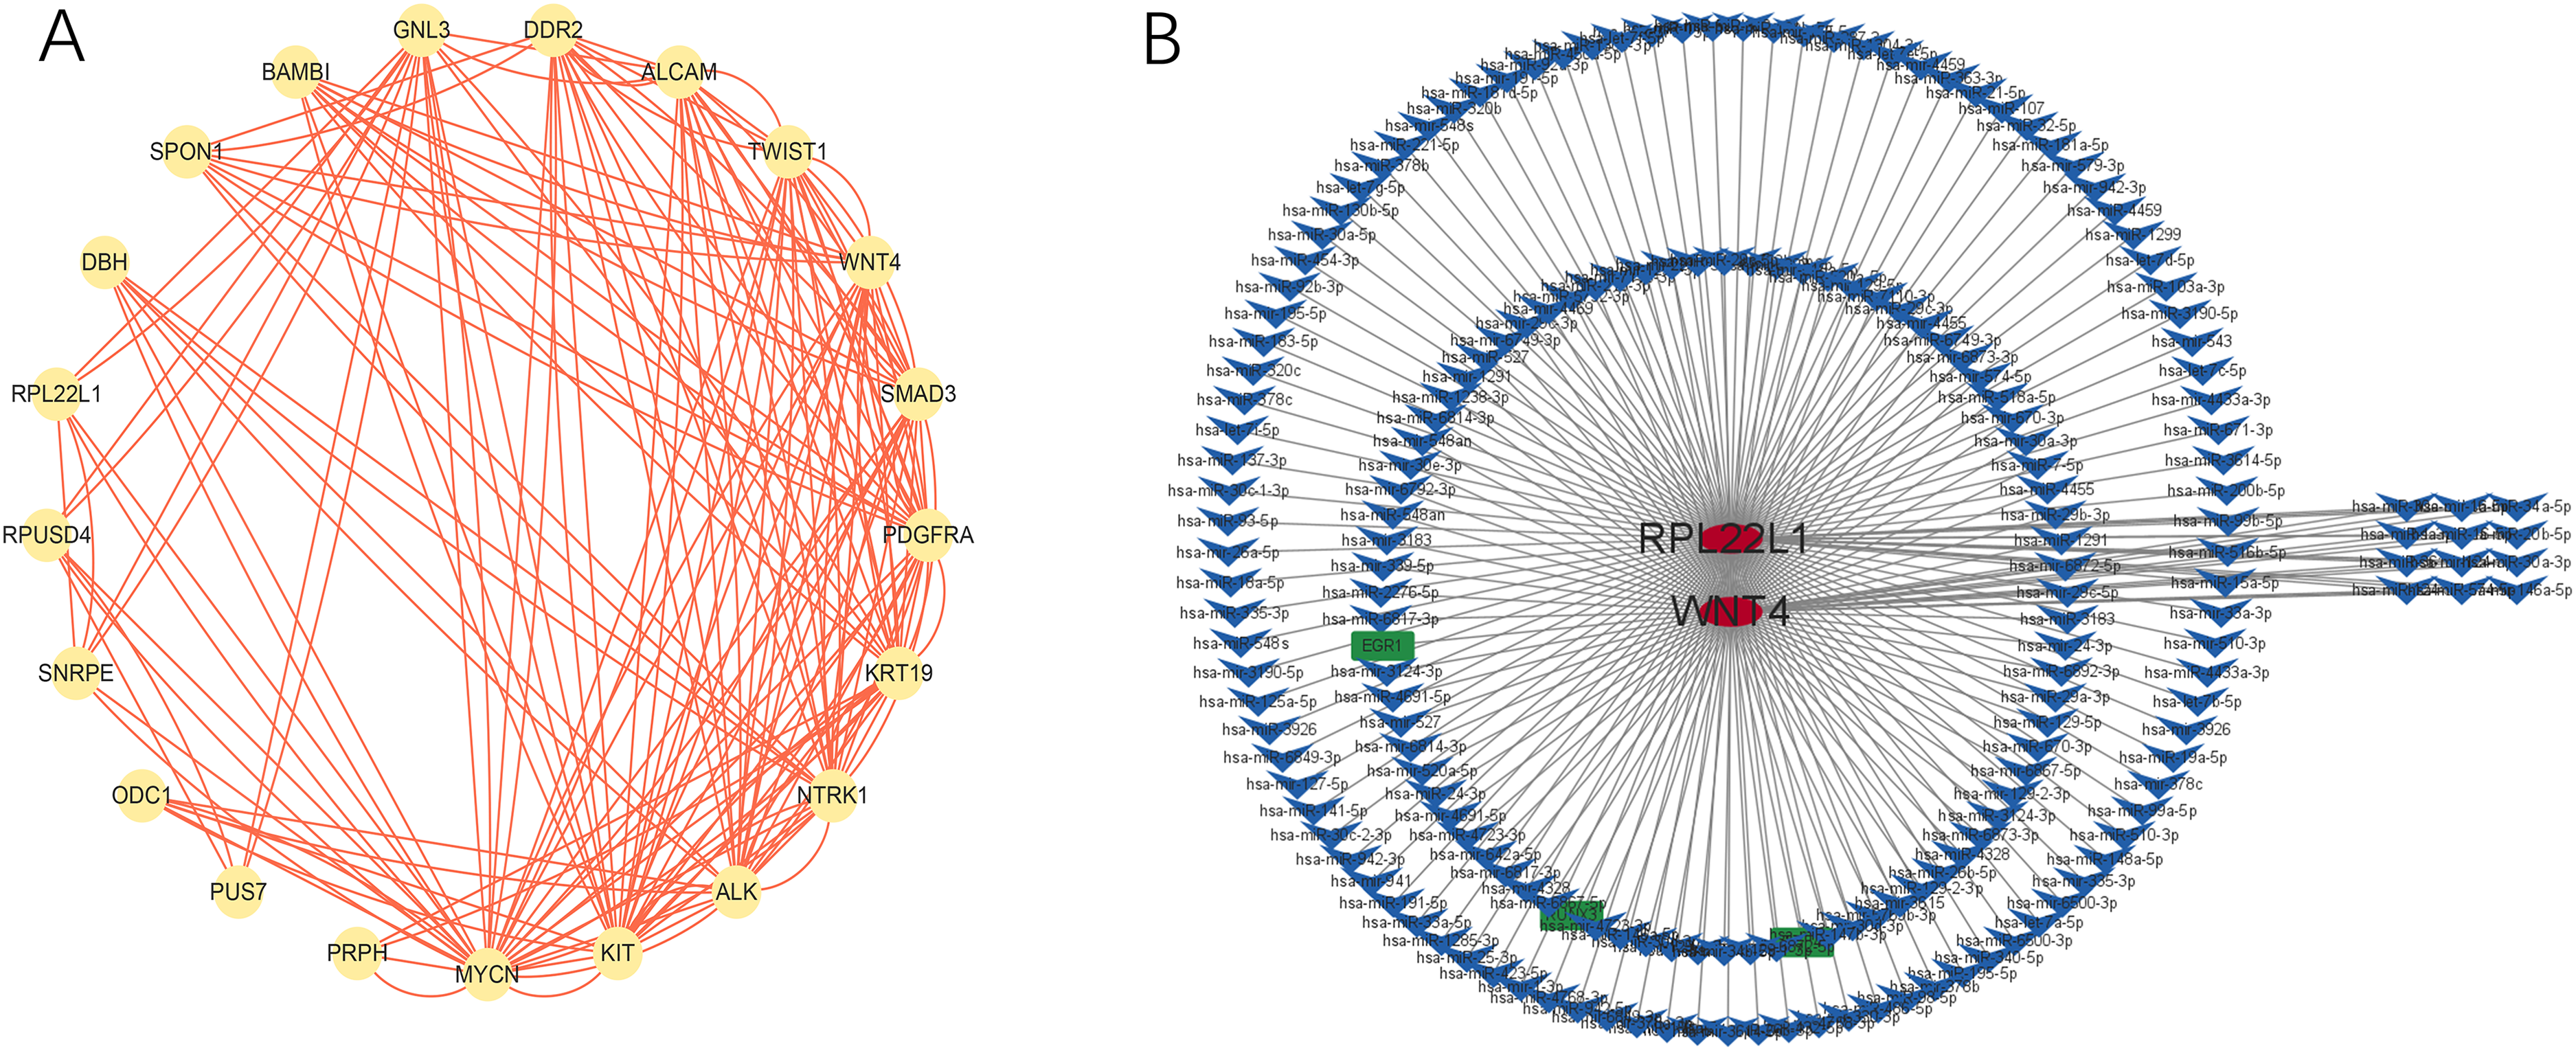
Diagram of protein-protein interaction networks and miRNA-mRNA-TF regulatory network (A-B).
RT-PCR verified the expression of key genes in NB tissue samples
Two unverified genes, RPL22L1 and WNT4, were selected. RPL22L1 was highly expressed in NB tissues compared to normal tissues as indicated by RT-PCR (Figure 14A). In contrast, the expression of WNT4 was significantly lower in NB tissues than in normal tissue (Figure 14B). These results were consistent with the previous bioinformatics analysis.
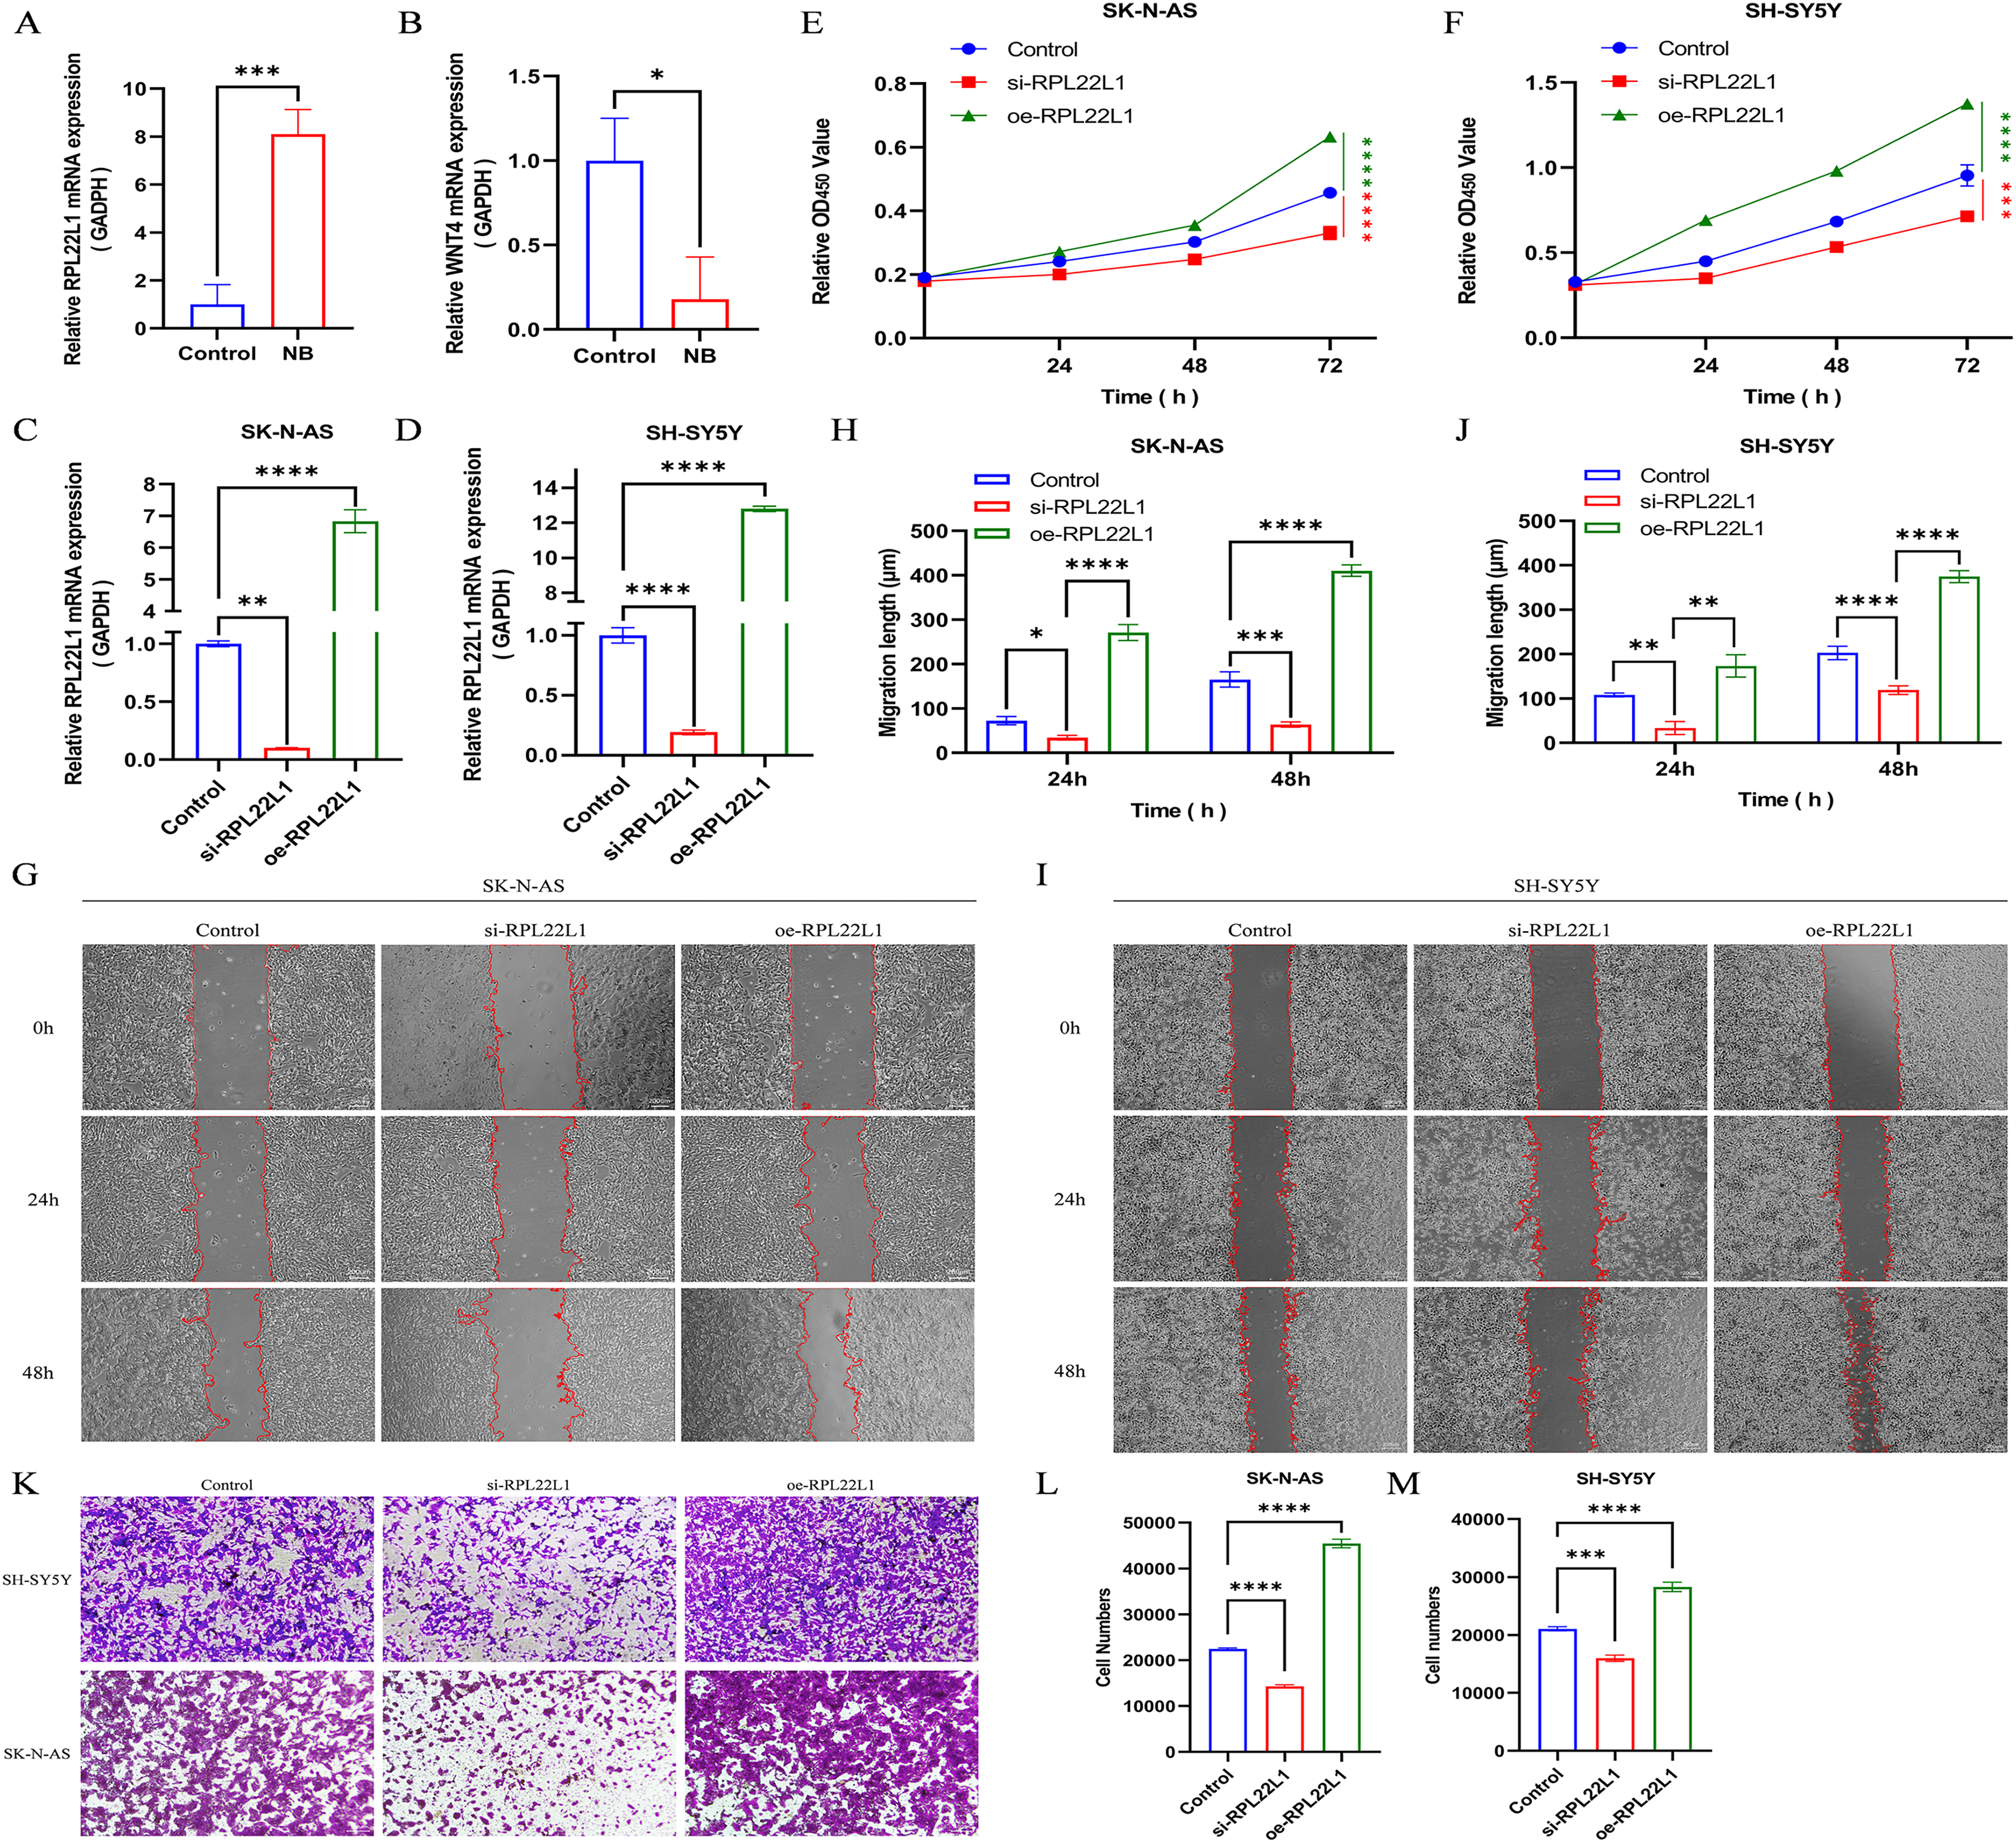
Tissue and cellular experiments were used to explore the mechanism of RPL22L1 gene in NB. (A-B) The expression of RPL22L1 and WNT4 in NB tissue was quantified by RT-PCR. (C-D) mRNA expression levels in SK-N-AS and SH-SY5Y cells in the negative control, knockdown, and overexpression groups. (E-F) CCK-8 assay was performed to measure the proliferation capacity of cells. (G-J) The Wound-healing assay was performed to examine the effect of knockdown and overexpression of RPL22L1 on migration capacity. (K-M) Transwell assay was conducted to determine the effect of knockdown and overexpression of RPL22L1 on NB invasion capacity. Data are represented as mean ± SD from three independent experiments (*P < 0.05, **P < 0.01, ***P < 0.001, ****P < 0.0001 indicate significant differences between the groups shown.).
Effect of RPL22L1 on NB cell proliferation, migration, and invasion
According to the RT-PCR results, the expression level of RPL22L1 gene exhibited a significantly greater difference compared to WNT4, leading to the selection of RPL22L1 for further study. It was found that RPL22L1 was a potential candidate for further study. Specifically, RPL22L1 expression was markedly down-regulated in both SK-N-AS and SH-SY5Y cells after transfecting si-RPL22L1 for subsequent experiments (Figure 14C-D). The CCK-8 assay showed that RPL22L1 knockdown dramatically inhibited cell proliferation (Figure 14E-F). Furthermore, Both the wound-healing assay and Transwell assay indicated that down-regulated RPL22L1 can inhibit cell migration and invasion (Figure 14G-H and K-L). In contrast, the overexpression of RPL22L1 significantly enhanced the proliferation, migration, and invasion of NB cells (Figure 14C-M). Collectively, these results suggest that RPL22L1 can promote the progression of NB and may function as an oncogene in this context.
Discussion
NB is one of the most common solid tumors found in infants and children. The pathogenesis of NB is quite complex. An imbalance in gene expression and internal and external environmental factors are considered important, as many cases have shown, but the exact pathogenesis remains unclear. Despite considerable progress in treating NB, patients with advanced stages of NB still face a poor prognosis. 22 Most HRNB patients still relapse and die from drug-resistant disease. 23
Telomeres are small DNA-protein complexes located at the termini of linear chromosomes in eukaryotic cells. The repeat series of telomere sequences, along with telomere-binding proteins, provides a unique “cap” structure that is essential for preserving chromosome integrity and regulating cell division cycles. Telomeric DNA is composed of simple DNA with highly repetitive sequences. Telomerase is an enzyme that extends DNA by adding repetitive nucleotide sequences to the ends of chromosomes. Once telomeres are depleted, cell division will damage essential DNA regions, ultimately resulting in cell death. Telomerase is activated in numerous cancer cells, leading to the addition of telomere sequences at the ends of telomeres. This sustains the continuous division ability of cells and facilitates rapid tumor growth. Approximately 90% of malignant tumors exhibit abnormal telomerase expression, such as renal cancer, laryngeal cancer, and colorectal cancer. 24 Hiyama et al. 25 have reported abnormal activity and expression levels of telomerase in NB. In their analysis of telomerase activity in 100 cases of NB, 94% of NB expressed telomerase activity. Furthermore, NB with high telomerase activity exhibited additional genetic alterations, such as NMYC amplification. Recent advancements in high-throughput sequencing technology and bioinformatics have enabled thorough exploration of genetic information.
Machine Learning (ML) effectively generates real-world evidence to support clinical decision-making. 26 It can predict relationships between inputs and outputs through complex function mappings, even without a detailed understanding of the underlying mechanisms. 27 ML has been successfully applied in medical image analysis, diagnosis, DNA sequence identification, protein structure prediction, and biophysical cue screening. 28
Our study used Weighted Gene Co-expression Network Analysis (WGCNA) and differential analysis to screen for abnormal Transcriptionally Active Regions of the Genome (TARG) in Neuroblastoma (NB). As a result, seven key genes, PRPH, RPL22L1, ODC1, ALK, NTRK1, ALCAM, and WNT4, closely related to the malignancy of NB were identified using random forest and Lasso + Cox analysis. The ALK protein is a tyrosine kinase receptor commonly activated in pediatric malignant tumors such as anaplastic large cell lymphoma, inflammatory myofibroblastic tumor, rhabdomyosarcoma, and NB. 29 Laurence Lamant et al. 30 found the presence of ALK mRNA and protein in primary NB. Yuko Osajima-Hakomori et al. 31 confirmed the amplification of ALK gene in primary NB tissues and its close association with NB malignancy and prognosis. The strong relationship between ALK and the malignancy of NB is also confirmed in our study. NTRK1 is a neurotrophic factor receptor that is highly expressed in NB patients with a mild course. 32 Hiroyuki Shimada et al. 33 found that NB patients with a high NTRK1 copy number had a better prognosis. We also confirmed that NTRK1 was a protective factor in NB. ODC1 is a key enzyme that regulates polyamine biosynthesis and controls the polyamine transcription within cells. However, elevated polyamine levels are often associated with the rapid proliferation of tumor cells.34,35 In NB, Michael D. Hogarty et al. 36 found that ODC1 was highly co-expressed with MYCN in tumor subgroups with MYCN amplification. Additionally, overexpression of ODC1 was negatively correlated with survival rates in NB patients without MYCN amplification. Our study also confirmed that ODC1 was a risk factor in NB, specifically in relation to risk classification, age, INSS staging, and prognosis. PRPH is a newly discovered biomarker that encodes peripherin, a cytoskeletal protein present in the peripheral nervous system. 37 Anneleen Decock et al. 38 demonstrated that PRPH expression levels decrease gradually as tumor invasiveness in NB increases. Our study provided more evidence that PRPH acts as a protective factor in NB, where higher levels of expression are typically associated with a better prognosis. On the other hand, Robin Wachowiak et al. 39 discovered that lower ALCAM gene expression can cause infant NB cells to separate more easily, leading to more tumor aggressiveness, shortened overall survival, and lower recurrence-free survival. Furthermore, ALCAM can be detected in serum after tumor metalloproteinases shed from the cell surface, so it can be used as a diagnostic and prognostic marker for infant NB based on its expression levels. Our research also supports the protective function of ALCAM in NB.
RPL22L1, an RNA-binding protein (RBP), is overexpressed in metastatic and invasive ovarian tumor tissues. 40 RPL22L1 has various functions, however its involvement in NB requires further study. 41 The WNT signaling pathway regulates several biological processes, including cell proliferation, polarity, migration, and stemness, and is crucial in the formation of different types of malignancies.42,43 The WNT signaling pathway plays a critical role in the onset and progression of NB, with a specific emphasis on the β-catenin-dependent WNT pathway. 44 However, the specific function of WNT4, a member of the WNT family, in NB remains somewhat unclear. In our study, we found the expression of RPL22L1 and WNT4 genes were closely associated with multiple high-risk factors for NB prognosis (age, INSS stage, high/low-risk degree). The survival curves and prognostic heat map demonstrated that these two genes have a significant impact on the prognosis of NB patients. Subsequent pan-cancer analysis also revealed that TARG RPL22L1 and WNT4 were associated with the prognosis of various malignant tumors, including NB. Furthermore, functional experiments confirmed the distinct expression of these two genes in tissue samples. Specifically, the downregulation of RPL22L1 can inhibit the proliferation, migration, and invasion of NB cells. In contrast, the overexpression of RPL22L1 significantly enhanced these cellular processes, thereby substantiating RPL22L1 as a potential risk factor for NB.
The accurate diagnosis and prognosis assessment of NB before surgery remains challenging. In the past, clinical doctors relied on imaging examinations, neuron-specific enolase, VMA, and other methods for accurate diagnosis. We constructed a predictive model based on differential NB-related telomerase genes to forecast the prognosis of NB. Tumors with active telomerase or telomere-selective elongation tend to grow invasively, leading to poor prognostic outcomes that often require intensified treatment. In contrast, tumors lacking telomere maintenance require basic treatment or monitoring. 45
Bronte Manouk Verhoeven et al. 46 stated that memory B cells increase significantly in intermediate and high-risk NB compared to low-risk NB. T cell infiltration in drug-resistant NB can improve clinical outcomes. 47 Additionally, Dendritic Cells (DC) and Natural Killer (NK) cells have been confirmed to be positively correlated with T cell infiltration in human NB at both transcriptional and protein levels. 48 The immune infiltration analysis in this study revealed that the core gene RPL22L1 presented an immune landscape dominated by memory B cell infiltration while being negatively correlated with DC cells, NK cells, and monocyte infiltration. Conversely, WNT4 exhibited an opposing immune infiltration pattern. Furthermore, the differences in immune infiltration between the high-risk group and low-risk group were in line with those between RPL22L1 and WNT4. Based on our results, the risk gene RPL22L1 may assist NB cells in evading surveillance by NK cells and DC cells, leading to an immune microenvironment dominated by memory B cells and minimal T cell infiltration, which favors the malignant growth of tumor cells. And the subsequent immune checkpoint analysis also found that RPL22L1 had the greatest positive correlation with PVR. PVR, as a specific ligand, can transmit stimulatory and inhibitory signals to NK cells through regulatory receptors, DNAM-1 co-stimulatory receptors, and TIGIT and CD96 co-inhibitory receptors under various conditions,49,50 thus affecting the infiltration of NK cells in the tumor tissue, altering the tumor microenvironment and thus affecting tumor development. 51 It is reasonable to believe that RPL22L1 regulates the immune checkpoint PVR, which in turn affects the infiltration of immune cells in the NB, inhibits the function of NK cells, promotes the immune escape of tumor cells, increases the malignancy of tumors, and ultimately affects the survival prognosis of patients. On the other hand, WNT4, a protective factor, promotes immune infiltration of NK cells and DC cells, hence suppressing cancer cell growth and improving prognosis. Monocytes, highly flexible innate immune cells, have a significant regulatory impact on the development of many cancers by influencing tumor growth or metastasis. 52 In NB cells, pro-inflammatory monocytes inhibit NB growth and spread, which is linked to gene-induced chemotactic activity and monocyte repolarization. 53 The contrasting effects of RPL22L1 and WNT4 on monocyte infiltration may relate to the maintenance of monocyte phenotype due to gene induction. In conclusion, the immune infiltration patterns presented by the core genes RPL22L1 and WNT4 among 28 types of immune cells are consistent with their impact on the prognosis of NB.
Targeting telomerase activity has emerged as a new approach for treating high-risk NB due to the crucial role of telomerase. 54 However, clinical trials of telomerase activity inhibitor Imetelstat (GRN163L) in children were stopped due to its high toxicity. 55 Fortunately, the new medication, nucleoside analog6-thio-dG, has demonstrated potential in clinical applications for NB by inhibiting telomere function in telomerase-expressing cells. However, further study is needed before this medicine can be publicly available. 56 Considering the complexity of diseases, individual differences, and the large number of drug compounds, drug discovery through experimentation is nearly impossible, and the application of machine learning can significantly reduce development costs and time. 57 In drug sensitivity analysis, the telomerase inhibitor AZD5153, which targets the BET bromodomain protein BRD4, has been shown to inhibit TERT and related genes in NB when combined with CDK inhibitors. 58 This suggests a promising direction for developing telomerase inhibitors for NB. Most drugs were more effective in patients with low RPL22L1 expression, while only nine drugs showed greater efficacy in those with high expression. Drugs effective in high RPL22L1 expression could offer new therapeutic options for NB patients with poor outcomes. RPL22L1, a ribosomal protein linked to drug resistance, promotes glioblastoma resistance to temozolomide via the STAT3 pathway and activates the ERK pathway in liver cancer, leading to resistance to sorafenib, which can be mitigated with ERK inhibitors.59,60 Studies have also shown that RPL22L1 is associated with poor prognosis and 5-FU resistance in colorectal cancer. 61 Thus, the resistance mechanisms related to RPL22L1 are complex, suggesting that combination therapies might help overcome these challenges.
Regarding WNT4, known inhibitors of the Wnt/β-catenin signaling pathway, such as XAV939 and LGK974, could impact WNT4 and may be candidates for repurposing.62,63 However, dysregulation of this pathway can lead to overexpression of drug efflux pumps like ABCB1 and CD44, contributing to the extrusion of chemotherapeutic agents from cells. 64 Therefore, when targeting WNT4, it's important to consider potential resistance mechanisms due to pathway imbalances in tumor treatment. In a word, RPL22L1 could be a potential foundation for creating specific medicines that target telomerase activity, offering a new way to address the challenge of targeting telomerase activity in the treatment of high-risk NB.
The protein-protein interaction network of telomerase-related genes in NB clearly illustrates the nodes and connections between key genes, aiding in the understanding of potential interactions among telomerase-related prognostic genes in NB. Of course, protein interaction networks can be quite complex at times, and the specific mechanisms of action still require further experimental validation. Additionally, the construction of the miRNA-mRNA-TF network provides a basis for a deeper understanding of the regulatory mechanisms of gene expression and allows for the speculation of potential downstream targets and signaling pathways for the target genes. For example, hsa-mir-16-5p serves as an important regulator for the RPL22L1 and WNT4 genes and has been shown to target multiple genes to influence the progression of neuroblastoma (NB). It may be a key downstream gene, but this requires further experimental studies for confirmation.
In conclusion, RPL22L1, a novel molecular marker linked to telomerase activation, was discovered and can forecast the prognosis of NB. Personalized medicine has advanced in cancer research, driven by molecular mechanism studies. This deeper understanding of molecular changes necessitates more accurate and relevant cancer diagnostic and prognostic markers. 65 RPL22L1 has the potential to aid in the early diagnosis of high-risk NB and to find new targets for high-risk NB. A multifactorial regression model based on RPL22L1 and WNT4 effectively predicted the prognosis of NB. Nevertheless, there are limitations in this study. This article focused only on exploring the influence of key genes on the prognosis of NB, establishing new connections between telomerase activation and NB. The specific mechanisms underlying these findings are yet unknown, the lack of in vivo experimental validation also reduces the translational potential of this study, and further experimental research is required in the future.
Footnotes
Acknowledgments
The authors declare no competing interests. This study was supported by the Guangdong Basic and Applied Basic Research Foundation of China (2019A1515011086), and the Guangdong Medical Association Clinical Research Fund (A202302026).
ORCID iDs
Consent to participate
The studies involving human participants were reviewed and approved by the Ethics Committee of Zhujiang Hospital of Southern Medical University. Written informed consent was obtained from patients’ parents.
Author contributions
Conception: Chen R and Fan K.
Interpretation or analysis of data: Chen R and Fan K.
Preparation of the manuscript: Li J, Zhao Q, Ding X, and Li Y.
Revision for important intellectual content: Wang J, Yu D, and Yang L.
Supervision: Wu K
Funding
The authors received no financial support for the research, authorship, and/or publication of this article.
Declaration of conflicting interests
The authors declared no potential conflicts of interest with respect to the research, authorship, and/or publication of this article.
Data availability statement
This study made use of publicly available datasets that can be accessed through the following sources: TARG can be downloaded from Gene card (https://www.genecards.org). RNA-seq and clinical data are available from the GEO database (https://www.ncbi.nlm.nih.gov/geo/). The Pan-Cancer dataset can be downloaded from the UCSC (![]() ) database. The code used in our study is available upon reasonable request from the corresponding author.
) database. The code used in our study is available upon reasonable request from the corresponding author.