
Abstract
Objective
Lung adenocarcinoma (LUAD) is a common and highly heterogeneous malignancy cancer with increasing morbidity and mortality. Dysregulation of fatty acid metabolism (FAM) has been identified as a key regulator of LUAD progression. Our purpose was to establish a risk model of FAM-related genes to provide a reference for the prognosis prediction of LUAD.
Methods
Firstly, we screened FAM-related differentially expressed genes (DEGs) based on the Cancer Genome Atlas (TCGA) database, and identified the prognostic signatures by Cox-regression analysis. The least absolute shrinkage and selection operator algorithm (LASSO) was used to obtain the formula for risk model. And the analysis of Gene Expression Omnibus (GEO) dataset used to verify. Nomogram was produced for individualized prediction in clinical treatment. Immune cell function and drug sensitivity analysis used to screen potential therapeutic drugs.
Results
Patients in low-risk had better overall survival (OS). High-risk patients exhibit higher TMB and lower TIDE scores, and they are more likely to benefit from immunotherapy. The analysis of GEO verified that risk model has a high prediction accuracy.
Conclusion
The risk model based on 17 FAM-related DEGs is of great value in predicting the prognosis of LUAD, and these prognostic signatures may be potential therapeutic targets for LUAD.
Introduction
Lung cancer is one of the most common malignant tumors globally. GLOBALCAN 2022 estimated 2,480,301 new cases (12.4%) and 1,817,172 deaths (18.7%) of lung cancer, ranking the first among 36 cancers worldwide. 1 Due to the increase in female smoking and changes in the composition of cigarettes, the incidence of LUAD is on the rise, 2 and it has become the most common histological subtype in primary lung cancer, accounting for 30∼40% of all case. 3 LUAD is often asymptomatic in its early stages, so most patients are diagnosed at an advanced stage and lose the opportunity of surgery. 4 Even with traditional chemotherapy, radiotherapy and targeted therapy, they prognosis is still poor, and the 5-year survival rate is about 5%. 5 Even among patients who underwent surgical resection, 5-year survival varied widely between stages, ranging from 73% in stage IA to 9% in stage IIIB.6,7 In recent years, with the increasing knowledge of genomics, epigenetics, and immune signatures, as well as the improvement of medical detection level and the rich resources of public databases, the exploration of tumor markers and biomarkers is developing rapidly, and the treatment for lung cancer have been further optimized. A series of studies have confirmed that biomarkers play an important role in the early diagnosis, monitoring treatment outcomes and follow-up for possible recurrence of lung cancer. For example, tumor and immune antigens, autoantibodies, DNA methylation, mRNA, microRNA, free tumor DNA and tumor cells obtained from sputum, blood, urine and bronchial epithelium. 8 Many bioinformatics analyses based on public databases have been reported. Therefore, it is of great significance to construct diagnostic and predictive biomarker models to identify the best prognostic markers and help in the selection of targeted and immunotherapy drugs.
TCGA is a large open-source medical database developed in the United States, which contains more than 80,000 cases derived from more than 33 types of cancers and provides genome sequence, expression, methylation and copy variation data. TCGA aims to help us improve our understanding of the molecular basis of cancer, and our ability to prevent, diagnose and treat cancer by applying large-scale genome analysis techniques. 9 GEO database is an international public repository, which provides high-throughput gene expression and other functional genome data sets, accounting for about 90% of the database. 10 High quality studies on prognostic genes of LUAD based on TCGA and GEO databases have been widely reported. Wu et al. developed a risk model with tumor microenvironment (TME)-related genes SERPINE1, CX3CR1, CD200R1, GBP1, IRF1, STAP1, LOX and OR7E47P as prognostic signatures, and they concluded that a lower TME-risk score predicted a better overall survival (OS) and immunotherapy response. 11 Zhao et al. identified a novel 19-gene prognostic signature based on gene expression in LUAD patients, and reported that patients with a low-risk score had significantly better overall survival (OS) than those with a high-risk score. 12 Lu et al. screened 12 ferroptosis-related genes to construct a prognostic model, providing guidance for the selection of therapeutic targets related to ferroptosis in clinic. 13 A common feature of these studies is the construction of risk models through LASSO regression analysis. LASSO is one of the most popular feature selection and risk prediction algorithms for high-dimensional gene expression data, 14 which takes into account L1 penalties. Compared with traditional regression analysis, LASSO combines covariates in a nonlinear and interactive way, improves the prediction accuracy and generalization of statistical models, and prevents overfitting of data sets with multiple covariates. 15
In this study, DEGs were screened from normal samples and TCGA-LUAD patients. And a total of 17 FAM-related DEGs were identified by univariate Cox regression analysis, which were significantly correlated with the OS. Based on these 17 abnormally regulated FAM-related DEGs, a prognostic risk model was constructed by LASSO regression analysis and its prognostic value was evaluated. The GEO data set further verified the prediction accuracy of our model. This study has important reference significance for the diagnosis and treatment of LUAD in the future.
Materials and methods
LUAD data collection and preprocessing
Based on the search strategy in Table S1, 555 transcriptome files (included 501 LUAD samples and 54 normal samples), 579 gene mutation files and 486 clinical files of LUAD were downloaded from TCGA database (https://portal.gdc.cancer.gov/). The keywords “LUAD”, “survival” and “Homo sapiens” were searched in GEO database (https://www.ncbi.nlm.nih.gov/geo/), and each study was carefully read to find the optimal data set for analysis. Studies with missing survival time or OS will be excluded, then 117 samples (GSE13213) containing complete clinical data and public microarray data were downloaded. All data were corrected and converted, and unqualified data were removed. Finally, 471 samples of TCGA (Table S2) were used as training set and 117 samples of GEO data (Table S3) as testing set for subsequent analysis and verification.
Screening of DEGs
FAM-related genes were downloaded from Gene Set Enrichment Analysis database (GSEA, http://www.gsea-msigdb.org/gsea/index.jsp). Screening of FAM-related DEGs in normal and tumor samples was performed using the R package “limma”. The filter conditions of DEGs follow | logFC | < 0.585 and false discovery rate (FDR) < 0.05. Genes that met the filter conditions were considered to be significantly different, and the results of DEGs were preserved (Table S4). Then, based on the results of DEGs, we screen in training set and testing set to extracted the expression levels of DEGs in two data sets respectively.
Identification of prognostic signature and construction of prognostic model
“R package “survival” and “survminer” were used to conduct univariate Cox analysis on TCGA training set data (significance filter criterion was p < 0.05). Then, the FAM genes closely related to prognosis were screened out, and a forest plot was drawn to visualize the results. Based on the above data of FAM-related prognostic genes, we used the R package “glmnet” and “survminer” to perform LASSO regression analysis, and determined the genes involved in the construction of the prognostic model and the corresponding model formula through cross-validation. Next, the risk score of each sample in TCGA training set was calculated according to model formula, and the samples were divided into high and low risk groups, namely, the prognostic risk model we constructed was obtained. Similarly, the samples of GEO testing set were also divided into two groups according to the risk score calculated by model formula, which was used to verify the accuracy of the prognostic risk model we constructed.
Principal component analysis (PCA) and survival analysis
PCA was performed using R packages “ggplot2” and “limma” to verify whether the prognostic genes involved in TCGA model construction could significantly distinguish samples from high- and low-risk groups. Kaplan-Meier (K-M) analysis was used to assess the difference in OS between the high- and low-risk groups in the TCGA prognostic model.
Construction of clinical prognostic nomogram
Univariate and multivariate Cox regression analyses were used to verify whether other clinical characteristics were independent prognostic factors for LUAD, such as age, sex and TNM stage. Based on the results of independent prognostic factors, we used “regplot” and “rms” packages to draw nomograms and calibration curves. Each prognostic factor corresponds to a score, and the scores of all prognostic factors were added to obtain a total score, which was used to predict the 1-, 3-, and 5-year survival of LUAD, and calibration curve was used to verify the accuracy of the nomogram.
Differential analysis of immunotyping and immune cell function
The R packages “ggpubr” and “limma” were used to verify the differences between the high and low risk groups in different immune types in the TCGA prognostic model. The CIBERSORT algorithm 16 was used to quantify tumor-infiltrating immune cells from cancer RNA-sequencing data in order to determine the relative proportion of 22 types of immune infiltrating cells in the TCGA prognostic model. Then, we compared the differences in immune cell infiltration between the high- and low-risk groups. In addition, after installing R packages “GSVA”, “Base” and “reshape2”, we also analyzed the differences in immune cell-related functions and pathways between the two groups.
Gene mutation analysis
Gene mutation analysis was performed on the prognostic model to determine the frequency of individual gene mutations between high- and low-risk groups. Subsequently, difference analysis was conducted on the target genes of the mutations respectively to compare whether they were significantly different between the two groups.
Drug sensitivity analysis and immunotherapy analysis
Drug sensitivity analysis was performed on the prognostic model using R-package “pRRophetic” 17 to screen out potential sensitive drugs for LUAD. Immunotherapy score and immune escape score for LUAD patients were downloaded from the Cancer Immunome Atlas (TCIA, https://tcia.at/). Based on the scores from TCIA, we performed a differential analysis of patients in high- and low-risk groups in the prognostic model to predict the potential response to immunotherapy.
Functional and pathway enrichment analysis
R package “limma” and logFC function were used to analyze the differences in the expression levels of each gene in the prognosis model between high- and low-risk groups. Gene Ontology (GO) and Kyoto Encyclopedia of Genes and Genomes (KEGG) enrichment analysis were performed based on the data obtained from difference analysis. FDR <0.05 was used to determine the statistical significance of GO terms. And the analysis results were visualized using the R packages “clusterProfiler”, “org.Hs.eg.db”, “enrichplot”, “ggplot2” and “GOplot”.
Protein-protein interaction (PPI) network analysis
The construction of PPI network visualized the proteins encoded by FAM-related DEGs, which helped us analyze the mutual functions of the proteins. FAM-related genes were uploaded to the STRING website (https://cn.string-db.org/). After being converted into protein data, a complete search was conducted to identify all experimentally validated FAM-related proteins with direct interactions. Subsequently, the PPI network was visualized using Cytoscape (v 3.9.1) software, FAM-related hub proteins were identified by “CytoHubba” plug-in, and finally we performed survival analysis and immune cell infiltration analysis on hub proteins.
Results
Identification of FAM-related DEGs
A total of 59427 RNA transcriptome data were downloaded from TCGA database, and the expression data of 308 FAM-related genes were screened by R software. Then, 121 FAM-related genes with significant differences (|logFC|< 0.585, FDR < 0.05) between normal samples and LUAD were identified. Heatmap and volcano plot (Figure 1(a) and (b)) of the DEGs were drawn using r-pack “pheatmap” to distinguish genes that were up-regulated or down-regulated between the two groups. Finally, we used the R package “sva” to batch-correct the TCGA and GEO datasets to extract the expression levels of DEGs in the two datasets, respectively.
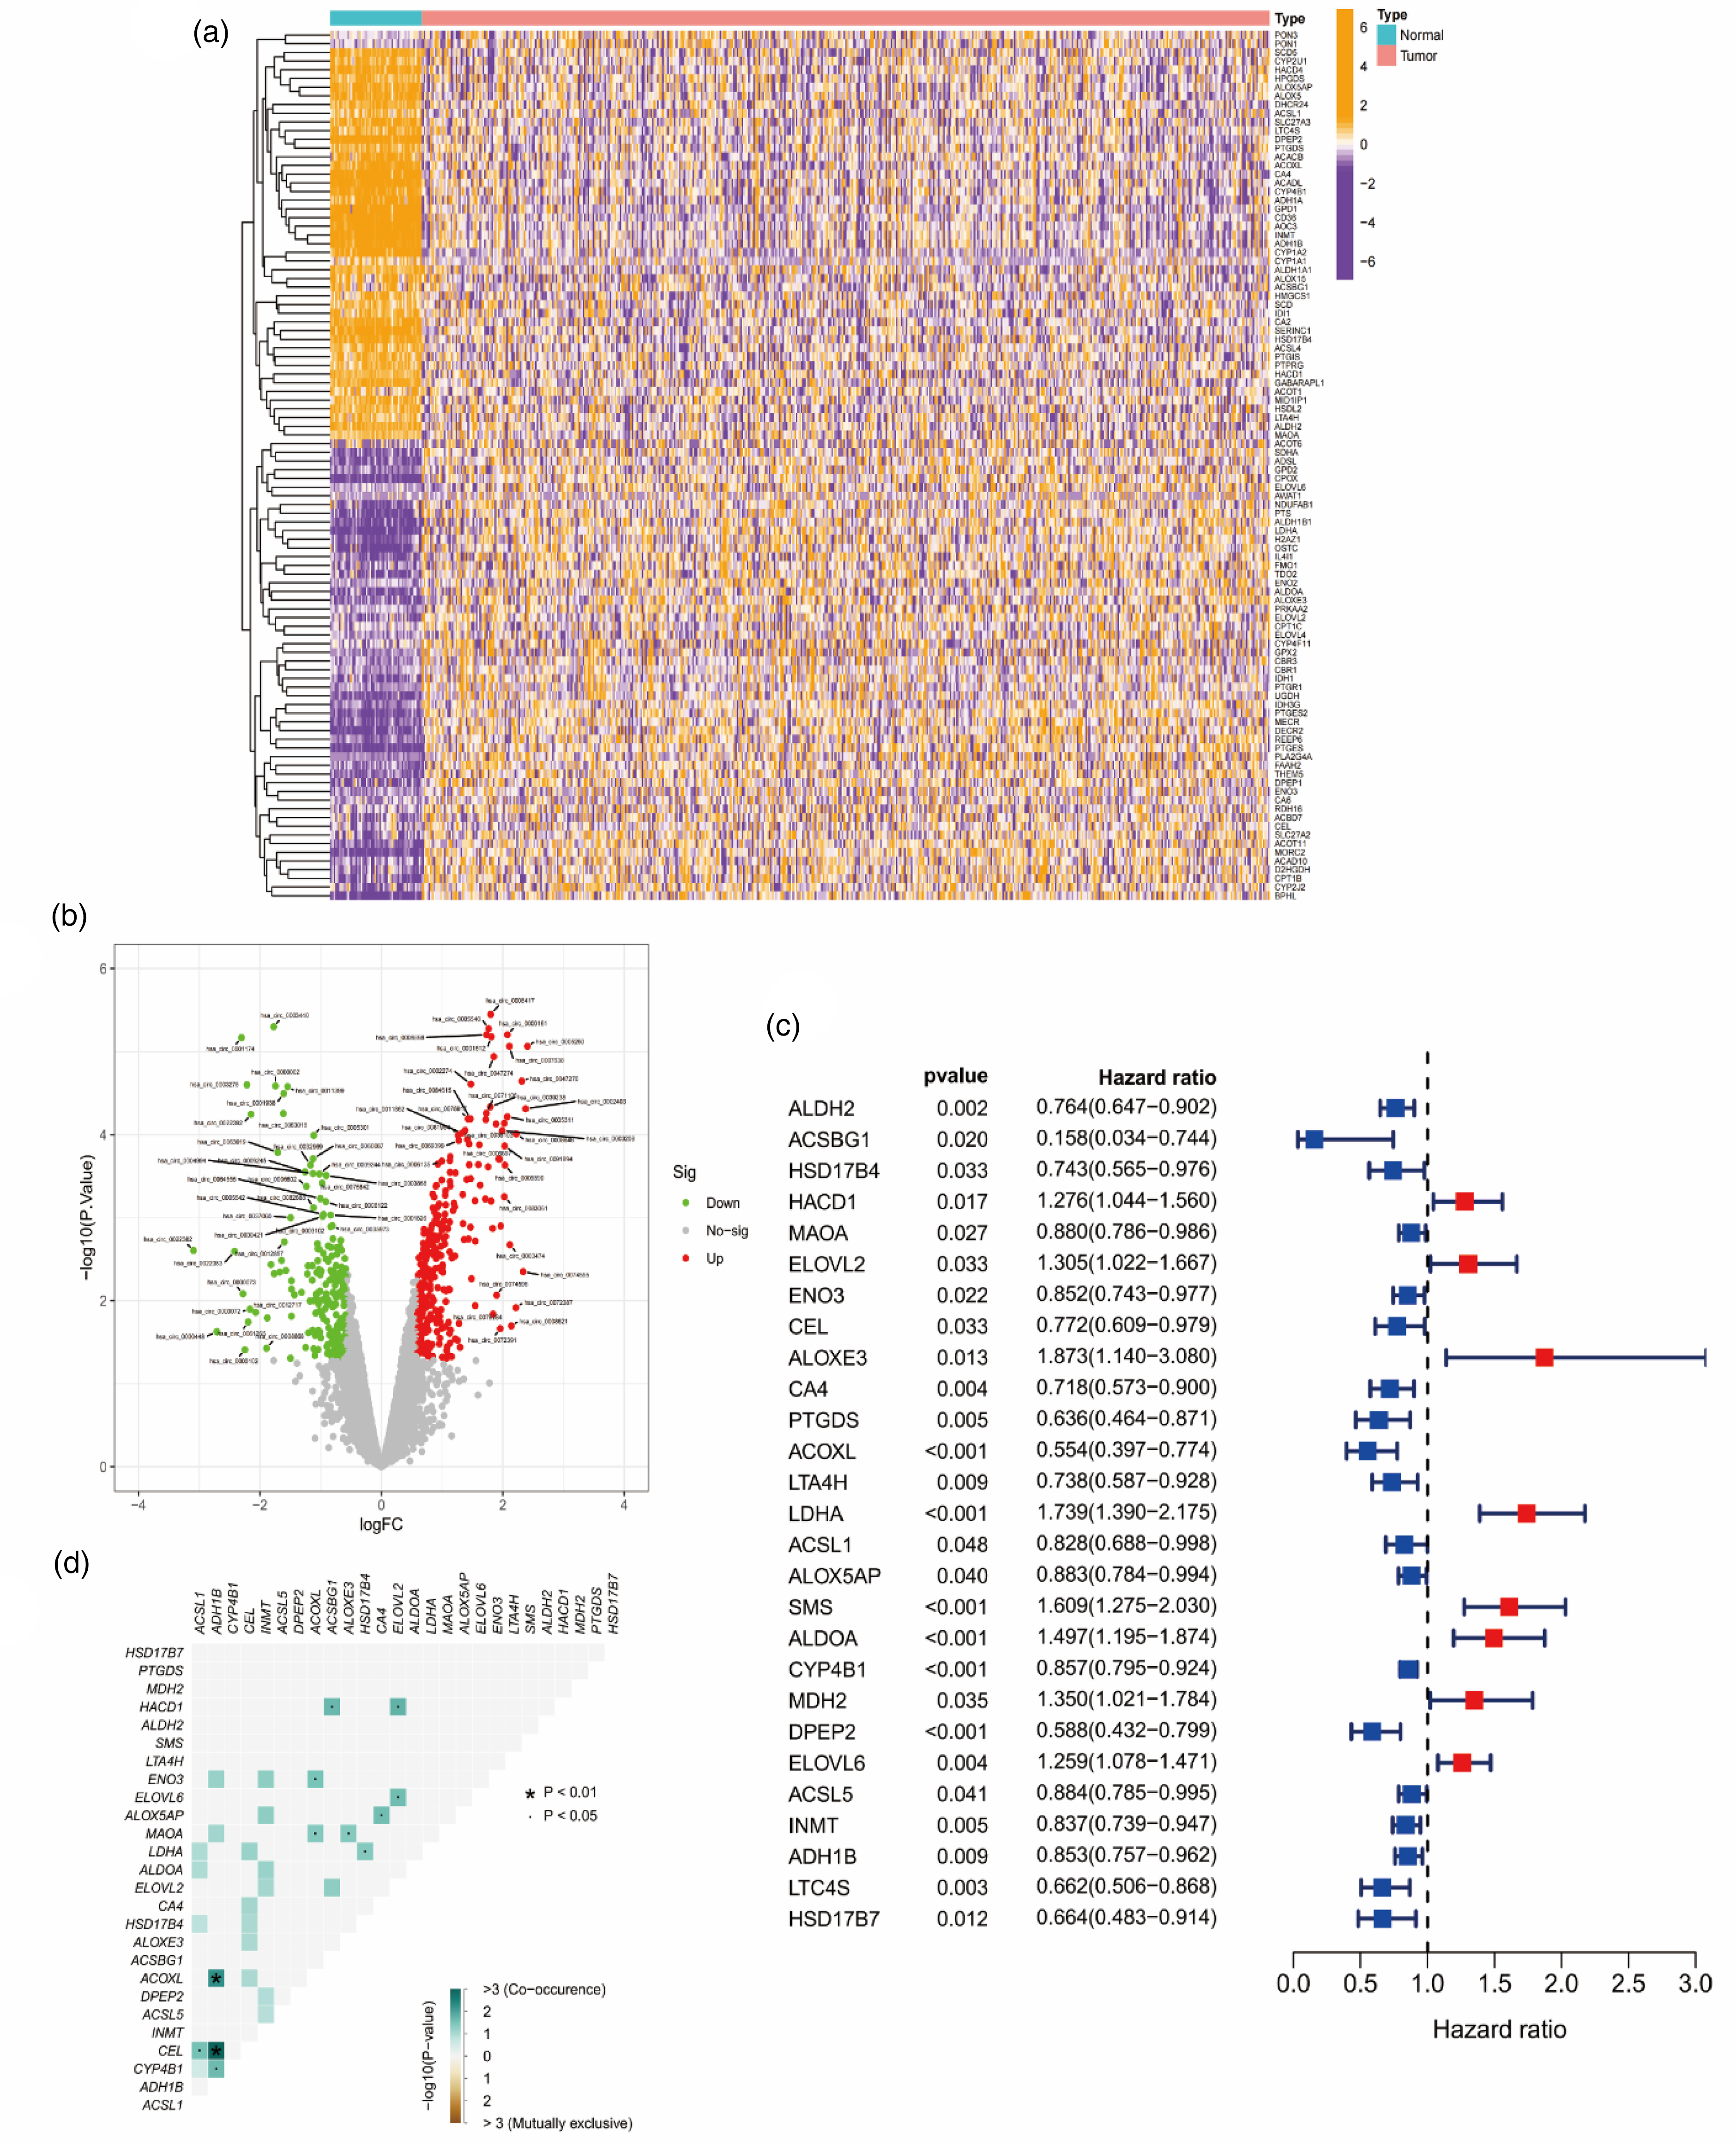
Screening for FAM-related DEGs and identification of prognostic genes. (a) Expression of 121 FAM-related DEGs in LUAD and normal samples. (b) Volcano plot for FAM-related DEGs. (c) Cox regression analysis identified 27 FAM-related DEGs that were significantly associated with prognosis. (d) Results of co-expression analysis among 27 prognostic DEGs.
Construction and validation of prognostic risk model for FAM-related genes
After obtaining 471 LUAD samples with OS data from the TCGA training set, we performed univariate Cox regression analysis on FAM-related DEGs (p < 0.05) and a total of 27 DEGs significantly associated with OS were obtained, including 8 high-risk genes and 19 protective genes (Figure 1(c)). In addition, co-mutation analysis validated the association of mutations between these 27 DEGs. The results showed that ACOXl-ADH1B, CEL-ADH1B, CEL-ACSL1, CYP4B1-ADH1B, ACOXL-ENO3, ACOXl-MAOA, AlOXE3-MAOA, ACSBG1-HACD1, ELOVL2-HACD1, HSD17B4-LDH A, AlOX5AP-CA4 and ElOVL6-ELOVL2 were co-mutated (p < 0.05; Figure 1(d)).
17 optimal FAM-related DEGs were identified by LASSO-Cox regression analysis and cross-validation (Figure 2(a) and (b)), and the formula for model construction was obtained: [ALDH2 × (−0.006945)] + [ACSBG1 × (−0.508767)] + [HACD1 × 0.152175] + [ELOVL2 × 0.173203] + [ENO3 × (−0.139237) + [CEL × (−0.050372)] + [CA4 × (−0.071542)] + [ACOXL × (−0.041194)] + [LDHA × 0.185869] + [ACSL1 × (−0.007710)] + [ALOX5AP × (−0.115005)] + [SMS × 0.077238] + [ALDOA × 0.115027] + [CYP4B1 × (−0.041525)] + [DPEP2 × (−0.117420)] + [ELOVL6 × 0.052369] + [HSD17B7 × (−0.164589)]. The risk score of each TCGA-LUAD was calculated according to the model formula, and then the samples were divided into high- (235 samples) and low-risk (236 samples) groups according to the median value of the risk score. K-M analysis showed that LUAD patients in the low-risk group had better OS outcomes (Figure 2(c), p < 0.05). In order to verify the accuracy of prognostic risk model in predicting OS, we also divided the samples of GEO testing set into two groups according to the model formula and conducted K-M analysis, the final results were consistent with TCGA training set (Figure 2(d), p < 0.05).
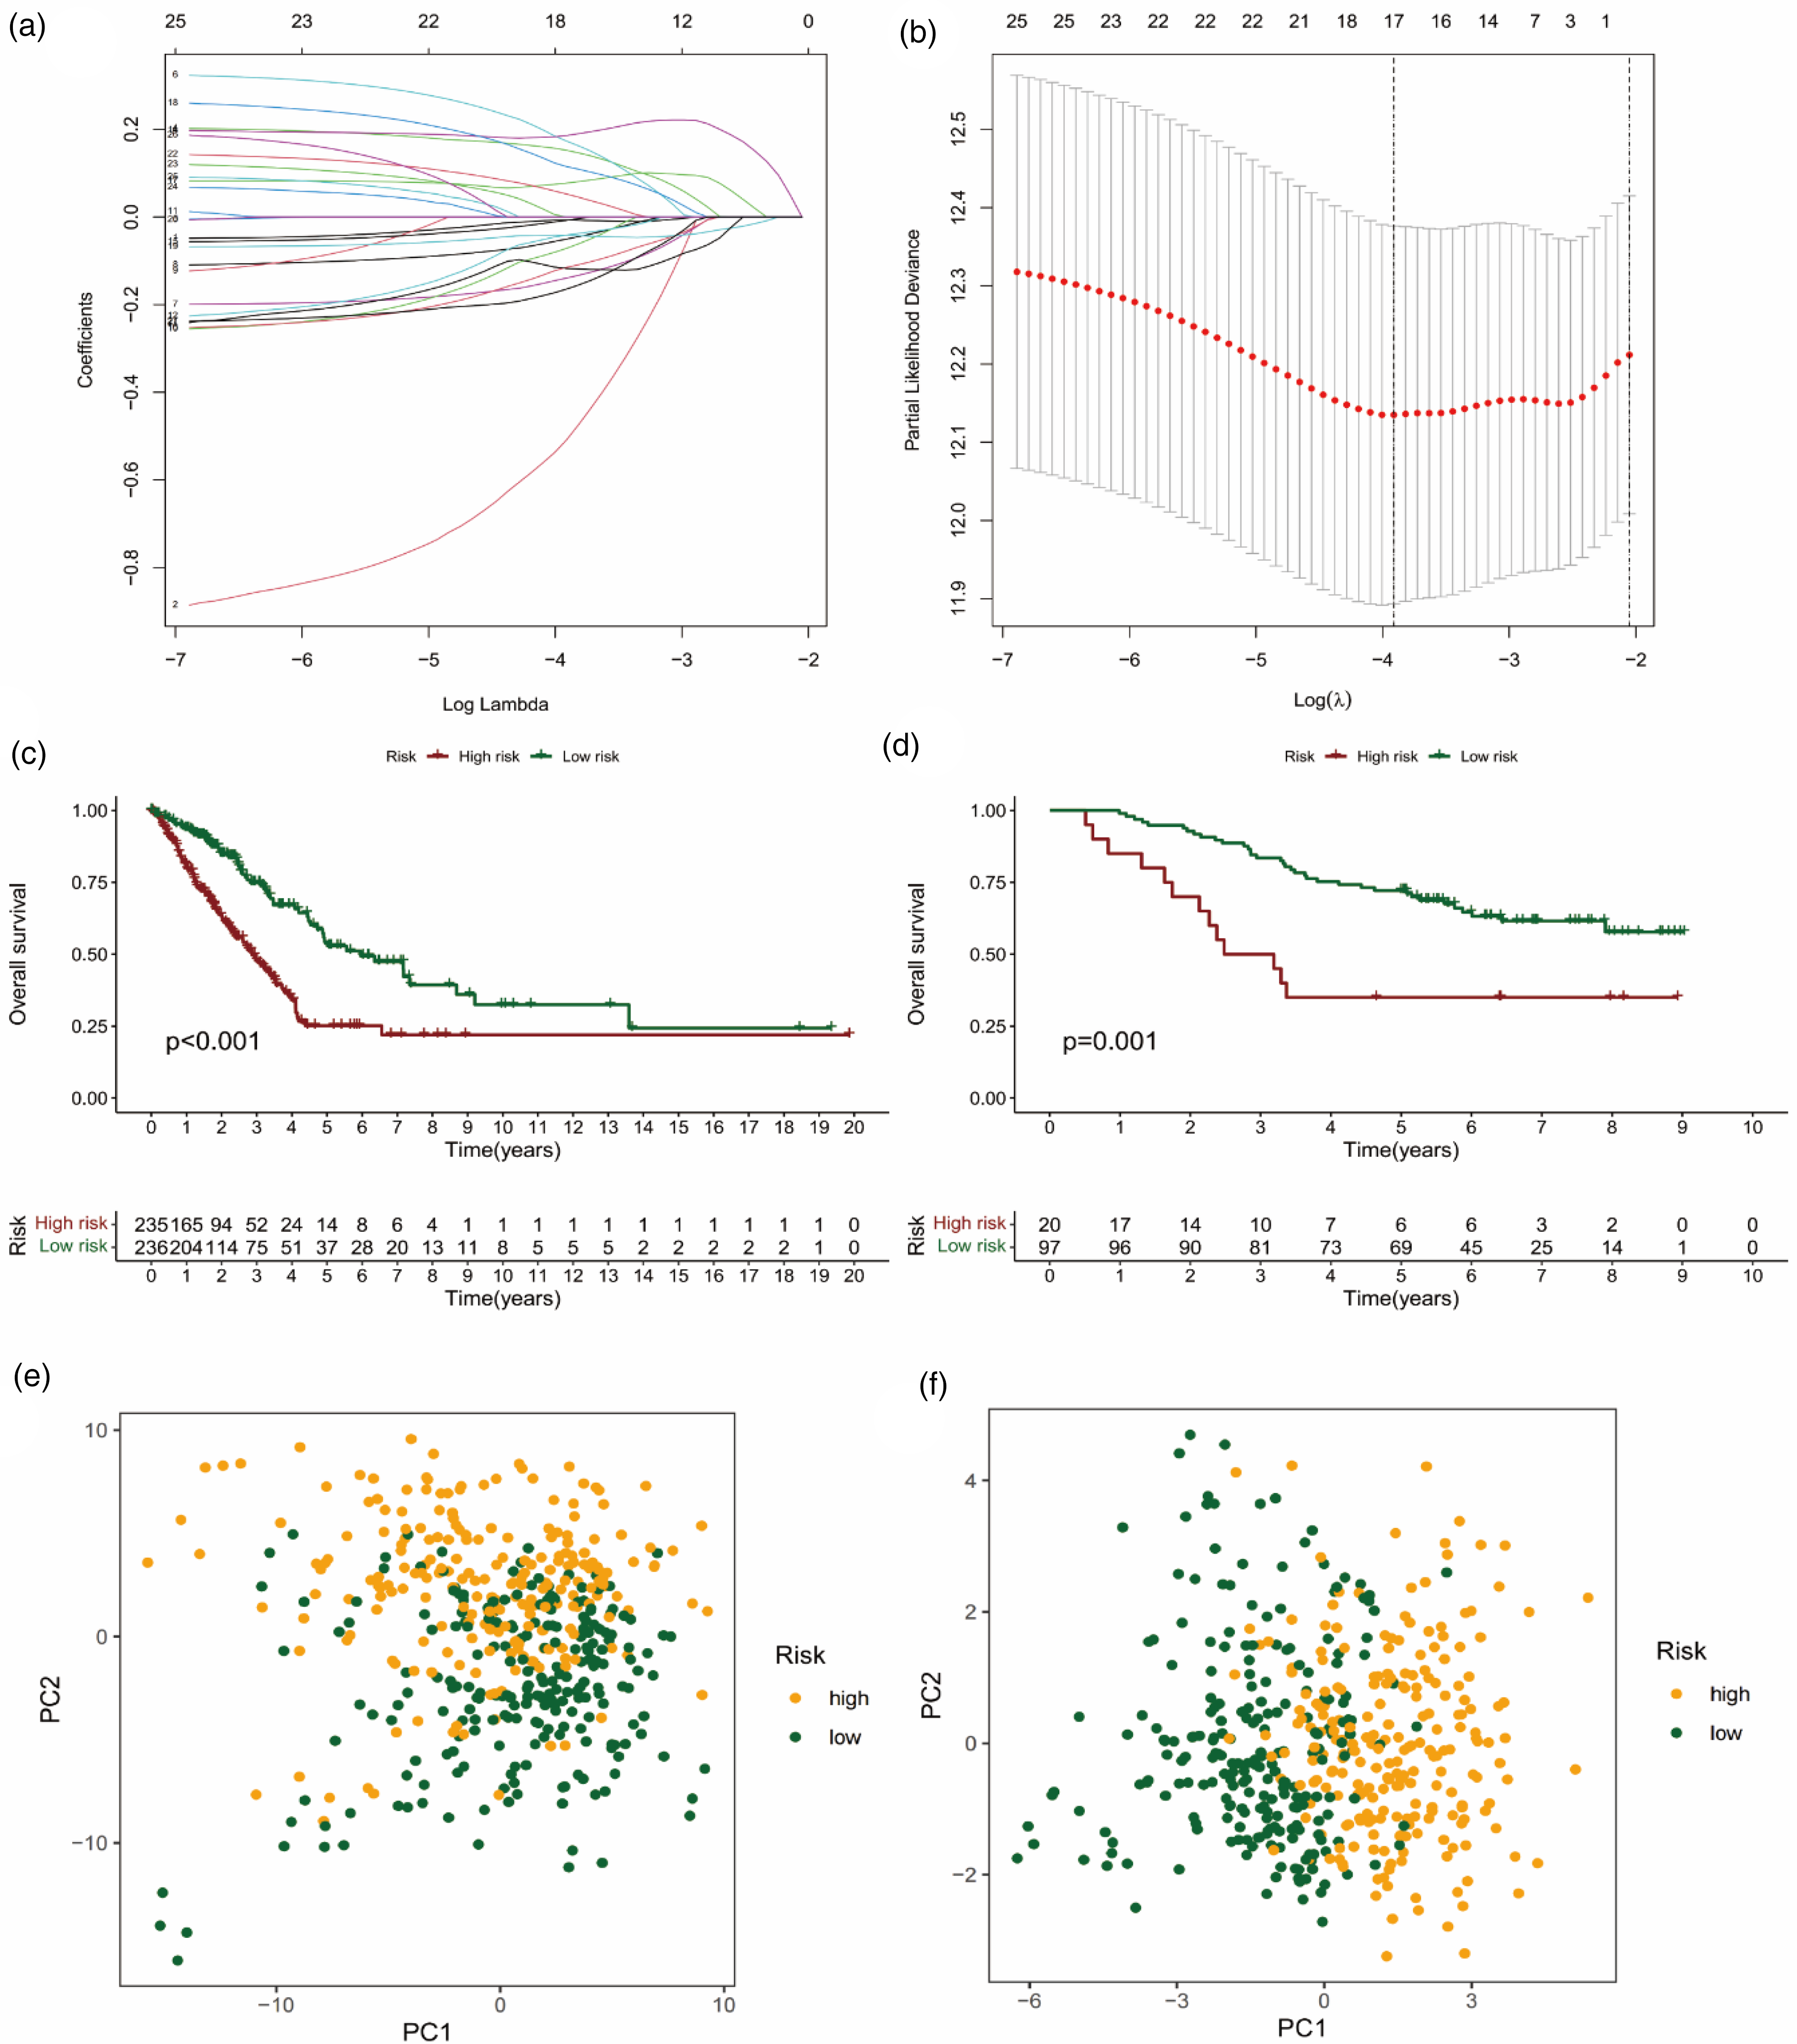
Construction and validation of prognostic risk models. (a–b) LASSO regression and cross validation showed that the number of genes corresponding to the point with the smallest error was 17. According to this result, the formula needed to construct the prognostic risk model was output. (c) The LUAD patients with low-risk in TCGA risk model predicted better OS. (d) And the validation result of GEO testing set was consistent with the TCGA risk model. The results of PCA showed that compared with the high and low-risk groups of FAM-related genes (e), the overall red dots and green dots in the prognostic risk model were more clearly clustered (f), indicating a more distinct differentiation between high-risk and low-risk genes.
Finally, the results of PCA showed that compared with the overall FAM-related genes (Figure 2(e)), the prognostic risk model we constructed had a better ability to distinguish high- and low-risk patients (Figure 2(f)).
Prediction nomogram construction and clinical application
Univariate and multivariate Cox regression analyses were performed on baseline characteristics and pathological parameters of LUAD patients (Figure 3(a) and (b)), and the p-values of TNM stage and risk score were found to be statistically significant, suggesting that our risk model and TNM stage were independent factors for predicting patients’ prognosis. To facilitate the application of prognostic risk models in clinical treatment, we also developed nomograms for each patient to predict OS at 1, 3 and 5 years. In the presented nomogram, the 1-, 3-, and 5-year OS for this patient were 87.9%, 59.3%, and 33.1%, respectively (Figure 3(c)). Meanwhile, the results of the nomogram indicated that risk score and TNM stage were independent prognostic factors for patients, which was consistent with the results of multivariate regression analysis. Then, the calibration curve verifies that Nomogram has good prediction accuracy (Figure 3(d)).
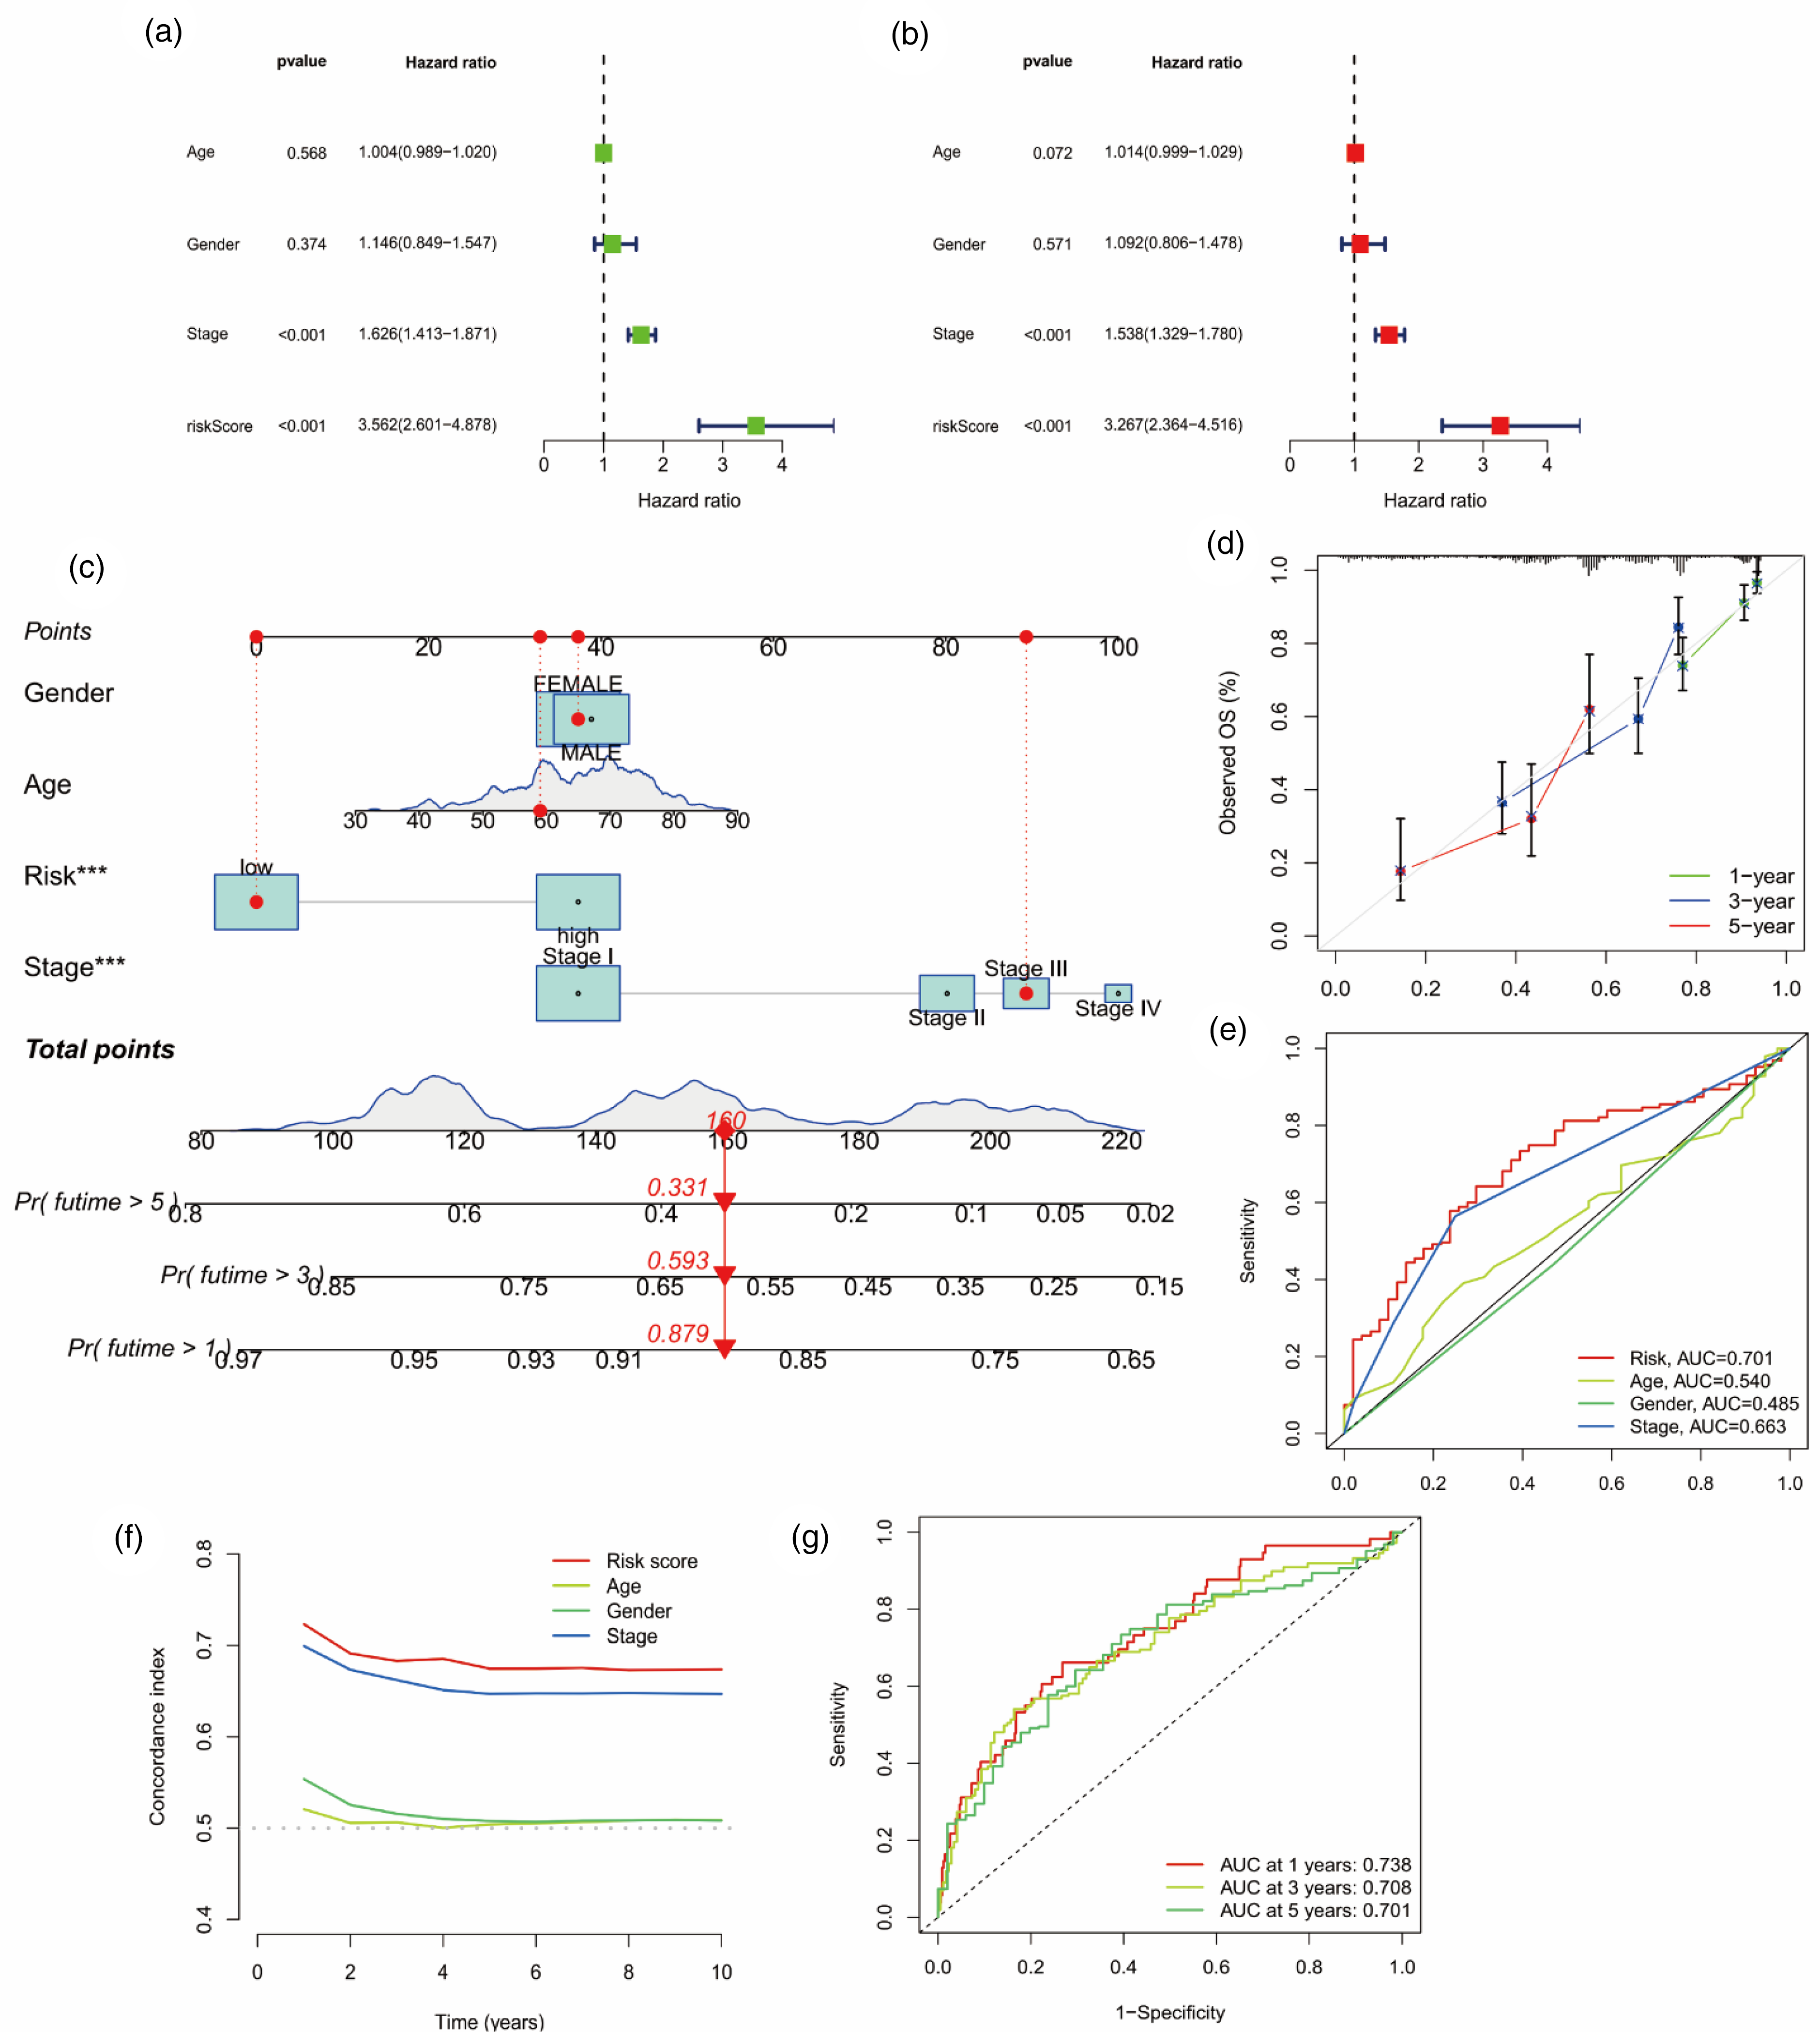
Analysis of prognostic factors and construction of nomogram. (a) Univariate analysis identified prognostic factors and (b) multivariate analysis identified prognostic factors as independent predictors. (c) Nomogram used to predict the 1-, 3-, 5-year survival rate in clinical medicine. (d) Calibration curve to verify the accuracy of nomogram prediction. (e) ROC curves and (f) compliance index analysis for risk score and clinical features. (g) ROC curves for 1-, 3-, 5-year survival time of LUAD. (*p < 0.05, **p < 0.01,*** p < 0.001)
In addition, we analyzed the area under curve (AUC) of the receiver operating characteristic (ROC) and compliance index of the risk score, and concluded that the risk score had better specificity and sensitivity for predicting prognosis than other clinical characteristics (Figure 3(e) and (f)). And the AUC also proved that the accuracy of risk score in predicting prognosis was 1- > 3- > 5-years (AUC: 0.738 > 0.708 > 0.701; Figure 3(g)).
Tumor immune microenvironment and immunotherapeutic response
The immunotyping, immune cell function, immune pathway and function enrichment levels and activity of TCGA-LUAD were assessed using the prognostic risk model of FMA-related genes. There were significant differences between C1 and other subtypes (C2, C3, C4, C6) in LUAD, and the risk score of C1 was the highest, indicating that C1 was a poor prognostic factor. Although there was no statistical difference between C3 and C4, the risk score of C3 was the lowest compared with other subtypes (C1, C2, C6), suggesting that patients with C3 may have a better prognosis (Figure 4(a), P < 0.05). Analysis of 22 types of immune cells showed that a total of 10 types had significant differences in infiltration between the high- and low-risk groups. T cells CD8, T cells CD4 memory activated, NK cells resting, Macrophages M0, Macrophages M1, and Mast cells activated infiltration were upregulated in high-risk group, while T cells CD4 memory resting, Monocytes, Dendritic cells resting, and Mast cells resting infiltration were upregulated in low-risk group (Figure 4(b), P < 0.05). In addition, analysis of immune cell-related functions showed that “APC co inhibition” and “MHC class I” functions were more active in high-risk group, while “HLA” and “Type II FN Reponse” functions were more active in low-risk group (Figure 4(c), P < 0.05).

Immune subtypes and immune cell function analysis. (a) Difference analysis results between different immune subtypes and risk scores in LUAD. (b) Differential analysis of immune cell infiltration in prognostic model. (c) Differential analysis of immune cell-related functions in prognostic model (*p < 0.05, **p < 0.01,*** p < 0.001)
Gene mutation analysis was performed on 461 samples with complete mutation information in the prognostic risk model. The mutation probability was 92.21% (213 of 231 samples) in low-risk group and 93.48% (215 of 230 samples) in high-risk group (Figure 5(a)). We conducted a separate analysis of the 10 genes with the highest mutation frequency, and found that the risk score of TP53, TTN, MUC16, CSMD3, ZFHX4 and USH2A genes had a significant difference between the wild type and the mutant type (Figure 5(b), P < 0.05), and the mutant type had a higher risk score. This suggested that mutations in these genes may lead to poor prognosis for LUAD patients. Furthermore, K-M analysis showed that high tumor mutation burden (TMB) predicted better OS (Figure 5(c), P = 0.017). Finally, in a combined analysis of TMB and risk score, patients with high-TMB/low-risk score had the best prognosis, followed by low-TMB/low-risk score, high-TMB/high-risk score, and low-TMB/low-risk score (Figure 5(d), P < 0.001).

Analysis of TMB. (a) Mutations in the top 30 genes with the highest mutation frequency in the low- and high-risk group. (b) Among the top 10 genes with the highest mutation frequency, 6 genes showed significant differences with the risk score, namely TP53, TTN, MUC16, CSMD3, ZFHX4 and USH2A. (c) K-M analysis results of TMB, and (f) TMB combined with risk score.
Screening of potentially sensitive drugs and prediction of immune efficacy
We used boxplot and scatter plot to present the results of drug sensitivity analysis. The half maximal inhibitory concentration (IC50) value is used to represent the sensitivity of drugs. The smaller the IC50 value, the more sensitive the patient is to the drug. We listed drugs with moderate or strong (|R|>0.40) correlation, 18 included 12 drugs in total, which were BI-2536, Bleomycin (50 μM), Cisplatin, NU-7441, Epothilone B, PHA-793887, Ispinesib Mesylate, Pyrimethamine, Methotrexate, Talazoparib, Midostaurin and Thapsigargin. We can see that the IC50 of these drugs are inversely related to the risk score. Patients in the high-risk group have lower IC50, indicating that patients in the high-risk group are more sensitive to drugs and can benefit more from treatment than those in the low-risk group (Figure 6). The specific mechanism of action and targeted pathway of these drugs can be searched in Genomics of Drug Sensitivity in Cancer (https://www.cancerrxgene.org/).
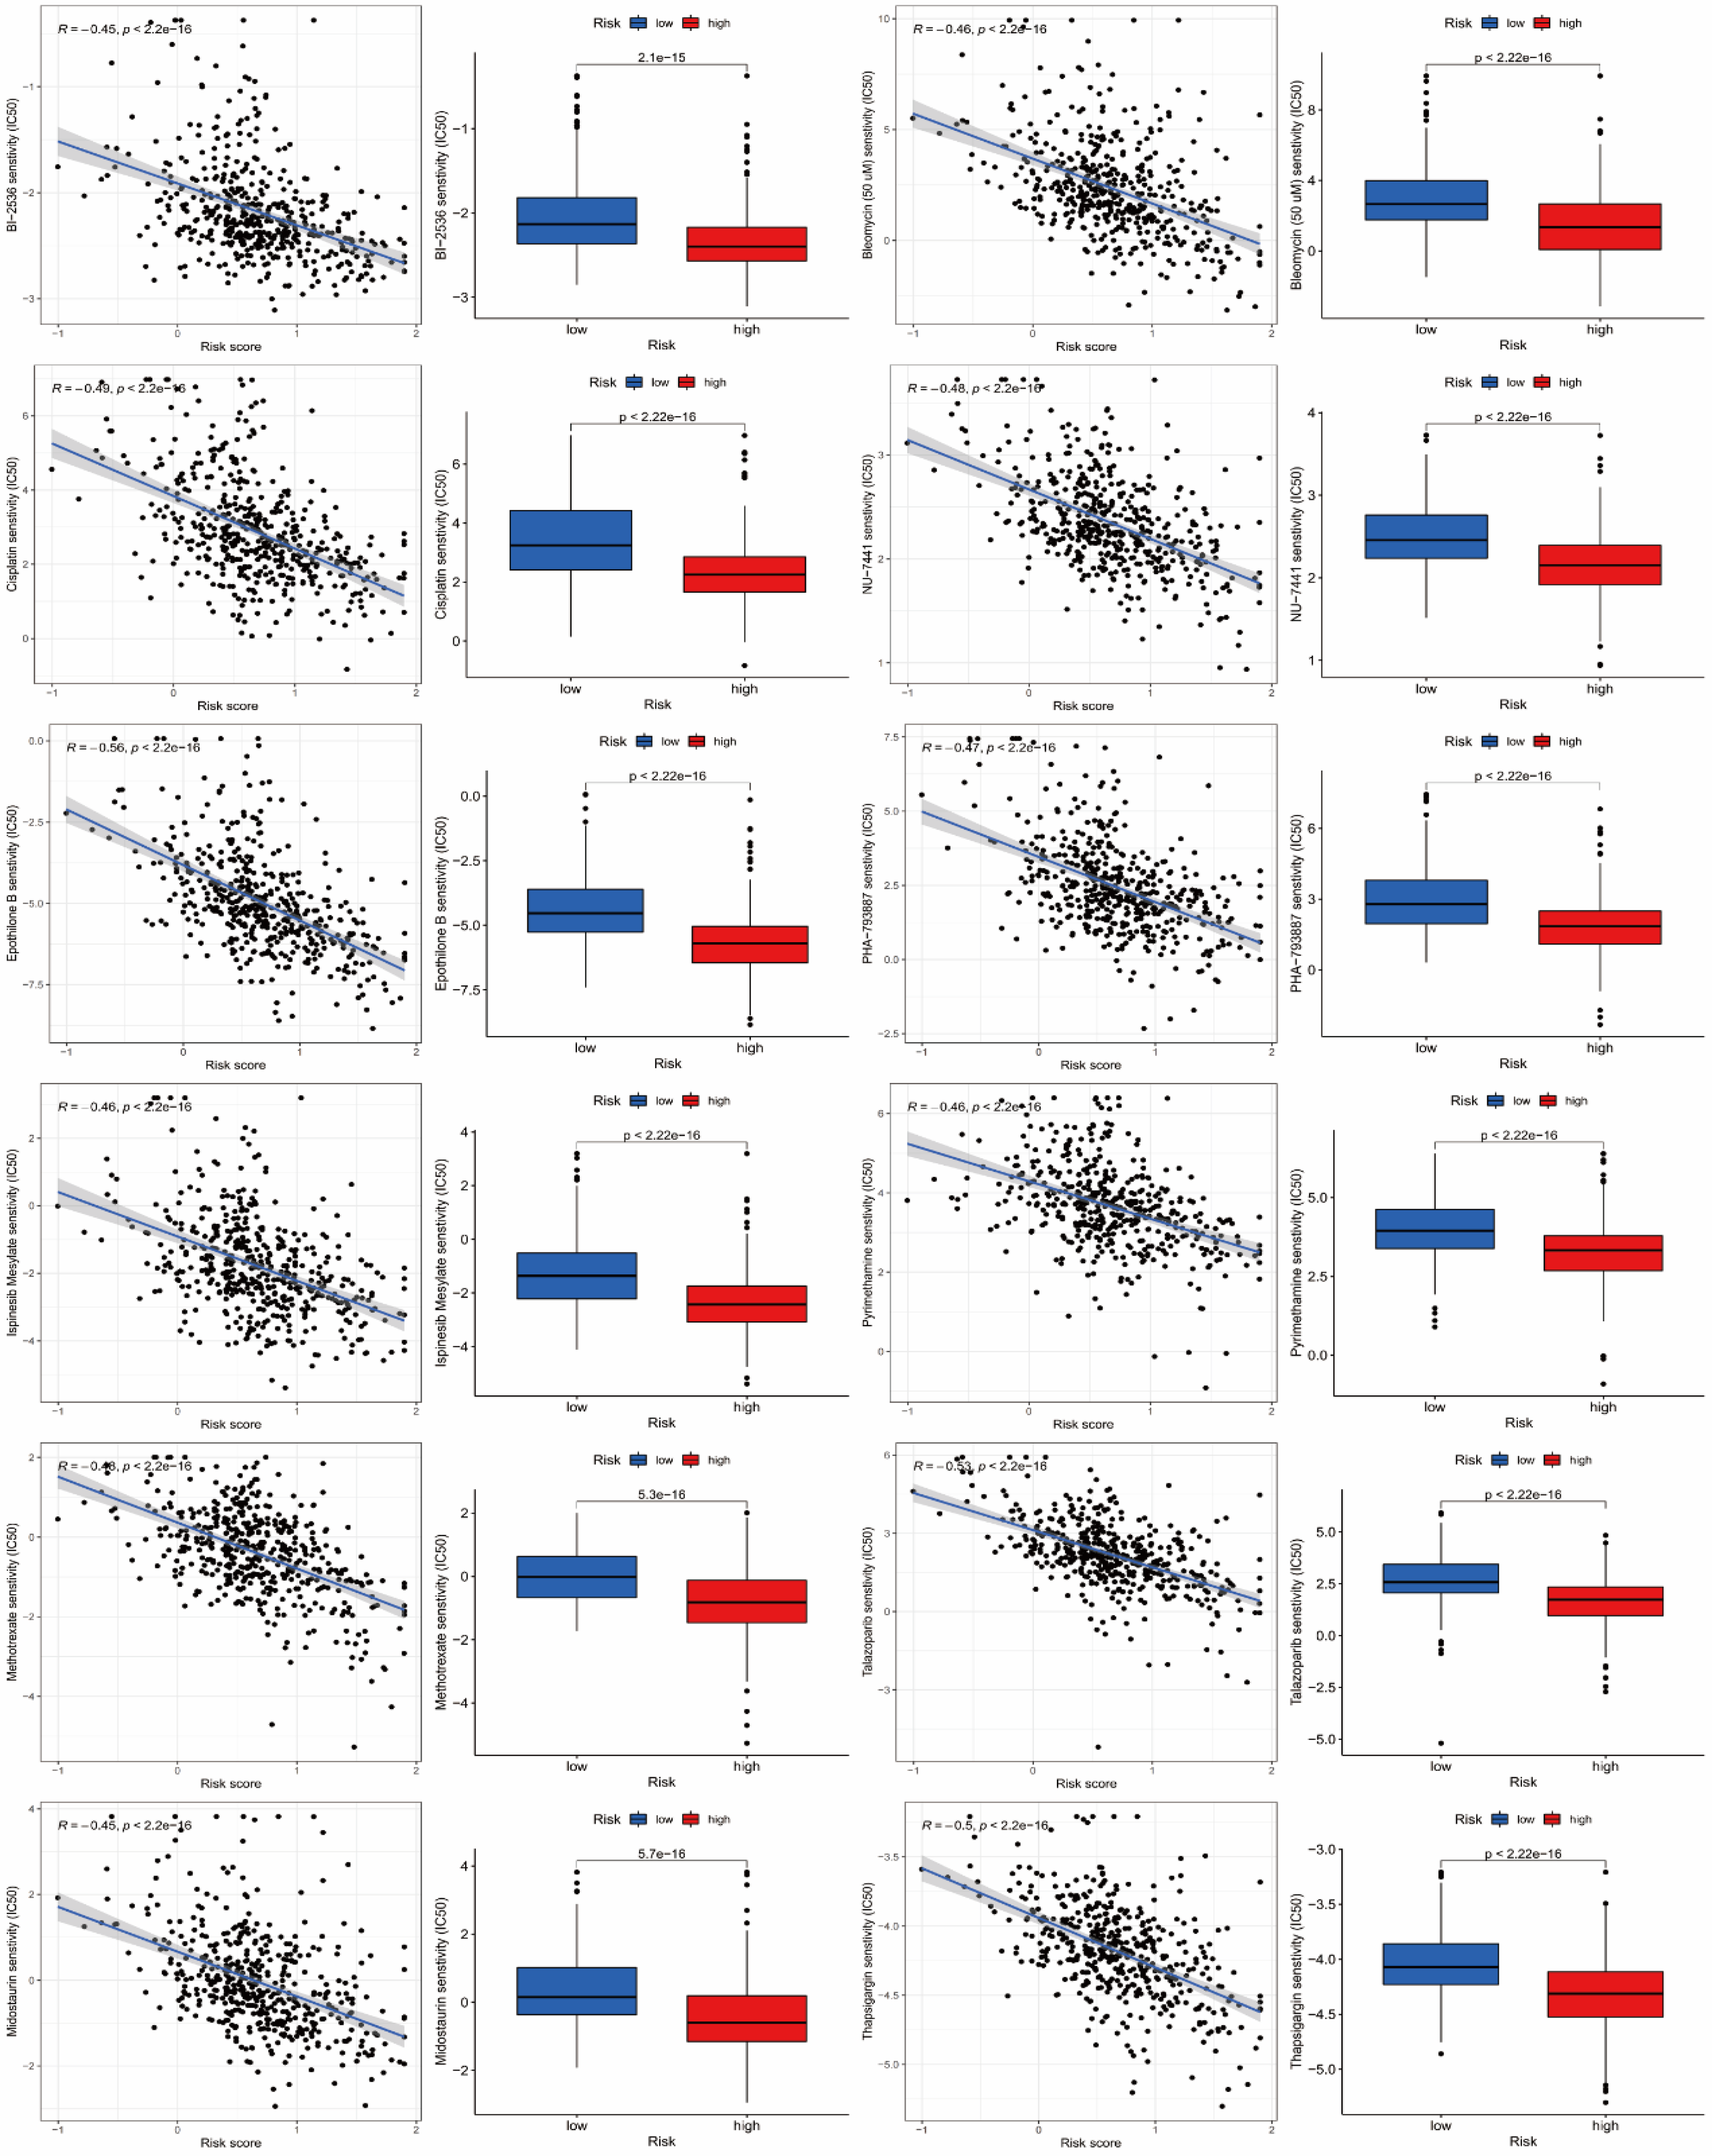
Analysis of drug sensitivity. A total of 12 drugs were considered to be potentially sensitive drugs suitable for the treatment of patients with LUAD, namely BI-2536, Bleomycin (50 μM), Cisplatin, NU-7441, Epothilone B, PHA-793887, Ispinesib Mesylate, Pyrimethamine, Methotrexate, Talazoparib, Midostaurin and Thapsigargin. The IC50 values of these drugs were negatively correlated with risk scores, and patients in the high-risk group were more sensitive to the drugs.
By analyzing the efficacy of the cytotoxic T-lymphocyte-associated protein 4 (CTLA-4) and programmed cell death protein 1 (PD-1), we concluded that patients in the low-risk group tended to benefit more when immunotherapy was not used or ctLA-4 monotherapy was used (Figure 7(a) and (b)). However, when PD-1 monotherapy or CTLA-4 plus PD-1 combined treatment, there was no statistical difference between the two groups (Figure 7(c) and (d)). In addition, FAM-related DEGs and risk scores in the prognostic model were analyzed with immune checkpoints-related genes (Figure 7(e)). Notably, risk scores were negatively correlated with the expression of TNFSF18, TNFSF15, TNFSF14, TNFRSF4, TNFRSF25, TNFRSF14, LGALS9, LAIR1, IDO2, ICOS, HHLA2, CTLA4, CD80, CD48, CD40LG, CD28, CD27, CD244, CD200R1, CD160, BTNL2, BTLA, and ADORA2A, while TNFSF9, TNFSF4, TNFRSF9, CD70, CD276, and CD274 were positively correlated with risk scores. This provides a reference for the detection of immune checkpoints in clinical practice.

Results of immunotherapy efficacy analysis, and enrichment analysis (a–d) Violin plot of the association between immunotherapy effect and risk score: Control group; anti-CTLA4 group; anti-PD-1group; anti-PD-1/anti-CTLA4 group. (e) Heatmaps of immune checkpoints associated with risk model genes and risk score. (f–g) Histogram and circle plot of GO enrichment analysis showed 30 functions which were significantly associated with differential risk genes and the number of genes enriched on each function. (h) Activity of different KEGG pathways in patients with high and low risk groups. The heat map shows high activity in yellow and low activity in black. (*p < 0.05, **p < 0.01,*** p < 0.001)
Enrichment analysis revealed many biological processes related to humoral immunity and protein production. We analyzed FAM-related DEGs which enriched in functions and pathways, and found that DEGs were enriched in 175 GO pathways, and we showed the most significant enrichment in 30 pathways according to p-values (Figure 7(f)), we can also see the number of DEGs enriched in each GO pathway in the figure. And we listed DEGs enriched in 10 of these pathways (Figure 7(g)). In addition, the difference analysis of KEGG showed that 67 of the 186 pathways were significantly different between the high- and low-risk groups. We visualized the 30 most diverse pathways and could see that pathways “abc transporters”, “glycerophospholipid metabolism”, “taurine and hypotaurine metabolism”, “alpha linolenic acid metabolism”, “arachidonic acid metabolism”, and “linoleic acid metabolism” were more active in low-risk group, while the other 24 pathways were more active in high-risk group (Figure 7(h)).
PPI and gene interaction of DEGs
The PPI network is composed of proteins that participate in all aspects of life processes such as biological signal transmission, gene expression regulation, energy and material metabolism, and cell cycle regulation through their interactions with each other. Interactions between proteins encoded by 128 FAM-related genes were obtained from the STRING website and the results were visualized through the PPI network. The more links between proteins, the wider the interaction between them (Figure 8(a)). Subsequently, we made a PPI network plot of the protein encoded by DEGs in high- and low-risk groups, in which green represents down-regulated and purple represents up-regulated (Figure 8(b)). Based on this result, proteins encoded by 5 genes (MDHA, SDHC, IDH3G, SDHA and FH) with the largest number of adjacent nodes were identified as hub proteins for survival analysis (Figure 8(c)). However, only MDH2 (Figure 8(d), p = 0.01) and FH (Figure 8(e), p = 0.025) results were statistically different, and high expression predicted poor prognosis. This provides a way for us to study protein coding biological signals and pathway functions in the future.

Protein-protein interaction analysis. (a) Results of PPI analysis base on 128 fam-related genes encoding proteins. (b) Results of PPI analysis of the protein encoded by DEGs in high- and low-risk groups, where green represents down-regulation and purple represents up-regulation. (c) Proteins encoded by 5 hub genes (MDHA, SDHC, IDH3G, SDHA and FH) of the PPI network were identified according to the number of adjacent nodes. (d) Among the 5 hub proteins, only MDH2 and FH have significant differences in K-M analysis between high- and low-risk groups.
Discussion
The occurrence and progression of cancer is a complex process. Hanahan et al. propose features that rationalize the complexity of cancer, namely six biological capabilities acquired during cancer development, including sustaining proliferative signaling, evading growth suppressors, resisting cell death, enabling replicative immortality, inducing angiogenesis, and activating invasion and metastasis. 19 Recently, reprogramming of energy metabolism and evading immune destruction have been added to this list as two new cancer features, which considered an emerging hallmark of cancer. 20 “Aerobic glycolysis”, which provides sufficient energy for the rapid growth and proliferation of cancer cells, has been widely reported. 21 Although the role of FAM in cancer has been neglected in the past, it was widely concerned as another important metabolic abnormality in the process of carcinogenesis recently. 22 Fatty acid synthesis is often increased to meet the high demand for lipids in cancer cells during the rapid progression. For example, in breast cancer, inhibition of the transport protein citrate carrier during de novo fatty acid synthesis can effectively reduce the activity of breast cancer cells. 23 ATP citrate lyase, which is involved in de novo adipogenesis, is upregulated in gastric cancer, glioblastoma, and ovarian cancer and promotes tumor cell growth.24–26 These studies suggest that alterations in FAM may be a promising target for cancer treatment.
In the past few decades, LUAD has surpassed Lung squamous carcinoma as the most common pathological subtype. Due to the high heterogeneity, aggressiveness, and develop dug resistance, LUAD patients always have a poor prognosis, with an OS of less than 5 years. 27 Especially for advanced LUAD, the 5-year OS ranging from 5% to 17.7%. 28 Despite advances in treatment options for LUAD over the past decade, unfortunately, the molecular mechanisms underlying LUAD progression and drug resistance remain elusive. Acquired drug resistance is often prone to traditional treatments, which is one of the main factors affecting the efficacy of treatment, and also hinders the successful development of new treatment methods. Aberrant changes in the genome can activate signaling pathways that regulate the growth and differentiation of cancer cells. For example, gene amplification, mutation, or translocation can lead to cell proliferation and inhibition of apoptosis, thereby promoting the formation and metastasis of cancer cells. 29 Comprehensive analysis of molecular features of cancers, especially the gene expression features, can help people better understand the role of driving genes in the process of cancer, and contribute to the development of individualized treatment and management strategies. 12 Here, we developed a risk model based on the TCGA network database to explore the gene expression patterns and features of the RNA-Seq dataset of LUAD patients, and validated the prognostic value of the model using the GEO dataset. Our study identifies molecular targets of potential biomarkers that may contribute to the diagnosis and treatment of LUAD, providing critical information for subsequent research.
In this study, we focused on FAM-related DEGs in normal and LUAD tissues. Among 121 FAM-related DEGs, univariate Cox regression analysis identified 27 genes that have statistical differences with OS. Based on these 27 FAM-related DEGs, 17 prognostic signatures were screened out by LASSO regression analysis to construct the risk model, and patients in the training set and testing set were stratify into low- and high-risk groups. It is important to note that the five prognostic signatures of HACD1, ELOVL2, CEL, SMS and DPEP2 are innovative and have not been previously reported in lung cancer. HACD1, also known as protein tyrosine phosphatase-like member A (PTPLA), is a member of the Protein Tyrosine Phosphatase-like family. Studies have found that HACD1 is an important regulatory factor of myoblast growth and differentiation, and impaired HACD1 enzymatic activity can lead to congenital myopathy. 30 But its role in cancer is unclear. ELOVL2 belongs to the ELOVL fatty acid enzyme family, which is involved in the elongation of ultra-long chain fatty acids and plays a key role in various mammalian cells. 31 ELOVL2 has been shown to inhibit the drug resistance of breast cancer to tamoxifen, 32 and inhibit the proliferation, migration and invasion of prostate cancer cells. 33 However, Tanaka et al reported that elevated ELOVL2 levels were significantly associated with an increased incidence of poor prognosis in renal cell carcinoma. 34 The role of CEL, SMS and DPEP2 in LUAD remains to be explored, but in the studies of pancreatic cancer, it has been concluded that CEL is not suitable as a biomarker for diagnosis or treatment. 35 In the study of Guo et al, there is a coordinated effect between SMS and MYC in colorectal cancer, and they maintain colorectal cancer cell activity by inhibiting the expression of Bim. 36 And the expression of DPEP2 is altered in the context of inflammatory diseases. 37 These findings provide a reliable guide for the future studies in LUAD.
In addition, multivariate regression analysis showed that stage and risk score were independent prognostic factors for LUAD. The later the cancer stage, the higher the risk score, the worse the OS. Moreover, the construction of clinical nomograms predicted the 1-, 3-, 5-year OS of LUAD, and met the individual application in practice. Each patient can get the corresponding nomogram through R software, which is almost free and portable. More importantly, the exploration of new targets for immunotherapy and targeted therapy is highly desirable as a research focus. At present, with the accumulation of molecular knowledge by next-generation sequencing technology and the development of specific targeted molecular drugs, molecularly targeted therapy has enabled cancer patients with specific genetic aberrations to benefit from survival. 38 For example, EGFR-targeted drugs gefitinib, erlotinib, afatinib and osimertinib, and ALK-targeted drugs crizotinib, ceritinib, and alectinib. However, most patients developed acquired resistance within one year of treatment. Therefore, it is particularly important to explore new targets to promote the development of new drugs.
In recent years, the treatment of LUAD has developed rapidly, and new strategies such as immunotherapy have attracted increasing attention. In this study, we identified potential therapeutic targets in patients by analyzing immune cell function and immune checkpoints. Immune checkpoint blockade (ICB) therapy targeting PD-1/PD-L1 significantly improved the survival rate of patients with advanced lung cancer. 39 ICB therapy can reverse the immunosuppressive microenvironment by reducing the potential for tumor immune escape, thereby significantly improving patient outcomes. 40 TMB is an important indicator that affects the response to ICB treatment, and studies have reported a positive correlation between TMB and the benefits of ICB treatment. In current clinical practice, the proportion of patients who benefit from ICB therapy remains low. Therefore, the development of new biomarkers to select patients for ICB response rate has important clinical value. TIDE uses a set of gene expression markers to estimate two different tumor immune escape mechanisms, including PD-1/PD-L1 and CTLA-4. 41 Patients with higher TIDE scores have a higher chance of experiencing anti-tumor immune escape and a lower response rate to ICB treatment. 11 In addition, TIDE scores were more accurate than PD-L1 expression levels and TMB in predicting survival outcomes in cancer patients treated with ICB drugs. 42 In addition, beneficial immunotherapy effects were observed only in a subgroup of patients with a response of 17–21%, 43 indicating the presence of other immune checkpoints in the LAUD-TME. Therefore, it is necessary to explore new immune checkpoints. Our research found that high-risk LUAD patients exhibit higher TMB and lower TIDE scores than low-risk patients. Most patients in the high-risk group are immunosuppressed, so they are more likely to benefit from immunotherapy.
We also used R package pRRophetic to screen out potential sensitive drugs, providing reference for future drug selection. Among the 12 drugs listed in Figure 6 with moderate or strong correlation, BI-2536 targets PLK1, PLK2, PLK3 genes and cell cycle pathway; bleomycin targets dsDNA break induction and DNA replication pathway; cisplatin targets DNA crosslinker and DNA replication pathway; NU-7441 targets DNAPK and genome integrity pathway; epothilone B targets microtubule stabiliser and mitosis pathway; PHA-793887 targets CDK2, CDK7, CDK5 and cell cycle pathway; ispinesib mesylate targets KSP and mitosis pathway; pyrimethamine targets dihydrofolate reductase pathway; methotrexate targets antimetabolite and DNA replication pathway; talazoparib targets PARP1, PARP2 and genome integrity pathway; midostaurin targets PKC, PPK, FLT1 and c-FGR; and thapsigargin targets SERCA (https://www.cancerrxgene.org/). The variation of cancer genome can affect the effectiveness of clinical treatment, and different targets have significantly different drug responses. Therefore, such data is crucial for discovering potential tumor treatment targets. In addition, the IC50 of these drugs are inversely related to the risk score, and patients in the high-risk group are more sensitive to drugs and can benefit more from treatment than those in the low-risk group.
Although our risk model achieved some important results, it must be acknowledged that there are still shortcomings. First, this was a retrospective analysis using public database, and we still lack validation of prospective studies. Furthermore, our study considered the effect of genetic mutations on cancer progression, but did not analyze methylation or other possible factors. In future studies, we will continue to refine the data and risk models to ensure more reliable conclusions.
Conclusions
The risk model based on 17 FAM-related DEGs is of great value in predicting the prognosis of LUAD, and these prognostic signatures may be potential therapeutic targets for LUAD.
Supplemental Material
sj-docx-1-cbm-10.1177_18758592241296285 - Supplemental material for A fatty acid metabolism-related genes model for predicting the prognosis and immunotherapy effect of lung adenocarcinoma
Supplemental material, sj-docx-1-cbm-10.1177_18758592241296285 for A fatty acid metabolism-related genes model for predicting the prognosis and immunotherapy effect of lung adenocarcinoma by Lingxue Tang and Tong Wang in Cancer Biomarkers
Supplemental Material
sj-xlsx-2-cbm-10.1177_18758592241296285 - Supplemental material for A fatty acid metabolism-related genes model for predicting the prognosis and immunotherapy effect of lung adenocarcinoma
Supplemental material, sj-xlsx-2-cbm-10.1177_18758592241296285 for A fatty acid metabolism-related genes model for predicting the prognosis and immunotherapy effect of lung adenocarcinoma by Lingxue Tang and Tong Wang in Cancer Biomarkers
Supplemental Material
sj-xlsx-3-cbm-10.1177_18758592241296285 - Supplemental material for A fatty acid metabolism-related genes model for predicting the prognosis and immunotherapy effect of lung adenocarcinoma
Supplemental material, sj-xlsx-3-cbm-10.1177_18758592241296285 for A fatty acid metabolism-related genes model for predicting the prognosis and immunotherapy effect of lung adenocarcinoma by Lingxue Tang and Tong Wang in Cancer Biomarkers
Supplemental Material
sj-xlsx-4-cbm-10.1177_18758592241296285 - Supplemental material for A fatty acid metabolism-related genes model for predicting the prognosis and immunotherapy effect of lung adenocarcinoma
Supplemental material, sj-xlsx-4-cbm-10.1177_18758592241296285 for A fatty acid metabolism-related genes model for predicting the prognosis and immunotherapy effect of lung adenocarcinoma by Lingxue Tang and Tong Wang in Cancer Biomarkers
Footnotes
Abbreviations
Acknowledgments
We thank the TCGA, GEO, and TCIA databases for providing valuable data sets, and the Natural Science Foundation of Hefei for its financial support.
Ethics approval and consent to participate
Not applicable.
Consent for publication
Not applicable.
Authors contributions
All authors contributed to the study conception and design. Material preparation, data collection and analysis were performed by L.T. and T.W. The first draft of the manuscript was written by L.T. and T.W., T.W. and J.X revised it critically for important intellectual content and, all authors commented on previous versions of the manuscript. All authors read and approved the final manuscript.
Funding
The author(s) disclosed receipt of the following financial support for the research, authorship, and/or publication of this article: This work was supported by the Natural Science Foundation of Hefei (No. 2022034) and the Discipline Construction Funds of Wang Tong (2021LCZD15).
Declaration of conflicting interests
The author(s) declared no potential conflicts of interest with respect to the research, authorship, and/or publication of this article.
Availability of data and materials
All data generated or analyzed during this study are included in this published article and its supplementary information files.
Supplemental material
Supplemental material for this article is available online.
References
Supplementary Material
Please find the following supplemental material available below.
For Open Access articles published under a Creative Commons License, all supplemental material carries the same license as the article it is associated with.
For non-Open Access articles published, all supplemental material carries a non-exclusive license, and permission requests for re-use of supplemental material or any part of supplemental material shall be sent directly to the copyright owner as specified in the copyright notice associated with the article.