
Abstract
Introduction
According to statistics, the proportion of women diagnosed with breast cancer (BRCA) is increasing. For women, breast cancer, lung cancer, and colorectal cancer collectively account for 50% of all new cancer diagnoses. Among them, breast cancer alone represents 30% of cancers diagnosed in women, 1 and the prevalence of breast cancer continues to climb every year, which may be due to declining fertility and rising weight in humans. 2 Studies have shown that a total of 281 550 women have been diagnosed with breast cancer in the United States, and about 43 600 breast cancer patients have died by 2021. 3 In recent years, with the rapid development of the medical field, significant progress has been made in the treatment of BC, including anti-programmed cell death ligand 1 (PD-L1) immunotherapy, CDK4/6 (cyclic independent kinase 4/6) inhibitors, and phosphatidylinositol 3 kinase inhibitors (PI3K). 4 However, since breast cancer is a heterogeneous disease with hereditary and clinical heterogeneity, 5 most breast cancer patients still have a poor prognosis, even for those patients who had received treatment in the early stage. Therefore, it is of great significance to explore the physiological mechanism related to the development of BC and find new molecular therapeutic targets to improve the clinical treatment effect of breast cancer patients.
The endoplasmic reticulum stress (ERS) state is driven by various metabolic and carcinogenic abnormalities in the tumor microenvironment (TME). These abnormalities disrupt the protein folding homeostasis in malignant cells and infiltrating immune cells, thereby compromising the endoplasmic reticulum's ability to fold proteins. This disruption leads to the induction of ERS, characterized by the accumulation of misfolded or unfolded proteins within the cell. 6 In the past few decades, with the continuous development of genomics, cell damage caused by ERS has gradually been widely recognized as a core pathophysiological factor in current human diseases. 7 For example, ERS has been well proven in affected in diabetes,8,9 stroke,10,11 neurodegeneration,12,13 inflammatory disorders,14,15 pulmonary fibrosis,16,17 viral infection,18,19 and heart disease.20,21 Moreover, environments harmful to human cells, such as hypoxia, contribute to the development of invasive and metastatic cancer cells. 22 However, these unfavorable environmental conditions for human cells also impact protein folding in the endoplasmic reticulum.23–26 Meanwhile, numerous studies have now identified sustained high-level activation of the unfolded protein response (UPR) in various types of human primary tumors,27–29 including breast cancer.30–32 Although numerous studies have demonstrated the sustained activation of ERS and UPR in breast cancer patients, the complex nature and heterogeneity of human primary tumors necessitate further investigation into whether ERS inhibits or promotes tumor growth. Additionally, to predict the prognosis of breast cancer patients, this study has developed a prognostic model based on risk factors.
Methods
Data and Gene Acquisition
A total of 1222 RNA transcriptome datasets of human breast tissue samples were obtained from The Cancer Genome Atlas (TCGA, https://portal.gdc.cancer.gov), including 1109 BC samples and 113 normal samples. And the clinical information about cancer samples and normal samples was also downloaded from TCGA. At the same time, the data of 179 normal human breast tissues were obtained from Genotype-Tissue Expression (GTEx, https://www.gtexportal.org) database. The GSE20685, GSE20711, and GSE103091 datasets were downloaded from the Gene Expression Omnibus (GEO, https://www.ncbi.nlm.nih.gov/geo) database. Moreover, the data of interacting chemicals and the 8 genes was obtained from CTD database (https://ctdbase.com/). Finally, 8763 related genes were obtained by searching for the keywords “endoplasmic reticulum stress” in GeneCards (https://www.genecards.org), and 831 genes with correlation coefficients greater than 7 were selected. Furthermore, drug sensitivity data was obtained through the CellMiner database (https://discover.nci.nih.gov/cellminer/home.do).
Screening of Differentially Expressed Genes and Intersection Genes
Differential analysis of normal breast tissue data and breast cancer tumor data from TCGA and GTEx datasets was conducted using the R package “DESeq2.” A total of 11 209 differential genes were identified, including 7265 upregulated genes and 3944 downregulated genes. Subsequently, these 11 209 differential genes were intersected with 831 ERS-related genes, resulting in 178 intersecting genes. The criteria used for filtering differential genes were |log2FoldChange| > 1 and padj < 0.05. It should be noted that in the differential analysis, TCGA normal breast tissue data and GTEx normal breast tissue data were combined.
Enrichment Analysis
The GO enrichment analysis and KEGG enrichment analysis of the 178 intersection genes were conducted by using R package “clusterProfiler.”
Construction of Prognostic Signature Model of Genes Related to BC and ERS
To further explore the correlation genes of BC and ERS, the LASSO regression analysis was used to filter 178 intersecting genes. And 27 related genes were screened. At the same time, we conducted the survival analysis of these 27 genes. It was found that only 8 genes had a meaningful survival prognosis. Then we performed multivariate Cox proportional risk regression analysis to model the prognostic signature with 8 relevant genes, which were combined with minimum Akaike information criterion (AIC) values. The R packages “glmnet” and “survival” were used for the above analysis. The risk score of patients with BC was calculated according to the following formula:

To validate the accuracy of the prognostic signature model, the batch effect of three datasets was removed: GSE20685, GSE20711, and GSE103091, and the three datasets were combined as the validation set. Then, the prognostic signature model of the 8 genes was constructed by repeating the above operations.
Finally, to evaluate the prognostic role of the signature, we adopted the log-rank statistical method and plotted the Kaplan–Meier curves of the training and validation sets to compare overall survival (OS) between high and low risk groups. And the risk factor map was plotted by using R package “ggplot2.” Moreover, the receiver operating characteristic (ROC) curve of 2-year, 4-year, and 6-year was also plotted and the area under the curve (AUC) was also calculated by using R package “survival,” “survminer,” and “timeROC.”
Construction of Nomogram and Calibration Curves
The nomogram of 2-year, 4-year, and 6-year OS was constructed based on risk scores and the clinical information of BC, with the R package “rms” and “survival.” And the calibration curves were established based on the Hosmer–Lemeshow test to validate the accuracy of the nomogram for clinical prognosis by assessing the degree of anastomosis between the results of prediction and the actual results of observation.
Unsupervised Clustering
Based on the expression profiles of 8 genes in BRCA patients, 1109 BRCA patients were unsupervised clustered by using the consensus algorithm in the R package “ConsensusClusterPlus.” The K values were comprehensively screened by the PAC algorithm, and the best K value was obtained by the result. The two BRCA subtypes were extracted and visualized for t-SNE clustering and subtype survival analysis, respectively.
Establishment of Diagnostic Models
Based on the TCGA expression profiles of 8 genes in breast cancer and normal people, a diagnostic model was established by logistic regression. The diagnostic model was built by logistic regression had only one input layer and one output layer. And there were 8 neurons in the input layer and 1 neuron in the output layer. The training set used to train the model included 724 breast cancer patients and 192 normal people. And the test set used to test the model included 375 breast cancer patients and 100 normal people.
Protein Level Analysis
The Human Protein Atlas database (HPA: https://www.proteinatlas.org) was used to analyze the protein level of above 8 genes in tumor and healthy breast tissues. And the specific location of the 8 genes in human cells was explored by the GeneCards (https://www.genecards.org).
Analysis of the Tumor Immune Microenvironment and Immune Cell Infiltration
To further explore the specific role of the 8 genes associated with ESR in the immune microenvironment of BC, we performed the comprehensive analysis of immune infiltration. Firstly, calculating the estimate score and stromal score of the 8 genes in BC by using the R package “estimate.” The 24 immune cells infiltration score of BC samples was obtained by the published article. 33 And the immune infiltration analysis was conducted by using the R package “GSVA”. Moreover, the correlation between the 24 immune cells levels and the expression of 8 genes in BC was also analyzed. The information of immune activating factors, immune chemokine factors, immune chemokine receptors and immunosuppressive factors were obtained from the TISIDB database (cis.hku.hk/TISIDB/). Then the correlation of 8 genes with above immune factors in BC was analyzed by the R package “ggplot2.” To explore the specific interaction of the 8 genes in BC, we plotted the heat map of correlation by using the R package “ggplot2.”
Prognostic Analysis
The Kaplan–Meier curves were plotted by using the R package “survminer” and “survival” to evaluate the OS of patients in BC. And to validate the accuracy of prognosis, the ROC curves in 2-year, 4-year, and 6-year were plotted.
Drug Sensitivity Analysis
From the 23 993 drug data obtained from the CellMiner database (https://discover.nci.nih.gov/cellminer/home.do), 860 drugs were selected, including 546 drugs that have undergone clinical trials and 314 drugs that have received FDA approval. Simultaneously, through preprocessing the RNA-seq data obtained from CellMiner and extracting the expression levels of 8 hub genes, the correlation coefficients between the expression of each gene and the IC50 values of different drugs were calculated using the processed drug data. The analysis results were filtered using a threshold of P < .01, and the top 16 most significant correlation analysis results were extracted and visualized.
Quantitative Real-Time PCR Experiment
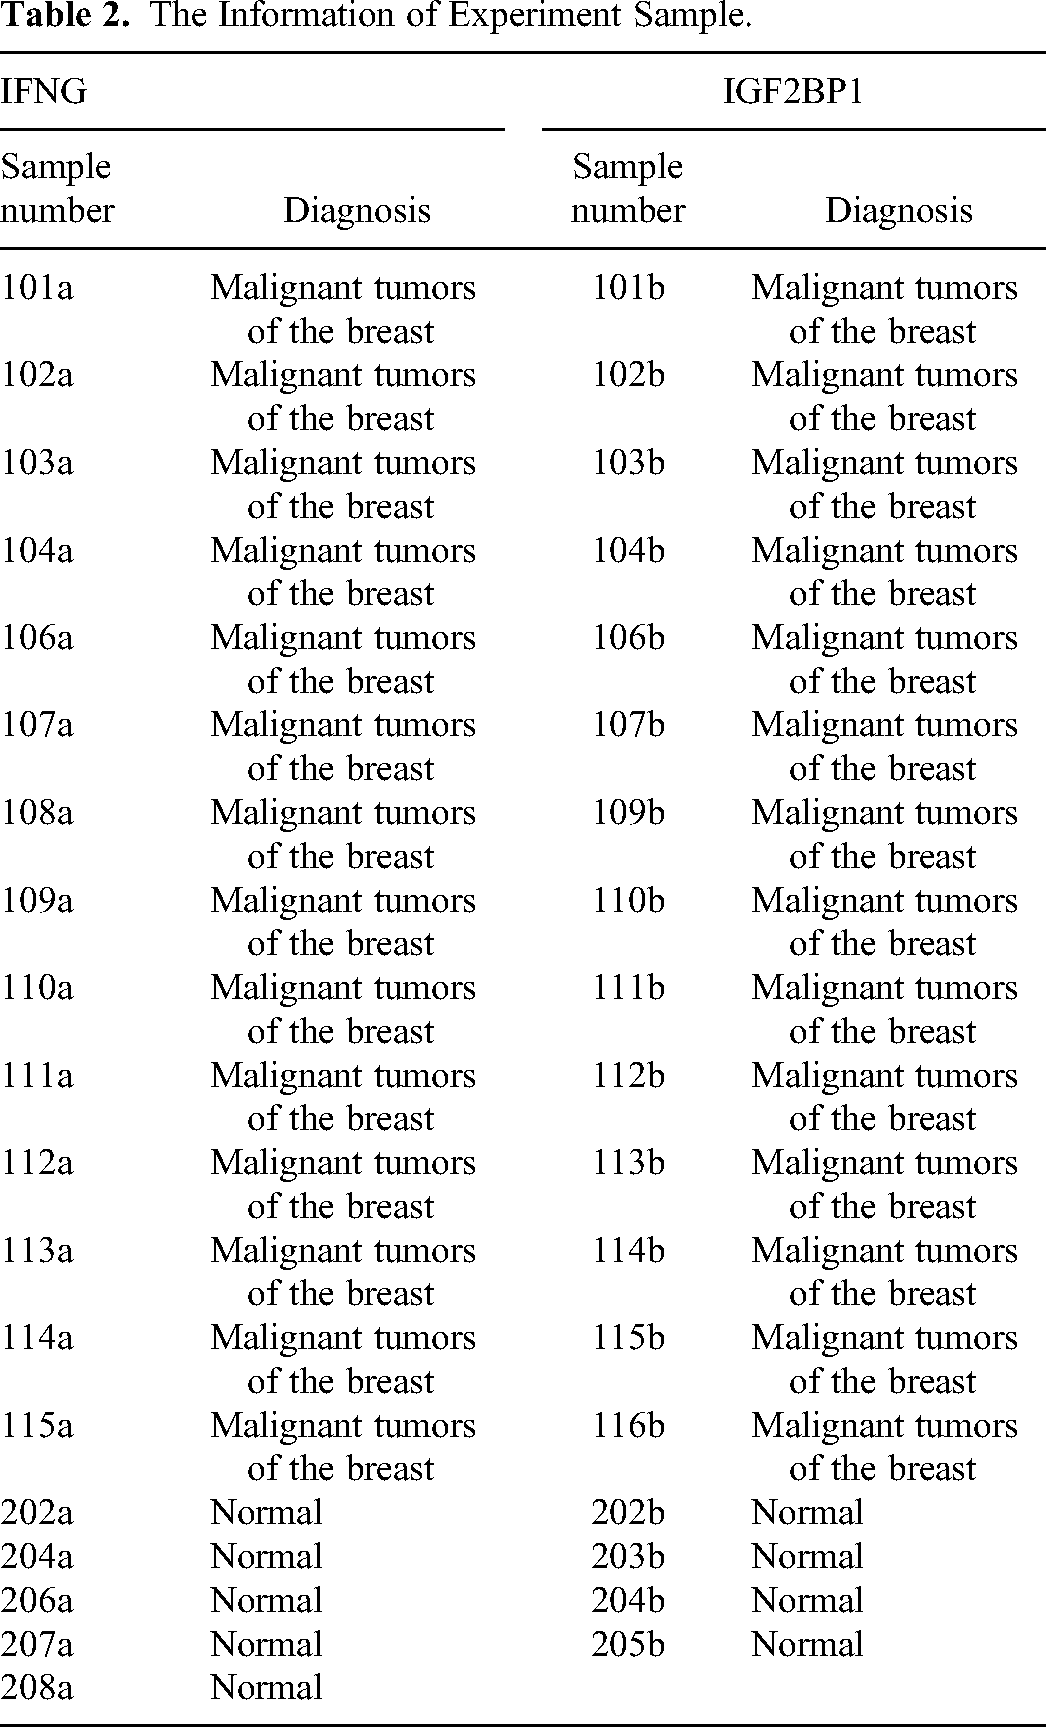
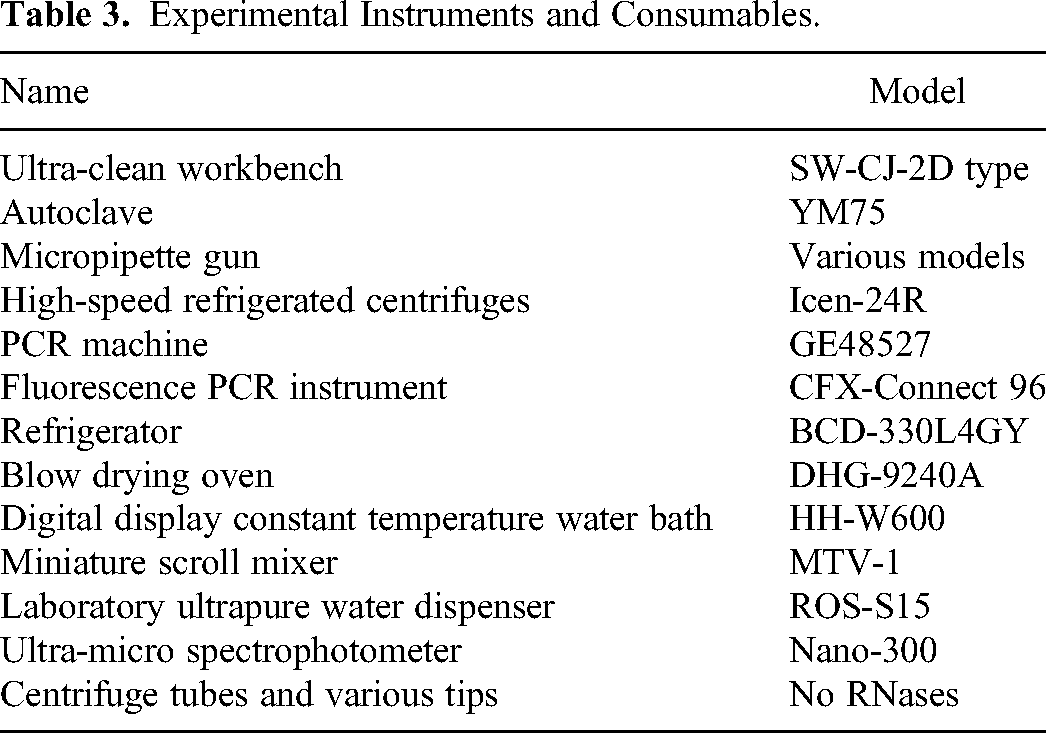
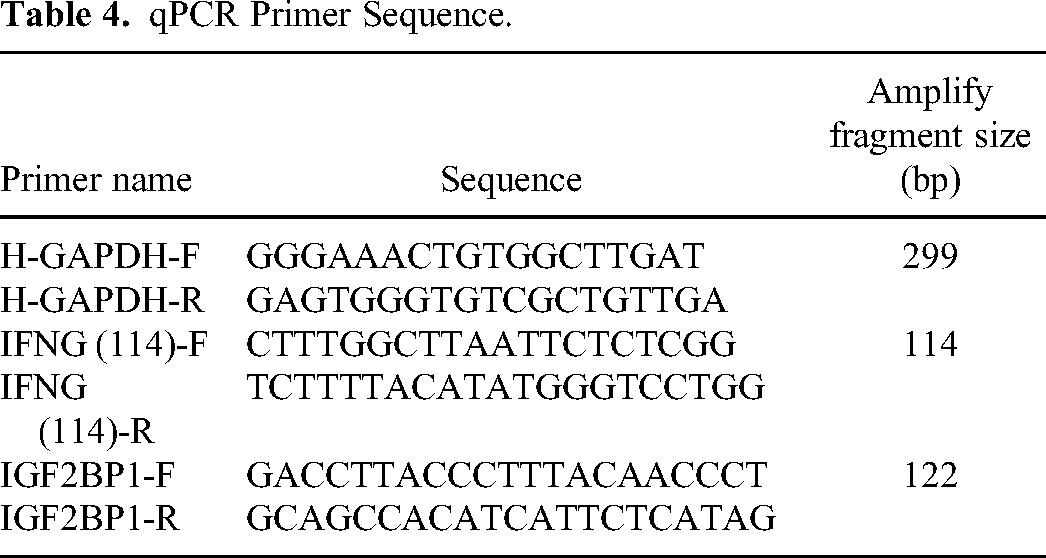
Firstly, in order to mitigate the impact of individual data on the results, we collected 14 breast cancer samples and 5 normal human samples (Table 2) separately to validate the expression of the IFNG gene. We also collected 14 breast cancer samples and 4 normal human samples separately to validate the expression of the IGF2BP1 gene (Table 2). Then the IFNG gene and IGF2BP1 gene were sequenced by total RNA extraction, reverse transcription, and Real-time PCR amplification of the sample. In order to reduce the impact of experimental error, the 3 complex wells were used in our experimental. The Trizol reagent used in the experiment was from Ambion, chloroform, isopropanol and anhydrous ethanol were from China National Pharmaceutical Group Chemical Reagent Co., Ltd The SYBR FAST qPCR Master Mix was used from KAPA Biosystems, and Oligo (dT)18 Primer, PrimeScript II RTase, and Recombinant Rnase Inhibitor were used from TAKARA. The 10 mM dNTP Mix and DNase/RNase-Free Water were both from Solarbio. The main instruments and consumables used in the experiment were shown in Table 3. In addition, the PCR primes (Table 4) were synthesized by Wuhan Tianyi Huayu Genewiz Technology Co., Ltd.
Regression Coefficients for 8 ESR-Related Genes Obtained by Multivariate Cox Analysis.
The Information of Experiment Sample.
Experimental Instruments and Consumables.
qPCR Primer Sequence.
Statistical Analysis
All statistical analyses in this study were performed by using R (v.3.6.3). The spearman coefficient was used to assess the correlation between the two factors. And the Wilcoxon rank sum test was used to distinguish between groups. At the same time, the ten-fold cross validation was used for the lasso analysis. And the diagnostic model was built by using Python (v3.9). Finally, P < .05 was considered statistically significant. The reporting of this study conforms to REMARK guidelines. 34
Results
Selection of ERS-Related Genes in Breast Cancer (BC) Patients
In our study, we obtained differential genes of breast cancer and ERS-related genes from TCGA, GTEx, and GeneCards databases, respectively. Through intersection analysis, we identified 8 hub genes associated with ERS. Mechanisms of ERS in breast cancer development were elucidated through two major enrichment analyses. To assess the clinical prognostic value of these 8 hub genes related to ERS in breast cancer patients, both gene-independent prognostic models and gene co-expression risk prognostic models were constructed to comprehensively evaluate the prognostic effects of the 8 hub genes. Additionally, by identifying these 8 hub genes, we also identified two new BRCA subtypes and further explored the mechanisms of ERS in breast cancer development. Furthermore, to improve the early diagnosis rate of breast cancer patients, a gene co-expression diagnostic model was established based on the expression levels of the 8 hub genes for clinical diagnosis of breast cancer. Finally, to further investigate the mechanisms of action of the 8 hub genes in breast cancer patients, immune microenvironment analysis, protein expression level analysis, and drug sensitivity analysis were conducted, thereby identifying novel immunotherapeutic approaches for breast cancer. The specific workflow of this study is illustrated in Figure 1.

The specific process of the study.
Differential analysis was performed on RNA-seq data of breast cancer from the TCGA database, resulting in a total of 11 209 differentially expressed genes. To visually represent the overall distribution of gene expression differences in breast cancer, we generated a volcano map (Figure 2A). Then, the difference genes were intersected with the resulting 831 ER-related genes to obtain 178 intersecting genes (Figure 2B).

Intersection gene screening. (A) Volcano plot. The red color represents upregulated genes: 7265, and the blue color represents downregulated genes: 3944. (B) Venn diagram. The blue color represents differentially expressed genes in BRCA, the red color represents ERS-related genes, and the intersection between the two sets of genes is 178.
Enrichment Analysis
To explore the main regulatory mechanisms associated with ERS in breast cancer patients, we conducted GO enrichment analysis and KEGG enrichment analysis on the 178 genes associated with ERS.
For biological process (BP), it was found that the 178 genes were significantly associated mainly with regulation of transporter activity, response to ERS, regulation of DNA-binding transcription factor activity, positive regulation of cell adhesion, endoplasmic reticulum UPR, intrinsic apoptotic signaling pathway in response to ERS, regulation of response to ERS, positive regulation of response to ERS, regulation of endoplasmic reticulum UPR and positive regulation of endoplasmic reticulum UPR in BC patients (Figure 3A).

Go enrichment analysis and KEGG enrichment analysis. (A) GO enrichment analysis – BP, 10 selected biological processes. (B) GO enrichment analysis – CC, 10 selected cellular components. (C) GO enrichment analysis – MF, 10 molecular functions. (D) KEGG enrichment analysis, 10 selected pathways.
And for cellular component (CC), the above 178 genes were significantly associated mainly with endoplasmic reticulum lumen, membrane region, vesicle lumen, coated vesicle, intrinsic component of endoplasmic reticulum membrane, integral component of endoplasmic reticulum membrane, endocytic vesicle, transport vesicle, smooth endoplasmic reticulum and integral component of lumenal side of endoplasmic reticulum membrane in BC patients (Figure 3B).
For molecular function (MF), the 178 ERS-related genes were significantly associated mainly with cell adhesion molecule binding, Hsp70 protein binding, Hsp90 protein binding, growth factor activity, transcription factor activity, direct ligand regulated sequence-specific DNA binding, transcription coactivator binding, transcription cofactor binding, low-density lipoprotein particle receptor binding, protein binding involved in protein folding and immunoglobulin binding in BC patients (Figure 3C).
According to the results of KEGG enrichment analysis, it was found that the 178 genes were significantly associated with Focal adhesion, Human cytomegalovirus infection, Human papillomavirus infection, TNF signaling pathway, Protein processing in endoplasmic reticulum, Breast cancer, Endocrine resistance, PD-L1 expression and PD-1 checkpoint pathway in cancer, Choline metabolism in cancer and Transcriptional misregulation in cancer in BC patients (Figure 3D).
Establishing and Evaluating the ERS-Related Risk Signature
To establish an optimal ER stress-related risk signature in BC patients, we performed LASSO regression analysis on 178 ERS-related genes. From the analysis results, it can be seen that ERS was mainly regulated by 27 genes in BC patients (Figure 4A and B).
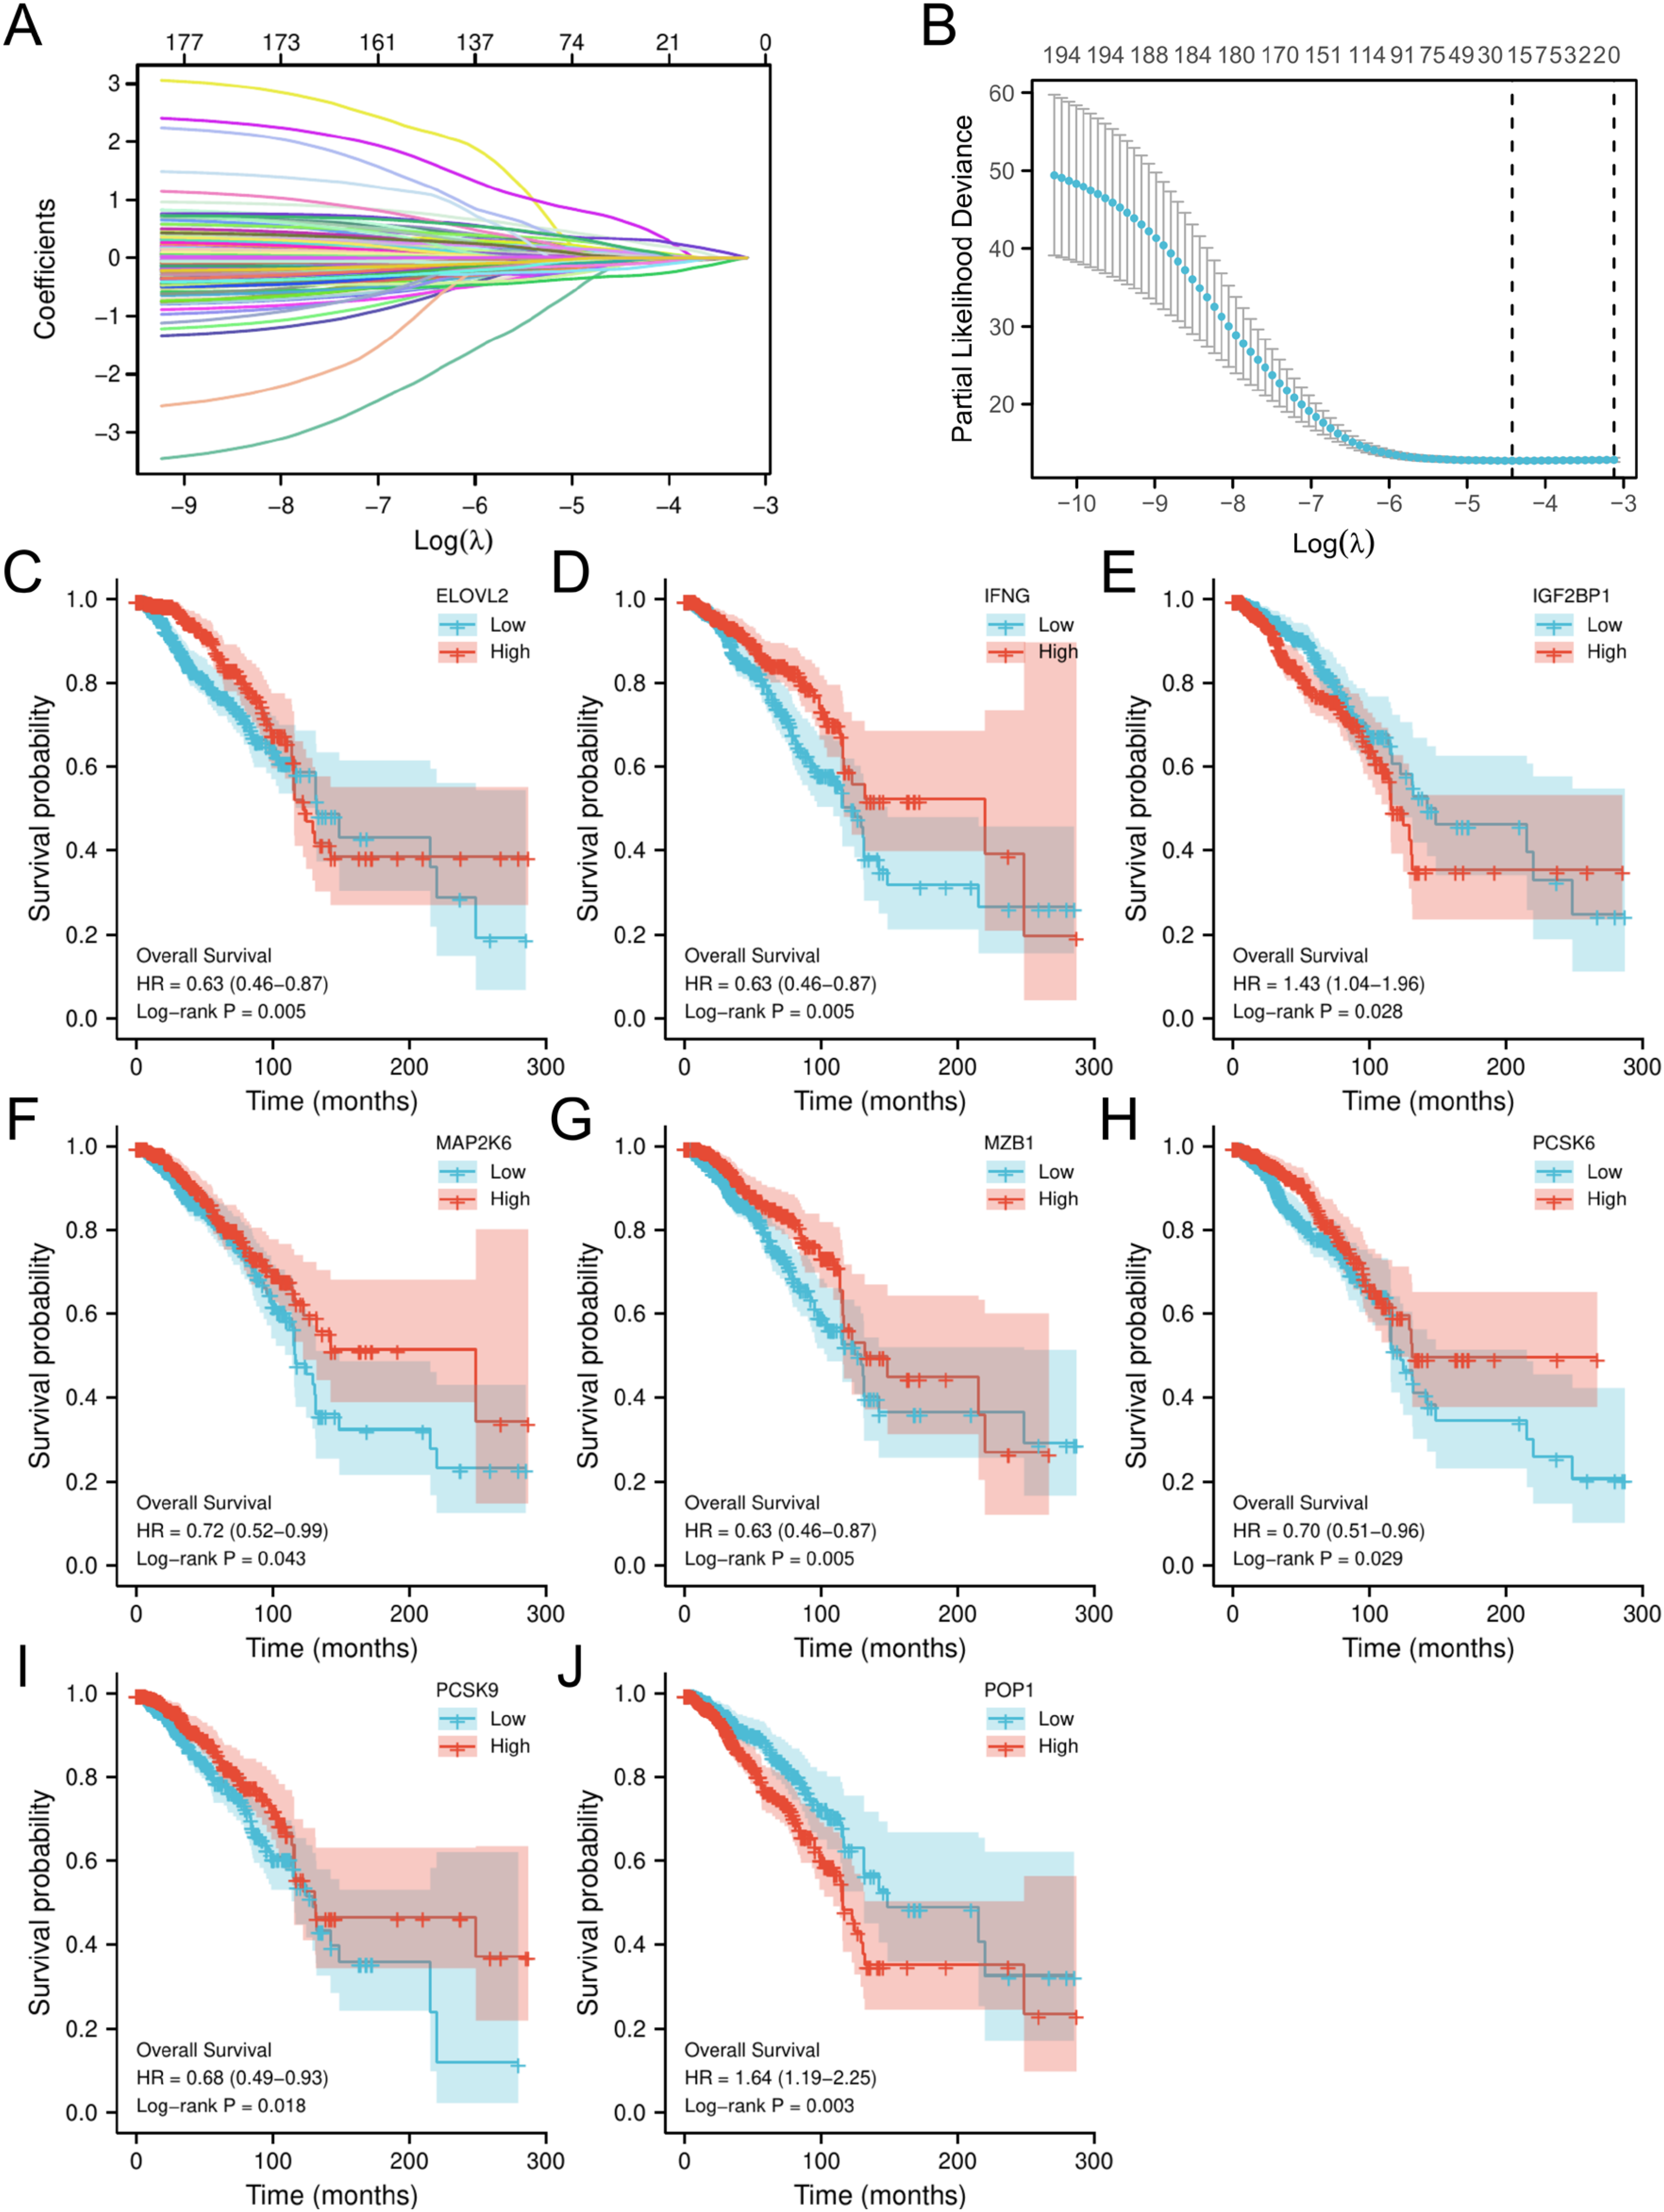
Selection of prognostic molecules. (A) LASSO variable trajectory.
To further explore the prognostic value of the 27 ERS-related genes in BC patients, the survival prognosis analysis was conducted. The results of Kaplan–Meier OS analysis showed that only 8 genes had a statistically significant OS prognosis: ELOVL2, IFNG, IGF2BP1, MAP2K6, MZB1, PCSK6, PCSK9, POP1 (P < .05) (Figure 4C–J). Among them, there were six genes with a good prognosis when overexpressed in BC patients: ELOVL2, IFNG, MAP2K6, MZB1, PCSK6, PCSK9. Simultaneously, in breast cancer patients, a poor prognosis is associated with overexpression of the genes IGF2BP1 and POP1.
To validate the prognostic accuracy of these eight genes at 2, 4, and 6 years of OS, we separately calculated the ROC curves for the eight genes at 2, 4, and 6 years (Supplementary Figure S1A–H). The results revealed that the AUC values for these eight genes at 2, 4, and 6 years were generally low, consistently below 0.5. Particularly noteworthy was the prognostic AUC value of ELOVL2 at 2 years, which was only 0.291 (Supplementary Figure S1A). This indicates that the effectiveness of these eight hub genes as independent prognostic factors is not ideal. Therefore, to enhance the clinical prognostic performance for breast cancer patients, it is necessary to consider re-establishing a prognostic model that takes into account the collective effect of these eight hub genes.
Expression Levels of the 8 Hub Genes in BRCA Tumor Tissue
Before constructing the new model, we analyzed the expression of the 8 genes in BC patients. The results showed that there were 7 genes significantly overexpressed in BC: ELOVL2, IFNG, IGF2BP1, MZB1, PCSK6, PCSK9, and POP1 (p < .05) (Figure 5A–C, E–H). Concurrently, it was found that the expression of MAP2K6 was significantly underexpressed in BC (p < .05) (Figure 5D). Meanwhile, the 8 genes all can distinguish between normal breast and cancer tissue (AUC > 0.6) (Supplemental Figure S2A–H).

Expression difference analysis. (A) The expression of ELOVL2 in BC and Normal. (B) The expression of IFNG in BC and Normal. (C) The expression of IGF2BP1 in BC and Normal. (D) The expression of MAP2K6 in BC and Normal. (E) The expression of MZB1 in BC and Normal. (F) The expression of PCSK6 in BC and Normal. (G) The expression of PCSK9 in BC and Normal. (H) The expression of POP1 in BC and Normal. *p < .05, **p < .01, ***p < .001.
Furthermore, we also utilized the Spearman method to analyze the correlation of these 8 genes in breast cancer patients. From the results, significant correlations among these 8 genes can be observed (Figure 6). Specifically, IFNG shows a significant positive correlation with MAP2K6, POP1, MZB1, PCSK9, and IGF2BP1, while exhibiting a significant negative correlation with PCSK6 and ELOVL2. Additionally, PCSK9 is significantly correlated only with MAP2K6, IFNG, and IGF2BP1. Based on these results, it can be further hypothesized that there may be a regulatory system involving these 8 genes, influencing the occurrence and development of breast cancer tumors. Therefore, it is possible to construct a prognostic feature model that takes into account the collective action of these 8 genes.
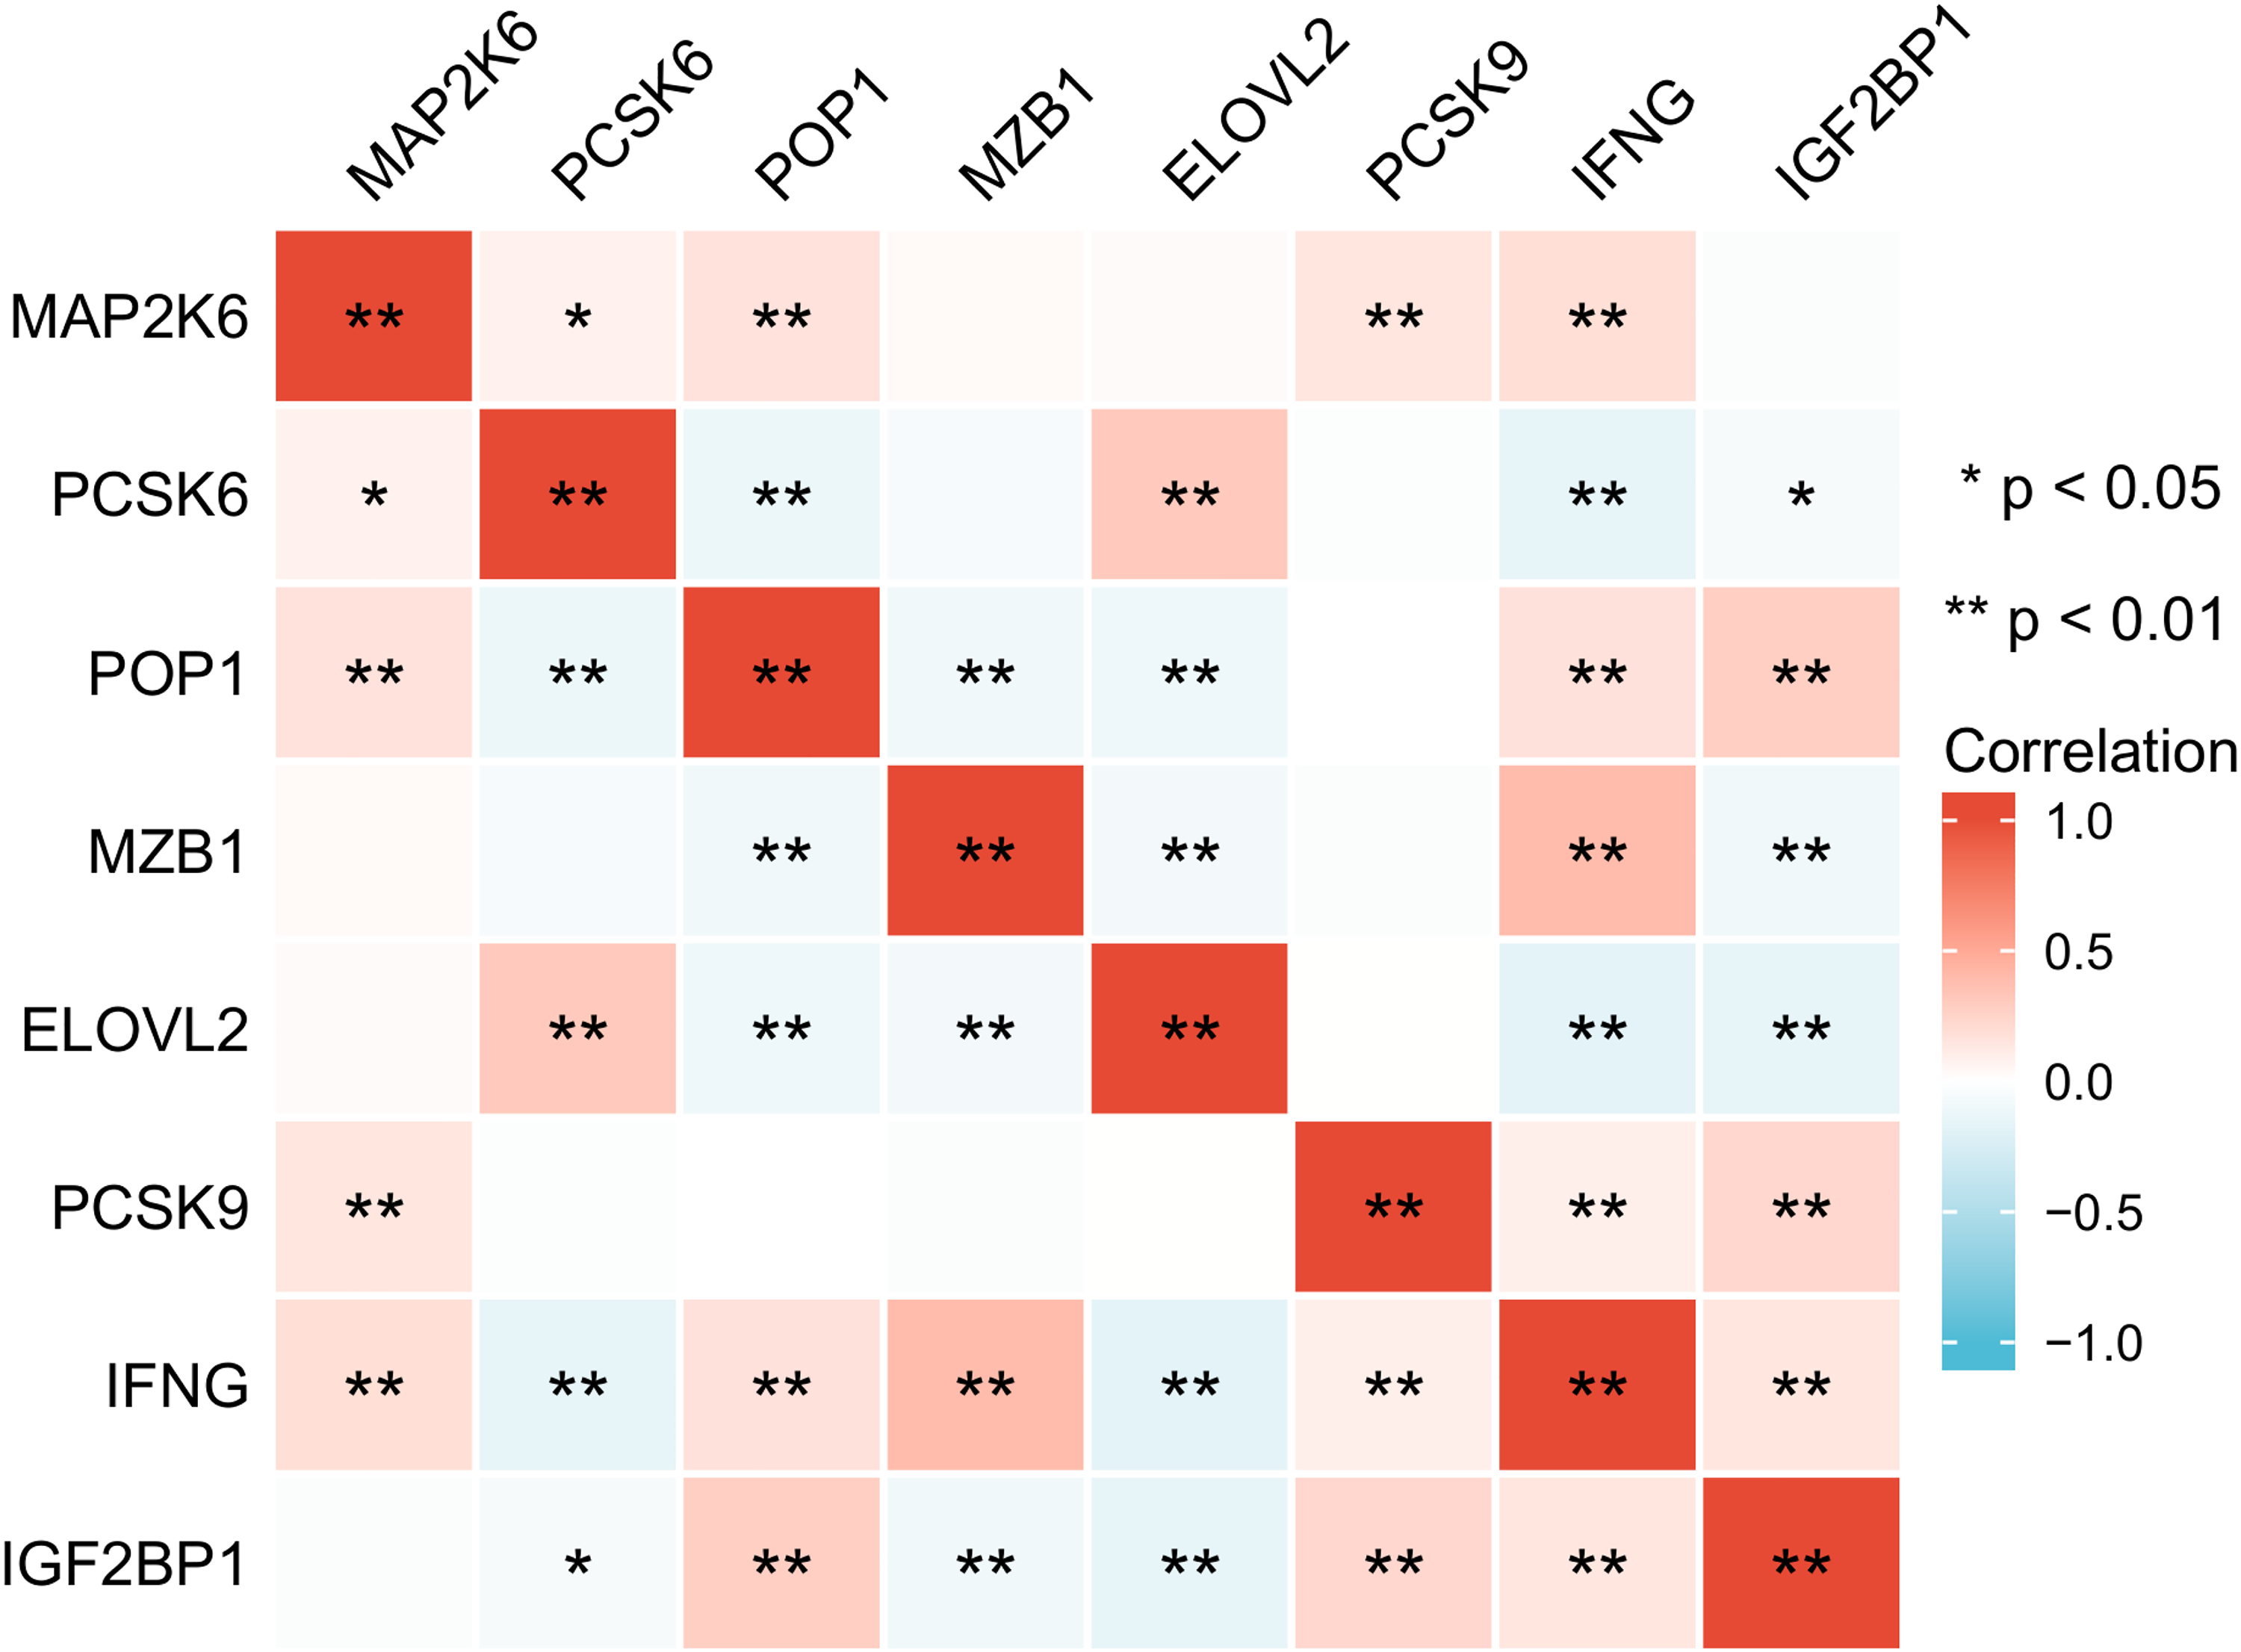
The correlation analysis of the 8 genes in BC. *p < .05, **p < .01, ***p < .001.
Construction and Validation of Prognostic Characteristic of 8 ERS-Related Genes
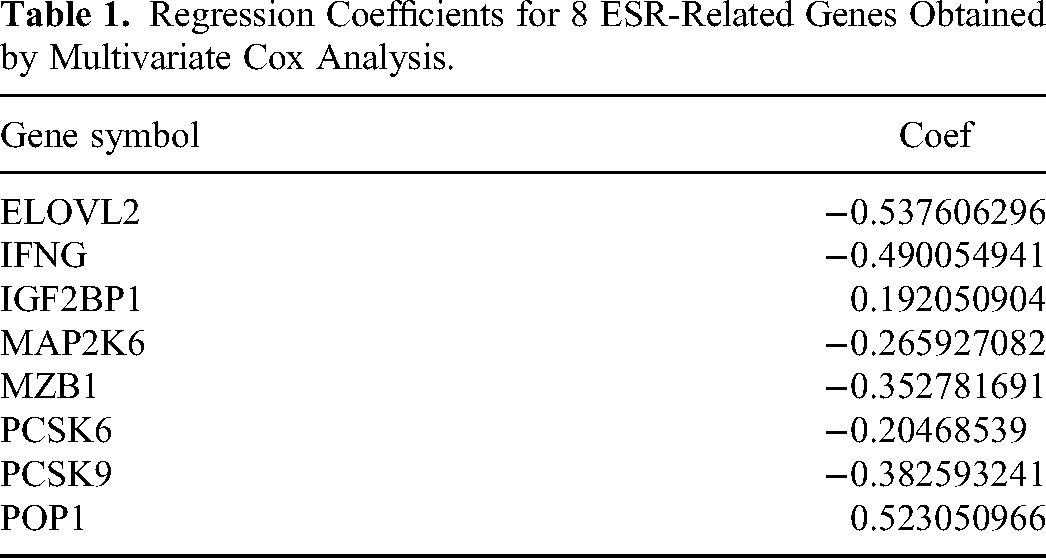
First of all, we performed multivariate regression analysis on 8 genes to access the regression coefficient of the multivariate model (Table 1). The risk score of each BC patient were calculated based on the expression levels of 8 genes in BC and the correlation coefficient obtained by multivariate Cox regression analysis. The risk score was calculated as follows: risk score = (-0.5376 × ELOVL2 expression) + (-0.4901 × IFNG expression) + (0.1921 × IGF2BP1 expression) + (-0.2659 × MAP2K6 expression) + (-0.3528 × MZB1 expression) + (-0.2047 × PCSK6 expression) + (-0.3826 × PCSK9 expression) + (0.5231 × POP1 expression).
Then patients were divided into high-risk group and low-risk group by using the median of risk score as the threshold. The Kaplan–Meier survival curve showed that there was a statistically significant difference in OS between the two groups in the training set (p < .05). And the patients with high-risk of BC had significantly lower survival rates than patients with low-risk of BC (Figure 7A). It initially reflected the predictive value of the model for the prognosis of BC patients. We also plotted the risk factor map based on the risk scores and survival times of each BC patient when the 8 genes working together (Figure 7B). Meanwhile, to further verify the accuracy of the new prognostic model, the timeROC curve was plotted. It was found that the AUC values of 2-year, 4-year, and 6-year were greater than 0.65 (Figure 7C), which illustrated the accuracy of the prognostic model.
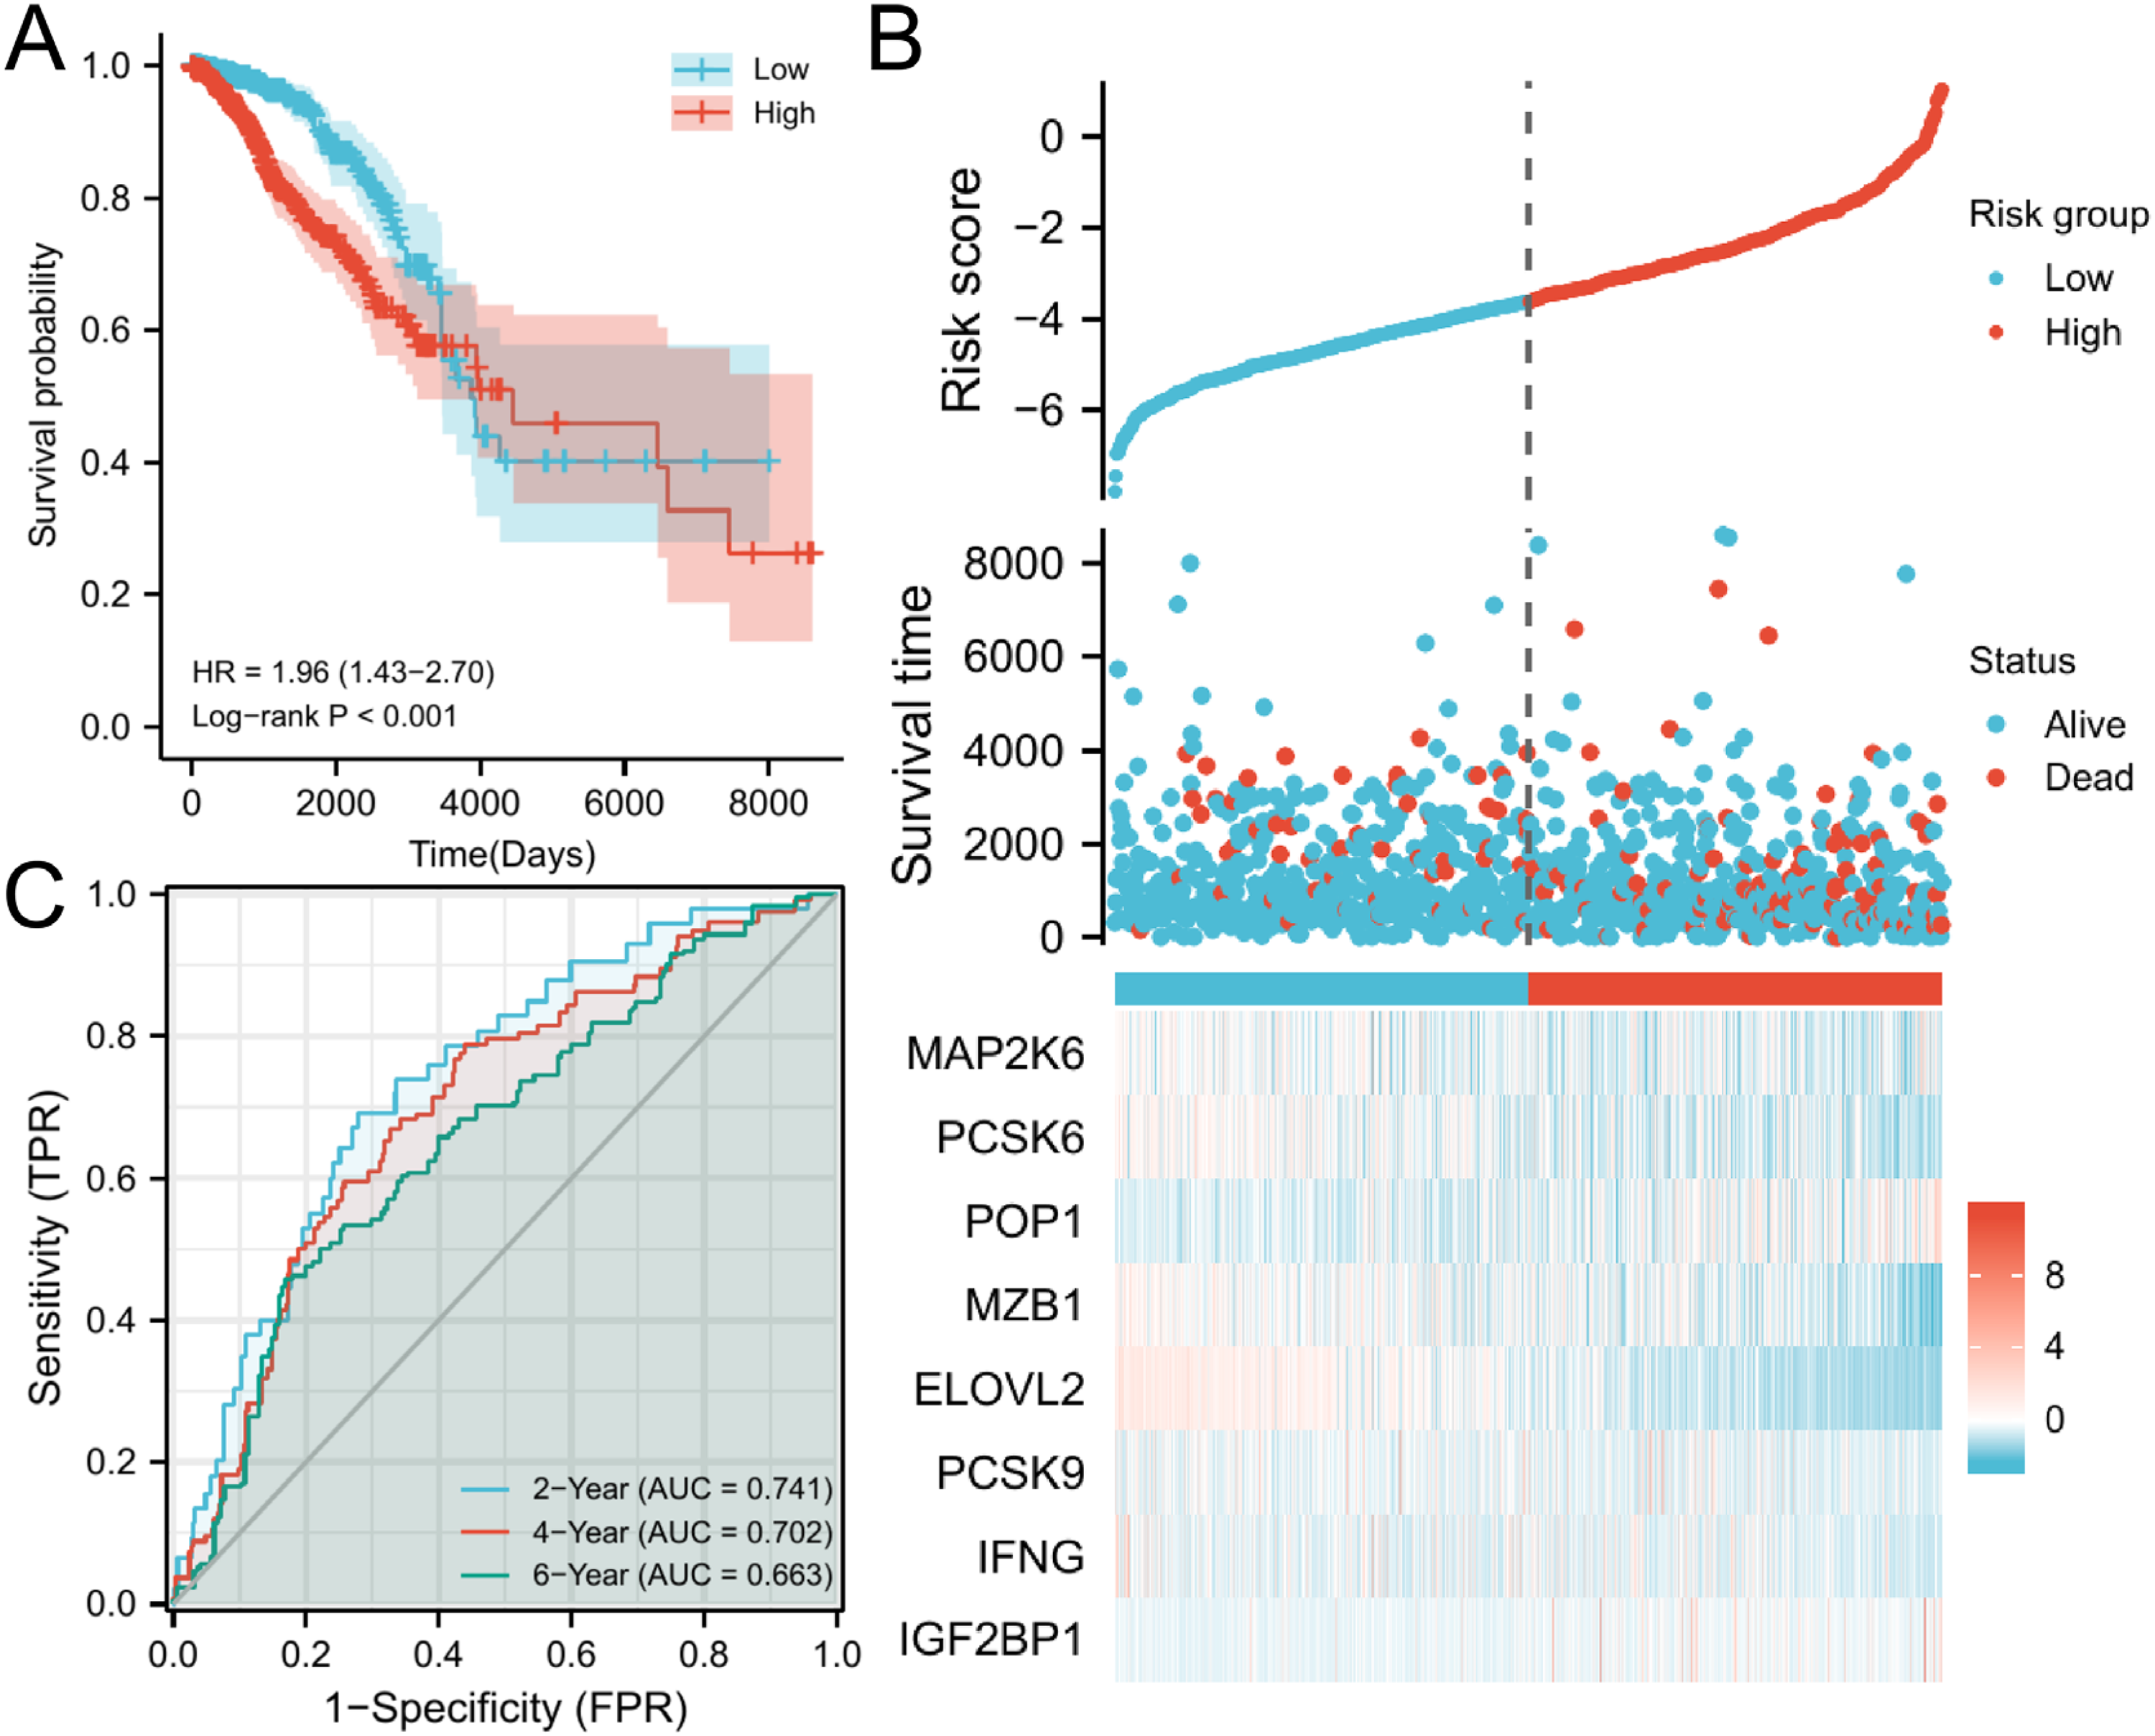
The construction of training set model. (A) The survival analysis of high-risk group and low-risk group. (B) Risk score distribution for each BC patient. (C) The timeROC curve of 2-year, 4-year, and 6-year.
To further validate the model, the three datasets of GSE20685, GSE20711, and GSE103091 were accessed from GEO database as the validation set for our study. Since the three datasets originated from different sequencing platforms, there was a batch effect if the three datasets were combined (Figure 8A and B). First of all, the debatching effect was conducted on the three datasets by using R package “sva” and “tinyarray” (Figure 8C and D). Then the three datasets were combined. Repeating the steps for the training set above to plot the Kaplan–Meier OS curve, risk factor map, and the timeROC curve. The results showed that the survival rate of BC patients in the high-risk group was significantly lower than that of BC patients in the low-risk group (Figure 8E). The risk score distribution of each BC patient when 8 working together is shown in Figure 10F. And the AUC values of 2-year, 4-year, and 6-year were greater than 0.6 (Figure 8G). All of the above results were consistent with those obtained from the training set. It further confirmed the predictive value of the model for the prognosis of breast cancer patients.

The construction of validate set model. (A-B) The PCA maps of GSE20685, GSE20711 and GSE103091 before debatch effect. (C-D) The PCA maps of GSE20685, GSE20711 and GSE103091 after debatch effect. (E) The survival analysis of high-risk group and low-risk group. (F) Risk score distribution for each BC patient. (G) The timeROC curve of 2-year, 4-year, and 6-year.
The Establishment of the Nomogram
To further assess the accuracy of the risk prognosis model for BRCA patients at 2, 4, and 6 years, a nomogram predicting the OS rates of breast cancer patients at 2, 4, and 6 years was established by integrating clinical and pathological features of BRCA patients (Figure 9A). Additionally, we selected a random breast cancer patient for calibration prognosis analysis, with 300 samples in each group and 200 replicates. The bootstrap method was employed during the analysis (Figure 9B–D). Based on the results of the calibration prognosis analysis, the closer the results are to the diagonal, the more accurate the prognosis. Therefore, the nomogram demonstrates strong accuracy in predicting the prognosis of BRCA patients at 2, 4, and 6 years, especially exhibiting excellent prognostic reference value at 6 years (Figure 9D).

The construction of nomogram. (A) The nomogram of BC based on the risk score and clinicopathological features. (B) The calibration of BC patients-2 year. (C) The calibration of BC patients-4 year. (D) The calibration of BC patients-6 year.
The Construction of Diagnostic Models
To assess the potential of these 8 genes as molecular diagnostic markers for breast cancer, a diagnostic model was constructed using logistic regression. The training results of the model showed a training set loss of 0.27 (Figure 10A), an accuracy of 0.88 (Figure 10B), an F1 value of 0.93 (Figure 10C), a precision of 0.92 (Figure 10D), a recall of 0.93 (Figure 10E), and a training set AUC value of 0.94 (Figure 10F). Upon testing, the diagnostic model exhibited an AUC value of 0.96 for the test set (Figure 11).

Indicators of the trained model. (A) the loss of the training set. (B) the accuracy of the training set. (C) the value of F1 of training set. (D) the precision of the training set. (E) the recall of the training set. (F) the ROC curve of training set.

The ROC curve for testing the diagnostic model.
The Identification of the Breast Cancer Tumor Subtypes
By utilizing the consensus algorithm, subtyping of 1109 BRCA patients was performed based on the expression profiles of 8 genes in BRCA patients (Figure 12A). The PAC algorithm was used to select the optimal K value as 2, and in combination with the consensus results, it can be concluded that there are significant differences and clustering stability between the two subtypes of BRCA when k = 2 (Figure 12B–E). Therefore, we divided the 1109 BRCA tumor samples into 2 tumor subtypes.

Unsupervised clustering. (A) consensus matrix. (B) cluster-consensus. (C) delta area. (D) consensus CDF. (E) consensus matrix – k = 2, light blue is subtype 1 and dark blue is subtype 2.
Based on the gene expression profiles of the two BRCA subtypes, t-SNE clustering was performed. According to the t-SNE clustering results, these two subtypes demonstrated strong independence, and the clustering effect was excellent (Figure 13A). Among them, 523 samples were identified as having BRCA subtype 1, and 554 samples were identified as having BRCA subtype 2. Subsequently, survival analysis was conducted on these two BRCA subtypes by combining the survival data of BRCA patients (Figure 13B). From the analysis results, it can be observed that compared to subtype 1, subtype 2 had a poorer prognosis. Additionally, the expression levels of the 8 hub genes were compared between subtype 1 and subtype 2. The analysis results revealed that these 8 hub genes exhibited stable expression in both subtypes, with ELOVL2 and PCSK6 significantly upregulated in subtype 1, and IFNG, IGF2BP1, MZB1, and POP1 significantly upregulated in subtype 2.

In-depth analysis of BRCA subtypes. (A) t-SNE analysis of the BRCA subtypes. (B) KM subtype curve. (C) comparison of the expression levels of ELOVL2 between the two subtypes of BRCA. (D) comparison of the expression levels of IFNG between the two subtypes of BRCA. (E) comparison of the expression levels of IGF2BP1 between the two subtypes of BRCA. (F) comparison of the expression levels of MAP2K6 between the two subtypes of BRCA. (G) comparison of the expression levels of MZB1 between the two subtypes of BRCA. (H) comparison of the expression levels of PCSK6 between the two subtypes of BRCA. (I) comparison of the expression levels of PCSK9 between the two subtypes of BRCA. (J) comparison of the expression levels of POP1 between the two subtypes of BRCA. *p < .05, **p < .01, ***p < .001, ns: not significant.
Comprehensive Analysis of Immune Infiltration
To explore the role of these 8 genes in the immune microenvironment, a comprehensive analysis of immune infiltration was conducted. Initially, using the estimate package, the correlation between immune score and stromal score with these 8 genes was analyzed through the estimate algorithm. The results revealed that 5 genes (IFNG, IGF2BP1, MAP2K6, MZB1, PCSK9) exhibited a significant positive correlation with immune score (Figure 14A, C, F–G, K). Conversely, 2 genes showed a significant negative correlation with immune score (Figure 14I and M). Additionally, 6 genes (IFNG, IGF2BP1, MAP2K6, MZB1, PCSK6, PCSK9) displayed a significant positive correlation with stromal score (Figure 14B, D–E, H, J, L), while POP1 exhibited a significant negative correlation with stromal score (Figure 14N).

The correlation analysis. (A) Correlation of immune score and IFNG. (B) Correlation of stromal score and IFNG. (C) Correlation of immune score and IGF2BP1. (D) Correlation of stromal score and IGF2BP1. (E) Correlation of stromal score and MAP2K6. (F) Correlation of immune score and MAP2K6. (G) Correlation of immune score and MZB1. (H) Correlation of stromal score and MZB1. (I) Correlation of immune score and PCSK6. (J) Correlation of stromal score and PCSK6. (K) Correlation of immune score and PCSK9. (L) Correlation of stromal score and PCSK9. (M) Correlation of immune score and ELOVL2. (N) Correlation of stromal score and POP1.
To explore whether there is a potential association between immune cells and the 8 hub genes, the correlation between immune cells and these 8 genes was analyzed. The results indicated that MAP2K6, MZB1, and IFNG showed significant positive correlations with most immune cells. However, MAP2K6 displayed a significant negative correlation with NK CD56bright cells, MZB1 exhibited a significant negative correlation with Tgd cells, and IFNG showed a significant negative correlation with NK cells. Additionally, PCSK6 and ELOVL2 were significantly negatively correlated with most immune cells (Figure 15). In summary, the 8 hub genes play a crucial role in the regulation of the immune microenvironment in BRCA patients. The correlation analysis between immune-related factors and the 8 genes was performed. The results showed that MAP2K6, MZB1, and IFNG exhibited significant positive correlations with most immune activating factors, immune chemokines, immune chemokine receptors, and immunosuppressive factors (Figure 16A–D). On the other hand, PCSK6 and ELOVL2 displayed significant negative correlations with most immune activating factors, immune chemokines, immune chemokine receptors, and immunosuppressive factors (Figure 16A–D).
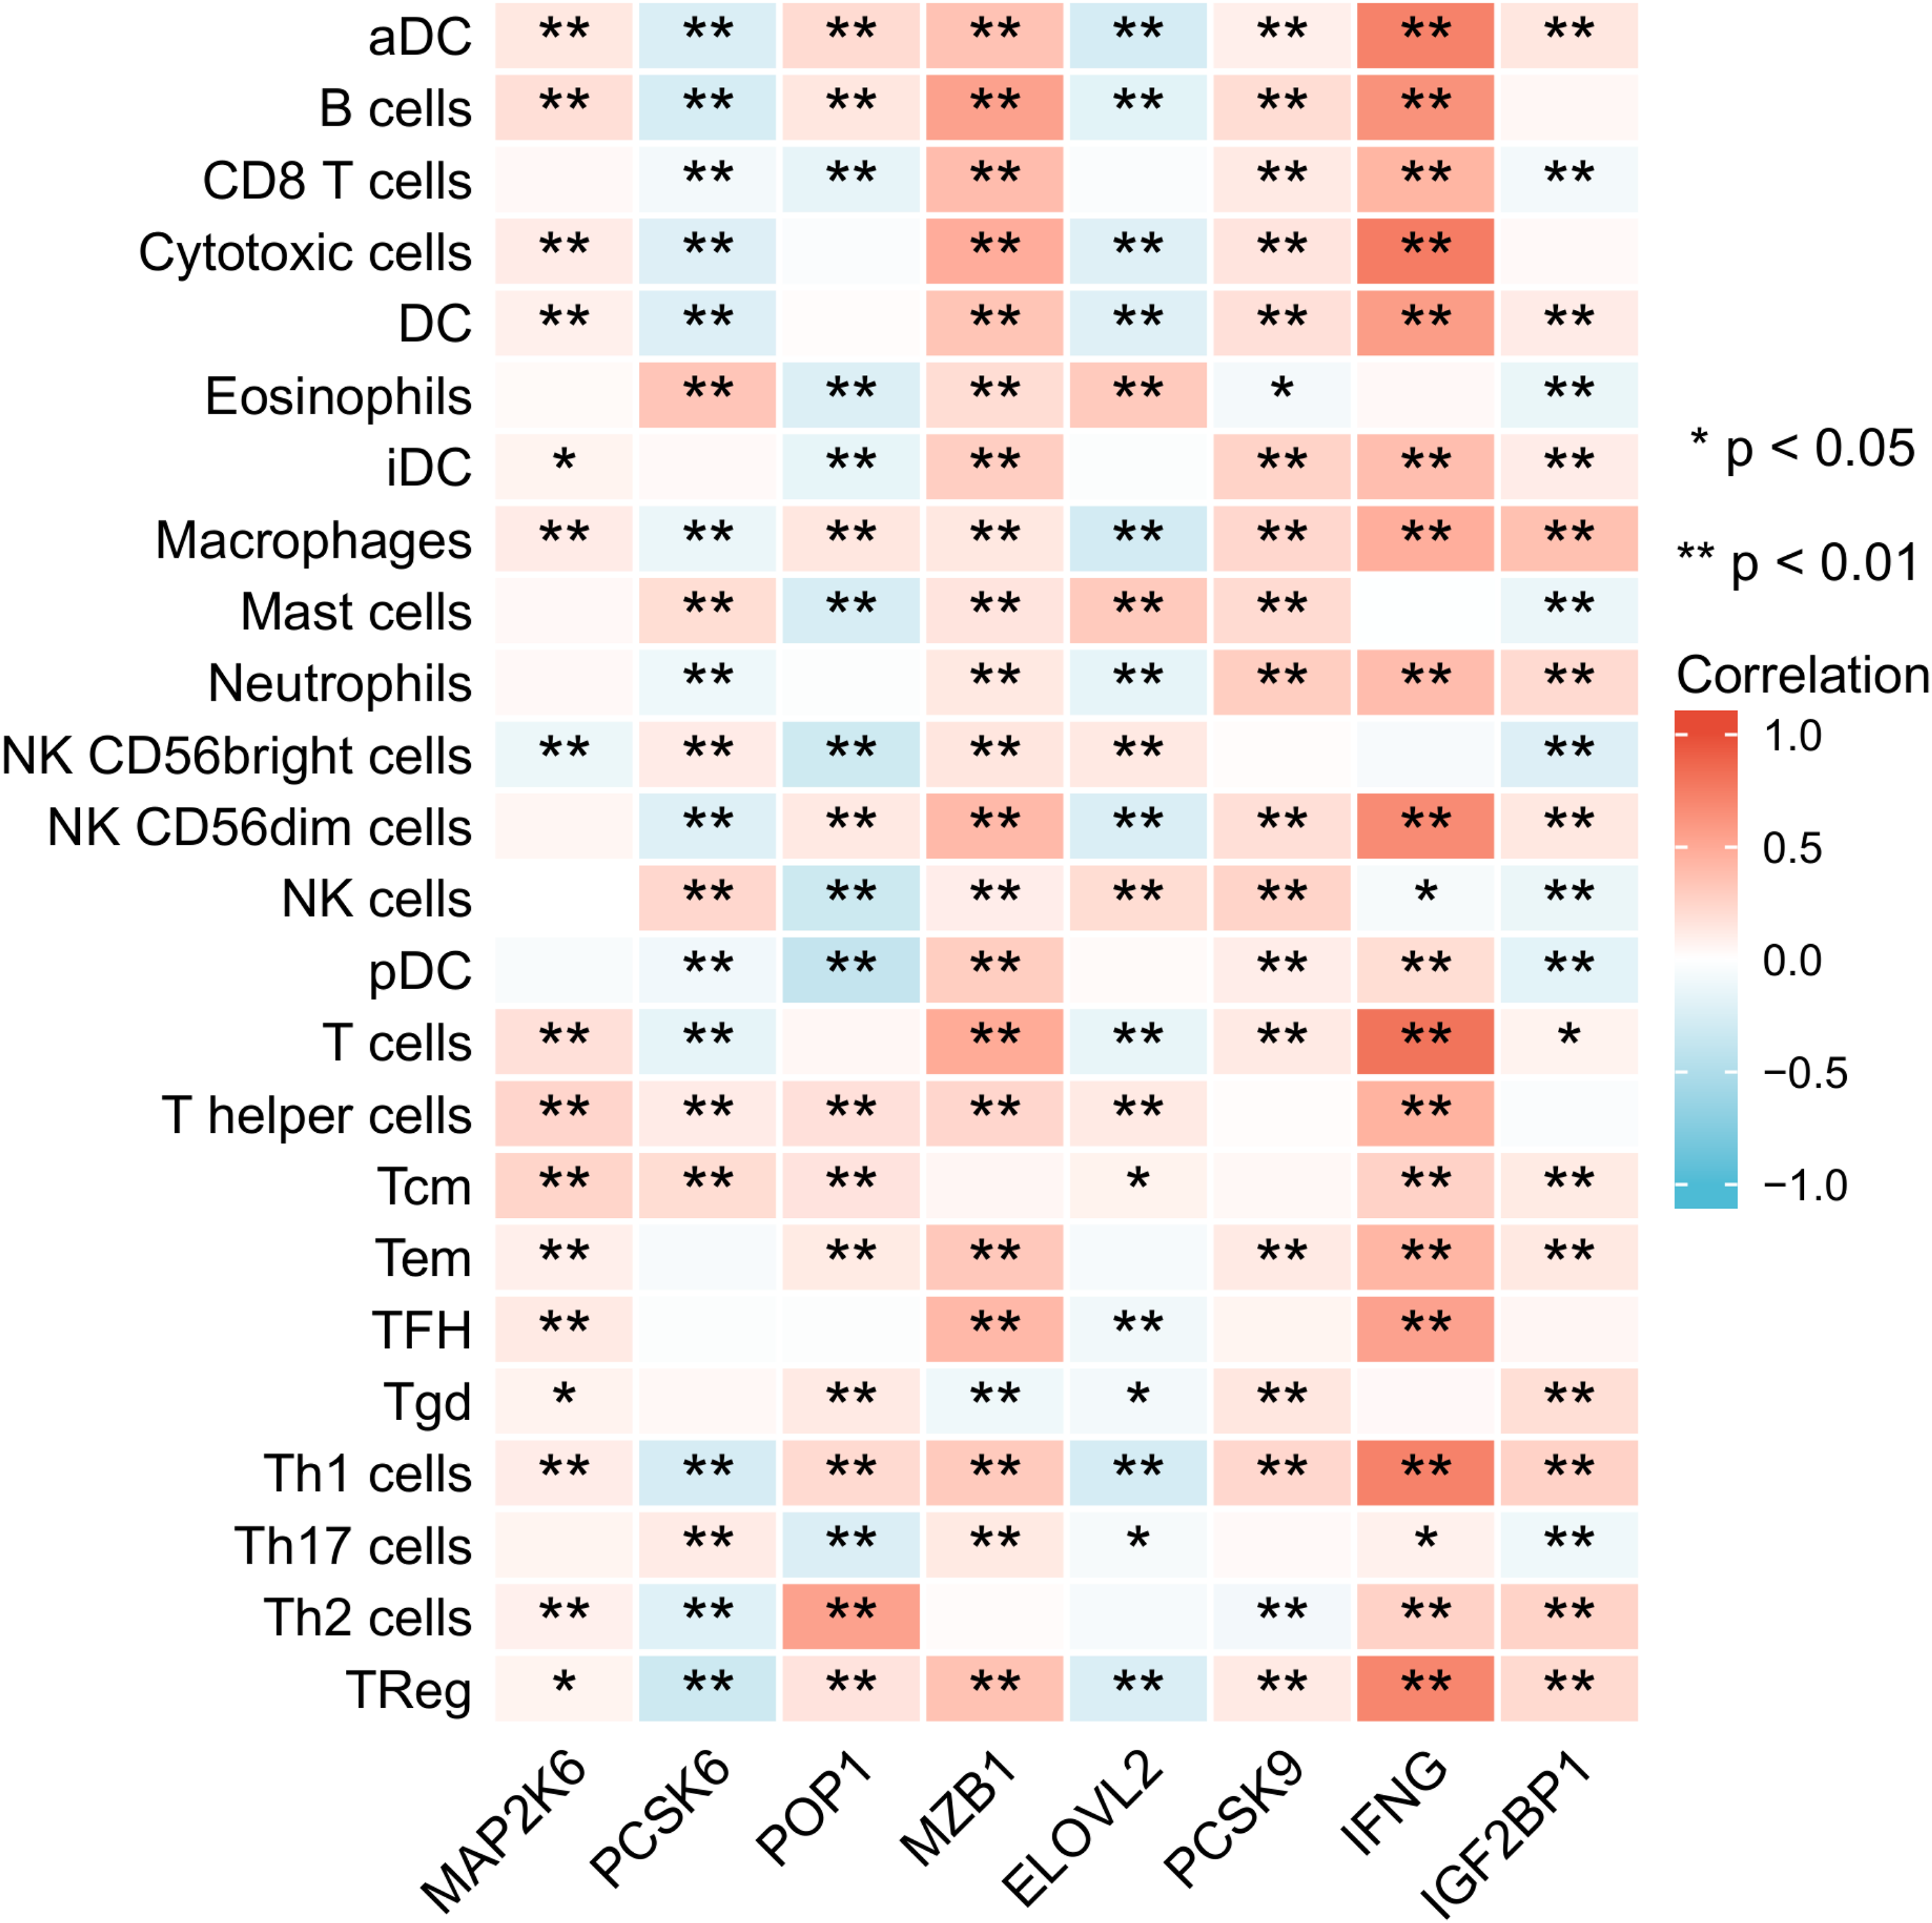
The correlation between immune cells and 8 genes. *p < .05, **p < .01, ***p < .001.

The correlation between immune-related factors and the 8 genes. (A) The correlation between immune activating factors and the 8 genes. (B) The correlation between immune chemokine receptors and the 8 genes. (C) The correlation between immune chemokine and the 8 genes. (D) The correlation between immunosuppressive factors and the 8 genes. *p < .05, **p < .01, ***p < .001.
Protein Level Analysis
In order to explore the interaction mechanism of the 8 genes and to understand whether the 8 genes could be used as the immunotherapy target, the position of the 8 genes in subcells and the level of protein expression in BC cells were analyzed. It was found that ELOVL2 was mainly distributed in the endoplasmic reticulum (Figure 17A); IFNG was mainly distributed in extracellular (Figure 17B); IGF2BP1 and MAP2K6 were mainly located in the nucleus and cytosol (Figure 17C and D); MZB1 was mainly located in the endoplasmic reticulum and extracellular (Figure 17E); PCSK6 was mainly distributed in the golgi apparatus, endoplasmic reticulum and extracellular (Figure 17F); PCSK9 was mainly located in the golgi apparatus, lysosme, endosome, endoplasmic reticulum, extracellular, and plasma membrane (Figure 17G); POP1 was mainly located in the nucleus (Figure 17H).

The location of the 8 genes in the subcells. (A) The location of ELOVL2 in the subcells. (B) The location of IFNG in the subcells. (C) The location of IGF2BP1 in the subcells. (D) The location of MAP2K6 in the subcells. (E) The location of MZB1 in the subcells. (F) The location of PCSK6 in the subcells. (G) The location of PCSK9 in the subcells. (H) The location of POP1 in the subcells.
Concurrently, we also conducted an immunohistochemical analysis. However, the immunohistochemical data of only 4 genes were obtained from the HPA database: IFNG, IGF2BP1, MAP2K6, and PCSK6 (Figure 18). It was found that when the malignancy of the tumor is low, corresponding gene-encoded proteins of IFNG, IGF2BP1, MAP2K6, and PCSK6 can be detected in BC cells. Meanwhile, when the malignancy is moderate, corresponding gene-encoded proteins of MAP2K6 and PCSK6 can be detected in BC cells. Additionally, immunohistochemical analysis reveals that IFNG, IGF2BP1, and PCSK6 are highly expressed in BRCA patients, while MAP2K6 is lowly expressed.

Immunohistochemical analysis. Four genes showed low immunohistochemical analysis intensity in BRCA tumors, while MAP2K6 and PCSK6 exhibited moderate immunohistochemical analysis intensity in BRCA tumors. Among them, the moderate immunohistochemical analysis intensity in BRCA tumors was observed in the last group of MAP2K6 and PCSK6.
Drug Sensitivity Analysis
Drug sensitivity analysis was conducted on these 8 genes to identify target drugs for the treatment of BRCA patients. By analyzing the correlation between the 8 genes and drugs, the top 16 drugs with the strongest correlation were selected: Zalcitabine, Fluphenazine, Nelarabine, XK − 469, Methylprednisolone, Carmustine, Nelarabine, Imexon, Ifosfamide, Irofulven, Etoposide, rifa, Chlorambucil, Bendamustine, Hydroxyurea, Hydroxychloroquine Sulfate. In particular, Zalcitabine showed a significant high positive correlation with MZB1 (Cor = 0.731) (p < .001) (Figure 19).
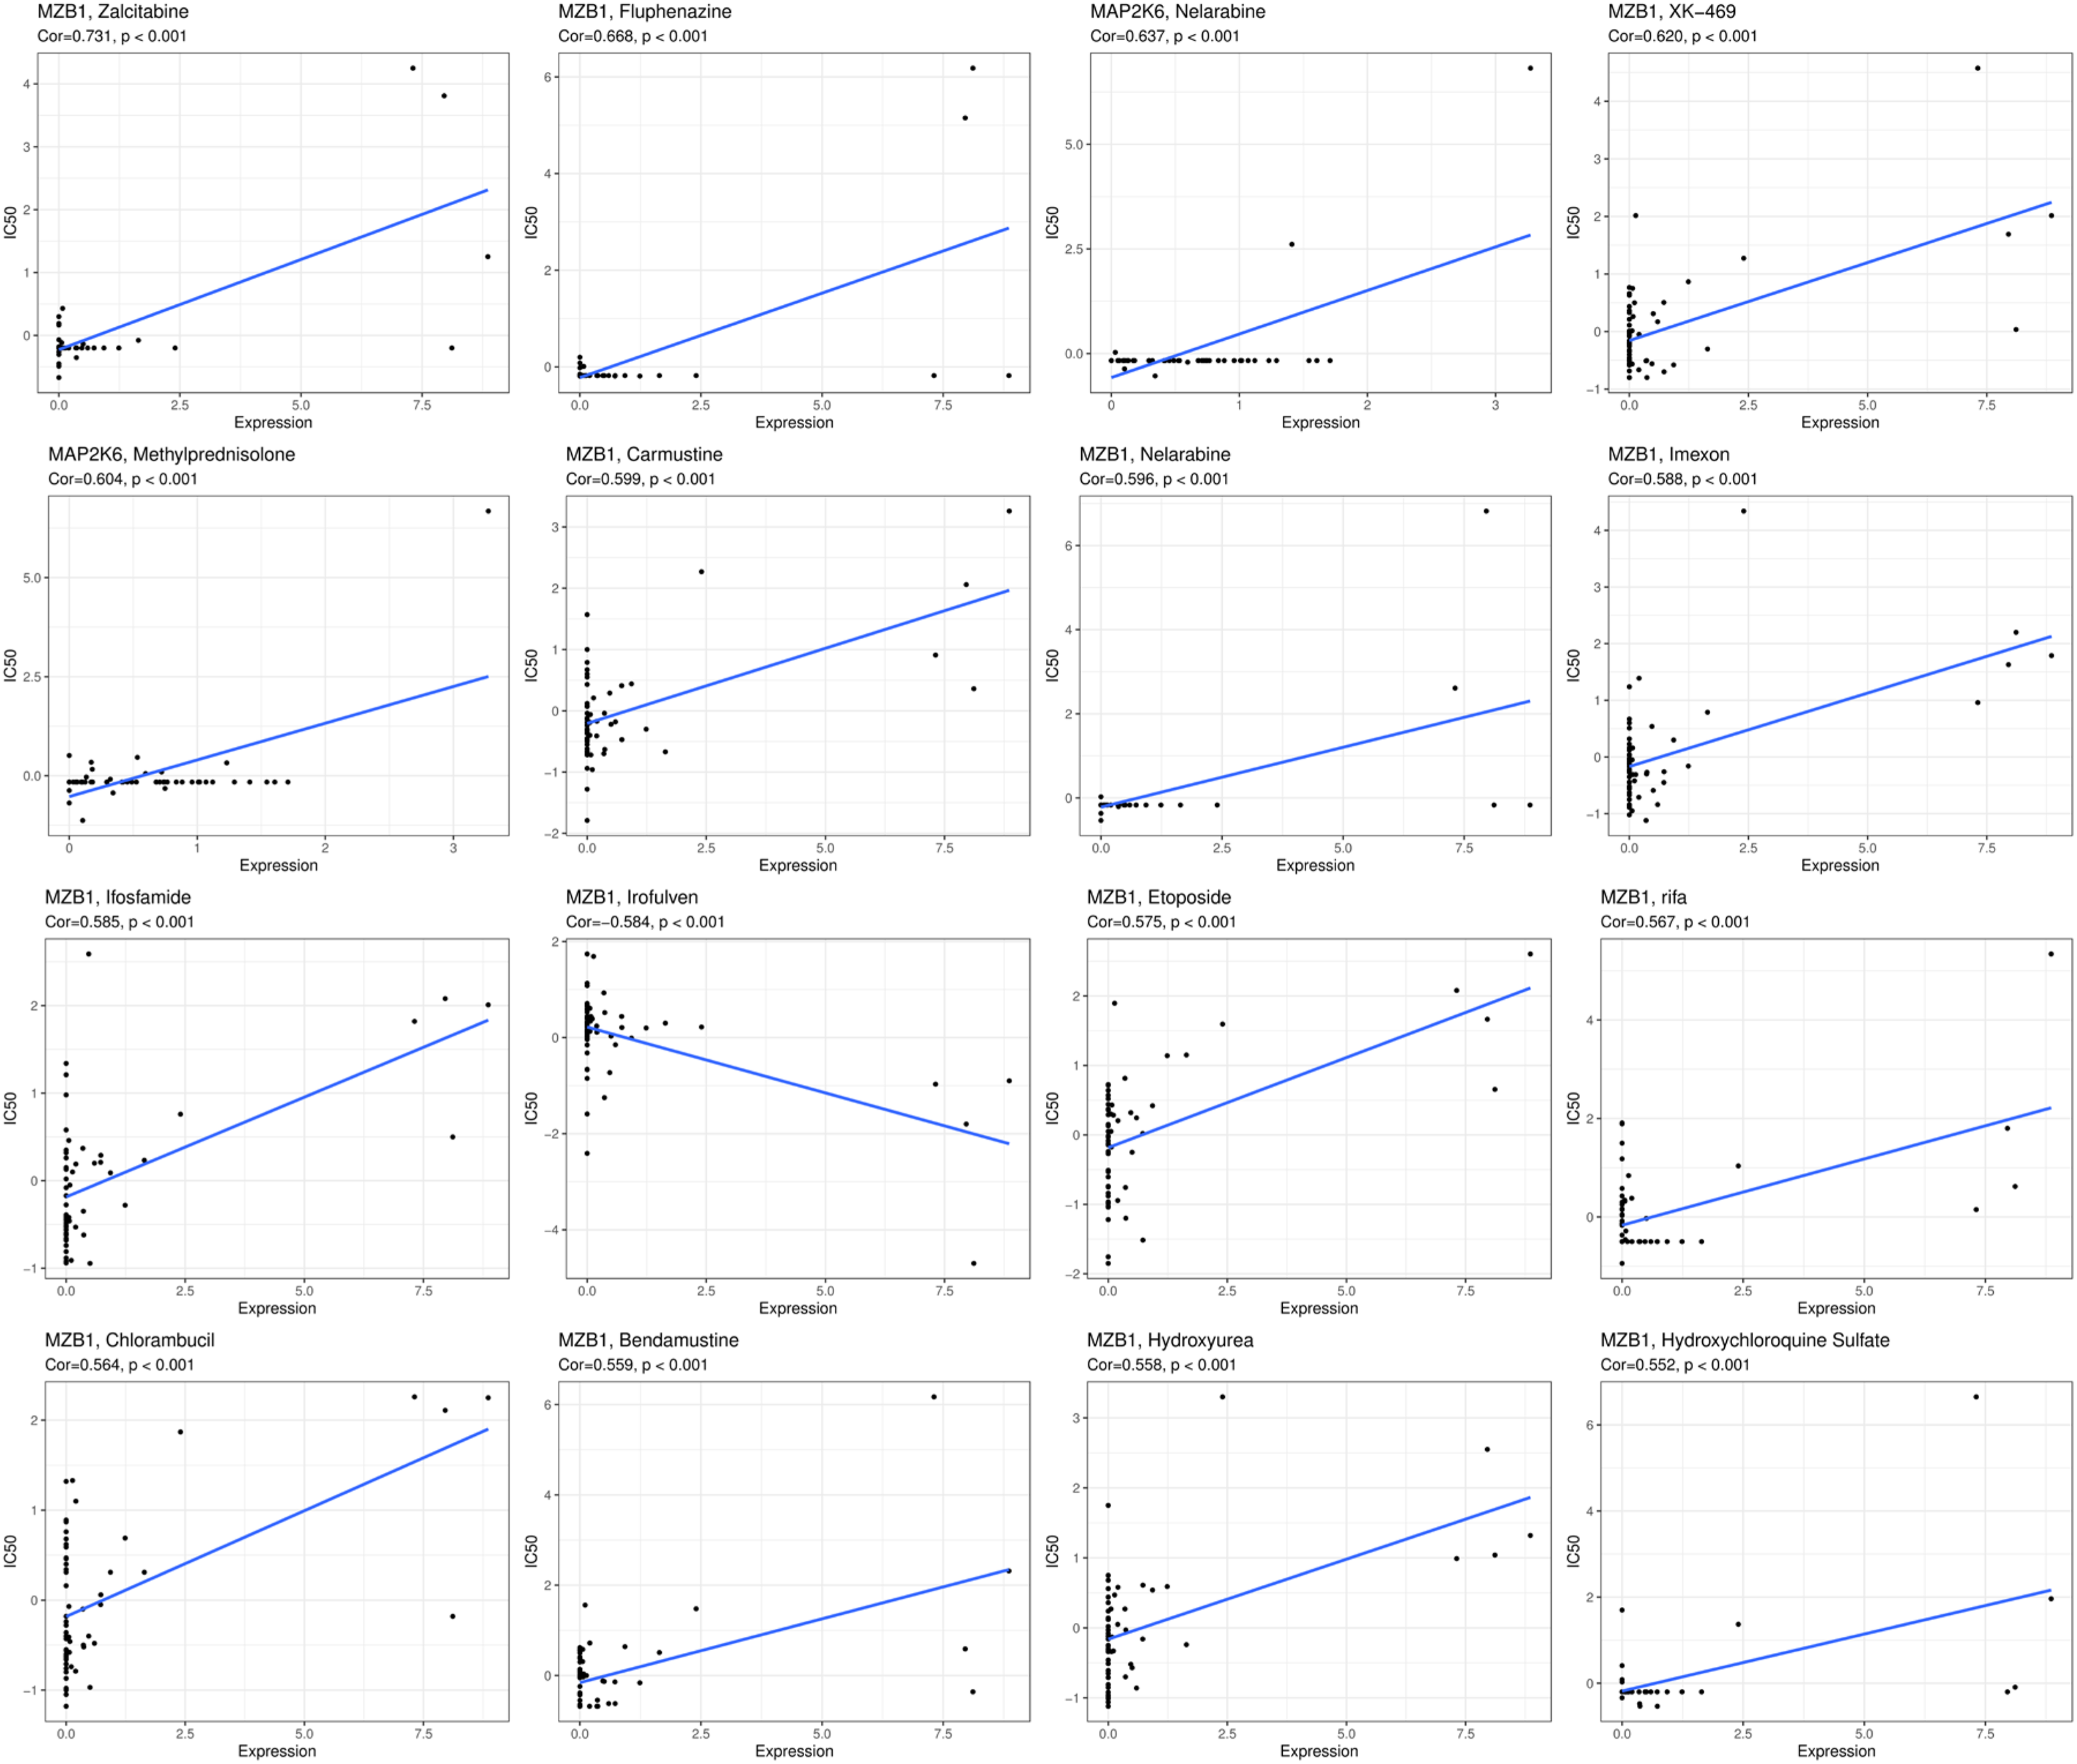
Scatter plot of the correlation between drug IC50 values and the expression levels.
In addition, we conducted intergroup comparisons of the differences in 16 drugs when 8 genes were overexpressed or underexpressed. It was found that Ifosfamide, Etoposide, Bendamustine, and Hydroxyurea exhibited significantly higher IC50 values when MZB1 was overexpressed compared to when MZB1 was underexpressed (p < .05) (Figure 20). This indicated that MZB1 overexpression was associated with drug resistance.

Differential analysis of IC50 values for 16 drugs.
Quantitative Real-Time PCR Experiment
To investigate whether the expression of IFNG and IGF2BP1 genes in breast cancer patients was consistent with our research findings, we performed qPCR experiments on 14 breast cancer patients and 5 normal individuals. According to the experimental results, both IFNG and IGF2BP1 were significantly upregulated in breast cancer patients compared to the normal individuals (Figure 21A and B). The experimental results were consistent with the findings of our study.

qPCR experimental results. (A) The differential analysis of IFNG in 14 breast cancer samples and 5 normal samples. (B) The differential analysis of IGF2BP1 in 14 breast cancer samples and 5 normal samples.
Discussion
There is evidence to suggest that ERS in tumor cells can impact tumor immunity, aiding tumor cells in evading immune surveillance and promoting metastasis. 35 Therefore, a specific intensity of ERS promotes multiple mechanisms of cancer progression. 36 ERS can induce the release of unknown factors from tumor cells, prompting macrophages to undergo ER stress and subsequently release pro-inflammatory factors in the immune microenvironment. 37 Additionally, these unknown factors also stimulate bone marrow-derived dendritic cells to release immunosuppressive factors such as Arginase, which inhibit the antigen presentation capability of CD8 + T cells. 38 Specifically, ER stress in breast cancer tumor cells can upregulate the content of miR-27a-3p in exosomes and promote the expression of PD-L1 in macrophages. 31 Although ER stress in breast cancer affects immune cells in the immune microenvironment as described above, the exact processes involved are still not fully understood, warranting further exploration in future studies.
From the results of the enrichment analysis, we found that ERS occurs within the endoplasmic reticulum, is involved in protein folding and transport within the endoplasmic reticulum, and has a key role mainly in the pathway of PD-L1 expression and PD-1 checkpoint in cancer, Choline metabolism in cancer and Transcriptional misregulation in cancer.
In this study, we initially obtained 831 ERS genes with a correlation coefficient greater than 7 from the GeneCards database. Intersection analysis between these 831 genes and differentially expressed genes in breast cancer revealed 178 ERS-related genes in breast cancer. To further identify the key ERS-related genes, we performed LASSO regression analysis and selected 27 hub genes from the initial set of 178 ERS-related genes. However, only 8 genes showed statistically significant associations with OS in the subsequent survival analysis: ELOVL2, IFNG, IGF2BP1, MAP2K6, MZB1, PCSK6, PCSK9, and POP1. The expression levels of ELOVL2, IFNG, MAP2K6, MZB1, PCSK6, and PCSK9 were positively correlated with favorable prognosis, while the expression levels of IGF2BP1 and POP1 were negatively correlated with favorable prognosis. Despite the significant correlations observed among these 8 genes, their individual predictive accuracy for prognosis in breast cancer patients was not high. Therefore, we constructed a prognostic model based on the risk scores derived from multivariate Cox regression analysis, considering the combined effects of these 8 genes in breast cancer patients. The accuracy of the prognostic model was evaluated using ROC curves, and the prediction accuracy at 2, 4, and 6 years was consistently higher than 0.65. Furthermore, to validate the prognostic performance of the model, we obtained three datasets from the GEO database, merged them into a single dataset after removing batch effects, and used it as a test set for the model. The ROC curves of the test set also showed prediction accuracy higher than 0.6 at 2, 4, and 6 years, further confirming the good prognostic performance of the model for breast cancer patients. In addition, this study also classified 1109 BRCA tumor samples into two subtypes based on the expression profiles of these eight genes in BRCA patients, making the clinical treatment of BRCA patients more targeted. Furthermore, drug sensitivity analysis was performed on these eight genes, leading to the identification of 16 new drugs for the clinical treatment of BRCA patients.
Among these 8 ERS-related genes, ELOVL2, IFNG, IGF2BP1, MZB1, PCSK6, PCSK9, and POP1 exhibit significant overexpression in breast cancer patients, while MAP2K6 shows significant underexpression. In addition, ELOVL2 is a tumor suppressor attenuating tamoxifen resistance in breast cancer, 39 IFNG is a driving factor of the association between natural killer cells and clinical response to trastuzumab in patients with HER2-positive primary breast cancer, 40 and IGF2BP1 plays a key role in maintaining the stemness of breast cancer stem cells. 41 The role of MZB1 may be associated with a more advanced stage of BC, 42 PCSK6 may promote the proliferation of breast cancer MDA-MB-231 cells by disturbing cell cycle arrest, 43 PCSK9 associated with many types of cancer is involved in the degradation of the very-low-density-lipoprotein receptor, 44 and POP1 expression was up-regulated in BC and was associated with a poor prognosis. 45 At the same time, MAP2K6 plays a variety of regulatory roles in BC.46,47 Although these 8 genes have been extensively studied for their individual roles in breast cancer, there is still a lack of comprehensive analysis on their collective impact in the immune microenvironment. By investigating the combined effects of these 8 genes in breast cancer patients and exploring their influence on the immune microenvironment, it will contribute to identifying better immunotherapeutic strategies for breast cancer patients.
In order to identify novel biomolecular diagnostic markers for breast cancer patients, this study constructed a molecular diagnostic model based on the expression levels of these 8 genes using machine learning methods. Through training and testing the diagnostic model, it was found that the AUC value of the training set was 0.94, and the AUC value of the ROC curve obtained by the testing set was 0.96. Therefore, the results indicated that the expression differences of these 8 genes between breast cancer patients and normal individuals can easily distinguish between the two groups. This also suggested that these 8 genes can serve as early molecular diagnostic markers for breast cancer patients.
Cytotoxic CD8 + T cells are killer cells in the T lymphocyte population. They support a large amount of cellular immunity, especially in tumor tissues. 48 CD4 + T cells play an important role in the activation and memory of cytotoxic CD8 + T cells. 49 Through immune infiltration analysis of these 8 ERS-related genes, it was found that the expression of MZB1 and IFNG was positively correlated with CD8 + T cells, T cells, and natural killer cells. This finding may explain the protective role of MZB1 and IFNG in breast cancer patients. We also noted that these two genes were positively correlated with most immune cells, immune activating factors, immune chemokine receptors, immune chemokines, and immunosuppressive factors, which suggests that these two genes may serve as new targets for immunotherapy in breast cancer patients.
In order to verify the accuracy of our research results, the qPCR experiment was conducted on IFNG gene and IGF2BP1 gene. The experimental results showed that both IFNG gene and IGF2BP1 gene were significantly overexpressed in breast cancer patients, which was consistent with the conclusion of this study. Therefore, the conclusion of this study was proved.
However, our study still has some limitations. The expression and prognostic predictive effect of these 8 ERS-related genes at the protein level need further evaluation. Additionally, further research is needed to confirm the specific regulatory mechanisms of ERS-related risk markers in breast cancer. Nevertheless, our study still provides important reference value for elucidating the specific role of ERS in breast cancer.
Supplemental Material
sj-docx-1-tct-10.1177_15330338241241484 - Supplemental material for Identification of Breast Cancer Subtypes Based on Endoplasmic Reticulum Stress-Related Genes and Analysis of Prognosis and Immune Microenvironment in Breast Cancer Patients
Supplemental material, sj-docx-1-tct-10.1177_15330338241241484 for Identification of Breast Cancer Subtypes Based on Endoplasmic Reticulum Stress-Related Genes and Analysis of Prognosis and Immune Microenvironment in Breast Cancer Patients by Chen Yi, PhD, Jun Yang, Ting Zhang, Liu Qin, BS, and Dongjuan Chen, PhD in Technology in Cancer Research & Treatment
Footnotes
Acknowledgements
The authors gratefully acknowledge the financial supports from the PhD fellowship of Nanchang Hangkong University (EA202008259), Natural Science Foundation of Hubei Province(2019CFB391).
Authors’ Contributions
Chen Yi performed writing code and study design. Jun Yang collected data. Ting Zhang contributed statistical analysis. Liu Qin searched literature. Dongjuan Chen supervised study design and wrote the manuscript. All authors contributed to the revision of this manuscript.
Availability of Data and Material
The data used to support this study is available from the corresponding author upon request.
Consent for Publication
This manuscript is approved by all authors for publication.
Declaration of Conflicting Interests
The authors declared no potential conflicts of interest with respect to the research, authorship, and/or publication of this article.
Ethics Approval and Consent to Participate
The studies involving humans were approved by the Committee on Human Research of Maternal and Child Health Hospital of Hubei Province (2020IECXM045) on November 30, 2020. All research was performed in accordance with relevant guidelines and regulation.
Funding
The authors disclosed receipt of the following financial support for the research, authorship, and/or publication of this article: This work was supported by the Natural Science Foundation of Hubei Province, The PhD fellowship of Nanchang Hangkong University (grant numbers 2019CFB391, EA202008259)
Supplemental Material
Supplemental material for this article is available online.
References
Supplementary Material
Please find the following supplemental material available below.
For Open Access articles published under a Creative Commons License, all supplemental material carries the same license as the article it is associated with.
For non-Open Access articles published, all supplemental material carries a non-exclusive license, and permission requests for re-use of supplemental material or any part of supplemental material shall be sent directly to the copyright owner as specified in the copyright notice associated with the article.