
Abstract
BACKGROUND:
Although there are many treatments for Multiple myeloma (MM), patients with MM still unable to escape the recurrence and aggravation of the disease.
OBJECTIVE:
We constructed a risk model based on genes closely associated with MM prognosis to predict its prognostic value.
METHODS:
Gene function enrichment and signal pathway enrichment analysis, Least Absolute Shrinkage and Selection Operator (LASSO) regression analysis, univariate and multivariate Cox regression analysis, Kaplan-Meier (KM) survival analysis and Receiver Operating Characteristic (ROC) analysis were used to identify the prognostic gene signature for MM. Finally, the prognostic gene signature was validated using the Gene Expression Omnibus (GEO) database.
RESULTS:
Thirteen prognostic genes were screened by univariate Cox analysis and LASSO regression analysis. Multivariate Cox analysis revealed risk score to be an independent prognostic factor for patients with MM [Hazard Ratio (HR)
CONCLUSIONS:
The potential prognostic signature of thirteen genes were assessed and a risk model was constructed that significantly correlated with prognosis in MM patients.
Introduction
MM is a malignant tumor with abnormal plasma cell proliferation [1]. The main complications of MM were hypercalcemia, renal insufficiency, anemia and bone disease [2]. Around 10% of hematological malignancies are caused by the malignant plasma cell disease known as MM [3]. Global incidence has increased by 126% since 1990 [4], around 10 to 20% of patients experience early death within 2 to 3 years of diagnosis [5]. The median overall survival in MM is rapidly approaching 10 years [6], however, in nearly a fifth of patients the prognosis remains poor [7] and most patients eventually relapse and cannot be cured [8].
Currently, several biomarkers have been used for MM diagnosis and risk stratification of patients. Partial deletion of chromosome 17, which includes the TP53 gene, has been reported to be a high-risk biomarker in MM [9]. The Durie and Salmon System (DSS) uses the immunoglobulin levels, hemoglobin and calcium concentration and the number of bone lesions to predict survival [10]. However, its application is difficult due to inconsistent interpretation of the number of bone lesions [11]. The International Staging System (ISS) is a simple staging method that uses only the prognostic biomarkers albumin and
In this study, a prognostic model of MM patients was established by using bioinformatics analysis method to provide a reference for clinicians to treat MM patients in different risk groups. To explore genes associated with prognosis of MM patients, 843 MM samples and 37 normal bone marrow samples were obtained from the UCSC Xena (
Materials and methods
Data Sources
The RNA-seq data and clinical information of 843 MM patients and 37 bone marrow normal samples for control were downloaded from the University of California Santa Cruz (UCSC) (cohort: GDC MMRF-COMMPASS) and TCGA database, respectively. 15 peripheral blood samples were removed from the GDC MMRF-COMMPASS, while the bone marrow samples were retained. The purpose of downloading the independent datasets (GSE24080) from the GEO database (
Identification of differentially expressed genes
DEGs were identified using the packages of “tidyverse” and “DESeq” in R (version 4.2.1) with criteria of [log2fold-change (log2FC)]
Functional enrichment and signal pathway analysis
The online tool “Metascape” (
Construction of prognostic genes signature
“Tidyverse” and “forestplot” packages were used for univariate Cox analysis and the screening criterion was
ROC analysis
The ROC analysis was performed by R packages “tidyverse”, “ROCR”, and “rms”. The risk score and other clinical indexes correlated with survival were used in multi-index ROC analysis.
Results
Prognostic model construction process and patient characteristics
DEGs were screened from MMRF-COMPASS data, and functional enrichment and signaling pathway analysis of up-regulated and down-regulated genes were performed [19]. LASSO regression analysis was used to identify 13 prognostic genes. Univariate and multivariate Cox analyses demonstrated that risk score was independent prognostic indicator [20], and the GSE24080 dataset was used to validate the prognostic model (Fig. 1).
Characteristics of MM patients in GDC MMRF-COMMPASS
Characteristics of MM patients in GDC MMRF-COMMPASS
A schematic view of the procedure of the model construction.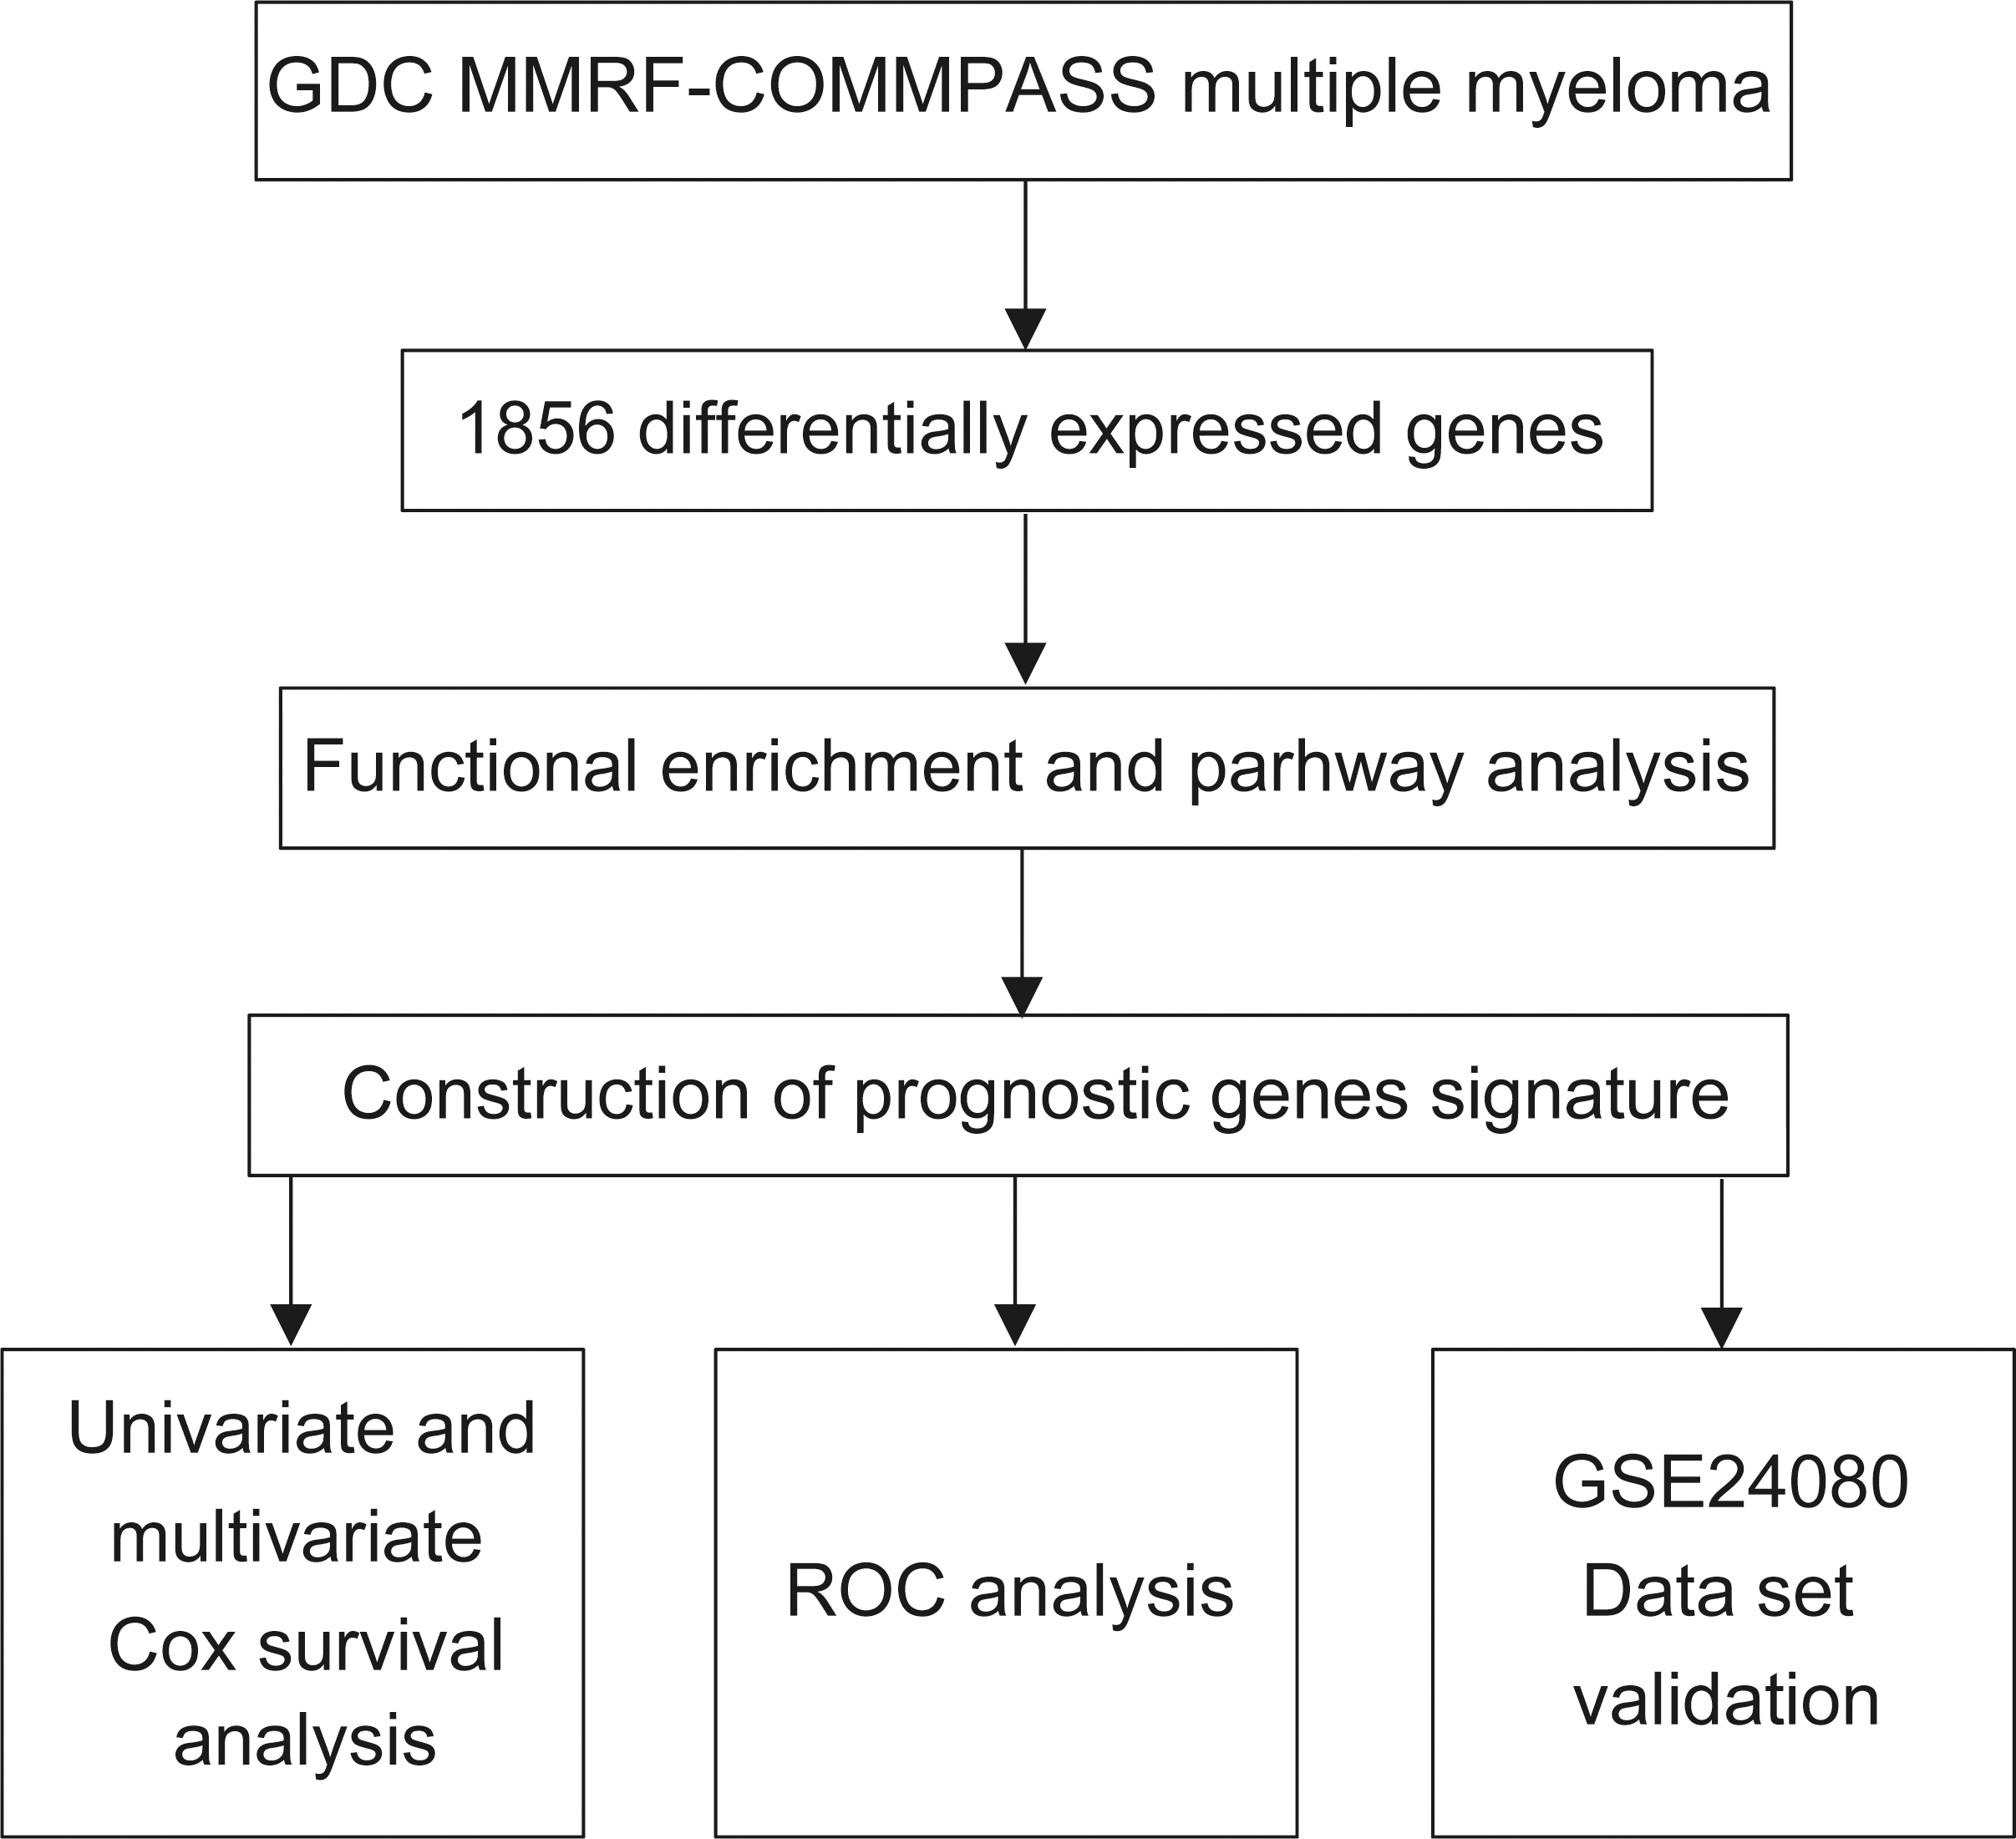
843 patient samples were downloaded from the UCSC xena database, of which 787 had complete clinical information (Table 1). There were 326 female patients (41.42%) and 461 male patients (58.58%). The median age at diagnosis was 63.68 years, with a range of 27.78 to 88.14 years. In this sample of patients, 606 (77%) ultimately survived and 181 (23%) died. There were 260 patients diagnosed with stage I, 287 patients with stage II, and 240 patients with stage III.
Characteristics of MM patients in GSE24080 dataset
The GSE24080 data set contains 558 patient samples (Table 2). The median age of the patients was 58.0 years, with ages ranging from 24.8 to 76.5 years. There were 221 (39.6%) female patients, and the proportion of male patients was higher than that of female patients, with 337 (60.4%) patients. In these samples, survival of patients with 386 (69.2%) cases, 172 (30.8%) cases of patients died. Among them, there were 294 patients (52.7%) in stage I, 144 patients (25.8%) in stage II, and 120 patients (21.5%) in stage III.
Among the 1856 DEGs, 1043 down-regulated genes and 813 up-regulated genes were obtained [21]. These results were presented as a heat map (Fig. 2A) by the “tidyverse” and “pheatmap” packages of R software and the volcano plot (Fig. 2B) is shown by using the “tidyverse”, “ggpubr” and “ggthemes”" package in R [22].
Genes included in prognostic MM genes signature
Genes included in prognostic MM genes signature
Identification of DEGs. (A) Heat map of DEGs in GDC MMRF-COMMPASS dataset. (B) Volcano plot for DEGs (1043 down-regulated genes and 813 up-regulated genes) in GDC MMRF-COMMPASS dataset. Red and blue plots represent genes with adjusted 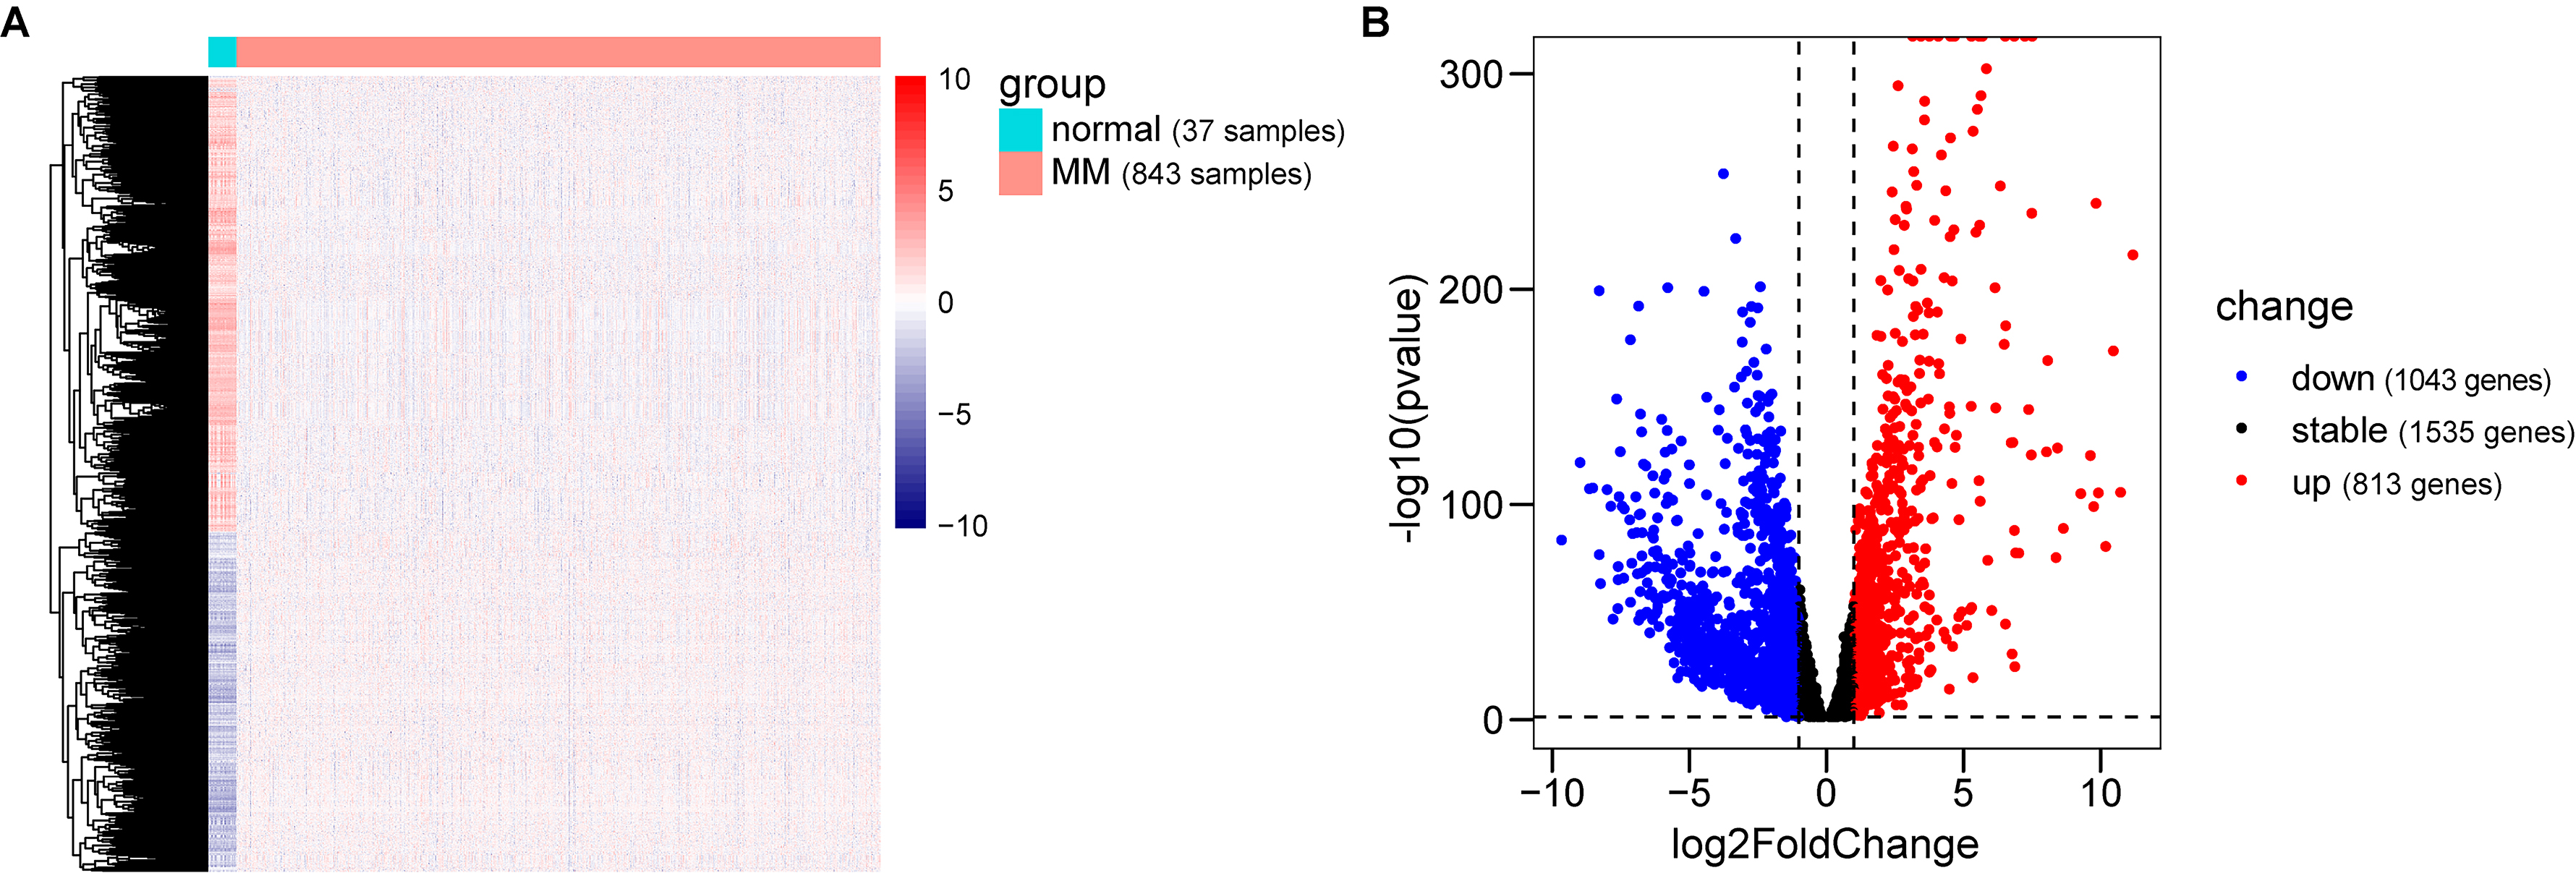
The functional enrichment and signal pathway analysis of DEGs were performed by combining GO, hallmark and reactome databases, with
Functional enrichment and pathway analysis. (A) The functional enrichment and pathway analysis of 813 up-regulated genes. (B) The functional enrichment and pathway analysis of 1043 down-regulated genes.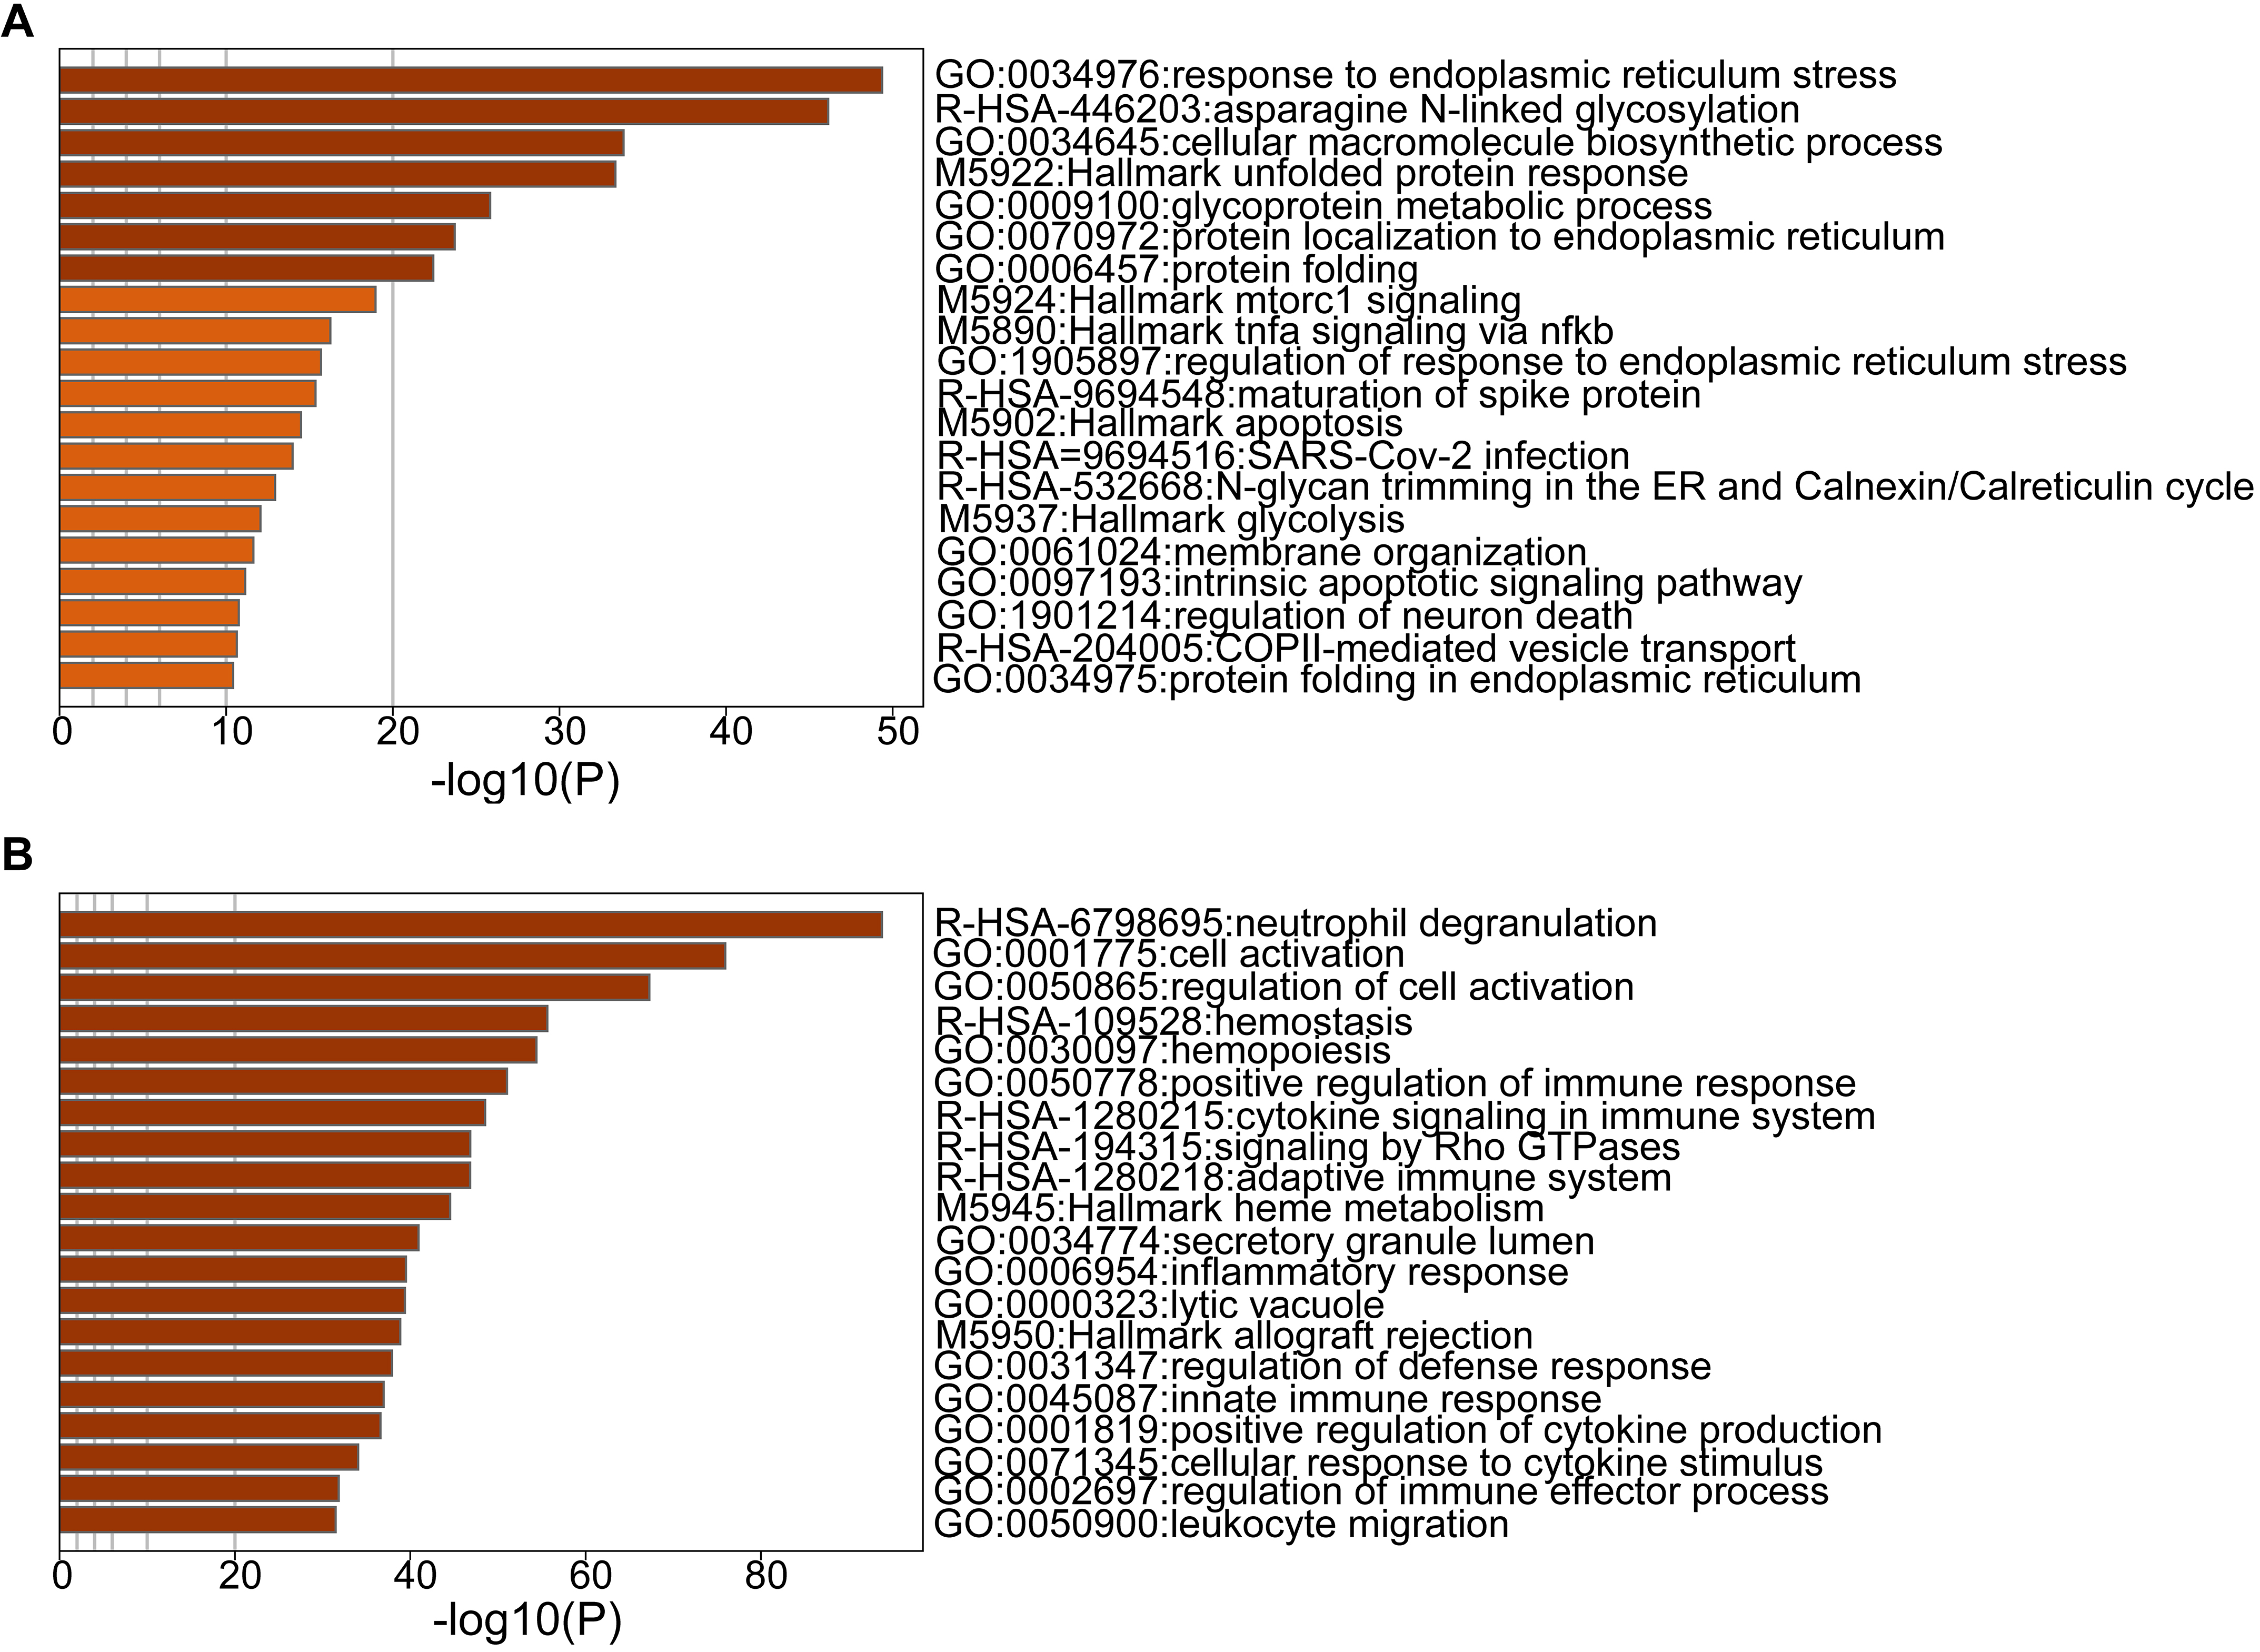
We performed univariate Cox regression analysis for DEGs, and 869 genes were obtained with
Identification of key diagnostic genes for MM and survival analysis of MM prognostic genes. (A) Forest map of the thirteen prognostic genes by univariate Cox regression. (B) CD38. (C) FCMR. (D) TMC8. (E) CLEC7A. (F) TK1. (G) NLRC3. (H) UBE2C. (I) FLNA. (J) RPS6KA1. (K) SUB1. (L) SH2D2A. (M) MCM4. (N) LMNB1.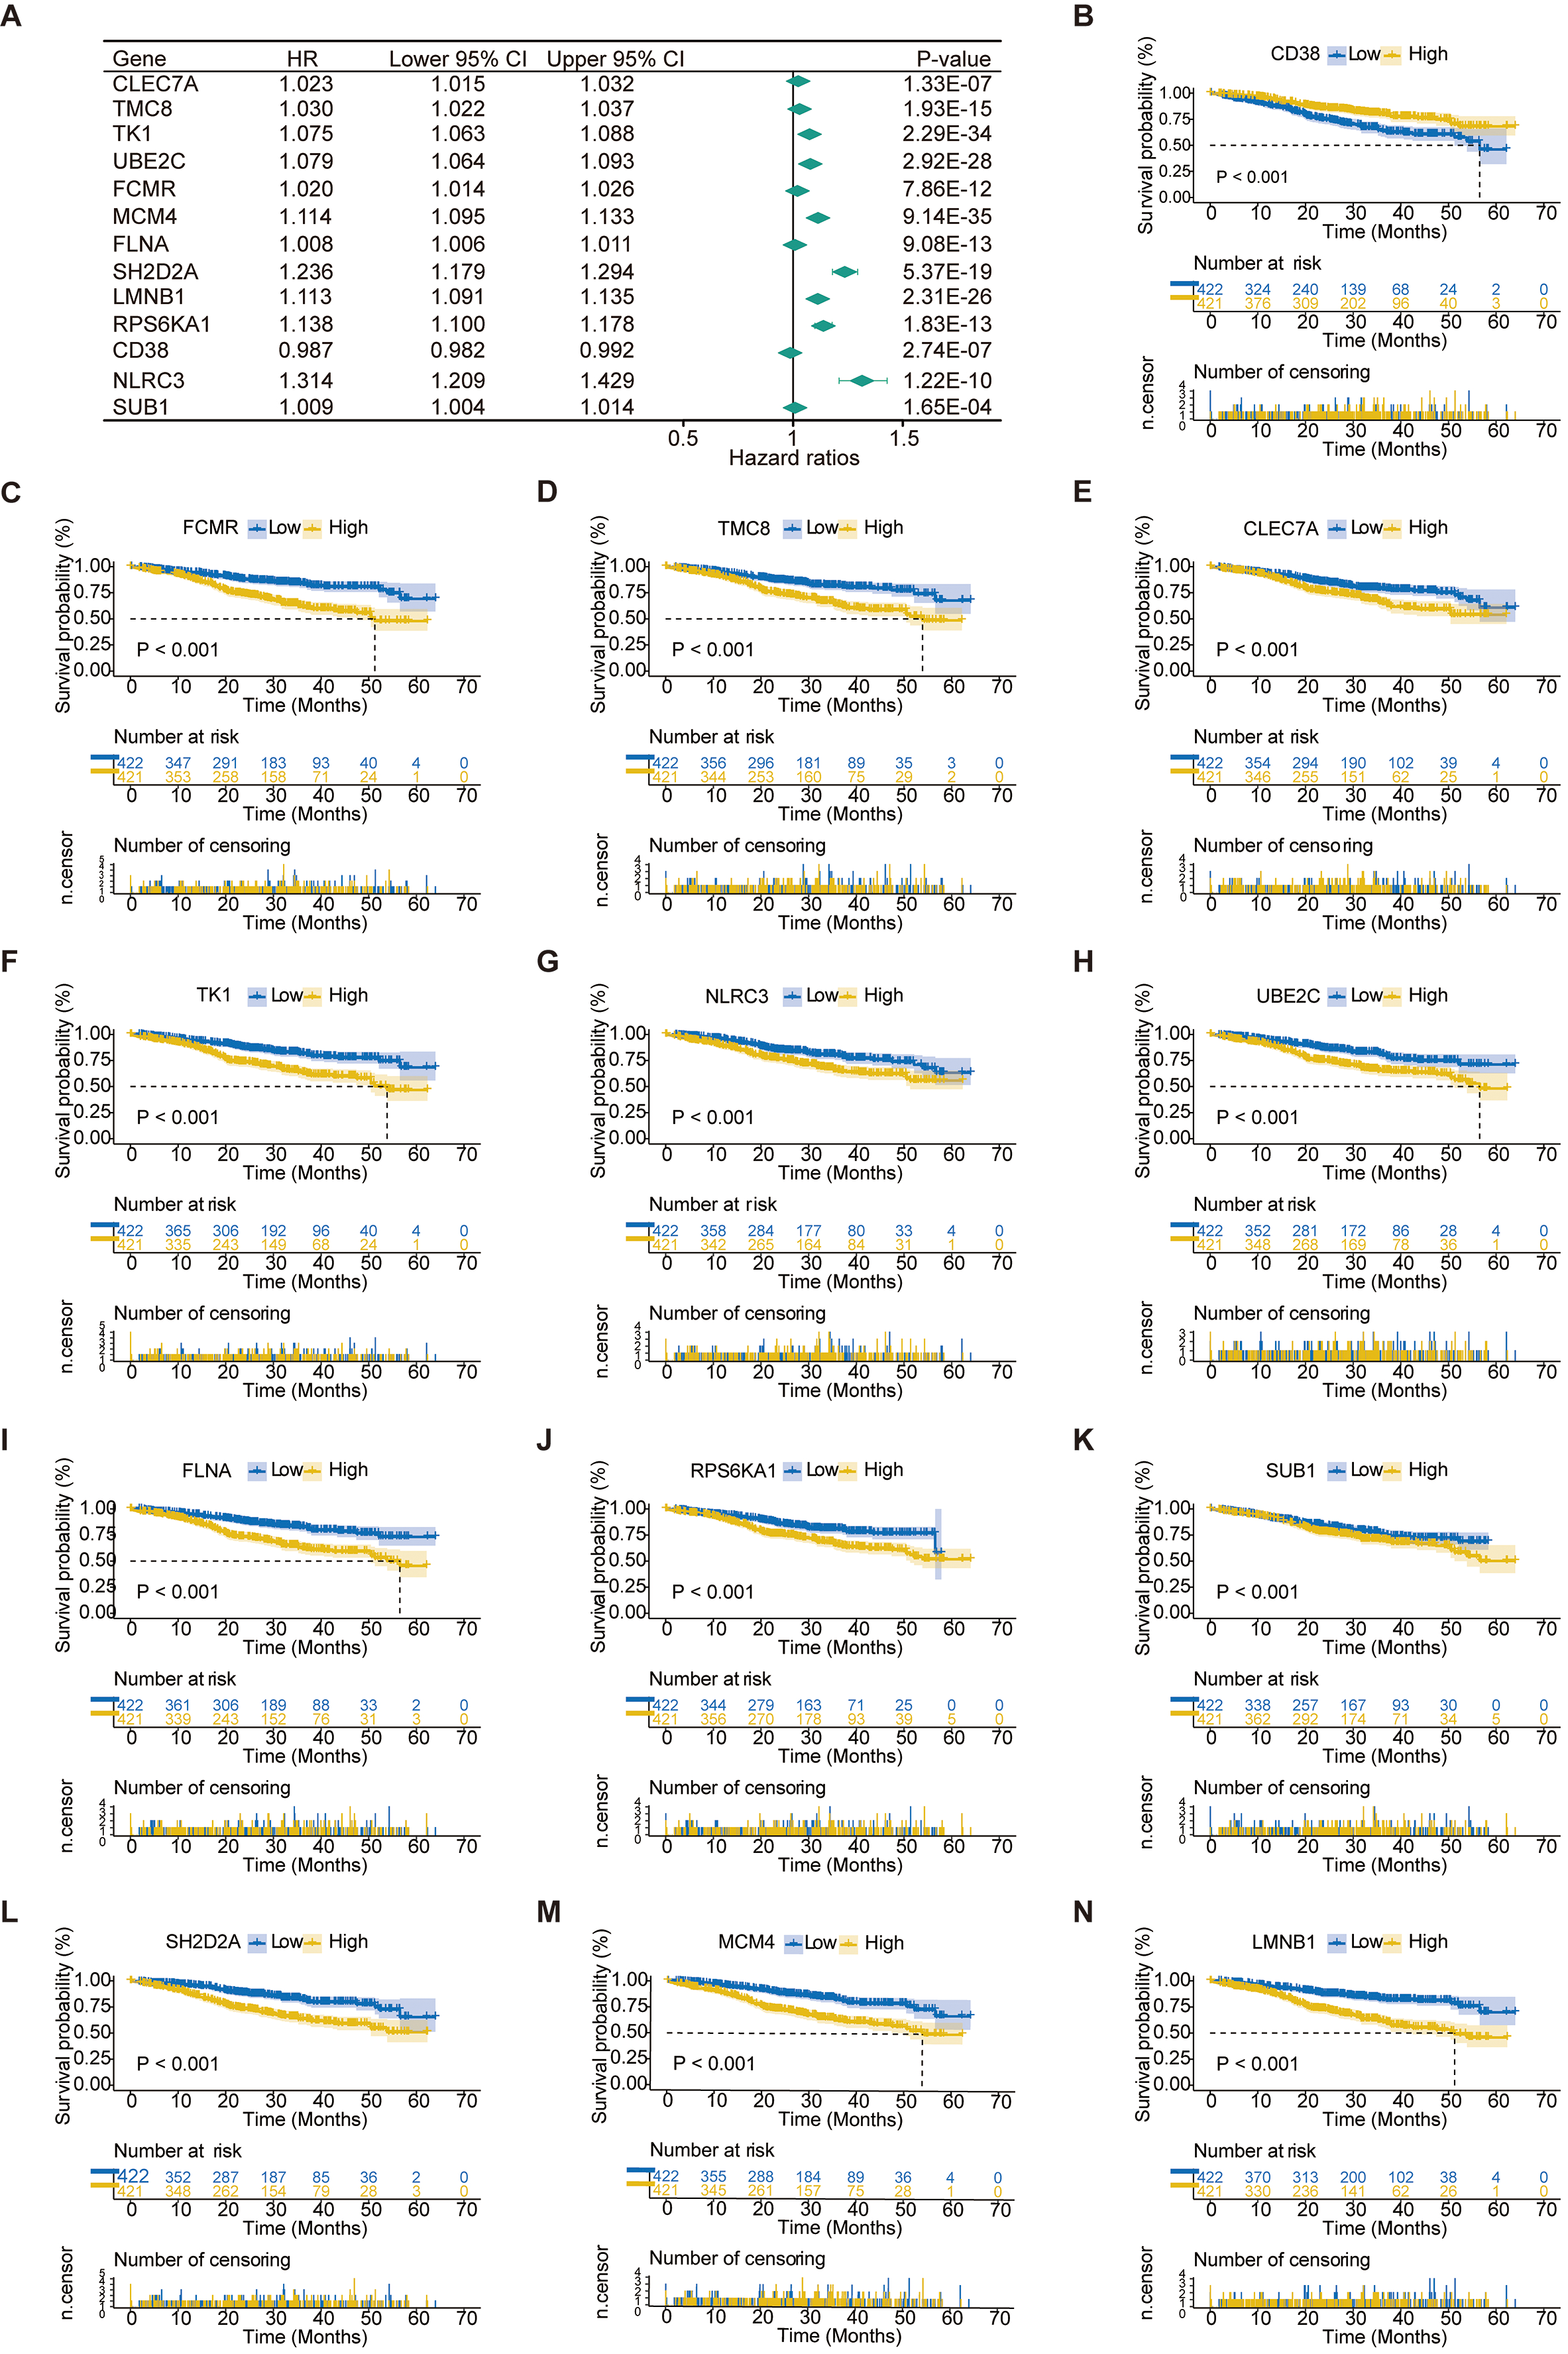
To explore the potential prognostic value of the thirteen genes, we performed multivariate Cox regression analysis [33]. In multivariate Cox regression analysis, prognostic signature was reconstructed as a linear combination of gene expression levels and estimated regression coefficients [34]. The coefficients of the thirteen genes are shown in Table 3. We used these genes to construct a risk model. The risk score is calculated by the following formula:
where
Regression analysis of prognostic gene signatures. (A) Distributions of risk scores in all samples. (B) Distribution of follow-up times in the training samples. (C) Heat map of gene expression in the prognostic signature of MM. 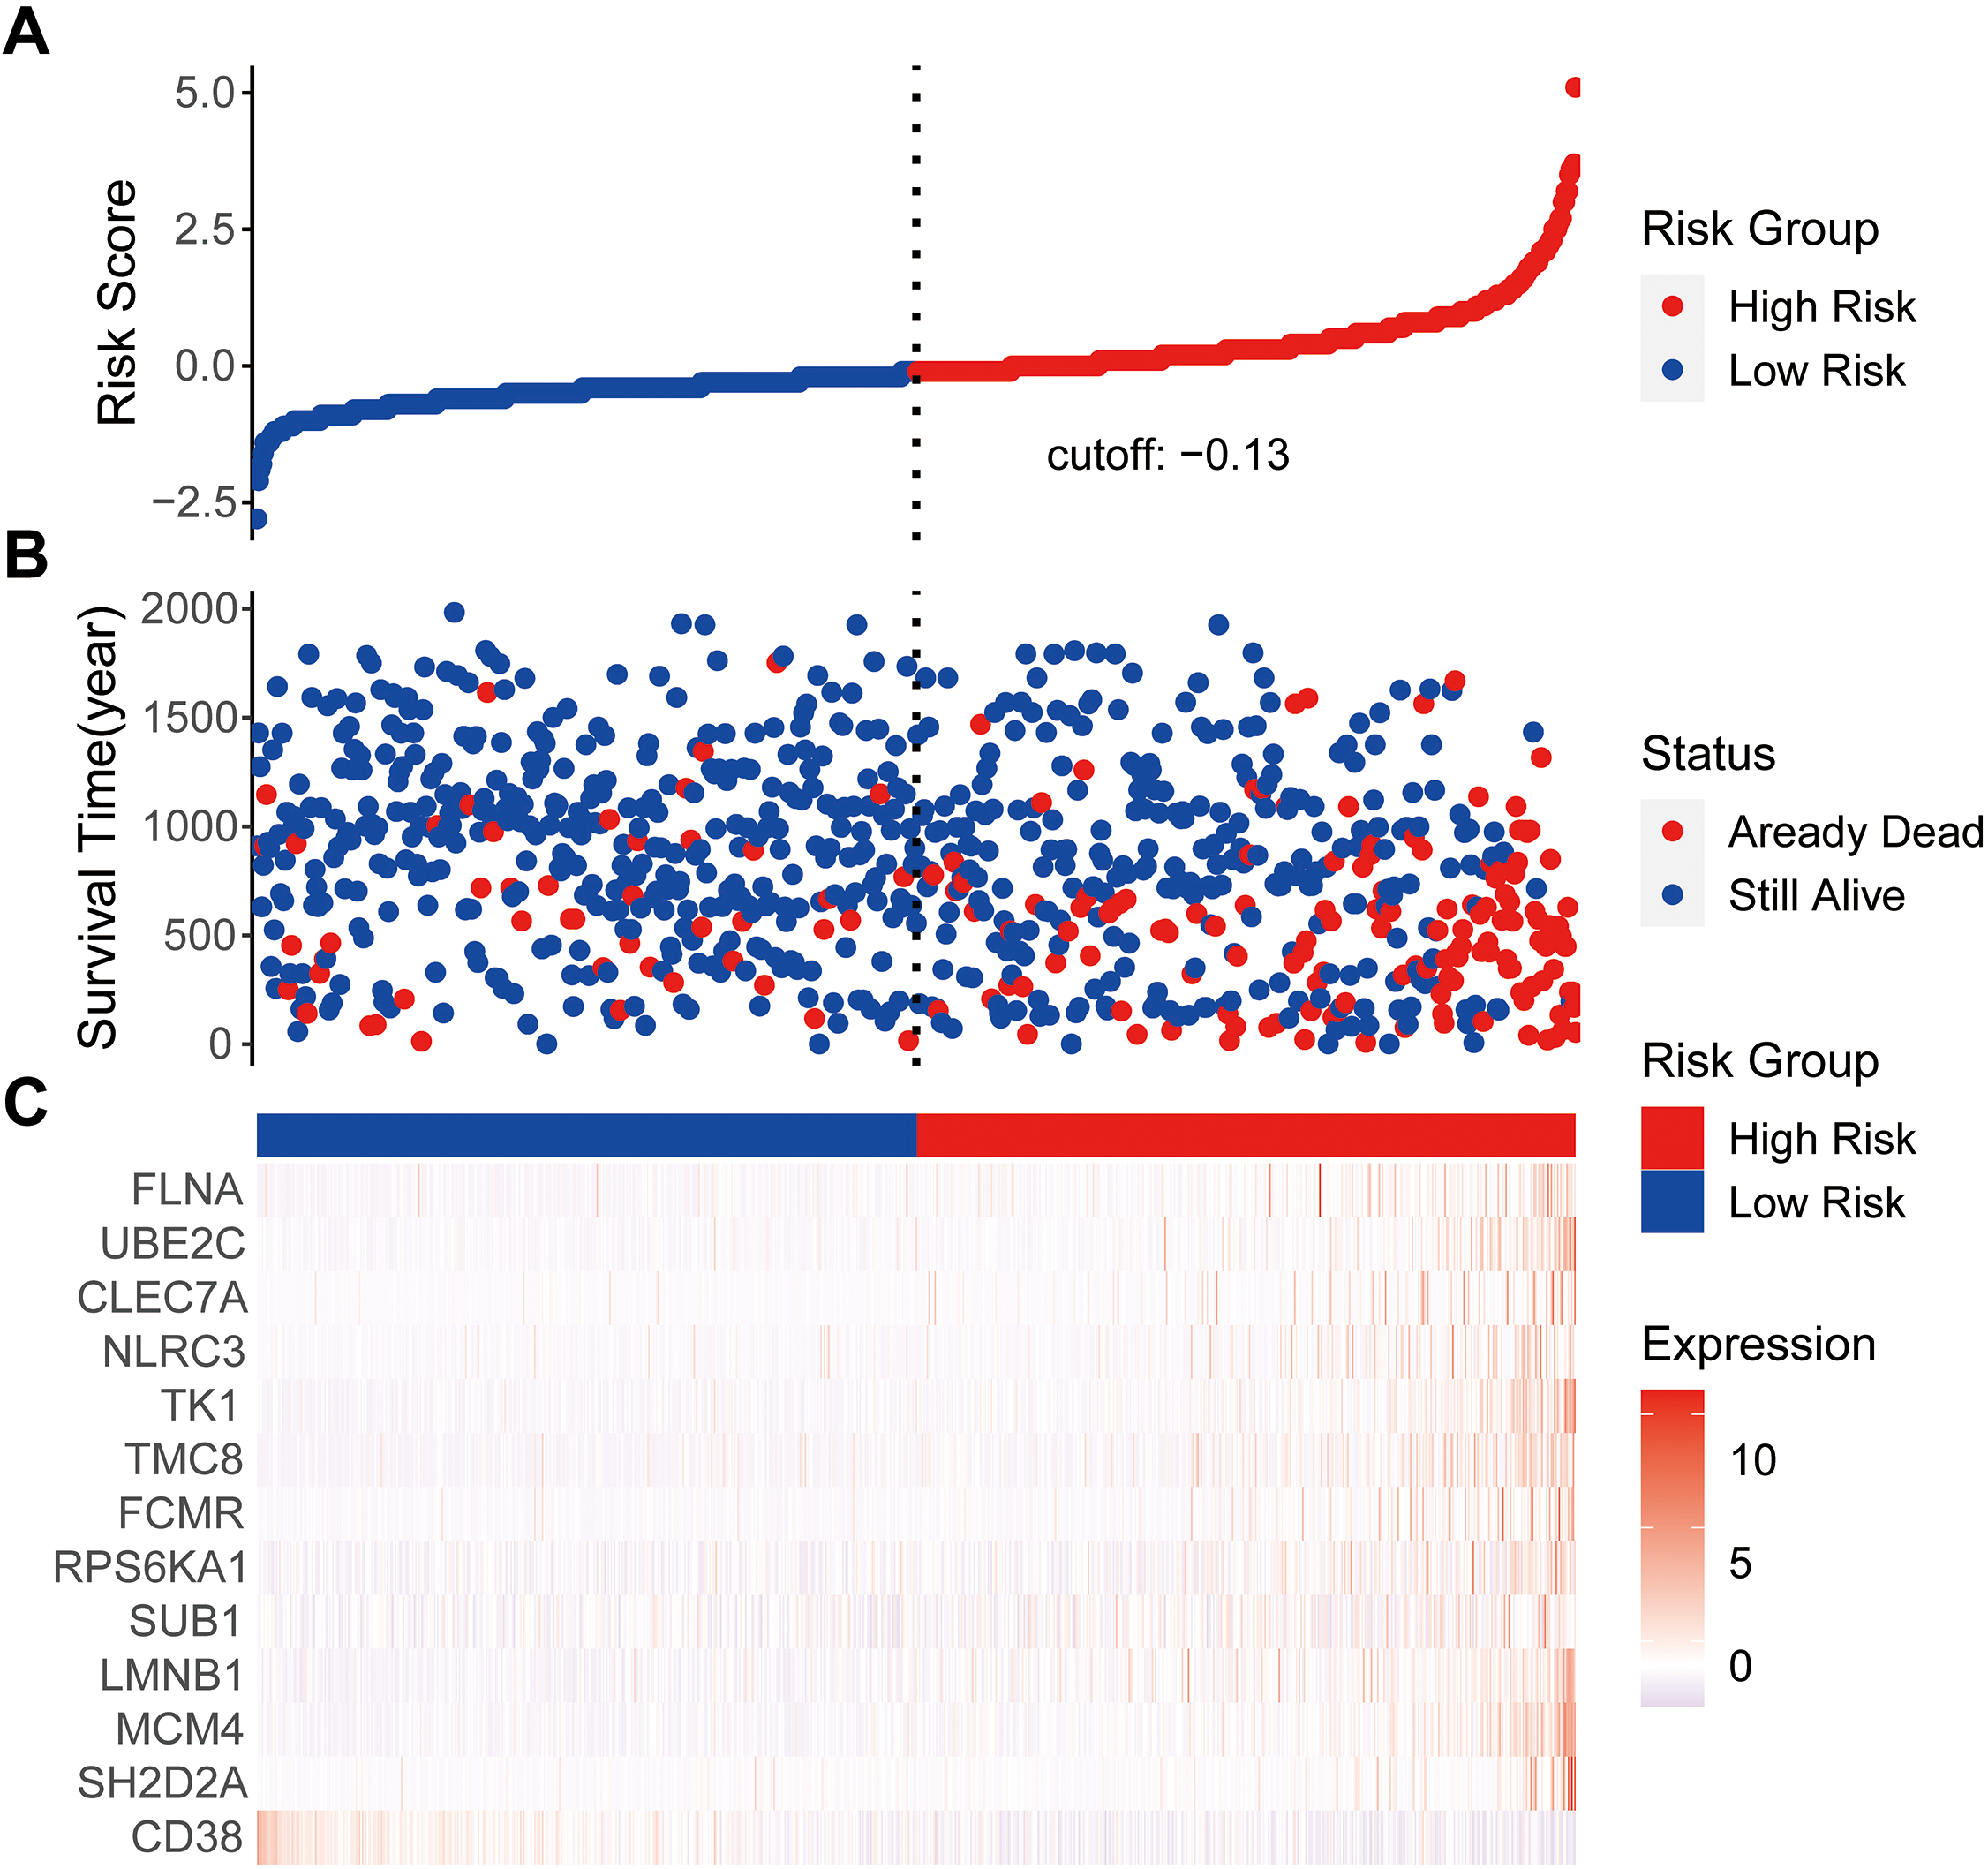
Cox proportional hazard regression analysis of MM risk factors. (A) Univariate Cox regression analysis of risk score and other indicators. (B) Multivariate Cox regression analysis of risk score and other indicators. (C) Kaplan-Meier analysis of MM patients grouped according to median risk. (D) Multi-index ROC curve of risk score and other indicators. 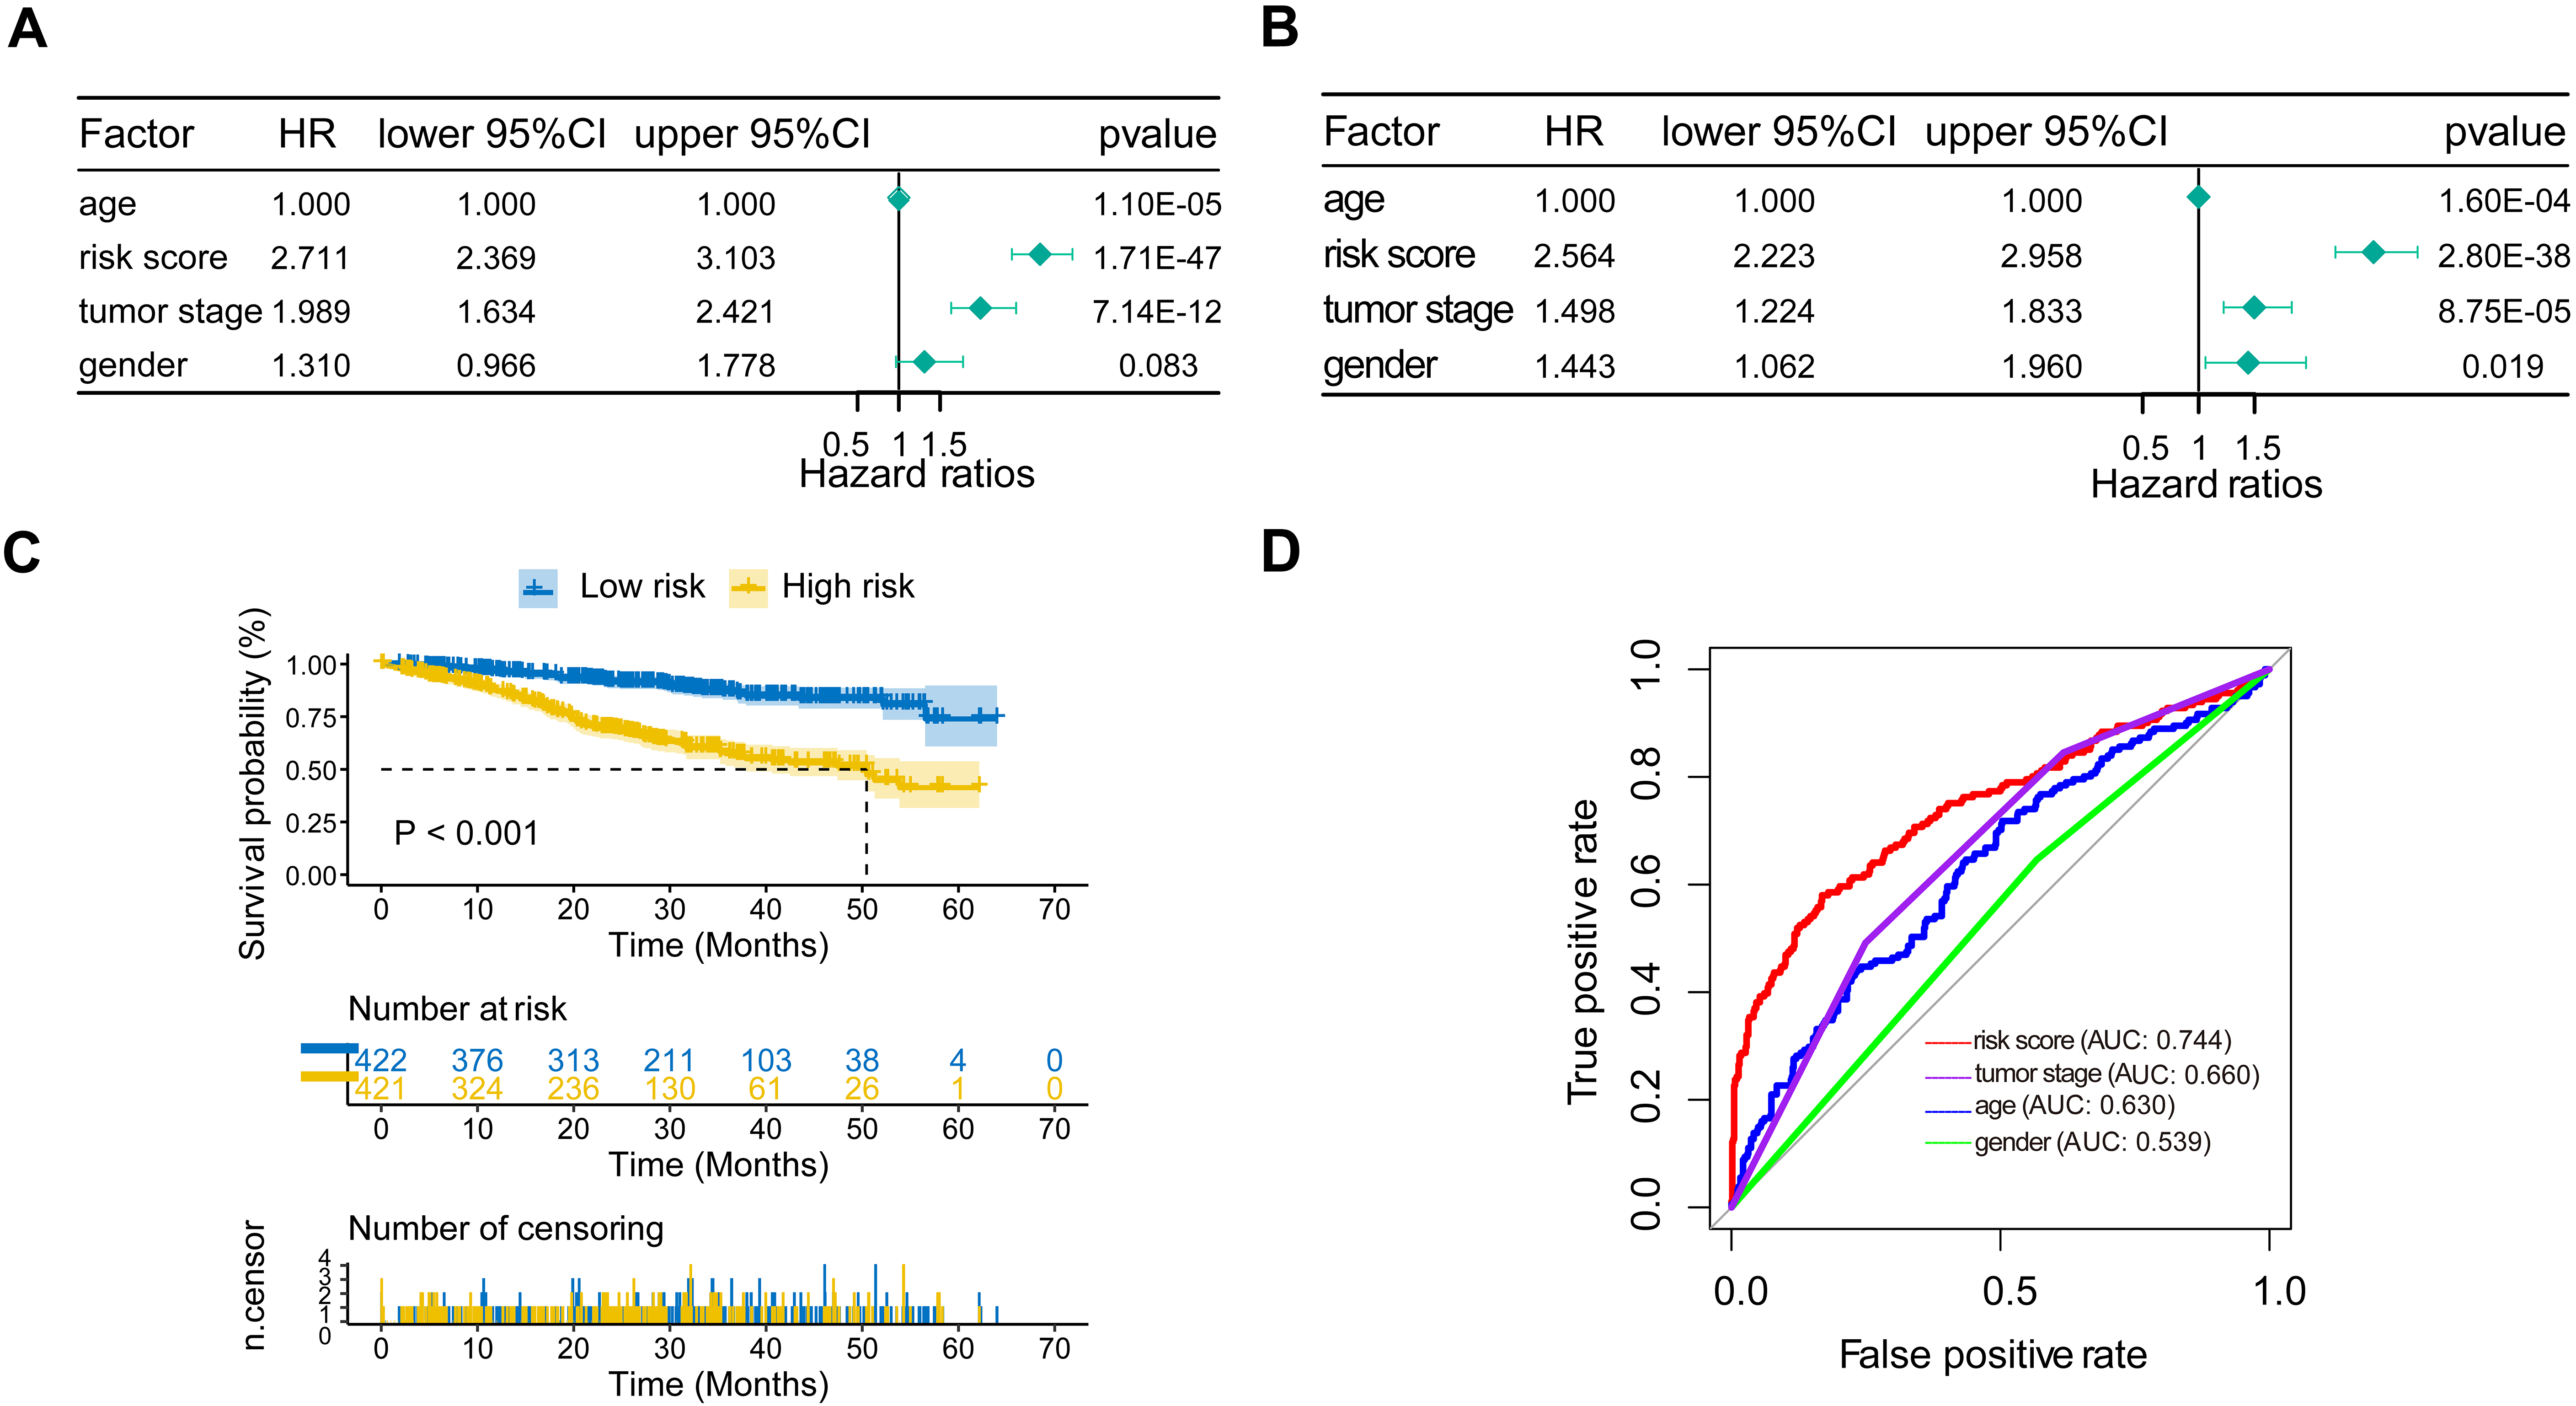
External verification of the prognostic MM gene signature. (A) Risk scores distribution. (B) Survival status of patients. (C) Heat map of gene expression pattern. (D) Kaplan-Meier plot for OS of patients in different risk groups. (E) ROC curve of risk score. 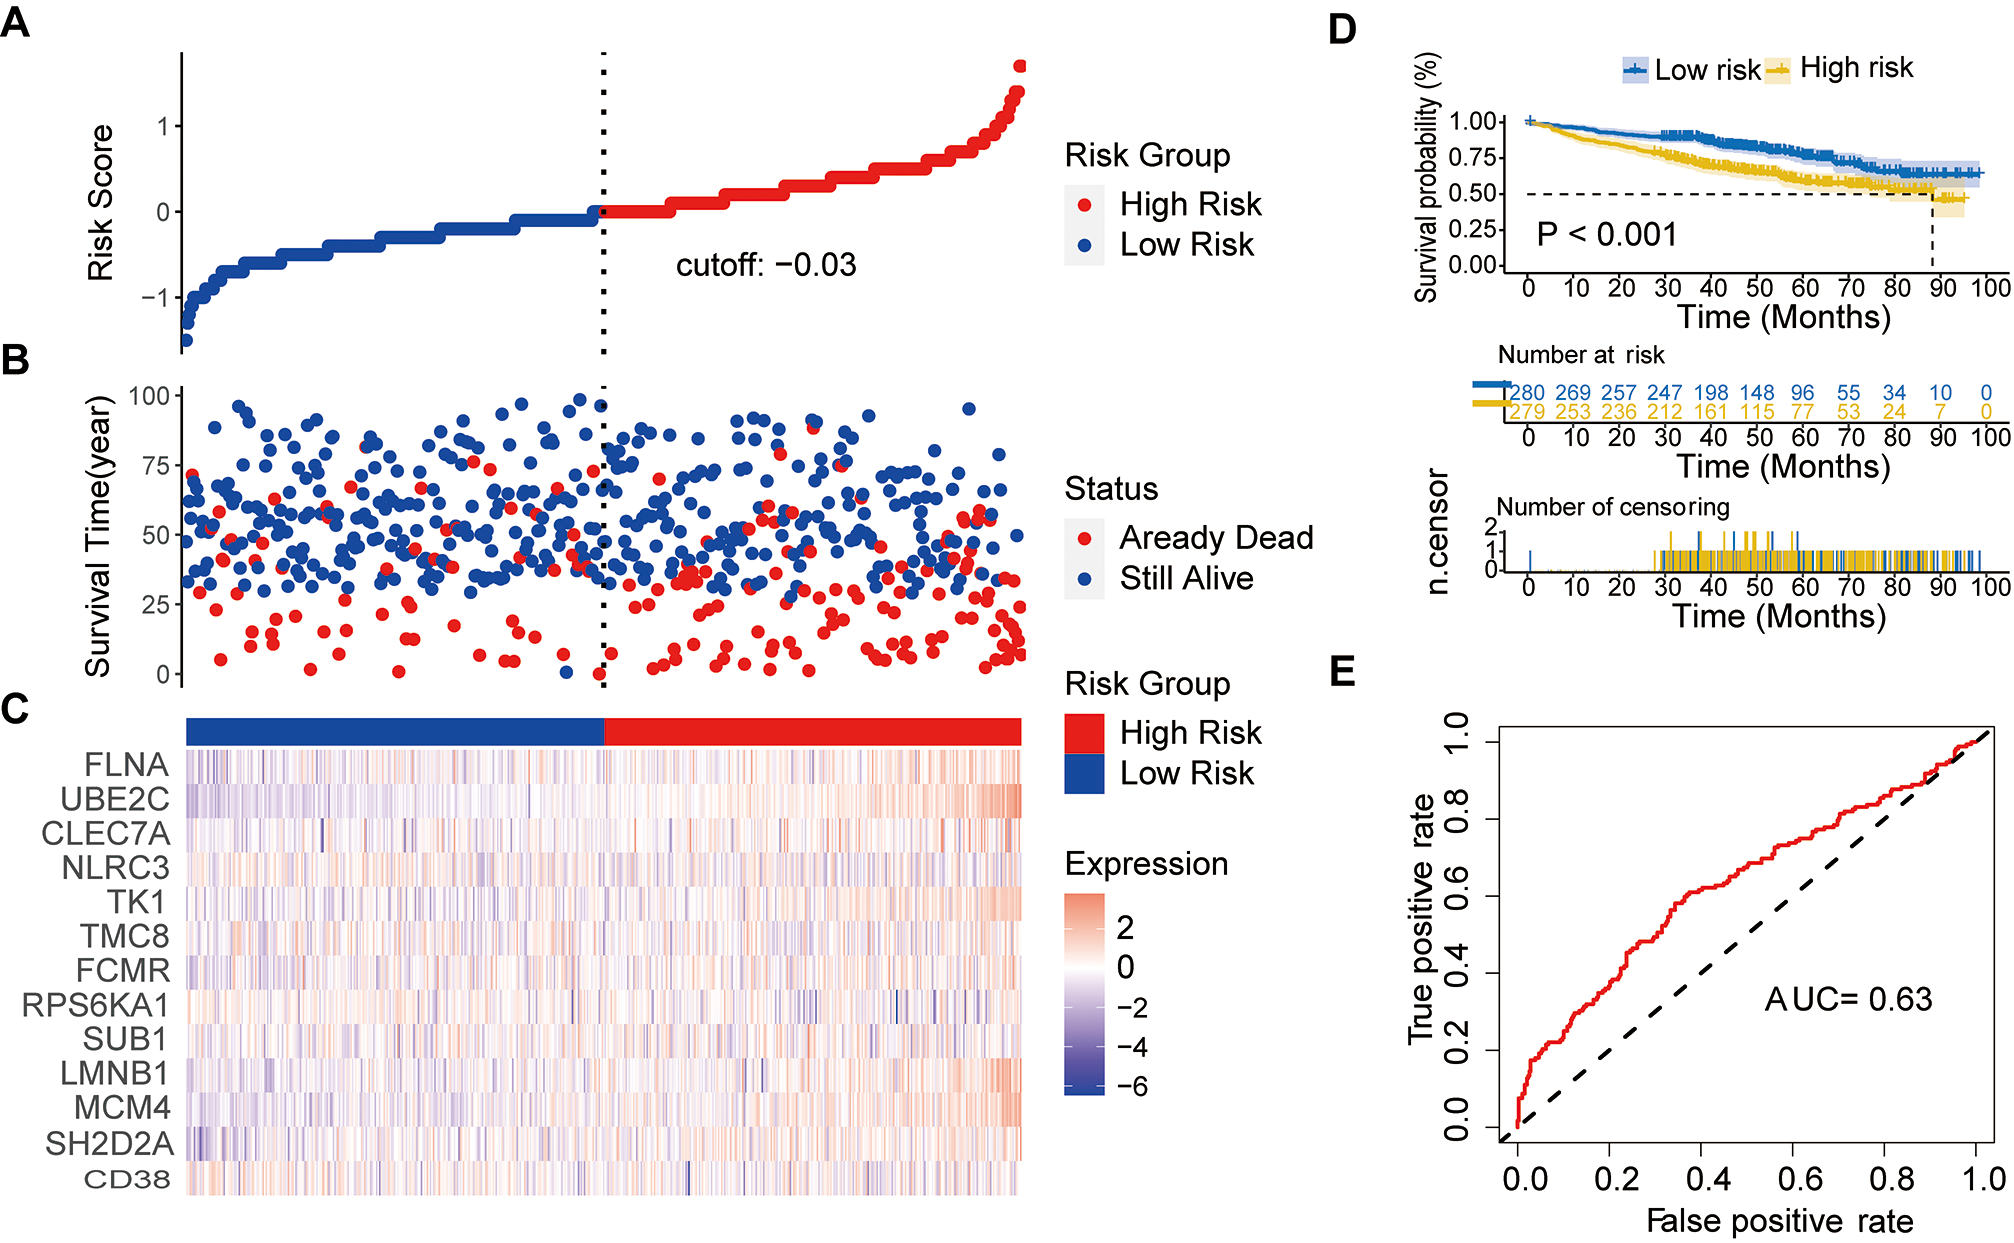
The risk model for the thirteen prognostic genes presented the number of deaths in the low-risk group was significantly lower than that in the high-risk group (Fig. 5A, B). The heat map of the genes is shown in Fig. 5C.
In order to assess the prognostic value of the risk score and other clinical parameters, univariate and multivariate Cox analyses was performed [36]. The risk score was strongly linked with OS, according to univariate Cox regression analysis (HR
The ROC is a curve with the true positive rate (sensitivity) as the ordinate and the false positive rate (1-specificity) as the abscissa [38]. The ROC curve is an effective way to evaluate the performance of diagnostic tests [39]. The results of multi-indicator ROC showed that the AUC of risk score was 0.744, which was higher than the AUC of tumor stage (0.660), age (0.630) and gender (0.539) [40] (Fig. 6D).
External verification of the prognostic gene signature
We downloaded the GSE24080 dataset from the GEO database as an independent dataset to validate our prognostic model. The distribution of risk score, survival status, and gene expression patterns of patients are shown in Fig. 7A–C. The OS of high-risk patients was significantly lower than that of low-risk patients (Fig. 7D) [41]. In ROC analysis, the AUC of the risk score was 0.63, indicating high diagnostic sensitivity and specificity for OS of MM patients (Fig. 7E).
Discussion
Although the treatment of MM has made great progress, drug resistance and relapse are still the main causes of death in MM patients. Identification of biomarkers is essential for the treatment of MM. To screen potential diagnostic biomarkers for MM [42], we identified thirteen genes (CD38, SH2D2A, MCM4, LMNB1, SUB1, RPS6KA1, FCMR, TMC8, TK1, NLRC3, CLEC7A, UBE2C, FLNA) by univariate Cox and LASSO regression analyses. Among them, CD38 has been reported to be associated with MM. CD38 was discovered in 1980 by E.L Reinherz and S. Schlossman [43]. It is a transmembrane glycoprotein with outer enzyme activity, which functions as a receptor and adhesion molecule [44]. Although CD38 is frequently detected on the surface of cells, it can also be found in some internal structures such the endoplasmic reticulum, nuclear membrane, and mitochondria [45]. The protein is generally expressed at low levels on various hematological and solid tissues, while plasma cells express particularly high levels of CD38 [46]. CD38 is commonly used as a co-marker for MM cell identification [47]. Therefore, CD38 is an important target for treating MM [48]. The introduction of monoclonal antibodies (mAbs) targeting CD38 has represented a major breakthrough in the treatment of MM [49]. Daratumumab (Dara) targeting CD38 is the first clinically active monoclonal antibody (MoAb) for the treatment of relapsed and refractory multiple myeloma (RRMM) [50]. The deep response and prolonged PFS can be achieved in MM patients by combining Dara with IMiD and PI regimens [51]. Because some patients do not respond or progress quickly to this treatment, a new generation of anti-CD38 mAb, SAR442085, has emerged [52]. SAR442085 had higher NK cell-dependent in vivo antitumor efficacy and better survival than daratumumab against myeloma cells overexpressing human CD38 [53] In MM, MCM4 is one of the top DEGs involved in the DNA replication process [54]. No other genes have been reported to be associated with the prognosis of MM, but we believe that they are also potential prognostic genes of MM.
This study still has some limitations. First, some samples lacked information on some biochemical indicators, and we excluded samples that lacked information on patient survival. Secondly, although the prognostic model based on the genome has a good predictive effect on the survival of MM patients, it has not been validated by large-scale prospective studies. Third, the relevant mechanisms have not been tested in MM cells.
In summary, we constructed a prognostic model of MM by identifying thirteen genes closely related to MM prognosis. The AUC of the risk score was greater than 0.7, indicating that the risk score had a good predictive value for more than 70% of MM patients [55]. This prognostic model classifies patients into high-risk and low-risk groups, which can provide reliable prediction results for clinicians to select appropriate treatment strategies and avoid overtreatment or lack of necessary treatment. The results of this study can be considered in clinical practice together with other conventional prognostic parameters, and provide a reference for clinicians to choose personalized treatment options for different risk groups.
Author contributions
Conception: Jingxin Zhang.
Interpretation or analysis of data: Tingting Zheng, Panpan Chen.
Preparation of the manuscript: Jingxin Zhang, Tingting Zheng.
Revision for important intellectual content: Yuanlin Xu, Peijun Jia, Yan Li, Yating Li, Jiaming Cao, Wanxin Li, Yazhe Zhen, Ying Zhang, Shijie Zhang, Jiangfeng Du.
Supervision: Jingxin Zhang.
Data availability statement
Publicly available datasets were analyzed in this study. This data can be found here: The datasets (cohort: GDC MMRF-COMMPASS): UCSC Xena at
Funding
This work was supported by Grants 81900111 and 81870095 from Natural Science Foundation of China.
Footnotes
Acknowledgments
We acknowledge UCSC Xena and TCGA databases for providing their platforms and contributors for uploading their meaningful datasets.
Conflict of interest
The authors declare that no commercial or financial relationships that could be construed as a potential conflict of interest existed during the research.