
Abstract
Background
Necroptosis is an inflammatory cell death mode, and its association with multiple myeloma (MM) remains unclear.
Methods
This prospective study first analyzed the association between necroptosis-related signature as well as prognosis and chemotherapy sensitivity in MM using the necroptosis score. Consensus clustering was used to identify necroptosis-related molecular clusters. Least absolute shrinkage and selection operator analysis and multivariate Cox regression analysis were performed to establish the prognostic model of necroptosis-related genes (NRGs).
Results
A high necroptosis score was associated with poor prognosis and abundant immune infiltration. Two molecular clusters (clusters A and B) significantly differed in terms of prognosis and tumor microenvironment. Cluster B had a worse prognosis and higher tumor marker pathway activity than cluster A. The risk score model based on four NRGs can accurately predict the prognosis of patients with MM, which was validated in two validation cohorts. Receiver operating characteristic curve analysis showed that the area under the curves of the risk score in predicting the 1-, 3-, and 5-year survival rates were 0.710, 0.758, and 0.834, respectively. Further, the activity of pathways related to proliferation and genetic regulation in the high-risk group significantly increased. The drug prediction results showed that the low-risk score group was more sensitive to bortezomib, cytarabine, and doxorubicin than the high-risk score group. Meanwhile, the high-risk score group was more sensitive to lenalidomide and vinblastine than the low-risk score group. Finally, the upregulation of model genes CHMP1A, FAS, JAK3, and HSP90AA1 in clinical samples collected from patients with MM was validated via real-time polymerase chain reaction.
Conclusion
A systematic analysis of NRGs can help identify potential necroptosis-related mechanisms and provide novel biomarkers for MM prognosis prediction, tumor microenvironment evaluation, and personalized treatment planning.
Introduction
Multiple myeloma (MM) is a hematological malignancy caused by the malignant transformation of plasma cells. 1 With improvement in the understanding of MM, novel drugs and treatment methods such as immunotherapy have emerged and improved the survival rate of patients.2,3 However, MM remains incurable, and it is associated with relapse and exacerbation in high-risk patients. 4 At present, there is no recognized biomarker for the risk and prognosis assessment of patients with MM, which is significantly important in selecting individualized treatment in patients with MM. Therefore, it is extremely essential to explore novel prognostic markers and therapeutic targets.
Apoptosis resistance is an important cause of chemotherapy failure. 5 The development of novel non-apoptotic therapies is beneficial in improving chemotherapy sensitivity and promoting cancer cell death. Recent studies have revealed an abnormal type of apoptosis. This is referred to as necroptosis, which is a non-caspase-regulated necrotic cell death mechanism mainly mediated by receptor-interacting protein 1 (RIP1), RIP3, and mixed lineage kinase domain-like protein.6,7 Necroptosis is related to the pathogenesis of neuroinflammatory diseases such as Alzheimer's disease and Parkinson's disease.8,9 Moreover, it is a regulatory factor for the malignant progression of tumors.10,11 While promoting tumor cell death, it also causes necrotic cells to discharge contents, thereby triggering inflammatory responses that promote cancer metastasis and immunosuppression.12-14 Therefore, necroptosis is a double-edged sword in cancer therapy. Previous studies have shown that combination therapy with docosahexaenoic acid (DHA) or eicosapentaenoic acid (EPA) and bortezomib may address MM resistance via necroptosis. 15 The KIAA1191 overexpression promotes MM cell proliferation by inhibiting necroptosis. 16 Birinapant, sorafenib, and high-dose shikonin can induce necroptosis in MM cells.17-19 Therefore, necroptosis modulation can be an innovative and potential therapeutic strategy for MM.
The current study aimed to analyze the expression characteristics of necroptosis-related genes (NRGs) and to divide patients with MM according to two different necroptosis subtypes based on NRG expression. Further, a necroptosis-related prognostic risk model was constructed to predict prognosis, tumor microenvironment (TME) characteristics, and chemotherapy sensitivity. We believe that our study can identify novel biomarkers and provide guidance in identifying individualized treatment for patients with MM.
Methods
Data Acquisition
This prospective study included 858 MM samples from the Multiple Myeloma Research Foundation (MMRF) CoMMpass database and 559 MM samples from the Gene Expression Omnibus (GEO) database, which included the GSE2658 cohort with survival data. The MMRF CoMMpass cohort was used as the analysis cohort. The GSE6477 cohort included 15 normal controls and 125 MM samples for the differential expression analysis of NRGs. In total, 159 NRGs were obtained from the Kyoto Encyclopedia of Genes and Genomes (KEGG) database. The reporting of this study conforms to TRIPOD guidelines. 20
Consensus Cluster Analysis of NRGs
Unsupervised clustering of the MMRF CoMMpass cohort was performed using the consensus clustering method with the “ConsensusCluster” package based on the expression profile of NRGs. Then, two significantly different cluster subtypes were obtained. 21 In total, 1000 replicates were performed to ensure the stability and reliability of the results.
Pathway Enrichment Analysis
KEGG enrichment analysis of NRGs was performed to identify the functions of NRGs. The Gene Set Variation Analysis (GSVA) algorithm was used to calculate scores for individual gene sets in different samples to represent the biological activity of the pathway. 22 The Gene Set Enrichment Analysis (GSEA) algorithm was utilized to analyze differences in the pathway activity between the high - and low-risk groups. 23
Assessment of TME and Immune Cell Infiltration
The ESTIMATE algorithm was used to evaluate the immune and stromal scores of the MM samples to analyze TME characteristics. 24 The CIBERSORT algorithm was utilized to assess the percentage of immune cells in each sample. 25
Construction of the Prognostic Risk Score Model
The least absolute shrinkage and selection operator (LASSO) regression analysis was performed on the prognostic NRGs identified via univariate Cox regression analysis to screen out the most relevant NRGs. The prognostic risk score model was further constructed via multivariate Cox analysis. The risk score was calculated by multiplying the expression value of each model gene with its corresponding coefficient and by adding it. After calculating the risk scores of all patients, patients with MM were divided into the high- and low-risk groups based on the median value.
Drug Sensitivity Prediction and Validation
The “pRRophetic” package was used to predict the half maximal inhibitory concentration (IC50) of MM samples to commonly used therapeutic drugs. 26 A smaller IC50 value indicates a higher therapeutic drug sensitivity. Subsequently, CCK-8 assay was used to detect the sensitivity of MM cells to these drugs, thereby assessing their efficacy.
Quantitative Real-Time Polymerase Chain Reaction
This study was approved by the Ethics Committee of the Second Affiliated Hospital of Nanchang University (Approval number: No. review [2022] No. (103); Date: Dec.1.2022), and 10 MM bone marrow samples and 8 normal control samples were collected. All participants signed an informed consent before using the samples. RNA samples were extracted from mononuclear cells and were reverse transcribed. The expression of the four model genes was determined via quantitative real-time polymerase chain reaction (RT-PCR) using the Japanese TAKARA kit on an ABI7500 instrument. The results were calculated using the 2−△△CT method.
Statistical Analysis
The Wilcoxon test and the Kruskal–Wallis test were used for two- and multi-group comparisons, respectively. The “survminer” software package was used to determine the best cut-off value of the necroptosis score. Kaplan–Meier survival analysis was performed using the log-rank test. The receiver operating characteristic (ROC) curve was used to assess the specificity and sensitivity of the risk score and to determine the area under the curve (AUC). A bilateral P value of < .05 was considered statistically significant.
Results
Analysis of the Expression Characteristics of NRGs
The necroptosis score was calculated using the GSVA algorithm, and survival analysis showed that a high necroptosis score was associated with poor prognosis in patients with MM (Figure 1A). In total, 59 differentially expressed NRGs were identified (Table S1). Among them, VDAC1, VDAC2, PPIA, SLC25A4, and CHMP2A were the most significantly upregulated genes. Meanwhile, PYGL, STAT5A, STAT5B, TRADD, and PYGM were the most significantly downregulated genes (Figure 1B). Based on the further Cox regression analysis, 48 NRGs were significantly associated with prognosis in patients with MM (Table S2). There were 27 intersection NRGs in both analysis sets (Figure 1C). Protein–protein interaction (PPI) network analysis showed that STAT3, HSP90AA1, and BAX were the core of intersection NRGs (Figure 1D). In addition to its association with necroptosis, it was also enriched in cancer pathways, Th17 cell differentiation, NOD-like receptor signaling pathway, and IL-17 signaling pathway (Figure 1E). Hence, necroptosis can be associated with tumor immunity. A correlation analysis of immune infiltration showed that the necroptosis score was positively correlated with CD8+ T cells, activated NK cells, M2 macrophages, and neutrophils in addition to infiltrating memory B cells (Figure 1F). Previous studies have shown that necroptosis induces the polarization of M2 macrophages through the release of damage-associated molecular patterns (DAMPs), thereby exerting immunosuppression.27,28 Therefore, the poor prognosis of patients with high necroptosis scores may be related to immune escape of tumor cells mediated by M2 macrophages.

Expression characteristics of necroptosis-related genes (NRGs) and correlation analysis of necroptosis score. (A) KM curve analysis of the necroptosis score. Log-rank test. (B) Differential expression analysis of NRGs between MM samples and normal samples in the GSE6477 cohort. Significantly up-regulated NRG expressions are shown in red, and significantly down-regulated NRG expressions are depicted in blue. (C) The intersection of NRGs with differential expression (diff) and NRGs were significantly associated with prognosis in patients with MM (Cox). (D) PPI network connectivity diagram of the intersection NRGs. (E) KEGG enrichment analysis of the intersection NRGs. (F) Correlation analysis between the necroptosis score and immune cell infiltration. (*P < .05).
Identification of Necroptosis-Related Molecular Subtypes and Analysis of Their Differences in Terms of Biological Characteristics
To completely explore the functions of NRGs, unsupervised clustering based on 27 NRGs was performed, and two distinct molecular subtypes (clusters A and B) were identified (Figure 2A). PCA analysis was performed to validate the discrimination of the clusters (Figure 2B). The heat map showed that the expression levels of NRGs in cluster A were significantly higher than that in cluster B (Figure 2C). Survival analysis showed that cluster A had a significantly worse prognosis and a higher necroptosis score than cluster B (Figure 2D–E). Immune infiltration analysis showed that cluster A contained more memory B cells, resting memory CD4+ T cells than cluster B. Meanwhile, cluster B had more plasma cells, naive CD4+ T cells, and activated dendritic T cells than cluster A (Figure 2F). Differential analysis of the pathway enrichment scores showed that the tumor signature pathway activity in cluster A was significantly higher than that in cluster B (Figure 2G).

Identification of the necroptosis-related molecular subtypes and analysis of differences in biological characteristics between subtypes. (A) Two cluster subtypes were identified via consensus clustering. (B) The reliability of the clustering was validated via PCA analysis. (C) The heatmap shows the expression differences of NRGs between the cluster subtypes. (D) Survival analysis between subtypes (E–G). Differences in the necroptosis score (E), immune cell infiltration (F), and tumor marker gene set score (G) between cluster subtypes (*P < .05; ** P < .01; *** P < .001).
Construction and Validation of the NRG Prognostic Risk Score Model
The analysis cohort was randomly divided into the training and validation cohorts with equal numbers of patients. In the training cohort, the risk score models with the HSP90AA1, CHMP1A, JAK3, and FAS genes as the model genes were constructed via LASSO regression analysis and multivariate Cox regression analysis (Figure 3A–D) (Table S3). Survival analysis showed that in the training, validation, analysis, and GEO cohorts (GSE2658), the prognosis of the high-risk group was significantly worse than the low-risk group (Figure 3D–G). ROC analysis showed that the AUC values of the risk score for predicting the 1-, 3-, and 5-year prognosis were 0.710, 0.758, and 0.834 in the training cohort, and 0.659, 0.648, and 0.916 in the validation cohort, respectively. Thus, the risk score had a high prognostic prediction accuracy (Figure 3H–K). This was also validated in the analysis and GEO cohorts. In addition, the high-risk group had a higher proportion of patients who died and those with higher model gene expression levels than all four cohorts (Figure 4A–D). Univariate and multivariate Cox regression analysis revealed that the risk score was an independent predictive factor of prognosis in patients with MM (Figure 4E). In addition, we used the risk score and clinicopathological factors significantly related to prognosis in patients with MM patients to construct a nomogram for predicting overall survival (OS) (Figure 5A). The 1-, 3-, and 4-year calibration curves showed that the nomogram could accurately predict the OS of patients with MM (Figure 5B). ROC curve analysis showed that the AUC value of the nomogram was higher than that of the risk score and other clinicopathological factors (Figure 5C). Therefore, the nomogram had a higher accuracy in predicting OS.
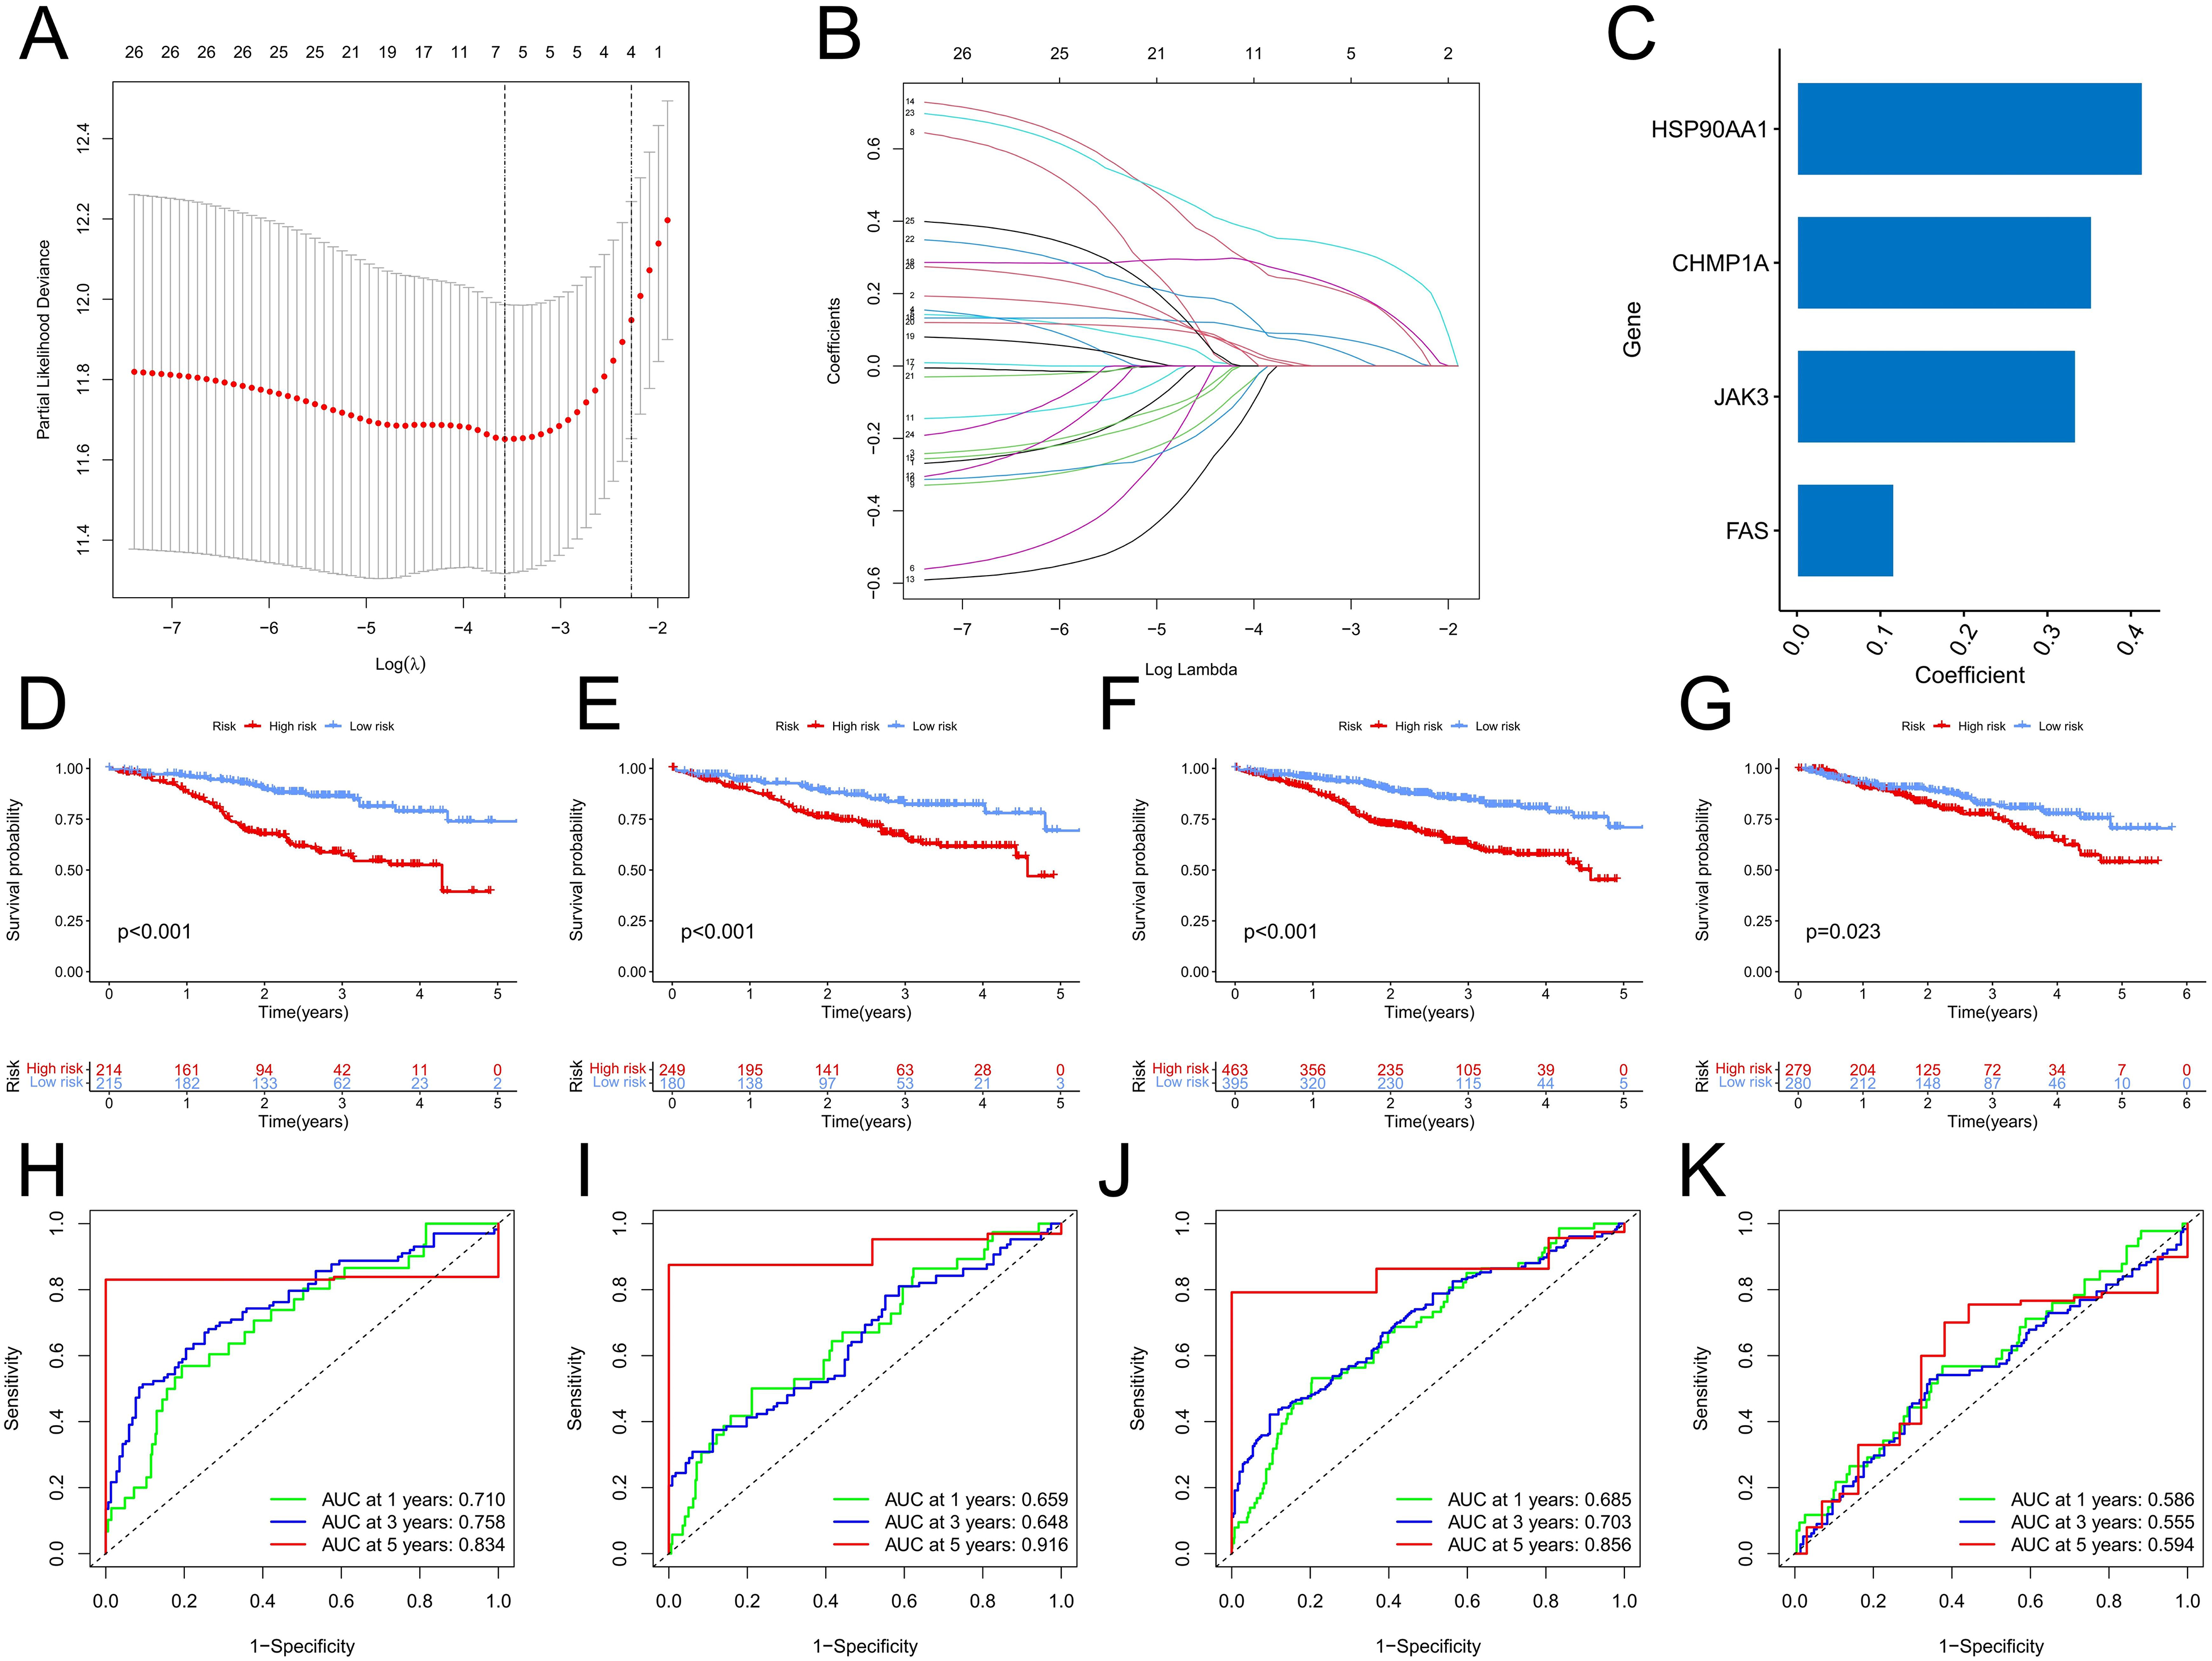
Construction and validation of the risk scoring model. (A) The penalty coefficient of the minimum 10-fold cross-validation error point was calculated to determine the corresponding model gene. (B) Determination of model gene coefficients. (C) Model gene and its coefficient distribution. (D–G) Survival analysis of the high- and low-risk groups in the training cohort (D), validation cohort (E), overall analysis cohort (F), and GSE2658 cohort (G). (H–K) ROC curve analysis of the risk scores in the training cohort (H), validation cohort (I), overall analysis cohort (J), and GSE2658 cohort (K).

Relevant features of the risk scoring model. (A-D) training cohort (A), validation cohort (B), overall analysis cohort (C), and GSE2658 cohort (D). Patients were divided into high- and low-risk groups based on the median value. The top-down is the risk score distribution map, the survival status map, and the model gene expression heatmap. (E) Univariate and multivariate Cox regression analysis of clinicopathologic factors and risk score in the training cohort, validation cohort, and overall analysis cohort.

Establishment of the nomogram and differences in biological factors between the high- and low-risk groups. (A) Nomogram predicting OS in patients with MM in the total analysis cohort. (B) Time-dependent calibration curves to evaluate the predictive accuracy of the nomogram. (C) ROC curves for the risk score, nomogram and clinicopathologic factors. (D) The alluvial plot shows the distribution characteristics of patients in the cluster subtypes, risk groups, and survival status. (E) Differences in the risk scores between cluster subtypes. (F) Differences in necroptosis scores between the risk groups. (G) Correlation analysis between the risk score and necroptosis score. (H–J) Differences in the enriched pathways (H), TME scores (I), and immune cell infiltration (J) between the high- and low-risk groups (*P < .05; ** P < .01; *** P < .001).
Differences in TME, Immune Infiltration, and Clinical Features Between the High- and Low-Risk Groups
The alluvial diagram showed the distribution characteristics of the patients (Figure 5D). The patients in cluster A were commonly at high risk, and the number of deaths in this cluster subtype was higher. Meanwhile, cluster B had a lower risk and higher survival rate. That is, the risk score of cluster A was significantly higher than that of cluster B (Figure 5E). Moreover, the high-risk group had a higher necroptosis score than the low-risk group (Figure 5F), and the necroptosis score was also positively correlated with the risk score (r = 0.67, p < 22e-16) (Figure 5G). GSEA enrichment analysis found that the activity of the signaling pathways related to proliferation and genetic regulation such as cell cycle, DNA replication, nucleocytoplasmic transport, proteasome, and ribosome biogenesis in eukaryotes was significantly higher (Figure 5H). TME analysis found that the high-risk group had a higher immune score (Figure 5I), possibly related to the inclusion of more resting CD4+ T cells, resting NK cells, monocytes, and neutrophils (Figure 5J). Analysis of clinical characteristics showed that there were no significant differences in risk scores among patients with different age, gender, ethnicity, and race, while the risk scores of patients with grade III were significantly higher than those of patients with grades I and II (Figure 6A).
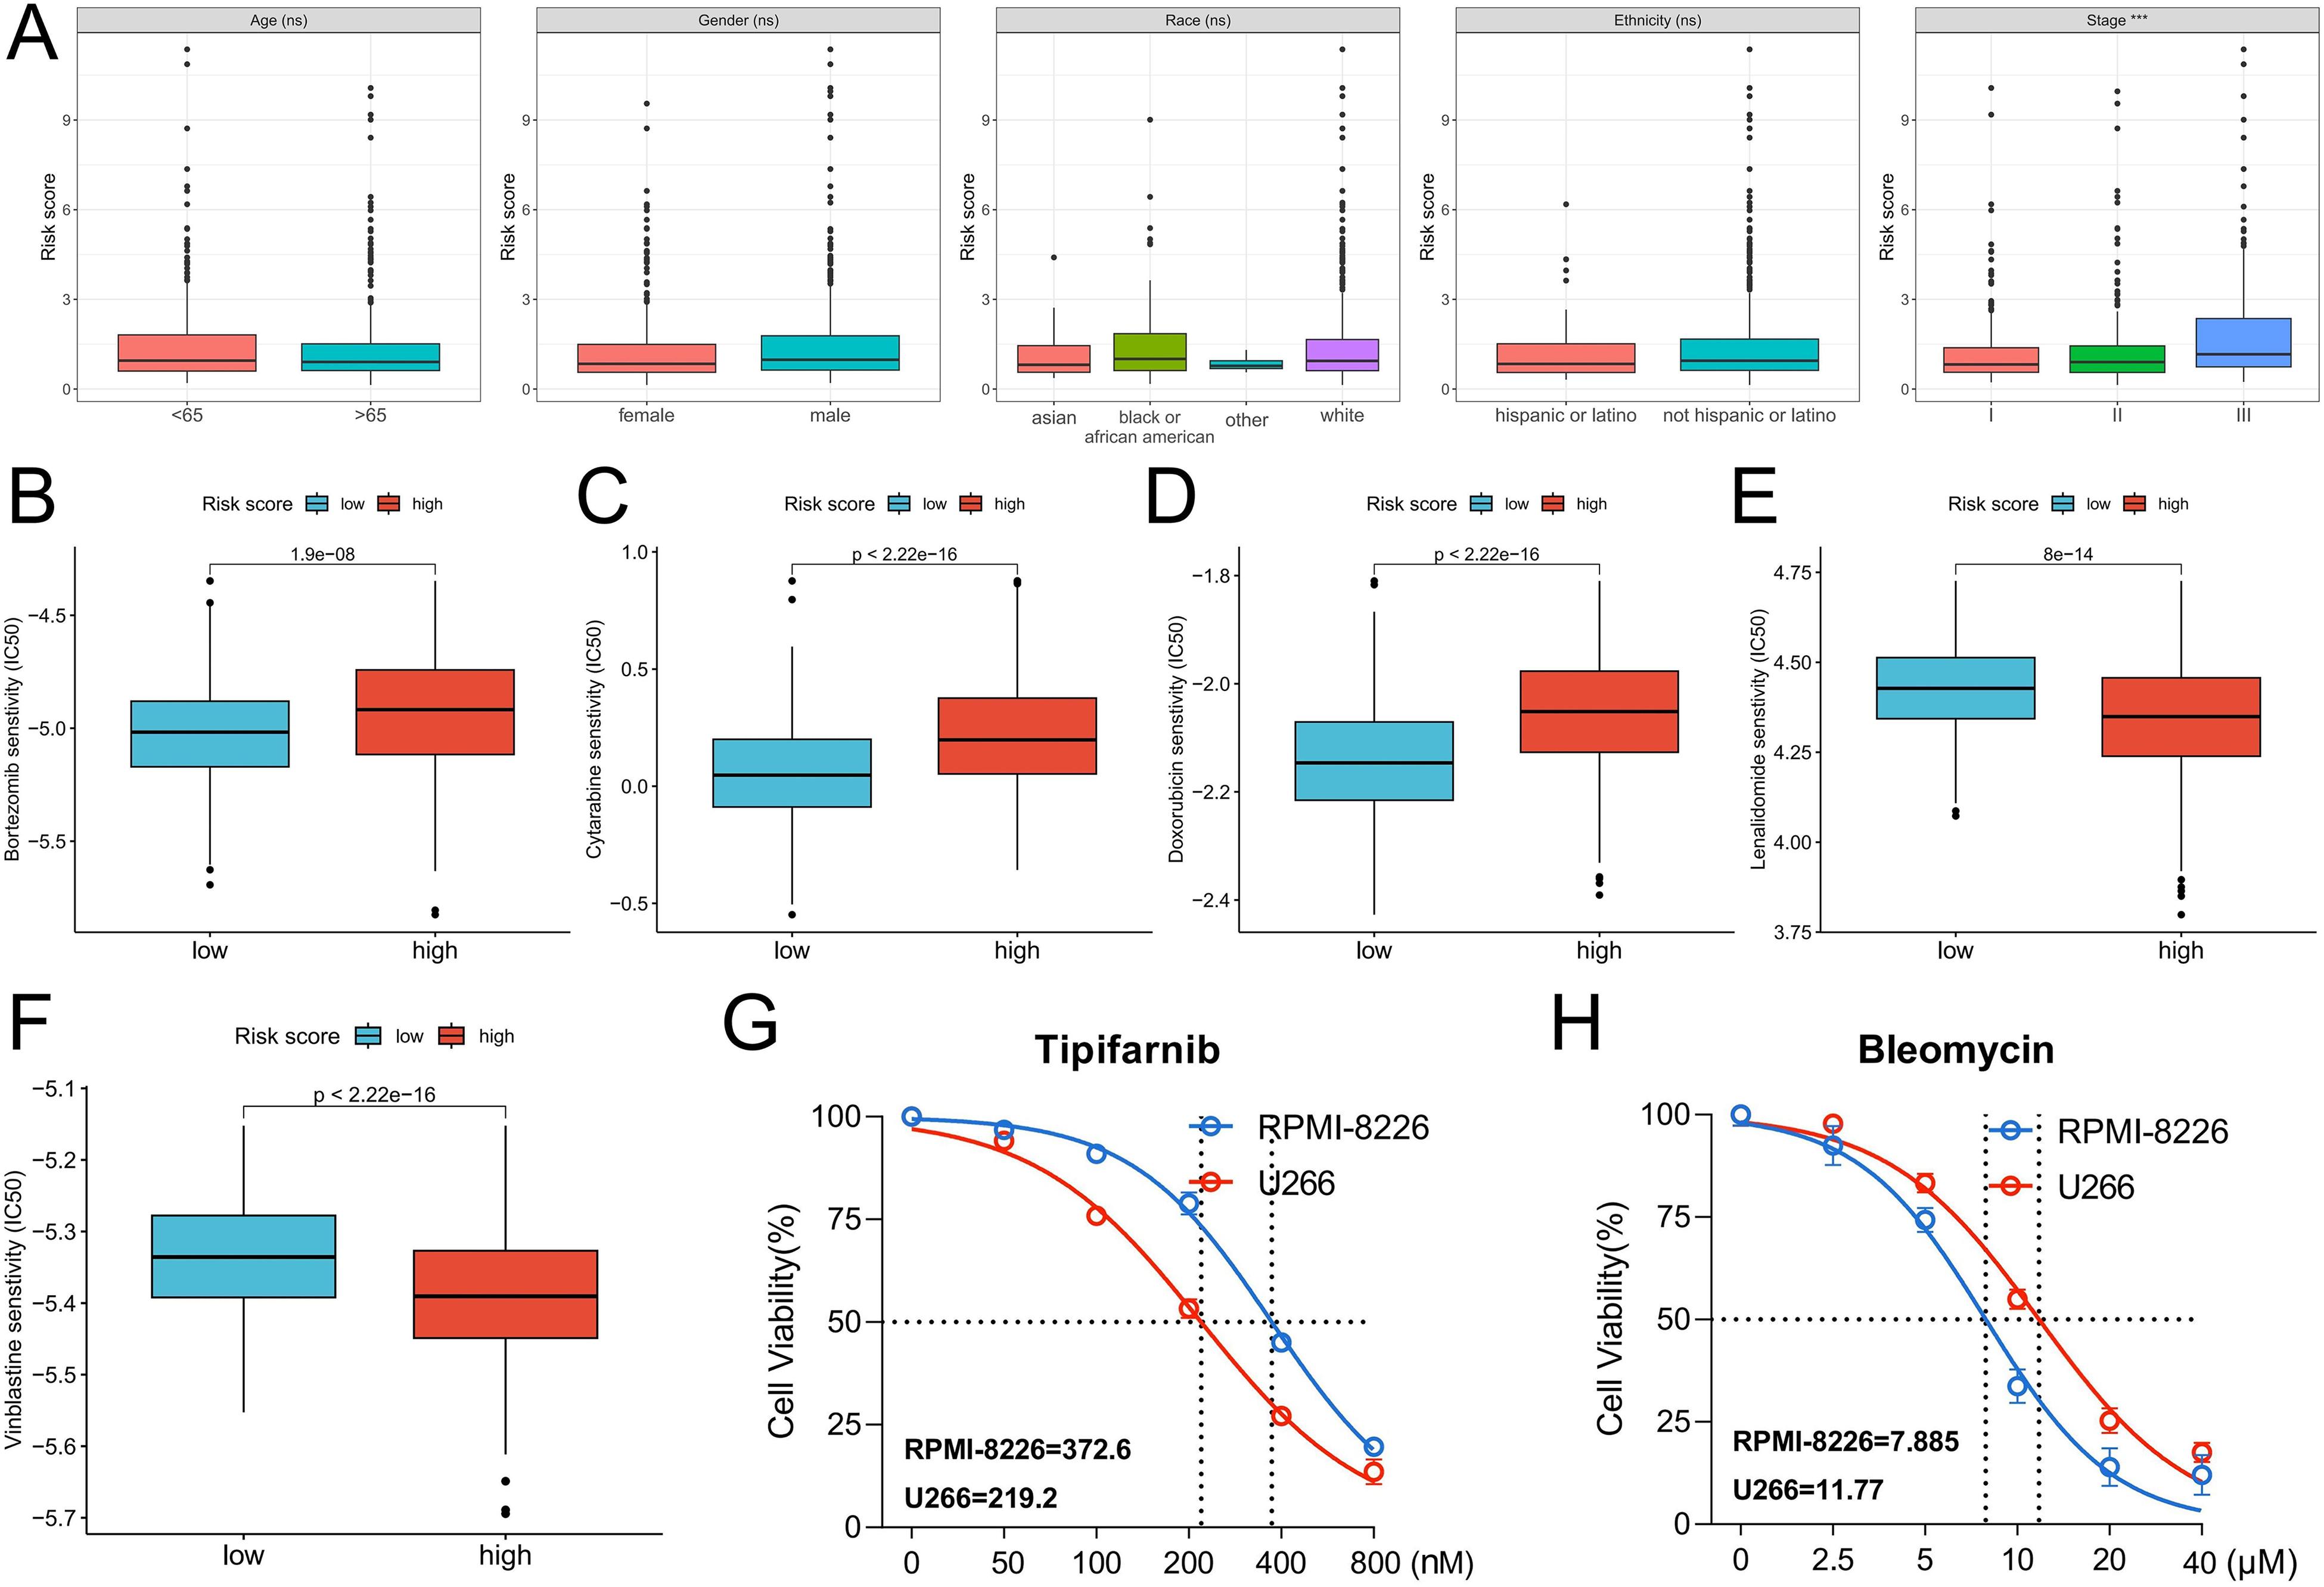
Differences in chemotherapy sensitivity between the high- and low-risk groups. (A) Differences in risk scores between groups with different clinical characteristics. (B–F) Prediction of sensitivity to bortezomib, cytarabine, doxorubicin, lenalidomide, and vinblastine. The ordinate represents the predicted IC50 of the drug; a lower IC50 indicates a higher therapeutic sensitivity of the drug. (G-H) Therapeutic sensitivity of Tipifarnib and Bleomycin in MM cell lines RPMI-8226 and U-266 cells, IC50 of cells to drug treatment is shown in the lower left corner.
Prediction of Chemosensitivity and Validation of the Model Gene Expression in Clinical Samples
The treatment sensitivity of commonly used chemotherapy drugs for MM was predicted. The low-risk group was more sensitive to bortezomib, cytarabine, and doxorubicin than the high-risk group (Figure 6B–D). Meanwhile, the high-risk group was more sensitive to lenalidomide and vinblastine than the low-risk group (Figure 6E–F). Based on a threshold of P < .001, we further analyzed all drug treatment data and identified 48 drugs with significant differences in sensitivity between the high- and low-risk groups (Table S4). Among them, Tipifarnib and Bleomycin showed the most significant differences in sensitivity, and the high-risk group was more sensitive to Tipifarnib, the low-risk group was more sensitive to Bleomycin. Subsequently, we calculated the risk score of different MM cell lines, the risk score of RPMI-8226 cells was 6.664409 and that of U-266 cells was 8.443932, so we simulated RPMI-8226 cells as patients with low risk score and U-266 cells as patients with high risk score. In vitro drug sensitivity assays were performed and U-266 cells were more sensitive to Tipifarnib treatment and RPMI-8226 cells were more sensitive to Bleomycin treatment. These data preliminarily confirm the results of our drug-susceptibility analyses (Figure 6G–H). Via RT-PCR analysis, the MM samples had an upregulated expression of model genes CHMP1A, FAS, JAK3, and HSP90AA1 than the normal samples (Figure 7). Therefore, these genes were related to the development and progression of MM.
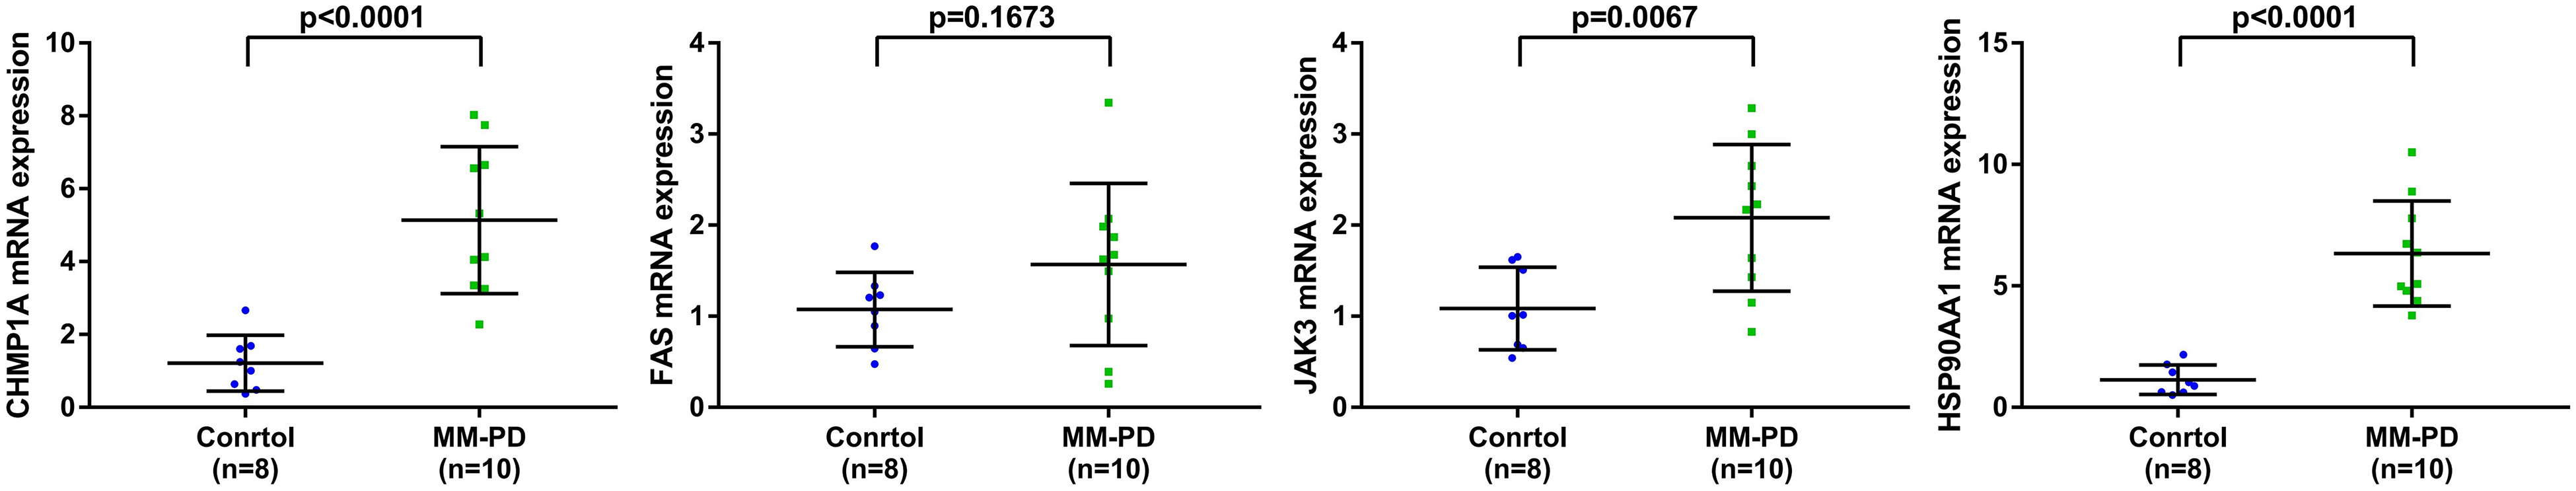
RT-PCR was used to detect the mRNA expression of the four model genes in MM and normal samples. MM-PD: Multiple myeloma-disease progression.
Discussion
The primary characteristic of MM is the malignant proliferation of plasma cells, 29 and the escape of cell death is the intrinsic factor of the MM development. Hence, MM cannot be cured with various treatments. 30 It is particularly important to explore the mechanisms of cell death induction, develop novel therapeutic targets, and identify the prognostic predictive markers in MM treatment. Several previous studies have confirmed the tumor suppressor role of necroptosis in MM. Therefore, to explore its clinical value, further comprehensive analysis of the molecular characteristics and biological functions of necroptosis in MM should be performed.
The current study focused on the expression characteristics of NRGs in MM. The necroptosis score calculated based on the NRG expression is related to poor prognosis. This also indirectly indicates that patients with poor prognosis may have a higher sensitivity to necroptosis. Therefore, necroptosis can be a potential therapeutic strategy. Higher necroptosis scores were also associated with a higher infiltration of CD8+ T cells, activated NK cells, monocytes, and neutrophils, thereby indicating a stronger antitumor immune response. However, M2 macrophages, which are anti-inflammatory immunosuppressive cells, 31 have an increased infiltration capability. Therefore, immunosuppression can be the cause of poor prognosis in patients with MM. Via unsupervised clustering analysis, two necroptosis subtypes of MM were identified. Cluster A, which was associated with a worse prognosis, had a higher necroptosis score and various tumor marker pathway activity. Hence, abnormal signaling is a pathological factor of malignant progression in MM.
The prognostic value of NRGs was further confirmed. A risk score model with the CHMP1A, FAS, JAK3, and HSP90AA1 genes as the model genes was constructed. In the training, validation, and GEO validation cohorts, high-risk patients had a significantly worse prognosis. ROC curve analysis confirmed the prognostic accuracy of the risk score model, particularly with the AUC values of 5-year survival, which were 0.834 in the training cohort and 0.916 in the validation cohort. The expression of the four model genes was significantly upregulated in the high-risk group and in MM samples based on RT-PCR. Therefore, they can be the drivers of MM development and malignant progression. The FAS gene belongs to the family of type-1 membrane proteins that transduce apoptotic signals, and its mediated apoptosis has been extensively evaluated in MM.32-35 JAK3, which is an important member of the JAK signaling pathway, can be used as a potential therapeutic target for high-risk MM. 36 Heat shock proteins derived from tumor cells have been used as vaccines in patients with cancer receiving immunotherapy. HSP90AA1 peptide-specific cytotoxic T lymphocytes can effectively lyse MM cells with specific immunophenotypes. 37 CHAM1A plays a tumor suppressor role in renal cell carcinoma and the production of ductal pancreatic tumor cells. 38 However, its role in MM is unknown. Thus, NRGs are closely related to MM, and they have a potential value as therapeutic targets.
Finally, we evaluated the treatment sensitivity of the high- and low-risk groups to commonly used chemotherapeutic agents. Results showed that the low-risk group was more sensitive to bortezomib, cytarabine, and doxorubicin than the high-risk group. Meanwhile, the high-risk group was more sensitive to lenalidomide and vinblastine than the low-risk group. These findings can provide a reference for the treatment of patients with different risks. Based on our findings, NRGs were associated with MM development and progression, which may be closely related to different immune cell infiltration and cancer-promoting pathway activity. The NRG-based risk score model can accurately predict the prognosis of patients with MM and can assist with individualized treatment guidance. However, our study had some limitations. First, it only preliminarily examined the expression characteristics and prognostic predictive value of NRGs. Second, in vitro and in vivo experiments exploring the regulatory role of NRGs in MM cells were not performed. Third, clinical reality cohorts that can be used to validate the prognostic predictive ability of the risk model were not included. Moreover, this study was limited to exploring the biological value of necroptosis in MM and lacked a systematic analysis of the connection and mechanism of multiple cell death models. Therefore, more relevant studies should be carried out in the future to clarify the mechanism of necroptosis and other cell death modes in MM.
Conclusion
Based on a systematic analysis of NRGs, the necroptosis score was found to be associated with poor prognosis and immune disturbance in patients with MM. Moreover, two necroptosis molecular subtypes (clusters A and B) significantly differed in terms of tumor microenvironment. According to the expression of NRGs, a risk score model was established and validated in multiple MM cohorts, which can effectively predict the prognosis of MM patients. Through drug prediction and cell experiments, we obtained a group of drugs with potential therapeutic value for MM, thereby guiding individualized treatment of MM patients. In conclusion, the novel necroptosis-related signature we identified has clinical value in prognostic prediction and treatment decision-making in MM.
Supplemental Material
sj-xlsx-1-tct-10.1177_15330338241232554 - Supplemental material for A Novel Necroptosis-Related Signature Can Predict Prognosis and Chemotherapy Sensitivity in Multiple Myeloma
Supplemental material, sj-xlsx-1-tct-10.1177_15330338241232554 for A Novel Necroptosis-Related Signature Can Predict Prognosis and Chemotherapy Sensitivity in Multiple Myeloma by Jun-Yao Jiang, Fang-Yi Yao, Jing Liu, Xin-Lu Wang, Bo Huang, Fang-Min Zhong and Xiao-Zhong Wang in Technology in Cancer Research & Treatment
Footnotes
Abbreviations
Declaration of Conflicting Interests
The authors declared no potential conflicts of interest with respect to the research, authorship, and/or publication of this article.
Funding
The study was funded by National Natural Science Foundation of China (82160405) and the Natural Science Foundation of Jiangxi Province (20232BAB216037).
Ethics Approval
This study was approved by the Ethics Committee of the Second Affiliated Hospital of Nanchang University (No. review [2022] No. (103))
Supplemental Material
Supplemental material for this article is available online.
References
Supplementary Material
Please find the following supplemental material available below.
For Open Access articles published under a Creative Commons License, all supplemental material carries the same license as the article it is associated with.
For non-Open Access articles published, all supplemental material carries a non-exclusive license, and permission requests for re-use of supplemental material or any part of supplemental material shall be sent directly to the copyright owner as specified in the copyright notice associated with the article.