
Abstract
We sought to identify and validate a novel urinary autophagy transcript signature in patients with bladder cancer and evaluate its clinical utility. We performed an initial screening for seven autophagy transcript–based panel (autophagy-related protein 12 (ATG12); WD repeat domain, phosphoinositide interacting 2 (WIPI2); FYVE and coiled-coil domain-containing protein 1 (FYCO1); microtubule-associated protein light chain (MAPLC3); RB1-inducible coiled-coil 1 (RB1CC1); tachylectin-II-like beta-propeller domain 1 (TECPR1); and Unc-51-like kinase (ULK1)) that was identified based on bioinformatics analysis followed by SYBR Green–based polymerase chain reaction array validation in paired tissue and urine samples. Afterward, we evaluated the expression of differentially expressed autophagy transcripts in an independent validation set with reverse transcription quantitative real-time polymerase chain reaction in urine sediments of 140 patients with bladder cancer, 68 patients with benign urological lesions, and 74 healthy controls (age and sex matched). The expression levels of ATG12, FYCO1, TECPR1, and ULK1 in paired bladder tissue and urine samples were significantly lower in bladder cancer than in control group (p < 0.001). In the validation set, the receiver-operating characteristic curve analyses demonstrated that each urinary autophagy transcripts showed high sensitivity and specificity for distinguishing bladder cancer from non–bladder cancer patients (ATG12, 75.4% and 86.1%; FYCO1, 87% and 75.7%; ULK1, 85.5% and 75.6%; and TECPR1, 90% and 81.9%). We document and validate a novel autophagy transcript signature for human bladder cancer diagnosis: bilharzial and non-bilharzial types.
Introduction
Bladder cancer (BC) is the one of the most common cancers worldwide ranking the seventh in men world wide. 1 BC accounted for 3% of all cancer costs in the European Union due to its high recurrence rate 2 with greater economic burden of BC is in Arab countries, particularly Egypt, due to younger median age of diagnosis than in the West. 3 Urine-based assays represent holy grail of cancer research that can detect BC non-invasively with high potential to reduce traditional procedures. 4
Recent studies suggested a crucial role of autophagy-related genes (Atgs) and apoptosis in the development of cancer, including that of the bladder. 5 However, validation of these results is still defective. Autophagy is a general term for the degradation of long-lived proteins and organelles. Autophagy includes three main steps: initiation, elongation, and maturation. 6 Each step is regulated by specific Atgs like Beclin-1, WIPI2, FYCO1, MAPILC3B, RB1CC1, TECPR1, and ULK1. 7 Autophagy share in tumor suppression during the early stage of cancer development and tumor progression during the late stage of tumorigenesis. 8 Because autophagy occurs in normal urothelial cells and in fact may be an important mechanism to prevent cell damage, the extent of completion of autophagic destruction of cells may be critical in limiting damage to normal cells and their recovery following inhibition of autophagy. 9
On these grounds, we thought to retrieve Atgs specific to BC through in silico data analysis followed by comparing their expression in paired urine and tissue samples from BC patients with that of cancer-free controls by SYBR Green–based polymerase chain reaction (PCR) array in an initial screening group. Then, we evaluated the clinical utility of the selected autophagy transcript panel in another validation cohort.
Patients and methods
Patients and clinical samples
Initial screening group
In this study, 30 matched tissue and urine samples were obtained during transurethral resection of the bladder. One portion of tissue was taken from the suspected bladder lesion and another from grossly tumor-free region with a macroscopical safety margin of 0.5 cm to the tumor. In addition, the patients were requested to supply about 50 mL of urine before any intervention.
Validation group
We assessed sera and voided urine samples obtained from 208 patients. Clinical and laboratory data for all participants were recorded (Table 1). Study groups included 140 patients with histologically confirmed BC and 68 age- and gender-matched patients who required cystoscopy for benign urologic conditions (benign prostatic hyperplasia and bilharzial cystitis). A group of 74 healthy volunteers with no previous history of gross hematuria, urolithiasis, or active urinary tract infection were also included in this study (Figure 1).
Study population demographic and clinical characteristics (N = 282).

UCC: urothelial cell carcinoma; SCC: squamous cell carcinoma; Others: adenocarcinoma and papillary carcinoma.
Highly significant correlation was detected between investigated groups at p < 0.001 using chi-square test.

A flowchart summarizing the study design.
Inclusion, exclusion criteria, and research ethics
All patients’ samples were collected in the Urology Department, Faculty of Medicine, Ain Shams University Hospitals, Cairo, Egypt, between 2013 and 2015. The primary diagnosis of a suspicious bladder lesion by cystoscopy was the criterion for inclusion. After histopathological examination of resected tissue, only patients with confirmed BC or benign lesions were included. Patients with past history of BC with previous chemotherapy or any other types of cancer in the last 5 years were expelled from this study. Ain Shams Research Ethical Committee approved this work, and all participants signed informed consents.
Sample collection and processing
Tissue specimens were transported in liquid nitrogen and stored at −80°C. Tumor staging was performed according to the American Joint Committee on Cancer–Union Internationale Contre le Cancer tumor-node metastasis classification and histologically graded by a specialist uropathologist. 10
All subjects provided around 50 mL voided urine before any surgical intervention. Samples were centrifuged and pellets were washed with phosphate-buffered saline.11 Part of the pellet was processed for cytology by an experienced examiner. Another portion of the pellet was treated with RNA later (Quiagen, USA) and stored at −80°C for further processing. We used Cellognost® Schistosomiasis H kit (Dade Behring, Germany) to detect Schistosomiasis antibodies in sera samples.12
Bioinformatic analysis to retrieve BC-Atgs based on earlier microarray results
We used public microarray to look for autophagy genes related to BC throughout protein atlas database, available at http://www.proteinatlas.org/; Genatlas at Paris Descartes University database, available at http://genatlas.medecine.univ-paris5.fr/; and Exocarta database, available at http://exocarta.org/gene_summary?gene_id=3920 to perform analysis of tissue specificity. The three databases confirmed the correlation between the seven selected autophagy deregulated genes and BC development with higher ranking score. Finally, we performed bioinformatic validation of the chosen autophagy genes related to BC by biomedical knowledge discovery server (Biograph). 13
Clinical validation of the selected autophagy genes as biomarkers of BC
Total RNA extraction and reverse transcription from urine pellet and tissue samples in the initial screening and validation groups
We used Qiagen RNeasy Kit (Qiagen Inc., USA) to extract total RNA from tissue samples and pellets as per the manufacturer’s recommendations. The RNA quality and concentration were confirmed in a NanoDrop 2000 (Thermoscientific, USA) with A260/A280 ratio must be between 1.8 and 2. 14 A total of 200 ng of RNA was immediately used to generate complementary DNA (cDNA) using QuantiTect® Reverse Transcription kit (Quiagen, Germany) according to the manufacturer’s instructions.
Autophagy gene measurement by real-time PCR array in the initial screening group
We mixed the synthesized cDNAs with miScript SYBR Green PCR Kit and dispensed them into a 96-well custom SYBR green–based PCR Array (Qiagen/SABiosciences). The PCR array included primers for seven human autophagy transcripts (autophagy-related protein 12 (ATG12); WD repeat domain, phosphoinositide interacting 2 (WIPI2); FYVE and coiled-coil domain-containing protein 1 (FYCO1); microtubule-associated protein light chain (MAPLC3); RB1-inducible coiled-coil 1 (RB1CC1); tachylectin-II-like beta-propeller domain 1 (TECPR1); and Unc-51-like kinase (ULK1)), and glyceraldehyde 3-phosphate dehydrogenase (GAPDH) as an internal control. The real-time quantitative reverse transcription polymerase chain reaction (qRT-PCR) was done with the following cycling conditions: 95°C for 10 min, then 40 cycles of 95°C for 15 s, 55°C for 30 s, and 70°C for 30 s. The threshold cycle (Ct) value was estimated using Step One Plus™ software v2.2.2 (Applied Biosystems, Foster City, CA). To confirm the specificities of the produced amplicons, Tm values and amplification plots were employed.
Calculation of results of autophagy transcript in tissue and urine samples
We used comparative Ct method to calculate the level of autophagy transcript in tissue and urine samples, 15 which is the relative value of patient results to the average value of control. GAPDH having a constant and high expression was used as a house keeping gene (Ct mean ± standard deviation: 18.3 ± 2.5), where Ct is the threshold cycle. ΔΔCt equals ΔCt of the sample gene minus the mean ΔCt of control and fold change = 2−ΔΔCt
Urinary autophagy transcript detection using real-time PCR in clinical validation group
cDNAs was diluted to one-fifth with RNase-free water before real-time PCR reaction. The latter was done using the RT2 SYBR Green PCR Kit (Qiagen) with RT2 qPCR Primer Assay specific for (Human ATG12, FYCO1, TECPR1, and ULK1 mRNA; Quiagen, Germany) (NM_004707, NM_024513, NM_015395, and NM_003565, respectively). Each reaction was performed in triplicate using GAPDH (NM_002046) as a normalization control. Each reaction included 2 µL of each primer, 2 µL cDNA and 1× RT2 SYBR Green PCR Master Mix (Qiagen) in a 25-µL volume tubes. PCR cycles were as follows: denaturation at 95°C for 15 min, followed by 40 cycles of denaturation for 10 s at 94°C, annealing for 30 s at 55°C, and extension for 34 s at 70°C.
Statistical analysis
Associations between clinicopathological factors and the autophagy transcript markers were evaluated by Kruskal Wallis, chi-square, or Mann–Whitney U test. We performed a receiver-operating characteristic (ROC) curve 16 to identify the optimal cutoff which maximizes the sum of sensitivity and specificity of each biomarker. 17 Spearman’s rank correlation was used to investigate the inter-relation between the autophagy transcript markers. Statistical significance was set at p < 0.05 and all tests were two sided. Statistical tests were done applying Statistical Package for the Social Sciences software (SPSS Version 21, USA).
Results
Patients
The demographic and clinical features of patients are presented in Table 1.
Initial screening group: validation of autophagy biomarkers in paired bladder tissue and urine samples
We used 30 paired malignant, non-malignant bladder tissue, and urine samples, for the initial validation of the identified autophagy biomarkers. We applied PCR array to screen for seven human autophagy transcripts (ATG12, WIPI, MAPLC3, RB1CC1, FYCO129c, TECPR1, and ULK1) (released by Gene atlas and Protein atlas databases). Comparing tumor and tumor-free tissue, lower expression was observed for ATG12, FYCO1, TECPR1, and ULK1 (all p < 0.05; Supplementary Table 1s). In addition, significant correlations between urinary and tissue level of ATG12, FYCO, TECPR1, and ULK1 were found (r = 0.513 0.571, 0.51, and 0.483, respectively, at p < 0.05) (Supplementary Table 2s). Initial screening revealed four significant biomarkers: ATG12, FYCO, TECPR1, and ULK1, which were further evaluated in urine samples of an independent clinical validation cohort.
Comparison of the urinary ATG12, FYCO, TECPR1, and ULK1 transcript levels among the investigated groups in the clinical validation cohort
Urinary autophagy transcript levels (fold change expression) in the malignant group showed lower expression of ATG12, FYCO, TECPR1, and ULK1 than in control group (p < .01), (Table 2). Moreover, these biomarkers were analyzed by ROC curves. The area under the curve of urinary ATG12, FYCO, TECPR1, and ULK1 was 0.879, 0.851, 0.891, and 0.822, respectively. At a cutoff level of 0.505, 0.991, 0.939, and 0.906, urinary ATG12, FYCO, TECPR1, and ULK1 had a sensitivity of 75.7%, 87.1%, 90%, and 84.3%, respectively, and specificity of 87.3%, 76.3%, 73.1%, and 73.2%, respectively, for the diagnosis of BC (Tables 2 and 3, Figure 2(a)–(d)). We observed a significant difference in autophagy transcript expression in relation to some of the clinicopathological parameters in BC group: ATG12 with stage; ULK1 with age, smoking, bilharziasis, and type; and TECPR1 with smoking, bilharziasis, type, stage, and grade (p < 0.05) (Table 4). In all study groups (n = 282), we explored the concordance between cytology findings and the expression of autophagy transcripts: ATG12, FYCO, TECPR1, and ULK1. The concordance rate was 59.5%, 58.5%, 56.7%, and 59.9%, respectively (Supplementary Table 3s). Finally, there were positive intercorrelations between urinary autophagy transcripts in all study population and in the malignant group (Supplementary Table 4s).
Differential expression of urinary autophagy transcript panel among the different investigated groups.

RQ: relative quantity; ATG12: autophagy-related protein 12; FYCO1: FYVE and coiled-coil domain-containing protein 1; TECPR1: tachylectin-II-like beta-propeller domain 1; ULK1: Unc-51-like kinase.
Kruskal Wallis test.
Positivity rates of urinary autophagy transcript panel among the different investigated groups.

ATG12: autophagy-related protein 12; FYCO1: FYVE and coiled-coil domain-containing protein 1; TECPR1: tachylectin-II-like beta-propeller domain1; ULK1: Unc-51-like kinase.
Significant difference was detected between investigated groups at p < 0.01 using chi-square test.

(a) ROC curve analysis for urinary ATG12 mRNA to calculate the best cutoff point that discriminates between malignant and non-malignant groups. Best cutoff point of ATG12 mRNA is 0.505 (sensitivity = 75.7% and specificity = 87.3%; area under the curve (AUC) (SE) = 0.879 (0.02); 95% confidence limits range = 0.839–0.919; p < 0.01). (b) ROC curve analysis for urinary FYCO1 mRNA. Best cutoff point of FYCO1 mRNA is 0.991 (sensitivity = 87.1% and specificity = 76.7%; AUC (SE) = 0.851 (0.023); 95% confidence limits range = 0.806–0.896; p < 0.01). (c) ROC curve analysis for urinary TECPR1 mRNA. Best cutoff point of TECPR1 mRNA is 0.906 (sensitivity = 90% and specificity = 83.1%; AUC (SE) = 0.891 (0.019); 95% confidence limits range = 0.853–0.929; p < 0.01). (d) ROC curve analysis for urinary ULK1 mRNA. Best cutoff point of ULK1 mRNA is 0.939 (sensitivity = 84.3% and specificity = 73.2%; AUC (SE) = 0.822 (0.025); 95% confidence limits range = 0.774–0.871; p < 0. 01).
Relation between investigated urinary autophagy transcript panel and clinicopathological factors of bladder cancer patients.

ATG12: autophagy-related protein 12; FYCO1: FYVE and coiled-coil domain-containing protein 1; TECPR1: tachylectin-II-like beta-propeller domain1; ULK1: Unc-51-like kinase.
Significant difference was detected between investigated groups at p < 0.001 using achi-square test and bnon-parametric test.
Highly significant correlation was detected between investigated groups at p < 0.001.
Relation of urinary autophagy transcript level to bilharziasis
RQ mean rank of the ULK1 and TECPR were notably lower in the patient with bilharziasis versus those without bilharziasis (57 versus 78.4, p = 0.002) and bilharzial malignant versus bilharzial benign (Table 5). Interestingly, all 14 bilharzial benign cases expressed the four transcripts as shown in Supplementary Table 5s.
Positivity rates of urinary autophagy transcript panel in bladder cancer in relation to bilharziasis.
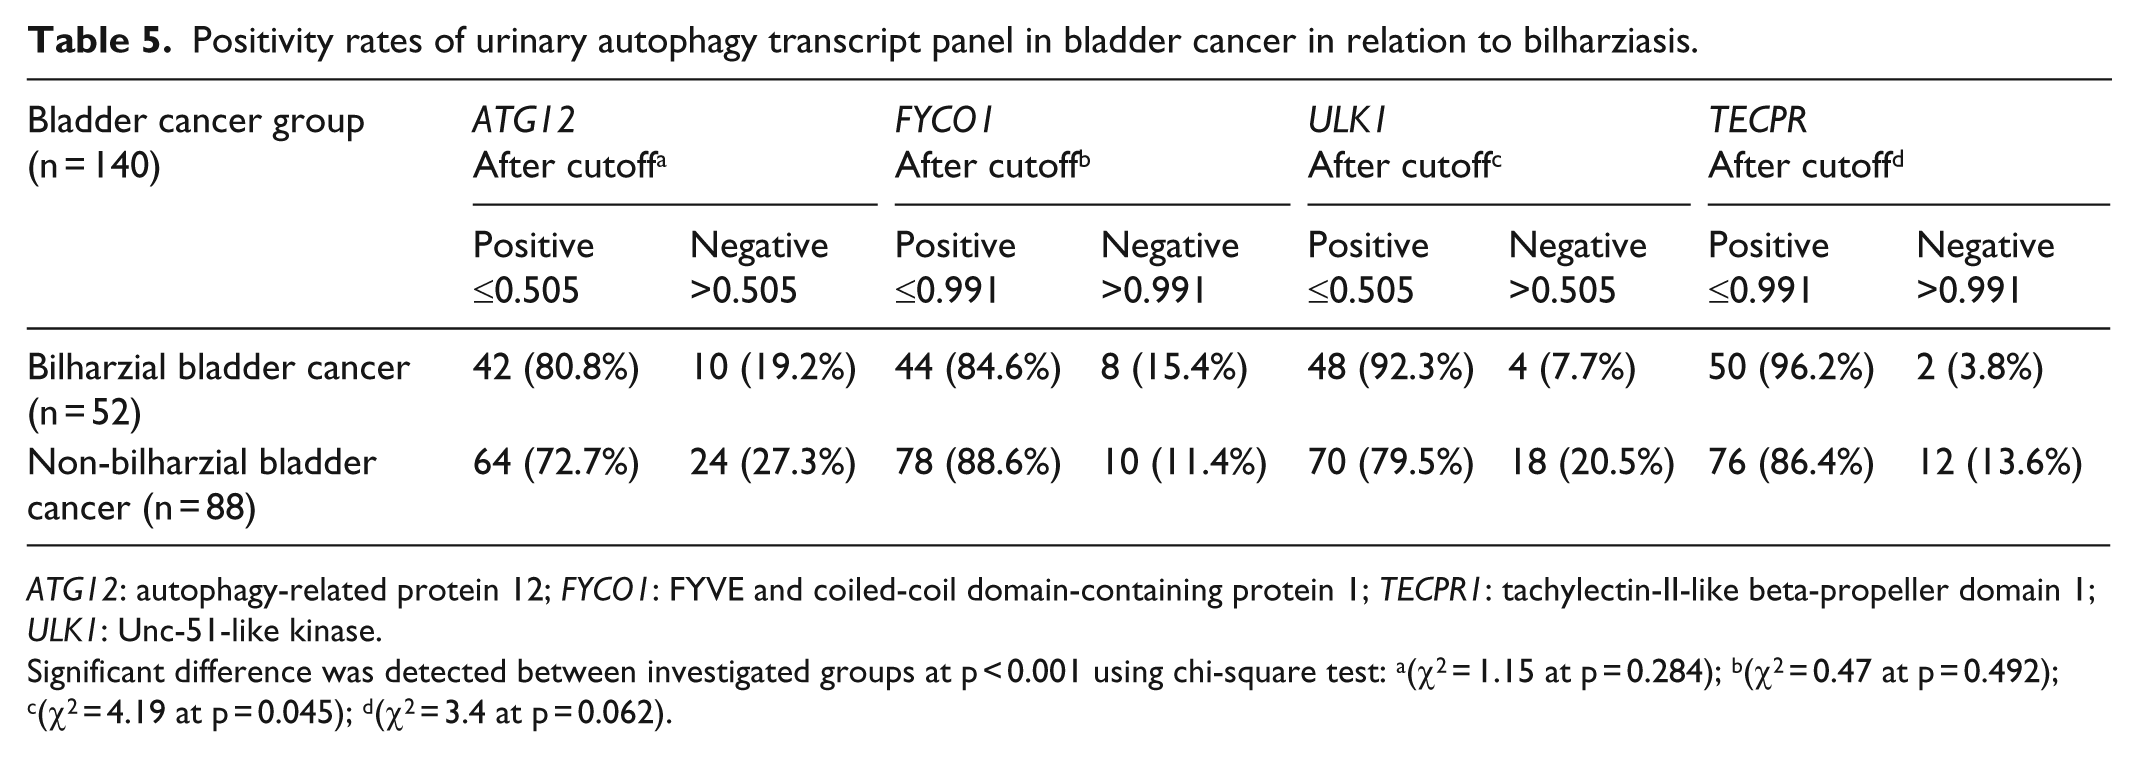
ATG12: autophagy-related protein 12; FYCO1: FYVE and coiled-coil domain-containing protein 1; TECPR1: tachylectin-II-like beta-propeller domain 1; ULK1: Unc-51-like kinase.
Significant difference was detected between investigated groups at p < 0.001 using chi-square test: a(χ2 = 1.15 at p = 0.284); b(χ2 = 0.47 at p = 0.492); c(χ2 = 4.19 at p = 0.045); d(χ2 = 3.4 at p = 0.062).
Clinical utility of urinary autophagy transcript panel in diagnosis of BC
The diagnostic efficiency of autophagy transcripts was analyzed using the fold change in their expression (relative quantification (RQ)). Their accuracy varied from 79.4%, 80.8%, 81.2%, to 85.8% for (ULK1, ATG12, FYCO, and TECPR1, respectively). TECPR1 mRNA had the best diagnostic power with high sensitivity, specificity, positive and negative predictive values (90%, 81.9%, 82.7%, and 89.4%, respectively), It had the superior sensitivity and specificity even in early stages of BC. The combination of urinary autophagy transcript panel with urine cytology increased the sensitivity to 100% as shown in Table 6.
Overall sensitivity, specificity, positive predictive value (PPV), negative predictive value (NPV), and accuracy of investigated urinary autophagy transcript panel and cytology in detecting bladder carcinoma, superficial bladder cancer, and low grade bladder cancer when tested independently or in combination.

ATG12: autophagy-related protein 12; FYCO1: FYVE and coiled-coil domain-containing protein 1; ULK1: Unc-51-like kinase; TECPR1: tachylectin-II-like beta-propeller domain 1; Sens: sensitivity; Spec.: specificity; Acc.: accuracy.
Discussion
Because recent exploration of expression data has enabled the emergence of several tumor-specific genes, we have made an effort to identify novel markers highly specific to BC based on expression databases. 18 Public microarray databases and reconfirmation of the expression pattern with different platforms increased the accuracy of our screening. Accordingly, we identified six downregulated autophagy transcripts specific to human BC. We validated their expression in paired bladder tissue and urine samples to verify the tissue origin of the urinary autophagy transcript and to choose the genes with higher differential expression among the study groups. Afterward, we evaluated their clinical utility in another independent cohort. Our preliminary results showed autophagy transcript–based biomarker panel (ATG12, FYCO1, TECPR1, and ULK1) in voided urine sediment is very sensitive and specific in the diagnosis of BC. Among these four autophagy transcripts, TECPR1 provided the highest diagnostic power for detection of BC (area under the curve (AUC) = 0.891; sensitivity, 90%; and specificity, 81.9%), which is far superior than cytology and currently used urine markers, for example, FDP, NMP22, and BTA. 19 Furthermore, use of the four transcripts panel and cytology in combination could provide 100% sensitivity in detection of BC. Because its diagnostic performance was not influenced by inflammation, and other benign genitourinary conditions, this panel could have important implications during postoperative surveillance of BC.
Recently, much attention has been given to autophagy and focused on developing biomarkers, but only a few of autophagy-related genes have been recognized as molecular biomarkers especially in cancer diagnostics. 20 In this concern, we identified four autophagy transcripts regulating the three main steps of autophagy: initiation, elongation, and maturation as a novel panel for diagnosis of BC. ULK1, a serine/threonine protein kinase, is essential for the initial stages of autophagy 21 and its expression is associated with a poor prognosis in breast cancer. 22 However, ULK1 inhibitor was found to be more effective in inducing apoptosis in cancer than the general autophagy inhibitor. 23
The elongation of the initial autophagic membrane requires the participation of many autophagy-related proteins especially ATG5–ATG12 through a ubiquitin-like conjugation system. 24 ATG12 and ATG3 have distinct roles in basal autophagic flux and controlling late endosome function. 25 Several studies identified accumulation of ATG12 with different bioactive compounds that could be used in cancer chemoprevention.26,27 ATG12 was upregulated after baicalin induced autophagy in human BC T24 cells. 9 On the other side, knockdown of ATG12 triggered cytotoxicity in multiple human bladder cell lines. 20
TECPR1 appears to have a crucial role in autophagosome maturation and fusion with the lysosome. 28 It binds ATG5 and WIPI2 and promotes ATG12–ATG5 conjugation. 29 Elevated expression of TECPR1 was reported as a potential marker for prostate cancer. 30
FYCO1 is a late effector of autophagy that is required for maturation of autophagosomes. 31 It was reported as one of the key genes involved in adenoma to carcinoma transition in colorectal cancer. 32 In addition, it is overexpressed in aggressive breast cancer cell lines. 33
The four investigated autophagy transcripts showed strong positive intercorrelations (p < 0.01) indicating their possible synergistic action in BC pathogenesis (Supplementary Table 4s).
Protein turnover in the schistosome was linked to proteasome ubiquitin pathway, which was shown to play important roles in egg biology. 34 To the best of our knowledge, this study is the first identifying autophagy transcripts (ATG12, FYCO1, TECPR1, and ULK1) in bilharzial BC versus non-bilharzial cases. The significant downregulation of ULK1 and TECPR in bilharzial BC indicates the bilharzial possible role in bladder carcinogenesis via dysregulation of autophagy transcripts.
Conclusion
We documented the discovery and validation of a novel urinary autophagy transcript biomarker panel for BC diagnosis both bilharzial and non-bilharzial types. This panel consists of four biomarkers with superior sensitivity and specificity than that of the commonly used non-invasive diagnostic assays for BC.
Footnotes
Acknowledgements
S.E. has participated in the design of the study, carried out data analysis, involved in drafting the manuscript or revising, and has given final approval of the version to be published. M.M. has performed bioinformatic analysis and practical work, participated in the design of the study and in drafting the manuscript, and performed the statistical analysis. N.A. participated in cytological examination of the urine samples. Y.K. has provided us with urine samples, blood samples, and patient data and has given final approval of the version to be published. All authors read and approved the final manuscript. All data generated or analyzed during this study are included in this published article (and its supplementary information files).
Declaration of conflicting interests
The author(s) declared no potential conflicts of interest with respect to the research, authorship, and/or publication of this article.
Ethics approval and consent to participate
Ain Shams Research Ethical Committee approved this work, and all participants signed informed consents.
Funding
This work was supported by Ain Shams University Research Projects 2015–2016.
References
Supplementary Material
Please find the following supplemental material available below.
For Open Access articles published under a Creative Commons License, all supplemental material carries the same license as the article it is associated with.
For non-Open Access articles published, all supplemental material carries a non-exclusive license, and permission requests for re-use of supplemental material or any part of supplemental material shall be sent directly to the copyright owner as specified in the copyright notice associated with the article.