
Abstract
BACKGROUND:
MicroRNAs (miRNAs) capable of post-transcriptionally regulating mRNA expression are essential to tumor occurrence and progression.
OBJECTIVE:
This study aims to find negatively regulatory miRNA-mRNA pairs in prostate adenocarcinoma (PRAD).
METHODS:
Combining The Cancer Genome Atlas (TCGA) RNA-Seq data with Gene Expression Omnibus (GEO) mRNA/miRNA expression profiles, differently expressed miRNA/mRNA (DE-miRNAs/DE-mRNAs) were identified. MiRNA-mRNA pairs were screened by miRTarBase and TarBase, databases collecting experimentally confirmed miRNA-mRNA pairs, and verified in 30 paired prostate specimens by real-time reverse transcription polymerase chain reaction (RT-qPCR). The diagnostic values of miRNA-mRNA pairs were measured by receiver operation characteristic (ROC) curve and Decision Curve Analysis (DCA). DAVID-mirPath database and Connectivity Map were employed in GO/KEGG analysis and compounds research. Interactions between miRNA-mRNA pairs and phenotypic features were analyzed with correlation heatmap in hiplot.
RESULTS:
Based on TCGA RNA-Seq data, 22 miRNA and 14 mRNA GEO datasets, 67 (20 down and 47 up) miRNAs and 351 (139 up and 212 down) mRNAs were selected. After screening from 2 databases, 8 miRNA (up)-mRNA (down) and 7 miRNA (down)-mRNA (up) pairs were identified with Pearson’s correlation in TCGA. By external validation, miR-221-3p (down)/GALNT3 (up) and miR-20a-5p (up)/FRMD6 (down) were chosen. The model combing 4 signatures possessed better diagnostic value. These two miRNA-mRNA pairs were significantly connected with immune cells fraction and tumor immune microenvironment.
CONCLUSIONS:
The diagnostic model containing 2 negatively regulatory miRNA-mRNA pairs was established to distinguish PRADs from normal controls.
Introduction
According to the global cancer statistics estimated by the World Health Organization (WHO) for male in 2020, the incidence and mortality of prostate adenocarcinoma (PRAD) ranked second and fifth respectively [1]. In the past few decades, extensive screening based on prostate-specific antigen (PSA) has largely improved early detection of prostate cancer, thus decreasing prostate cancer mortality [2]. However, PSA-based screening was not recommended in men over 70 years by US Preventive Services Task Force because of higher risk of overdiagnosis and overtreatment, which may bring about urinary incontinence and erectile dysfunction [3]. Since then, finding biomarkers with better diagnostic efficacy and prognostic evaluation is of great significance.
MicroRNAs (MiRNAs) contain approximately 22-nucleotide-long small noncoding RNAs, which play an crucial role in GENE regulatory networks by forming imperfect binding with the message RNA(mRNA) 3’-untranslated region (3’-UTR) [4]. MiRNA-mRNA interactions are widely involved in the occurrence and development of various tumors. For instance, miR-125a-3p targeting at RHOA promotes epithelial-mesenchymal transition in pancreatic cancer [5]. Mi RNA-mRNA interaction pairs, such as miR-135a-3p targeting at HOXD10, miR-371a-3p targeting at CACNA1D together with miR-106a-5p targeting at miR-106a-5p, participated in the complex molecules of prostate cancer [6]. Dysregulation of miR-193a-5p/TP73 pair and miR-188-5p/UBE2I pair also indicate tumor progression and poor prognosis in PRAD patients [7]. Thus, defining more reliable and effective biomarkers such as miRNA-mRNA pairs is promising in diagnosis and prognosis of prostate cancer.
Obtaining expression patterns from high throughput sequencing and microarrays is now recognized as a widely-applied and mature technology in acquiring more global views on miRNA or genes expression in tumor [8]. A total of 67 (20 down & 47 up) miRNAs and 351 (139 up & 212 down) mRNAs were selected by analyzing The Cancer Genome Atlas (TCGA) RNA-Seq data, 22 miRNA and 14 mRNA Gene Expression Omnibus (GEO) datasets. After screening from miRTarBase and TarBase, 8 miRNA (up)-mRNA (down) and 7 miRNA (down)-mRNA (up) pairs were identified with Pearson’s correlation analysis, the expression of which were detected in 30 paired prostate specimens by reverse transcription quantitative real-time PCR (RT-qPCR). Via performing Wilcoxon test, miR-221-3p (down)/GALNT3 (up) and miR-20a-5p (up)/FRMD6 (down) were chosen. Clinical analysis and survival analysis were performed to evaluate whether these miRNA-mRNA pairs could be indicators of diagnosis and prognosis in prostate cancer. Finally, correlation analysis was carried out between TCGA clinical phenotype data composed of immune microenvironment, tumor infiltrating immune cells, global methylation and tumor mutational burden and the two pairs of miRNA-mRNA expression data.
In the past decades, a variety of biomarkers have been employed in the diagnosis and prognosis prediction of prostate cancer. Although some researchers have performed differential expression analysis of miRNAs and mRNAs in prostate cancer, this study is the first to include 36 GEO datasets and TCGA databases to define the differential expression profiles. Our researches based on massive gene expression profiles and bioinformatic analysis and RT-qPCR may shed new light on the detailed mechanism in PRAD pathogenesis. Dysregulated miRNA-mRNA pairs may become underlying prognostic biomarkers and novel therapy target.
Materials and method
Data collection and processing
The flow chart showed the processes for identifying the negatively miRNA-mRNA regulatory pairs and conducting extensive analysis of pairs in prostate cancer.
Totally 22 gene expression profiles and 14 miRNA expression profiles were downloaded from the Gene Expression Omnibus database (GEO,
In this study, Gene oncology (GO) and Kyoto Encyclopedia of Genes and Genomes (KEGG) analyses of DE-miRNAs and DE-mRNAs were conducted by DAVID-mirPath [13] and the cluster Profiler tool on Hiplot (
Forecasting of miRNA-mRNA interaction
We combined miRTarBase (
Sample collection
30 paired Formalin-Fixed and Paraffin-Embedded (FFPE) samples of PRAD tissues and adjacent normal prostate tissues were taken from patients undergoing surgery at the First Affiliated Hospital with Nanjing Medical University, the clinical features of which were presented in Table 1. All patients did not receive any chemotherapy or radiotherapy before their surgery. The study was conducted in accordance with the guidelines of the Hospital Ethics Committee and approved by the Institutional Review Boards of the First Affiliated Hospital of Nanjing Medical University (ID: 2016-SRFA-148). This study was conducted in accordance with the Declaration of Helsinki. All patients were informed about the study and invited to participate. All patients signed an informed consent statement before starting the study.
Clinicopathological and molecular features of prostate cancer patients
Clinicopathological and molecular features of prostate cancer patients
FFPE tissues were stored at 20
Estimation of miRNA-mRNA interactions with tumor-related phenotypes
CIBERSORT was adopted to estimate the proportion of 22 immune cell types in tumor samples by conducting deconvolution analysis with gene expression data (
Diagnostic effectiveness evaluation and overall survival analysis
The gene expression pattern and survival information of PRAD patients downloaded from TCGA database was analyzed to estimate the prediction probability. The Kaplan-Meier analysis and the receiver operation characteristic (ROC) curve were performed by Hiplot (
Statistically analysis
SPSS Statistics 26.0 (IBM, New York, USA), GraphPad prism 8.0.1 and R language v4.0.1 (
Results
Identification of DE-mRNAs and DE-miRNAs
(A) The circular bar-plot exhibited the detailed information of 36 GEO datasets. Among the 22 datasets using mRNA microarray, 20 were drawn from tissues, 1 from cultured tumors cells and normal tissues (GSE34312) and 1 from circulating tumor cells (GSE153514) and the remaining 14 miRNA expression profiles included 2 datasets from urine, 7 datasets from tissue, 4 datasets from serum and 1 dataset from plasm. (B) The negative regulatory relationship between 67 microRNAs (miRNAs) and 351 mRNAs were plotted. 118 miRNA (up)-mRNA (down) pairs and 13 miRNA (down)-mRNA (up) pairs were selected via TarBase and MiRTarBase. Orange nodes represent the upregulated miRNAs/mRNAs in PRADs versus NCs, while blue nodes represent the downregulated miRNAs/mRNAs in PRADs versus NCs.
Information pertaining to the selected GEO datasets for prostate cancer
As is exhibited in Fig. 2A, totally 14 miRNA expression microarray GEO datasets were selected out, of which 7 were drawn from tissues, 4 from serum, 2 from urine and 1 from plasm. Among these 14 databases, 108 decreased miRNAs were mentioned in 3 or more datasets and 166 increased miRNAs were mentioned in 4 or more datasets. As for mRNA expression profiling by microarray, 22 GEO databases matched the inclusion criteria, specimen of which are tumor tissues, cells cultured from tumors and circulating tumor cells. After comparing to normal samples, 184 upregulated genes appeared in 7 or more databases and 215 down-regulated mRNAs appeared in 9 or more databases. The detailed information of 36 GEO datasets is exhibited in Table 2. After integrating all the databases including GEO datasets, TCGA, dbDEMC, HMDD and miRCancer, 351 DE-mRNAs (139 up and 212 down) together with 67 DE-miRNAs (47 up and 20 down) were finally determined.
Outcomes of GO/KEGG analysis based on 47 upregulated miRNAs and 20 downregulated miRNAs were separately revealed in Table S2 and Table S3, ranked with counts as the primary keyword and
A total of 15 negatively miRNA-mRNA regulatory pairs validated by RT-qPCR in 30 paired FFPE samples were presented.
Pearson’s correlation analysis of miRNA-mRNA pairs in prostate cancers in TCGA
Pearson’s correlation analysis of miRNA-mRNA pairs in prostate cancers in TCGA
To explore the negative regulatory relationships between miRNA and mRNA, 67 DE-miRNAs (47 up and 20 down) were queried in TarBase and MiRTarBase. As is presented in Fig. 2B, 118 miRNA (up)-mRNA (down) pairs and 13 miRNA (down)-mRNA (up) pairs were screened after intersections of 351 DE-mRNAs and mRNAs targeted by DE-miRNAs. Pearson’s correlation conducted in TCGA database selected out 8 miRNA (up)-mRNA (down) pairs and 7 miRNA (down)-mRNA (up) pairs (shown in Fig. 3) with significant negative correlation listed in Table 3.
Pearson’s correlation analysis of miRNA-mRNA pairs in FFPE prostate cancer samples
Pearson’s correlation analysis of miRNA-mRNA pairs in FFPE prostate cancer samples
The expression of 10 DE-miRNAs and 10 DE-mRNAs were confirmed by ploy(A) tailing RT-PCR. (A) The mRNA expression levels of FRMD6, CAV1 and FBXO32 were downregulated, while the expression levels of GALNT3 and P4HB were upregulated. The miRNA expression levels of miR-205-5p and miR-20a-5p climbed while miR-378a-3p and miR-221-3p declined in PRADs. (B) Pearson’s correlation analysis of miRNA-mRNA regulatory pairs in 30 paired samples. MiR-221-3p/GALNT3 and miR-20a-5p/FRMD6 were the two negatively regulated pairs displayed in figure. Data are presented as mean 
Receiver operating characteristic (ROC) curves and decision curve analysis (DCA) were adopted to measure the ability of the complex predictive model including 4 signatures (miR-221-3p, GALNT3, miR-20a-5p and FRMD6) to distinguish PRAD samples from normal samples. (A) The ROC curves of 15 models, including 1 model containing all four signatures, 4 models containing three signatures, 6 models containing two signatures and 4 models containing one signature, were drawn with data of TCGA database. (B) The decision curve analysis (DCA) of 15 models were conducted in TCGA database and validation cohort containing 30 paired PRAD tissues by qRT-PCR.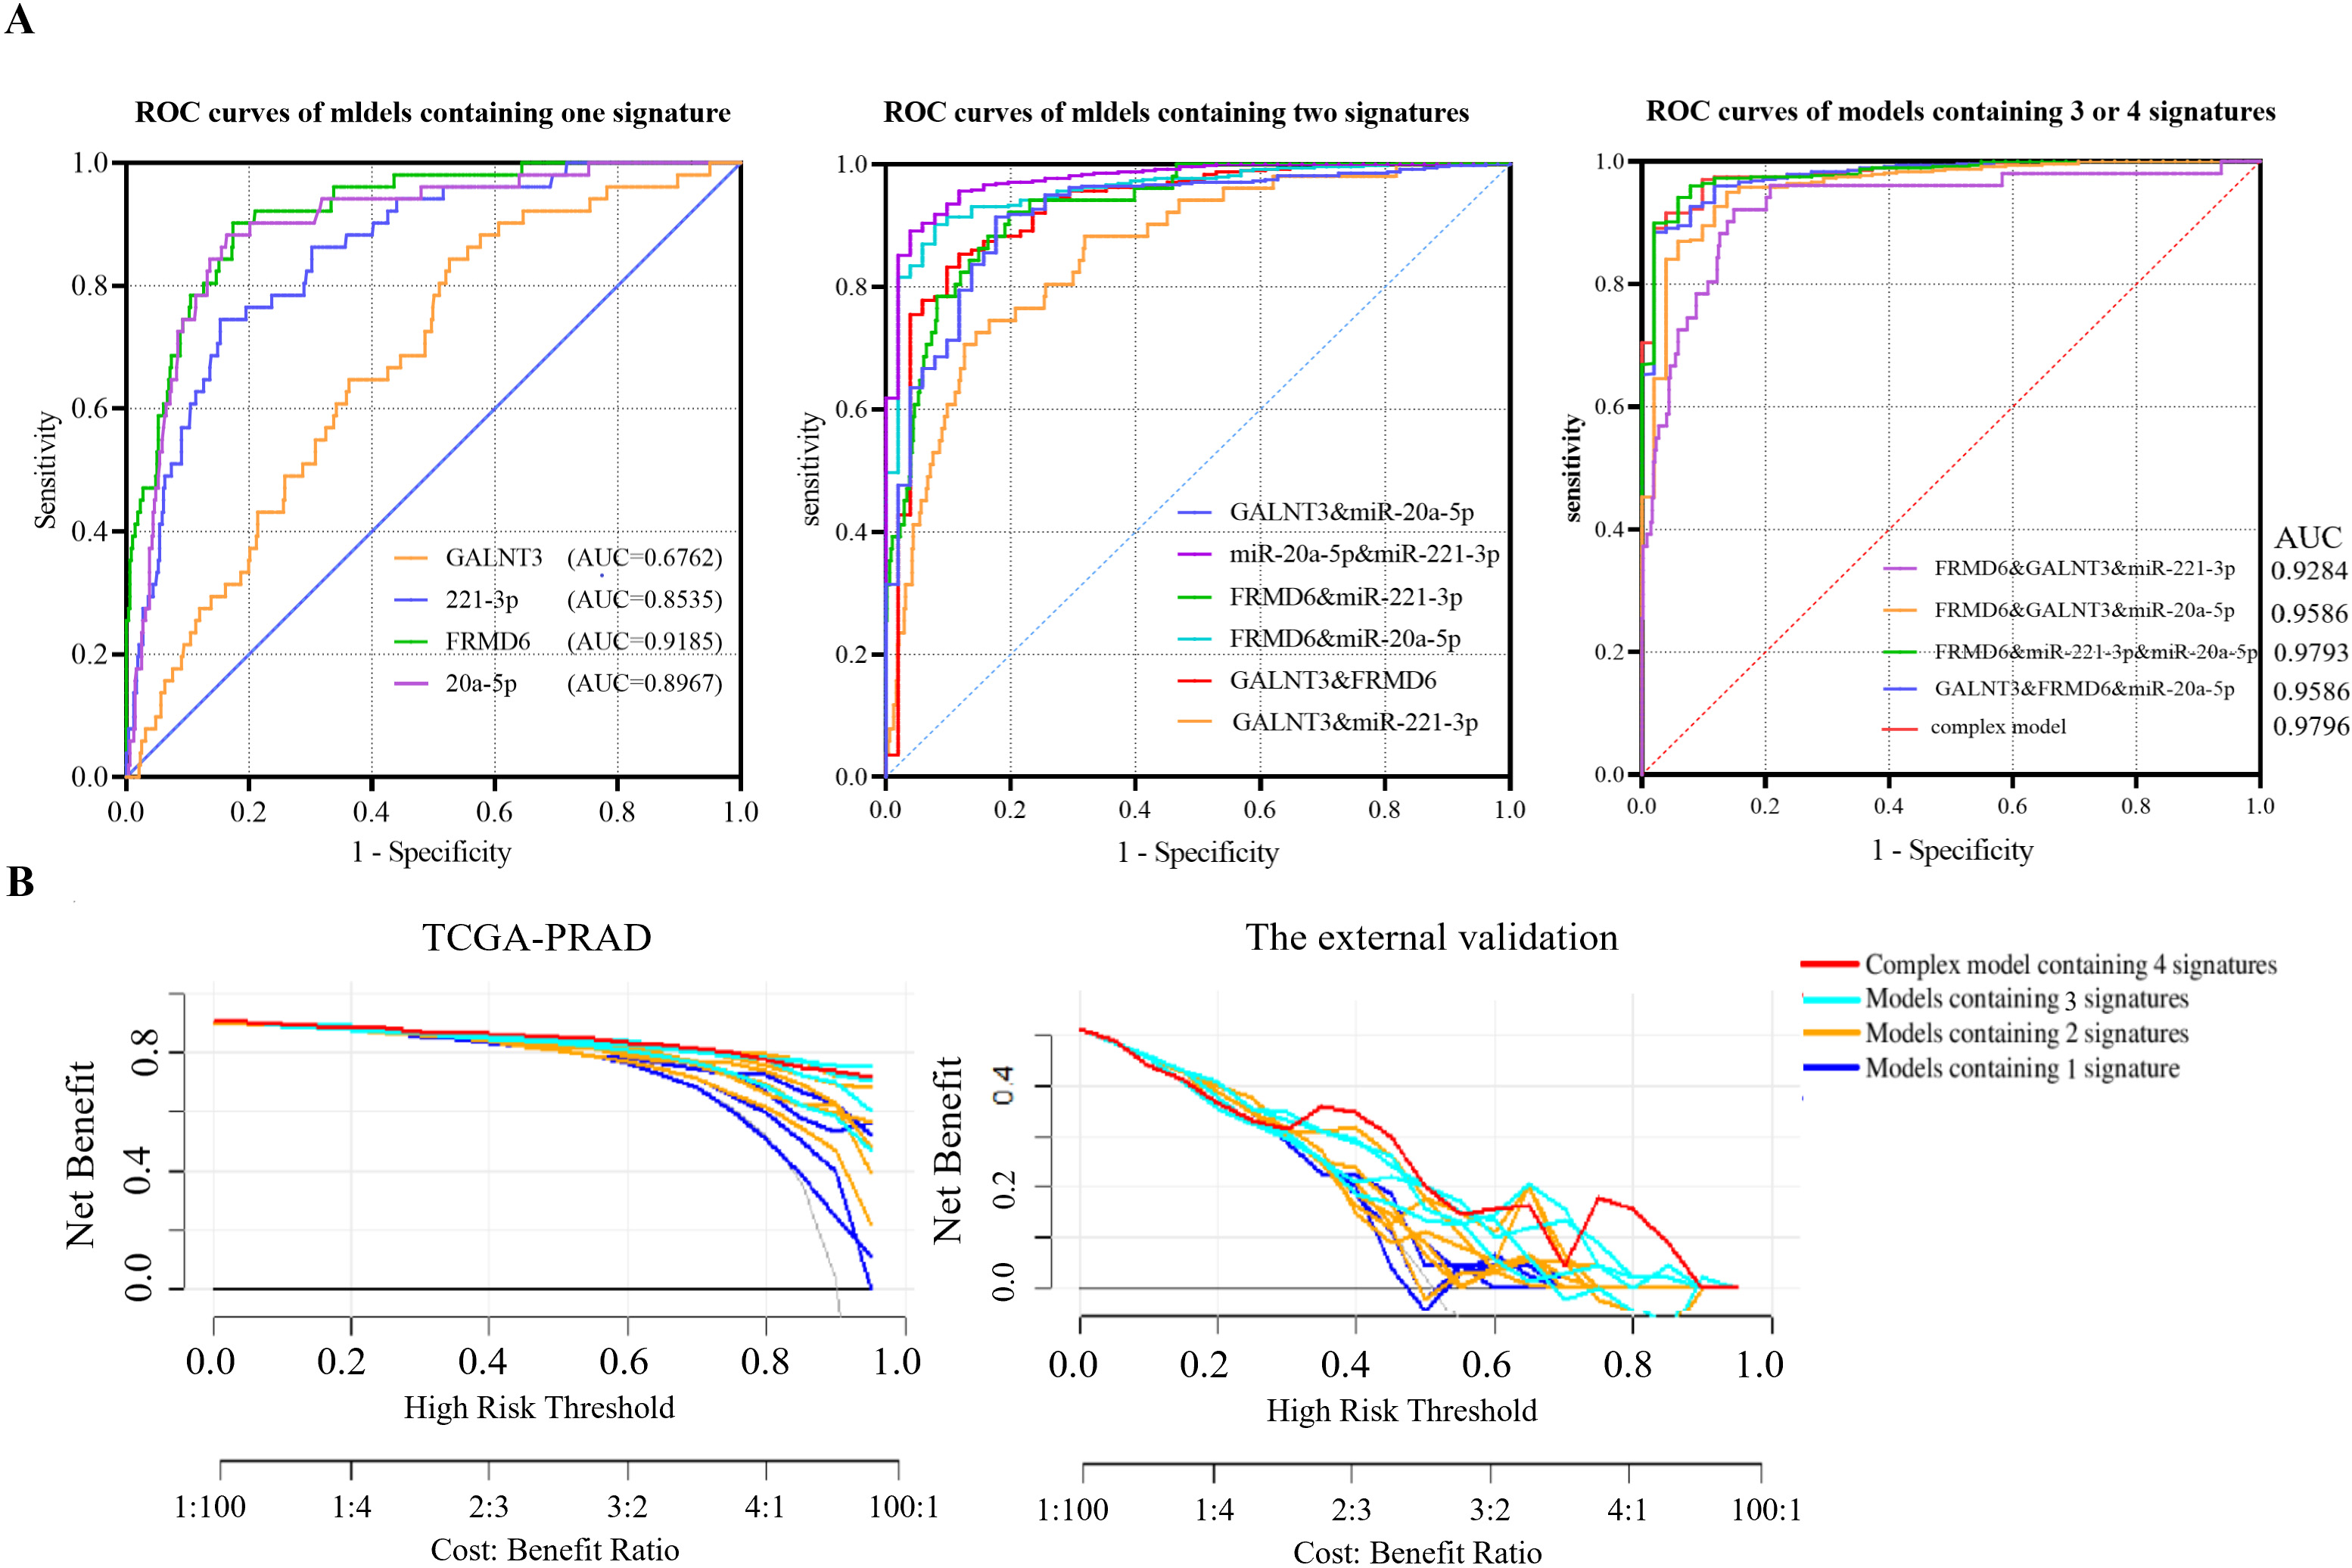
In this study, we measured the expression of 10 DE-mRNAs and 10 DE-miRNAs in 30 paired PRAD and normal tissue by poly(A) RT-qPCR. As is displayed in Fig. 4A, GALNT3 (
In present study, we estimated the prognostic value of a panel containing 2 miRNA-mRNA pairs: miR-221-3p/GALNT3 and miR-20a-5p/FRMD6. Receiver operating characteristic (ROC) curves and decision curve analysis (DCA) of 15 models based on logistic regression were displayed in Fig. 5. The areas under the curve (AUC) of the complex model (miR-221-3p, GALNT3, miR-20a-5p, FRMD6) calculated in TCGA-PRAD were 0.98 (95% CI: 0.9656 to 0.9936,
Comparing miRNA-mRNA expression level between clinical subgroups in PRAD
Expression level of miRNA-mRNA pairs were compared in groups divided according to clinical features of PRAD patients in TCGA database. (A) Expression level of has-miR-221-3p was higher in group “age 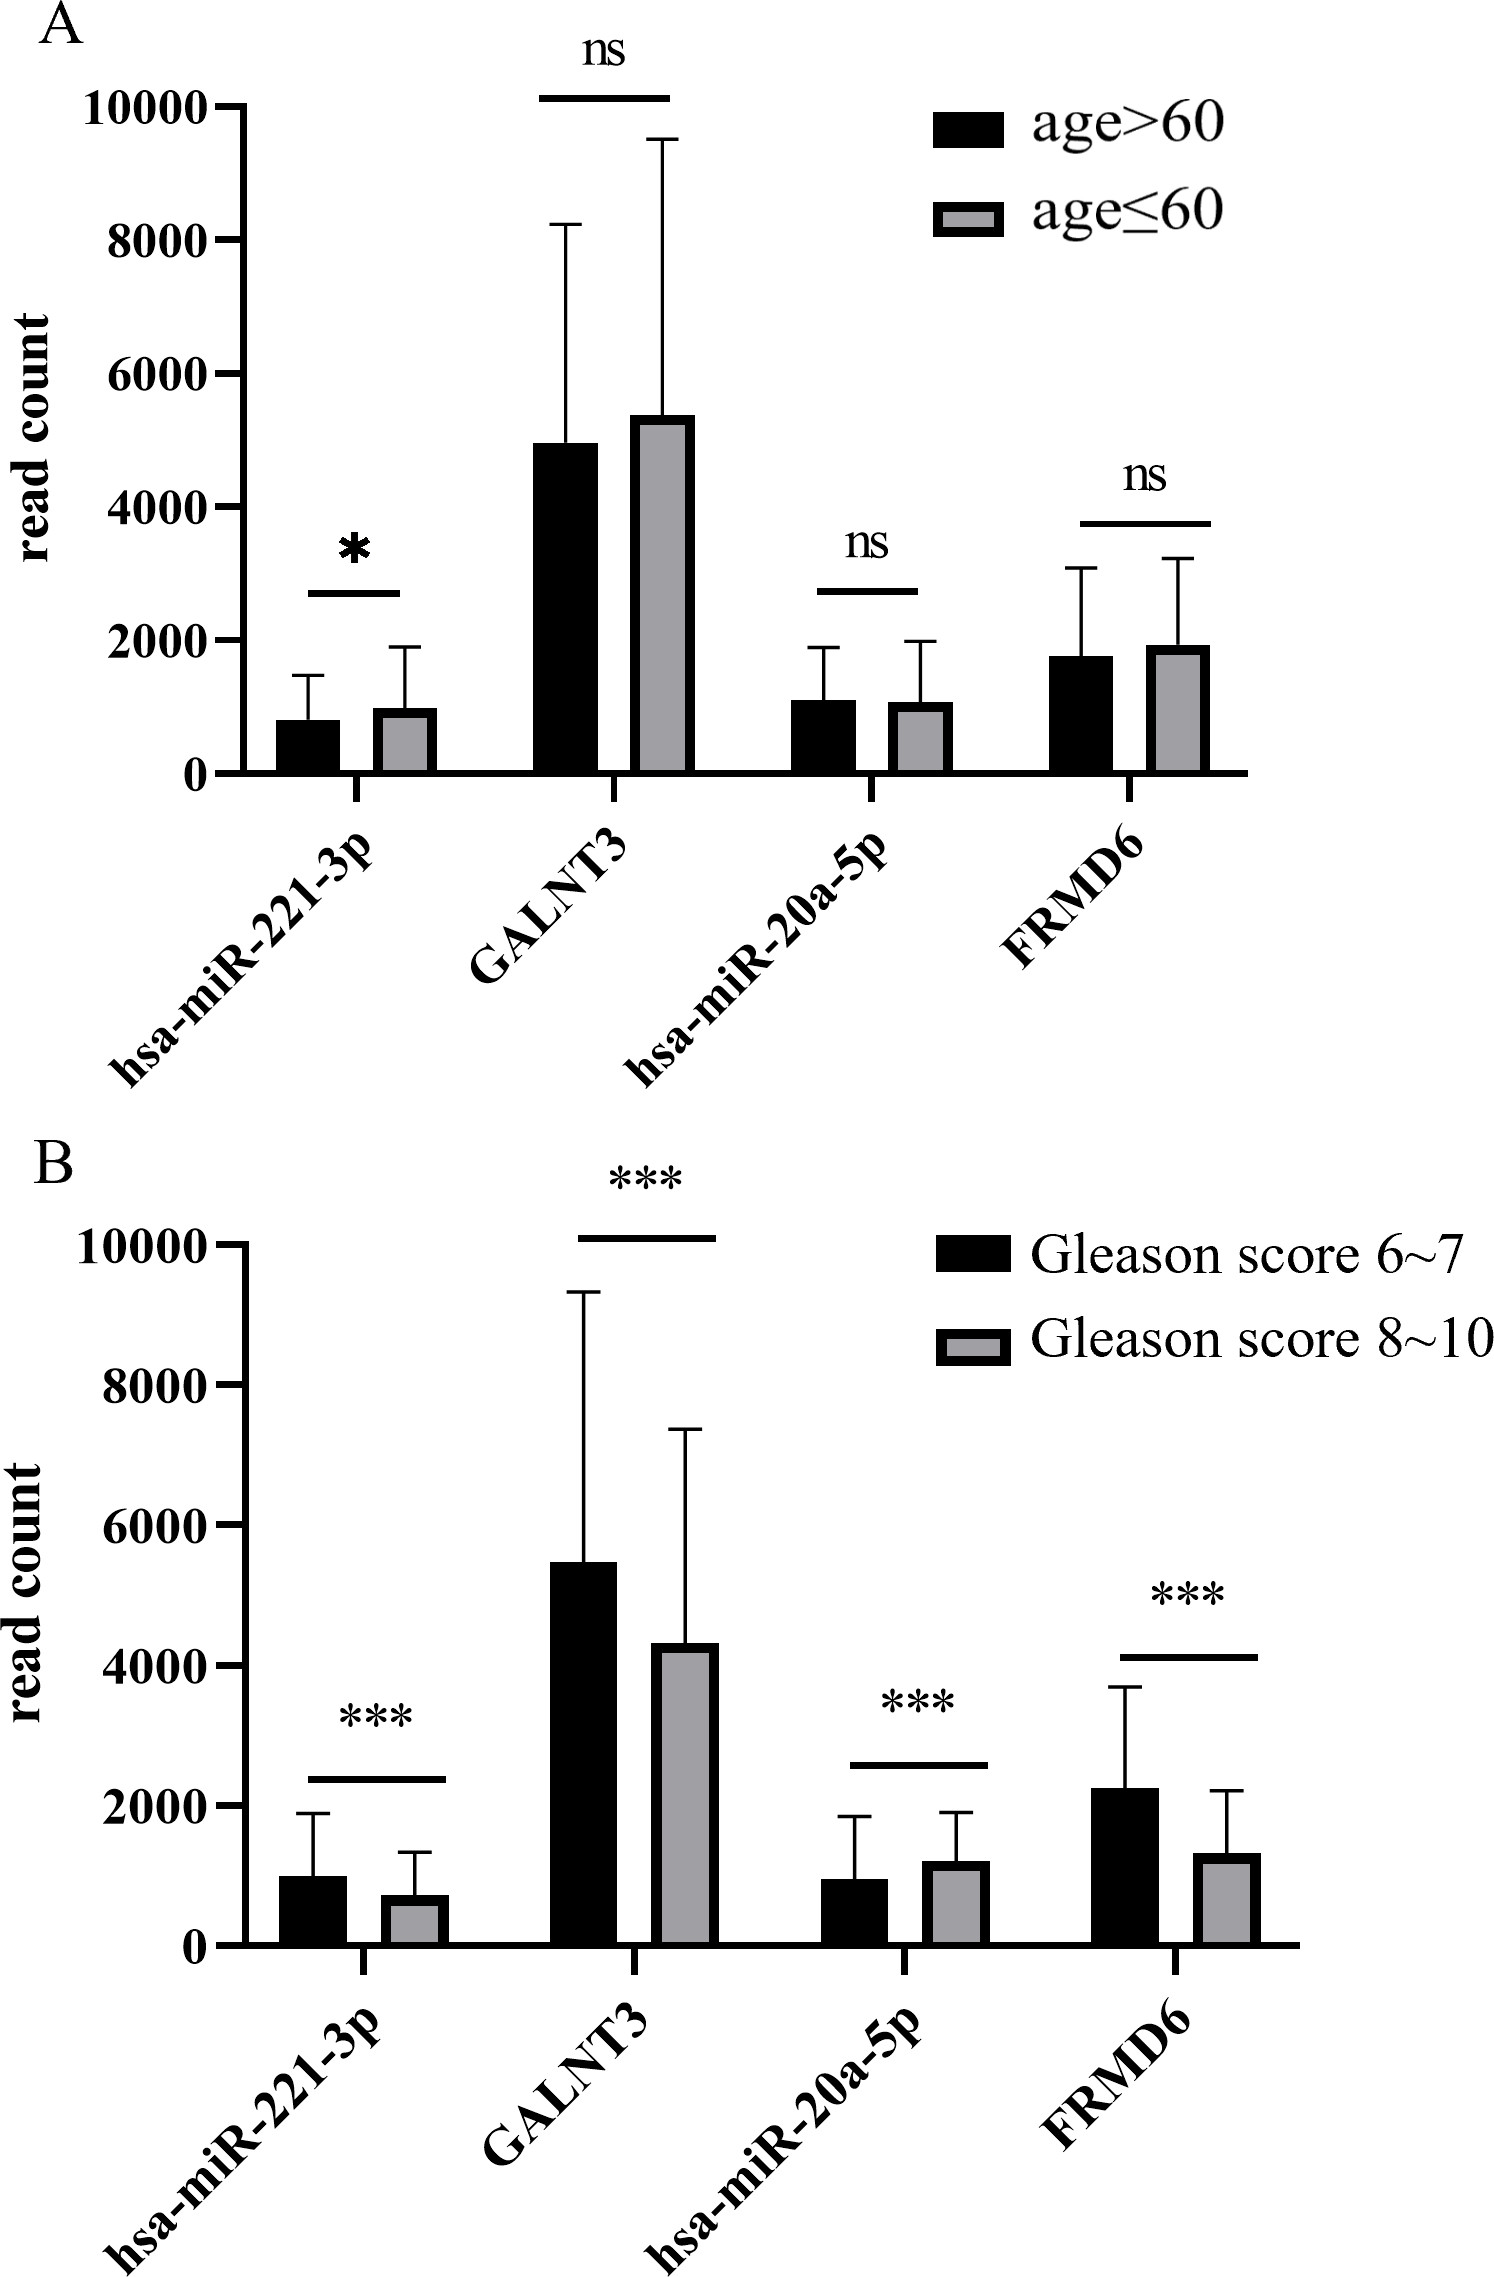
The picture showed profiles of association between immune-related phenotype and miRNA-mRNA pairs. (A) The bar plot of 22 immune cells differentially infiltrated fraction in PRADs versus NCs. (B) The association between cell fraction of 9 differently infiltrated immune cells and expression level of miRNA-mRNA pairs by Pearson’s correlation. (C) The relevance between expression level of miRNAs and targeting mRNAs and global methylation and four tumor microenvironment factors. 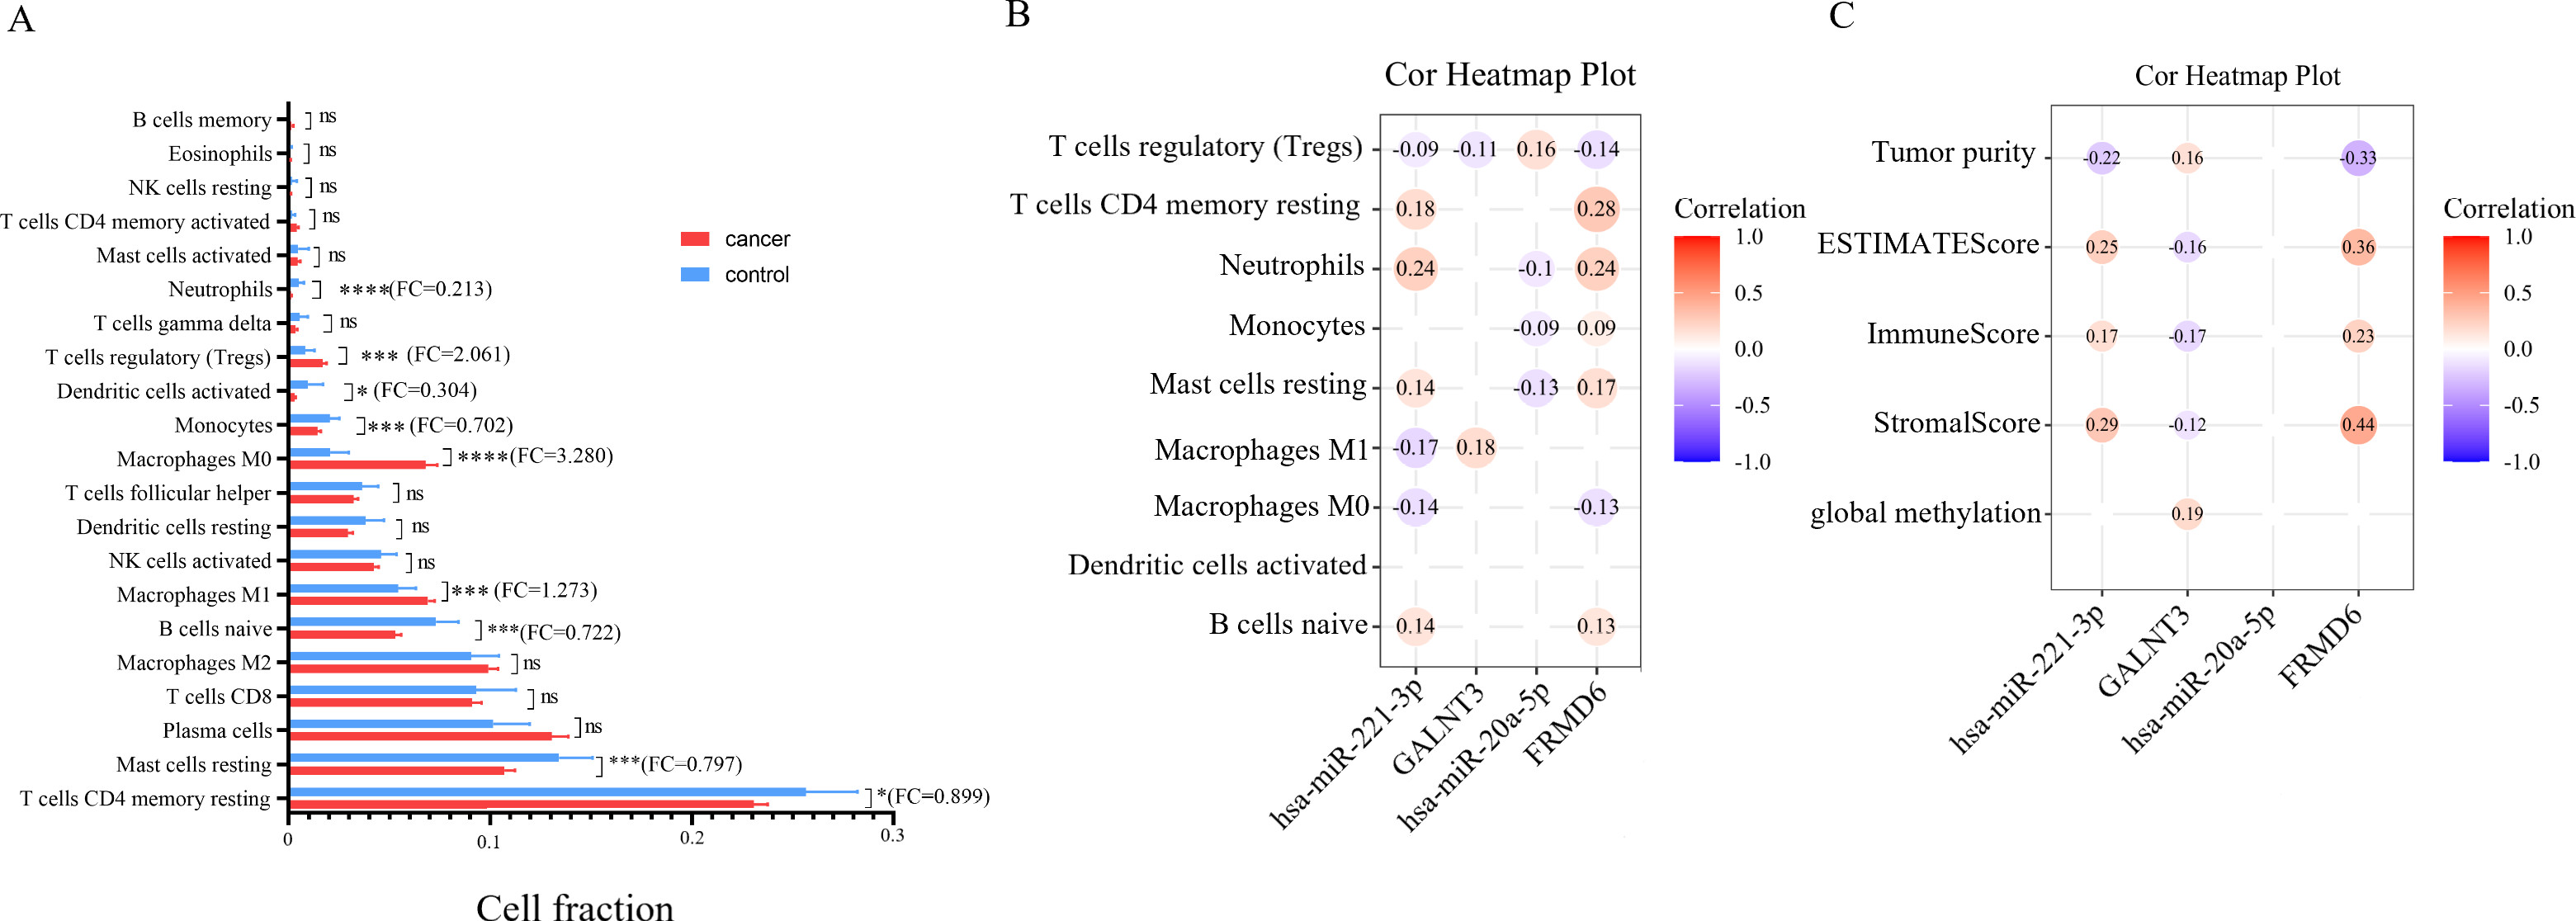
The number of clinical cases we collected was so few that we had to employ information from TCGA-PRAD to compare expression level of miRNAs and mRNA between several subgroups. In Fig. 6A, miR-221-3p expression was higher in patients with diagnosis age younger than 60 (
It is presented in Fig. 7A that nine subsets of immune cells showed differentiation between PRAD samples and control tissues, with entire outcome listed in Table S4. We also investigated the correlation between expression of miRNA-mRNA pairs and the 9 categories of immune cells described above. MiR-20a-5p and target gene FRMD6 were associated with T cell regulatory (Treg), neutrophils, monocytes and resting mast cells (Fig. 7B). Besides, miR-221-3p/GALNT3 pairs could interact with M1 macrophages. As is revealed in Fig. 7C, level of the negatively regulatory pair miR-221-3p/GALNT3 and FRMD6 are relevant with tumor purity, ESTIMATE Score, Immune Score, and Stromal Score in tumor tissue, while there was no correlation between miR-20a-5p and these tumor microenvironment evaluation index.
Overall survival analysis
Only TCGA data was employed in survival analysis due to lack of sufficient clinical information from our FFPE tissue samples and the GEO datasets. Nevertheless, too few deaths were recorded during follow-up of TCGA database (only 10 in 380 cases), thus no statistical significance estimated by univariate and multivariate cox regression analysis was observed between age, tumor stage, miR-221-3p/GALNT3 or FRMD6 expression level and overall survival (OS). As is disclosed in Fig. S4, miR-20a-5p level was significantly correlated with the OS (HR: 1.000437, 95% CI: 1.000018 to 1.000856,
Discussion
MicroRNAs capable of regulating mRNA expression by incompletely binding to mRNA 3’-UTR are of significance in tumor [21]. Numerous researches have partly defined the microRNA signatures in PRAD diagnosis and prognosis [22]. Despite plenty of studies, the role of miRNA-mRNA interactions in PRAD has not been fully identified. In this study, we identified 351 DE-mRNAs (139 up and 212 down) and 67 DE-miRNAs (47 up and 20 down) by combining 36 GEO datasets, TCGA database and several cancer-related databases Then, 118 miRNA (up)-mRNA (down) pairs and 13 miRNA (down)-mRNA (up) pairs were confirmed after intersections between 351 DE-mRNAs, TarBase and miRTarBase. Next, 15 negatively correlated miRNA-mRNA pairs (
We carried out GO/KEGG analyses and cMap analysis with candidate DE-miRNAs and DE-mRNAs. Pathway enrichment analysis demonstrated that DE-miRNAs and DE-mRNAs of PRAD were associated with lipid metabolism. As is reported, lipid metabolism is involved in cancer originated from the exocrine glands of the reproductive system like breast cancer and prostate cancer [23, 24]. Notably, low carbohydrate or low ketogenic diets are introduced for dietary strategies of PRAD patients owing to the effect of insulin resistance and adipokine [25]. Besides, 7 compounds (KPT-330, phenytoin, chlorpyrifos, montelukast, ketorolac, mitoxantrone and sorafenib) have been reported to exert negative effects on PRAD development in cell experiments, animal experiments or clinical trials [26, 27, 28, 29, 30, 31, 32].
Finally, miR-20a-5p/FRMD6 and miR-221-3p/GALNT3, two significantly negatively correlated miRNA-mRNA pairs, were incorporated into the logistic regression model. Among the 15 models randomly combining 4 signatures, the complex model (miR-221-3p & GALNT3 & miR-20a-5p & FRMD6) showed the best predictive value. For lack of GEO datasets containing both miRNA and mRNA expression profile, RNA-sequencing data from TCGA was employed in ROC and DCA. Insufficient miRNA and mRNA expression pattern put off the verification of their diagnosis potential. Experiments with large sample size are required. In the future, we will conduct further experiment based on more freshly frozen tissues and FFPE samples to verify the prognostic efficiency of 2 miRNA-mRNA pairs.
MiR-20a-5p is a member of the miR-17-92, a highly conserved cluster reported to be overexpressed in colorectal cancer (CRC) [33], breast cancer (BC) [34] and PRAD [35] in plenty of studies. Likewise, miR-221-3p belonging to the miR-221/222 cluster is relevant with cervical squamous cell carcinoma (CSCC) [36], epithelial ovarian cancer (EOC) [37] and prostate cancer cells [38]. It is possible that miR-221-3p may serve as novel biomarkers in diagnosis and prognosis of pancreatic cancer [39], gastric cancer [40] and diffuse large B cell lymphoma (DLBCL) [41]. As is reported in previous studies, the significantly downregulated gene FRMD6, short for 4.1 Ezrin Radixin Moesin (FERM)-Containing Protein, is capable of serving as a novel tumor suppressor gene and prognostic biomarker candidate in prostate cancer [42]. GALNT3, Psolypeptide N-Acetylgalactosaminyltransferase 3, was found to be efficient predictors for discriminating PRAD patients from normal controls [43].
By analyzing the overall survival (OS) data of TCGA, we observed that high miR-20a-5p expression indicated poor OS in prostate cancer (
In addition, miR-20a-5p/FRMD6 and miR-221-3p/GALNT3 may affect tumor immune microenvironment by influencing infiltration of immune cells including regulatory T cells (Treg), neutrophils and mast cells, thus interact with cancer-related inflammation. High level of miR-221-3p was reported to promote the transformation of M2-macrophages to a pro-inflammatory status, leading to immune hyperfunction [46].
MiR-20a-5p also has significant impact on pro-inflammatory macrophages and processes fibrosis in tumor tissue [47]. The specific effects of miRNA-mRNA interaction networks on the tumor immune microenvironment and their molecular mechanisms need to be further studied.
In this study, we only investigated dysregulation of miRNAs and mRNAs in tissues, which is not convenient enough in clinical application. Besides, lack of further research for the detailed mechanisms of the miRNA targeting mRNA level influence cancer cells is also weakness of our study. Thus, studies on body fluid and specific mechanisms deserve further exploration.
Conclusions
In summary, the present study tried to figure out the essential pairs in PRAD miRNA-mRNA network via bioinformatics analysis and RT-qPCR. Our research may provide novel biomarkers for diagnosis and prognosis of PRAD in near future.
Author contributions
Conception: Tongshan Wang, Feng Gao and Wei Zhu.
Interpretation or analysis of data: Shuang Peng and Cheng Liu.
Preparation of the manuscript: Shuang Peng, Cheng Liu and Xingchen Fan.
Revision for important intellectual content: Shuang Peng, Jingfeng Zhu and Shiyu Zhang.
Supervision: Xin Zhou.
Supplementary data
The supplementary files are available to download from http://dx.doi.org/10.3233/CBM-220051.
sj-pdf-1-cbm-10.3233_CBM-220051.pdf - Supplemental material
Supplemental material, sj-pdf-1-cbm-10.3233_CBM-220051.pdf
Footnotes
Acknowledgments
We thank openbiox community and Hiplot team (https://hiplot.com.cn) for providing technical assistance and valuable tools for data analysis and visualization. This study was supported by the Graduate Research and Practice innovation Plan of Graduate Education Innovation Project in Jiangsu Province [Grant number: JX10213729].