
Abstract
BACKGROUND:
Several studies have demonstrated that microRNAs (miRNAs) and target mRNAs are associated with different frequencies of microsatellite instability.
OBJECTIVE:
The study aimed to elucidate the profiles of miRNAs and target mRNAs expression and their associations with the phenotypic hallmarks of microsatellite instability in colorectal cancers (CRC) by integrating transcriptomic, immunophenotype, methylation, mutation, and survival data.
METHODS:
Differentially expressed miRNAs (DEmiRNAs) and mRNAs (DEmRNAs) were screened out and then the miRNA-mRNA regulatory pairs were identified through two databases. We verified that the expression levels were detected in 40 microsatellite instable (MSI) and 40 microsatellite stable (MSS) CRC samples and used the logistic regression and the Cox regression method to evaluate the diagnostic and prognostic value of negative regulatory pairs respectively.
RESULTS:
The best diagnostic model that combines miR-31-5p, PLAGL2, miR-361-5p, and RAB27B, which were associated with immune microenvironment, tumor mutation burden (TMB), and overall DNA methylation, could significantly predict microsatellite instability in colon tissues. MiR-31-5p and RAB27B could also predict the overall survival of MSS CRCs.
CONCLUSION:
This study generated a predictive model of the combination of miRNAs and mRNAs to distinguish MSI versus MSS CRCs and elaborated their potential molecular mechanisms and biological functions.
Flow chart for identifying the miRNA-mRNA regulatory pairs and the comprehensive analysis of regulatory pairs role of microsatellite instability in colorectal cancer.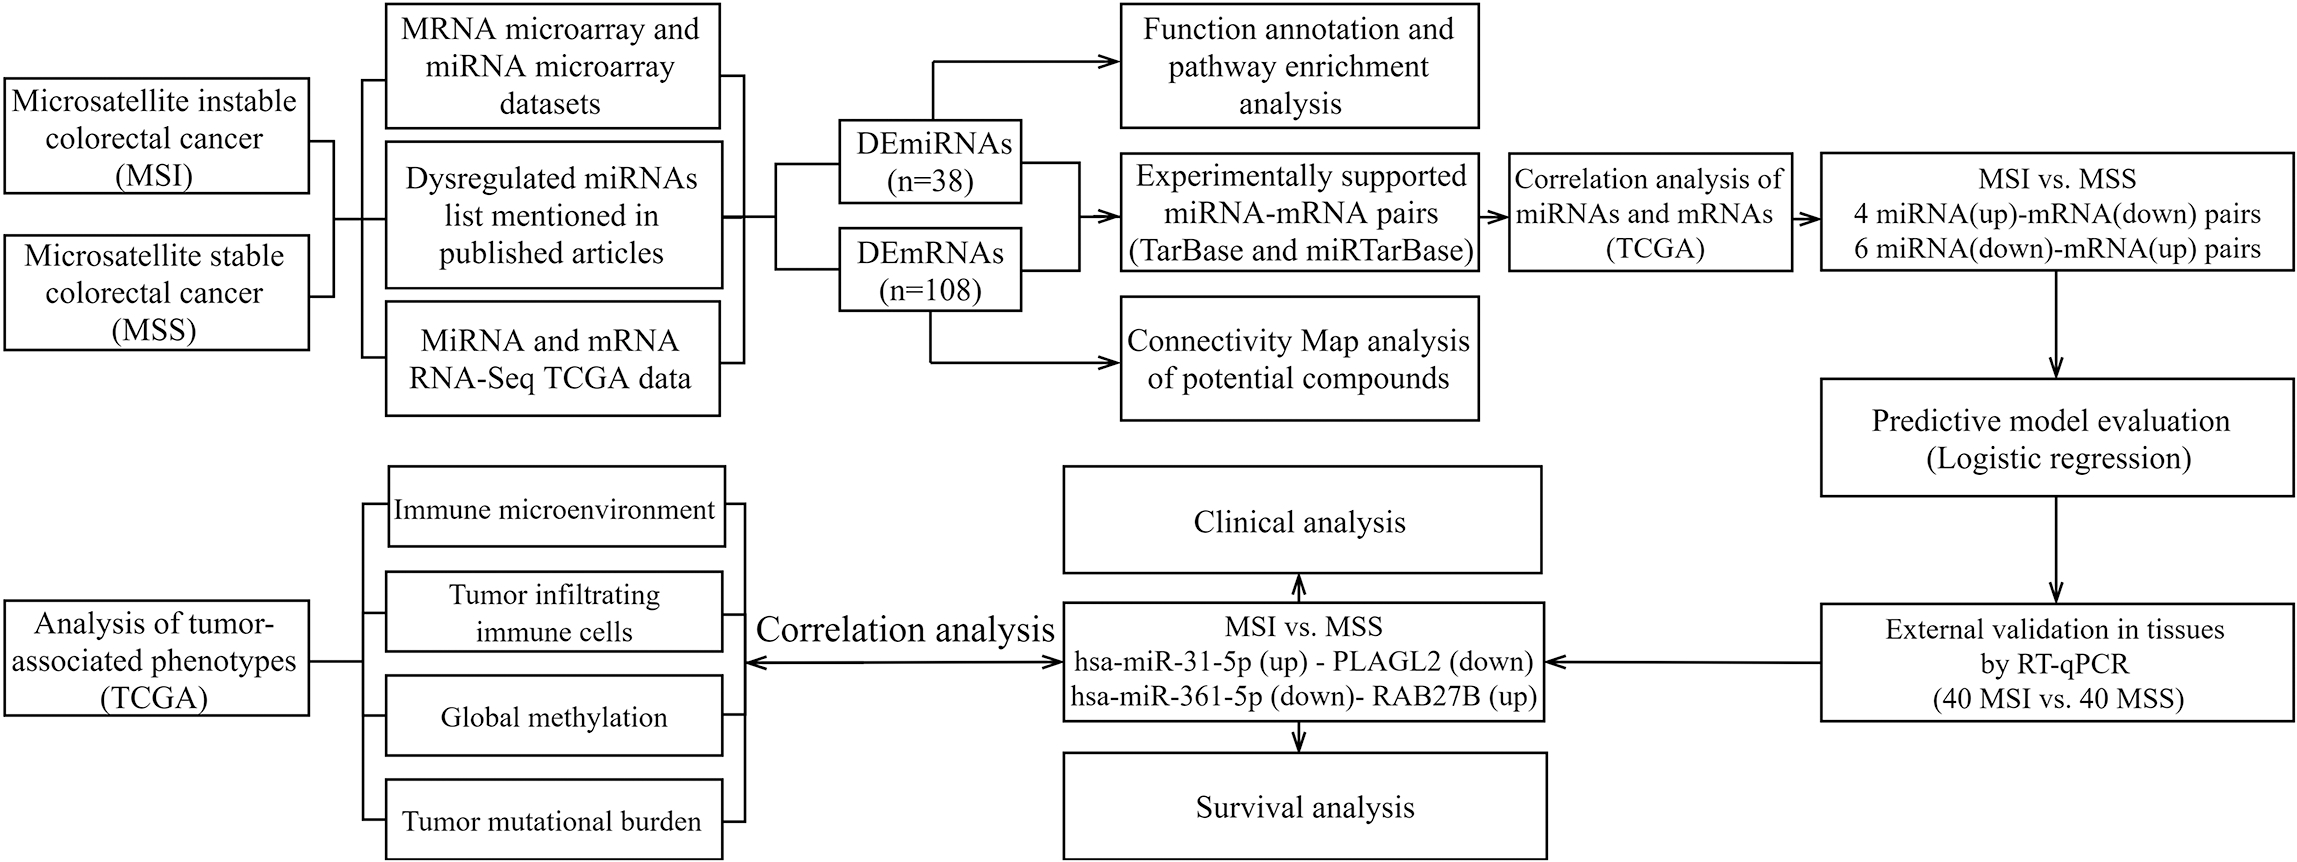
Colorectal cancer (CRC) where the incidence ranked second has a third largest estimated mortality for all types of cancers worldwide in 2020 [1]. The molecular subtyping has been suggested to be important for treatment plan selection and prognosis prediction [2]. Microsatellite instability (MSI) which is one of the classicized bases of the current widely accepted consensus molecular subtype (CMS) has been observed in CRCs and endometrial cancers [3]. Microsatellites (MS) which are small tandem repeats of DNA bases and extensive throughout the human genomes can lead to genomic instability and mutation due to the DNA slippage [4]. MSI can be divided into three groups: high-frequency MSI (MSI-H), low-frequency MSI (MSI-L) and microsatellite stable (MSS) depending on the degree [4].
MSI detection is crucial for diagnosing Lynch syndrome and selecting CRC patients eligible for immunotherapy or basic chemotherapy. A panel of two mononucleotides (BAT-25 and BAT-26) and three dinucleotides (D2S123, D5S346, and D17S250) repeat microsatellites called the NCI panel for the detection of MSI in CRC is considered as a golden standard in many countries [5]. In addition, a whole range of different clinical features and molecular biomarkers to differ microsatellite instable samples from CRCs are available such as tumor infiltrating lymphocytes [6].
MicroRNAs (miRNAs) had been reported that were critical for the progression of cancers by influencing proliferation, invasion and metastasis [7]. The interrelationship between MSI and miRNA plays a key role in the pathogenesis of CRC. Serval studies have demonstrated some miRNAs and their target mRNAs associated with CRC using bioinformatics analysis or microarray expression profile or a multi-step approach such as mir-29a/KLF4 [8], miR-182/SEMA6D [9], miR-183-5p/PNOC and miR-6730-5p/NUSAP1 [10]. By Integrative analysis of paired miRNA-mRNA expression profiles from CRC samples, we identified some miRNAs that may have a driving role at the CRC transcriptional level. An overview of the workflow steps is provided in Fig. 1. In our study, gene and miRNA profiling data were collected from the Gene Expression Omnibus (GEO) database and the Cancer Genome Atlas (TCGA). Expression of a selected panel of miRNA-mRNA pairs was evaluated by poly(A) reverse transcriptase quantitative (real-time) polymerase chain reaction (RT-qPCR) assay of formalin-fixed paraffin-embedded (FFPE) samples obtained from MSS and MSI (including MSI-L and (MSI-H) CRC. We identified the key miRNAs and their target mRNAs with survival analysis, functional enrichment and provided new insights into miRNA and target-mRNA expression in relation to tumor phenotypes which contain immune microenvironment, tumor infiltrating immune cells, global methylation, tumor mutational burden and genetic mutation.
Our research performed extensive analysis of miRNA -mRNA regulatory pairs in microsatellite instability in CRC to yield new sights in the underlying mechanism in CRC tumorigenesis associated with microsatellite instability. Combination of bioinformatic analysis and qRT-PCR provided with convenience in identifying dysregulated miRNA-mRNA regulatory pairs to improve therapeutic strategies for MSI CRCs and MSS CRCs.
Materials and methods
Data acquisition and processing
TCGA colon adenocarcinoma (COAD) and rectal adenocarcinoma (READ) miRNA and mRNA sequencing expression profiles and associated clinicopathological data were downloaded from the GDC data portal. There is no apparent difference between colon and rectal samples validated by Principal component analysis (PCA) and merging samples is no need to adjust [11]. So, we combined TCGA-COAD and TCGA-READ samples into a single TCGA-CRC cohort. TCGA-CRC samples were classified into MSI (MSI-H and MSI-L) and MSS groups based on data provided by Isidro Cortes-Ciriano et al. [12]. Then we searched MSI relevant gene microarray expression datasets from GEO and differentially expressed miRNAs in published articles. High-throughput TCGA-CRC data and microarray expression GEO datasets were analyzed by “R-edgeR” and GEO2R tool respectively.
Function annotation and pathway enrichment analysis of miRNA/target-gene pairs
Firstly, we screened the target genes of potential DE-miRNAs using DIANA-TarBase [13] and miRTarBase [14], which contain experimentally verified miRNA/ target-gene pairs. Then the expression correlations between DEGs and DEMs were evaluated using Pearson’s correlation. Visualization of the miRNA-mRNA regulatory network was conducted using Cytoscape software (v3.8.0) [15]. Gene ontology (GO) functional analysis and a Kyoto Encyclopedia of Genes Genomes (KEGG) pathways analysis against the DEGs and DEMs in the network were performed by using clusterProfiler tool in Hiplot web platform [16].
Connectivity map analysis of potential compounds capable of targeting the differentially expressed genes
Connectivity Map (cMap) analysis was conducted by querying up-regulated genes tag and down-regulated genes tag in CRCs versus NCs for finding perturbagens that give rise to similar expression signatures via clue.io software platform. The negative normalized connectivity score ranging from
Survival analysis
Univariate and multivariate Cox regression analyzed by “R-survival” [17]. Based on the cut-off point of miRNA or mRNA expression by “R-survminer”, patients also could be classified into high- expression and low- expression. The Kaplan-Meier analysis (KM) and the receiver operation characteristic (ROC) curve were carried out using the “R-KMsurv”.
Evaluation of interactions of miRNA-mRNA pairs and tumor-relative phenotypes and gene mutation status
The fraction of 22 infiltrating immune cell types was calculated using CIBERSORT (https://cibersort.stanford.edu/index.php/) [18]. The differences of these immune cells between MSI TCGA-CRC and MSS TCGA-CRC were compared via the Wilcoxon rank-sum test. ESTIMATE software based on the mRNA-seq data was used to estimate the stromal and immune levels for TCGA-CRC samples [19]. The methylation levels of the CpG sites in TCGA-COAD and TCGA-READ samples were obtained using UCSC Xena platform detected by the Illumina Infinium HumanMethylation450 BeadChips platform. The sum of the methylation levels of all 485,577 CpG sites in each sample was calculated as overall DNA methylation level. Tumor mutation burden (TMB) was used to measure the total number of somatic variants per megabase (MB) of the genome using the “R-maftools” [20]. TCGA-CRC samples were grouped into wild-type and mutated groups based on somatic mutation datasets obtained from UCSC Xena.
Sample collection and RNA isolation
Five MSI markers of the NCI panel were detected by PCR. 80 FFPE CRC tissue samples collected at surgical resection were classified as 40 MSI samples that one or more markers showed allelic shift and 40 MSS samples that none showed altered allelic size in tumor DNA. All samples used in this study were collected with patients’ consent. The present study has been approved by the institutional ethics committee and the patients written informed consent has been obtained (ID: 2016-SRFA-148). The clinical characteristics were showed in Table 1. Total RNA was extracted from FFPE colon tissue samples using RNAprep Pure FFPE Kit (TIANGEN) according to the manufacturer’s instructions. RNA concentrations were measured with NanoDrop ND-1000 spectrophotometer (Thermo Fisher Scientific).
Clinicopathological and molecular features of colorectal cancer patients
Clinicopathological and molecular features of colorectal cancer patients
Selected DEGs and DEMs were verified by qRT-PCR using PrimeScript RT reagent Kit (Takara) and SYBR Premix Ex Taq II (Takara) after adding a poly(A) tail to RNA by Poly(A) Polymerase Kit (Takara) according to the manufacturer’s protocol. The PrimeScript RT reagent Kit and SYBR Premix Ex Taq II kit contain the commercial Uni-RT primer and Uni-Reverse primer. The PCR reactions were carried out in final volumes of 10
Statistical analysis
IBM SPSS Statistics v.26 software (IBM Corporation, Armonk, NY, USA), R language v3.6.3 or GraphPad Prism software were used to analyze the data. Continuous variables were reported using the mean and standard deviation (SD). Student’s t tests were performed, and
Results
Identification of differentially expressed miRNAs (DEMs) and genes (DEGs) in colorectal cancer
There were 11 gene expression microarray datasets from the same manufacturer and 2 miRNA expression microarray datasets and DEMs mentioned in 15 articles related with MSI CRC filtered out shown in Fig. 2A, and listed in Tables 2 and 3.
A: The circular-barplot showing the basic information of GEO datasets (GEO accession, source name and experiment type). A total of 15 microarray datasets from tissue were included in the study. 38 DEMs and 108 DEGs were screened in microsatellite instable colorectal cancers (MSI CRCs) versus microsatellite stable colorectal cancers (MSS CRCs). B: 38 microRNAs (miRNAs) to 108 mRNAs network visualized by Cytoscape. 65 miRNA (up) - mRNA (down) pairs and 74 miRNA (down) - mRNA (up) pairs were screened out by miRtarbase and Tarbase which contain experimentally validated miRNA-mRNA regulatory pairs. Blue dot represents the upregulated miRNAs/mRNAs in MSI CRCs versus MSS CRCs, while orange dot represents the downregulated miRNAs/mRNAs in MSI CRCs versus MSS CRCs.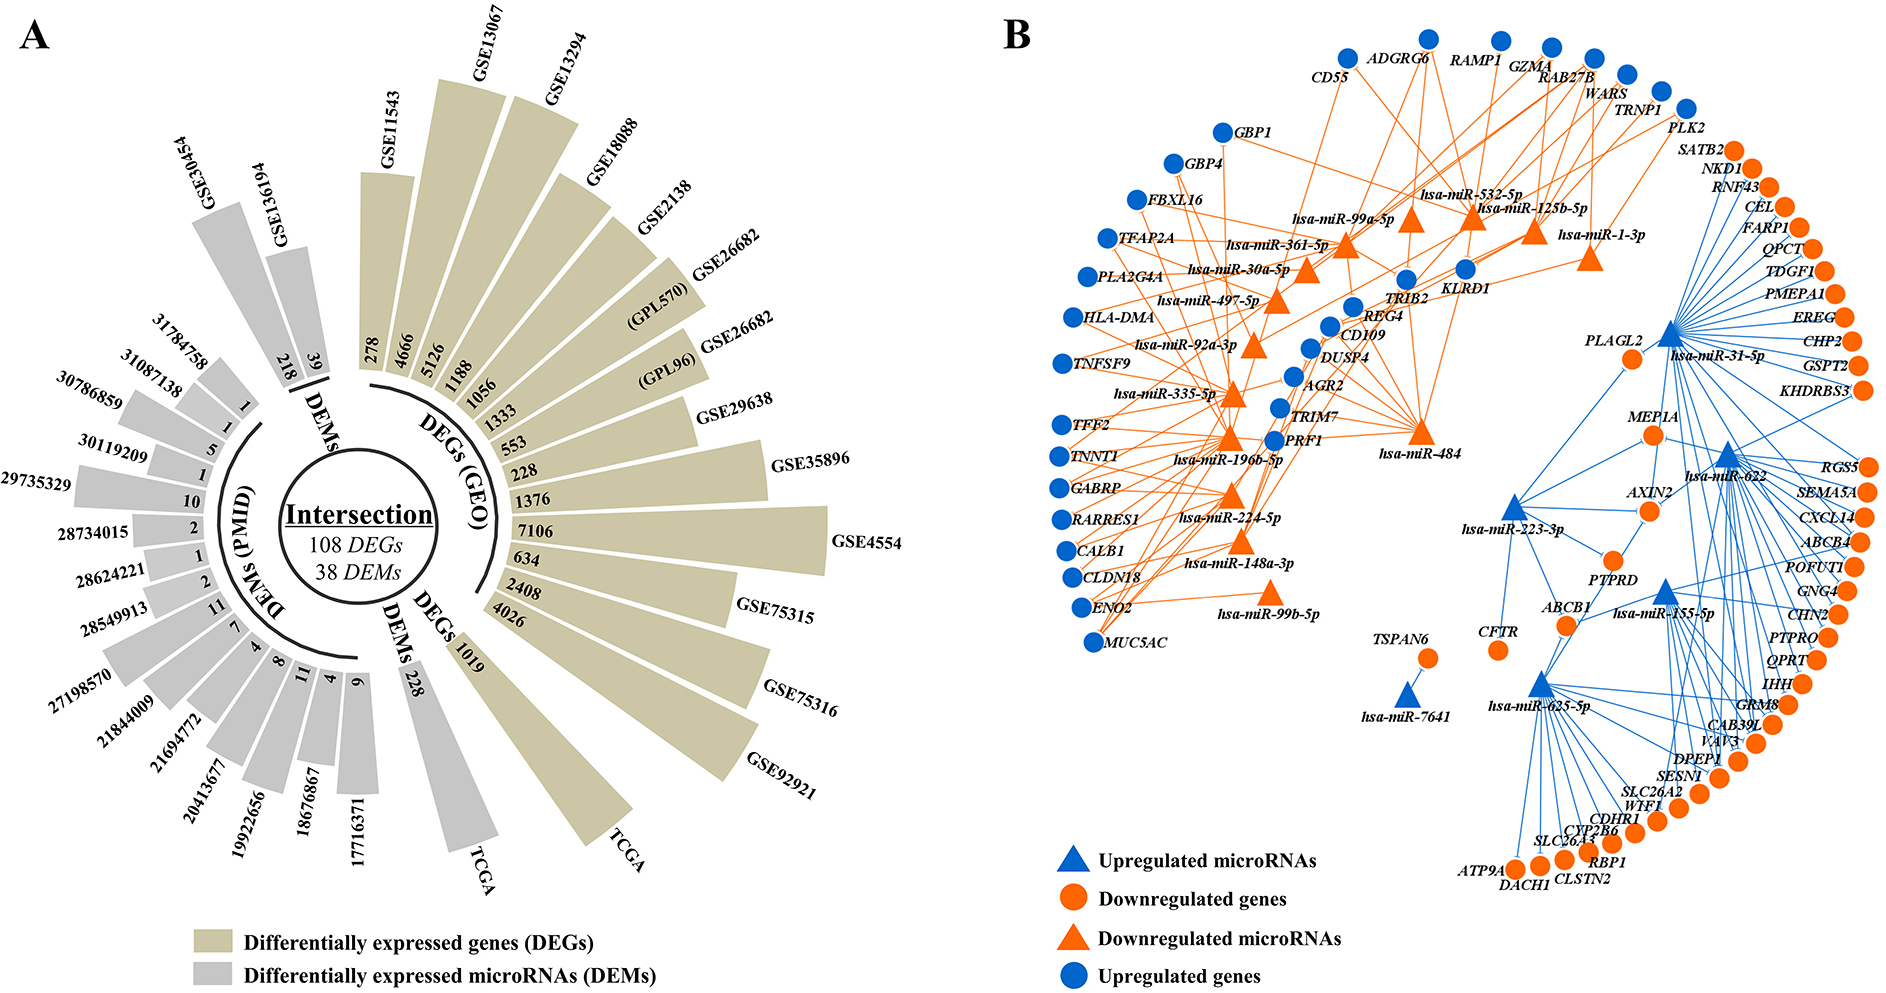
Information pertaining to the selected GEO datasets for colorectal cancer
Differentially expressed miRNAs mentioned in articles about microsatellite instability in colorectal cancer
Pearson’s correlation analysis between miRNAs and mRNAs in TCGA
The expression level of miRNAs and mRNAs detecting in MSI CRC and MSS CRC samples by RT-qPCR
GO and KEGG pathway analysis showing the associated function of the target genes of dysregulated miRNAs in colorectal cancer. (A) The 19 enriched KEGG pathways and the combination of GO terms including the top 15 GO biological processes, 2 cellular components and 6 molecular functions for 21 upregulated miRNAs ordered by 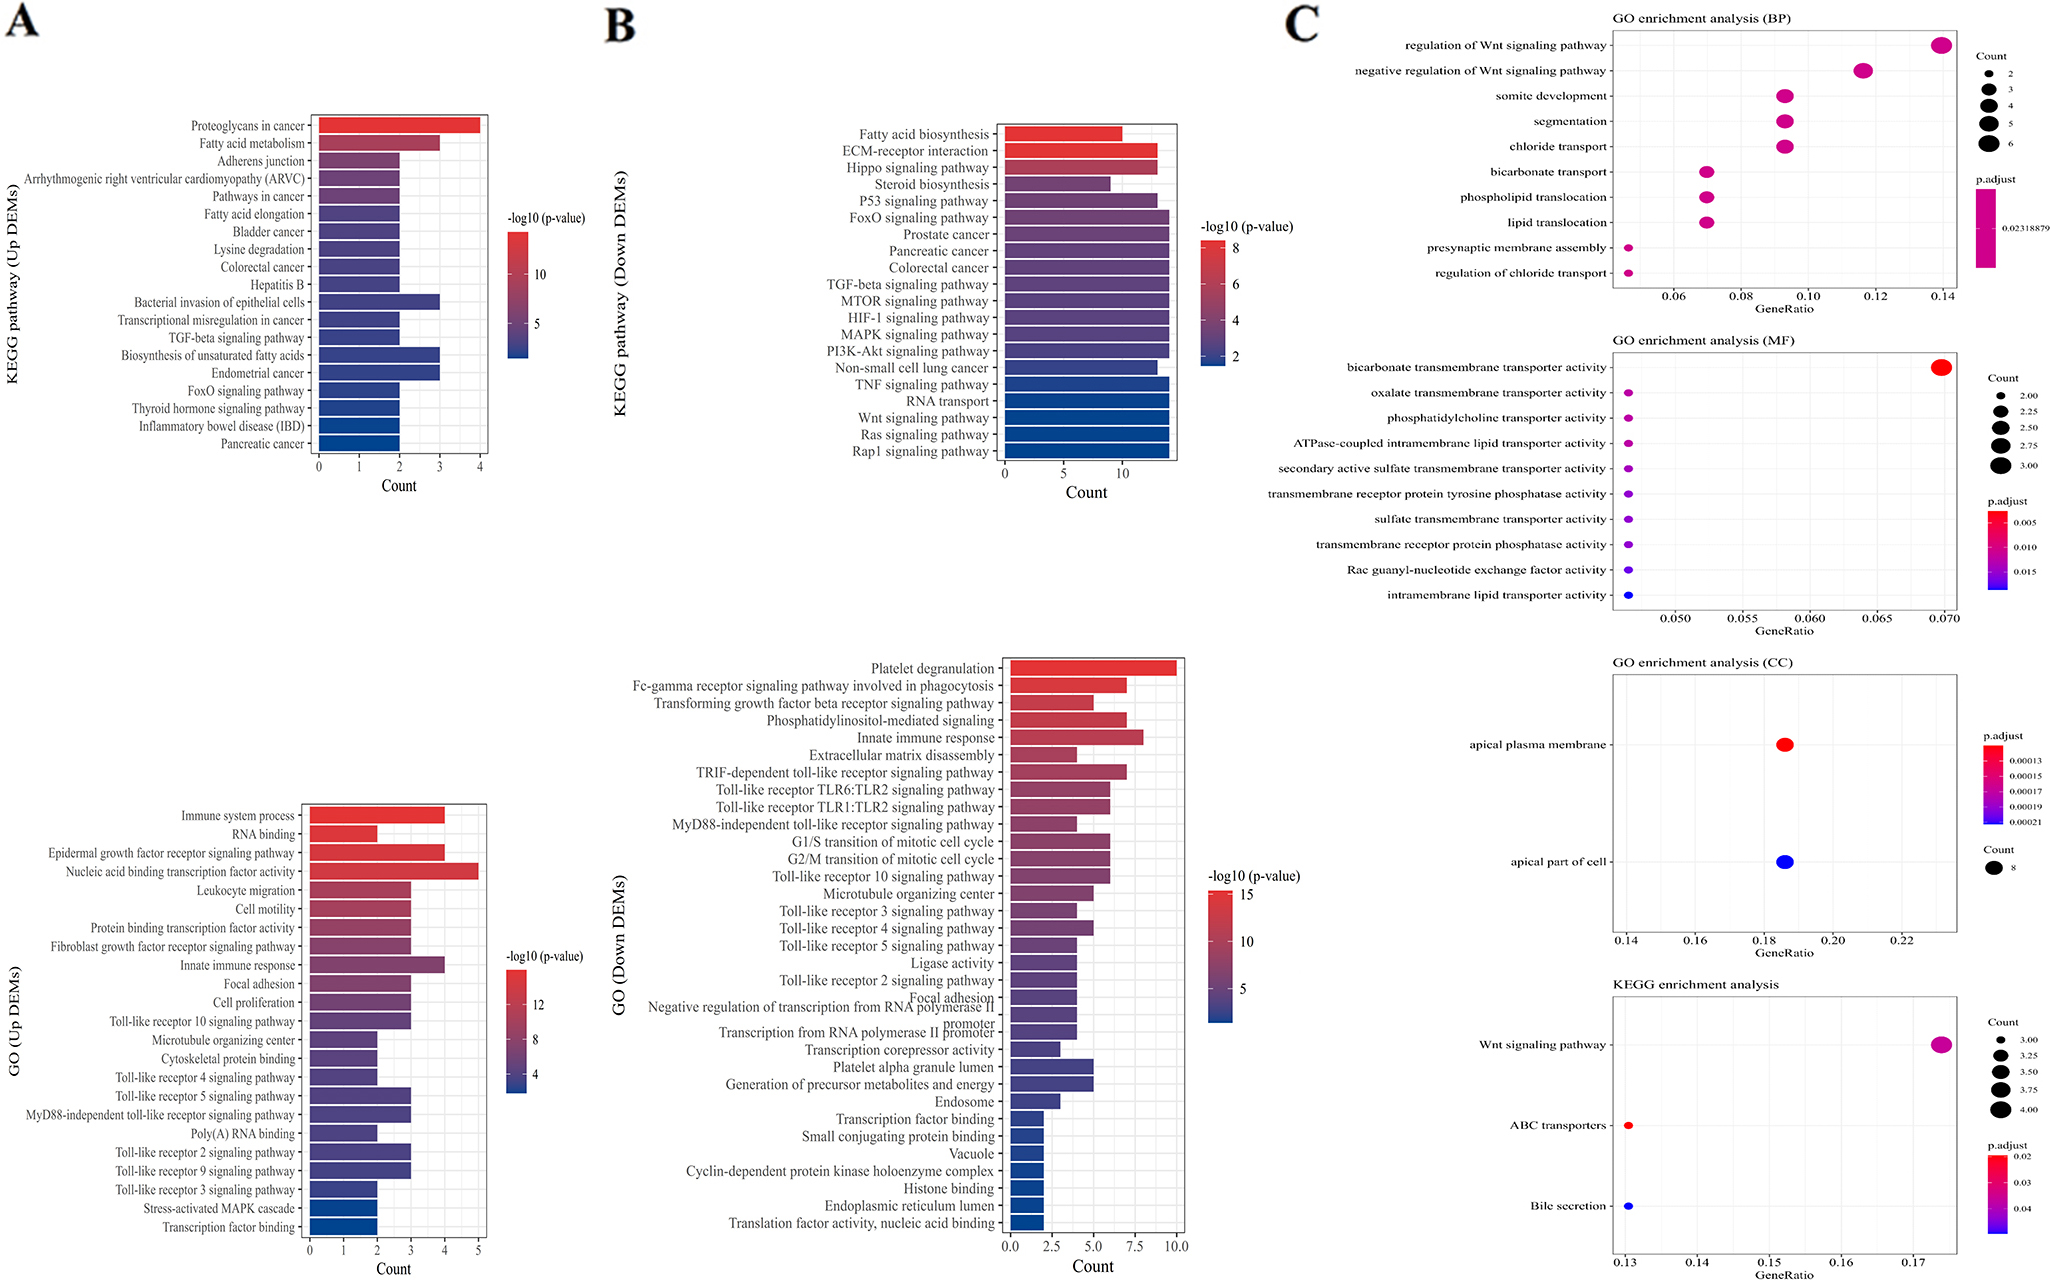
We performed the enrichment analysis of 38 DEMs by DAVID-mirPath. Targets of up-DEMs and down-DEMs enriched in KEGG pathways and GO terms were listed in Table S2 and S3 respectively, and the top 20 ordered by
CMap analysis of dysregulated genes in CRC
We employed cMap to find potential compounds that can disturb the dysregulated gene expression pattern. After the query for dysregulated genes tags, 35 compounds, of which the significantly normal_ncs and fdr_q_nlog10 in CRC cell lines (HCT116, HT1299, HT29 and SW480) were identified as the potential drugs for CRC shown in Fig. S1 A. CMap mode of action (MoA) for 35 compounds revealed 30 mechanisms of action shared by the above compounds shown in Fig. S1B.
Screening of negative miRNA/mRNA regulatory pairs associated with MSI CRC
Firstly, the experimentally validated target mRNAs of 38 DEMs were selected by miRtarbase and Tarbase. There were 65 miRNA(up)
Validating the expression of 8 differentially expressed miRNAs and 9 differentially expressed mRNAs by RT-qPCR. (A) Two up-DEMs in MSI CRC were miR-155-5p (FC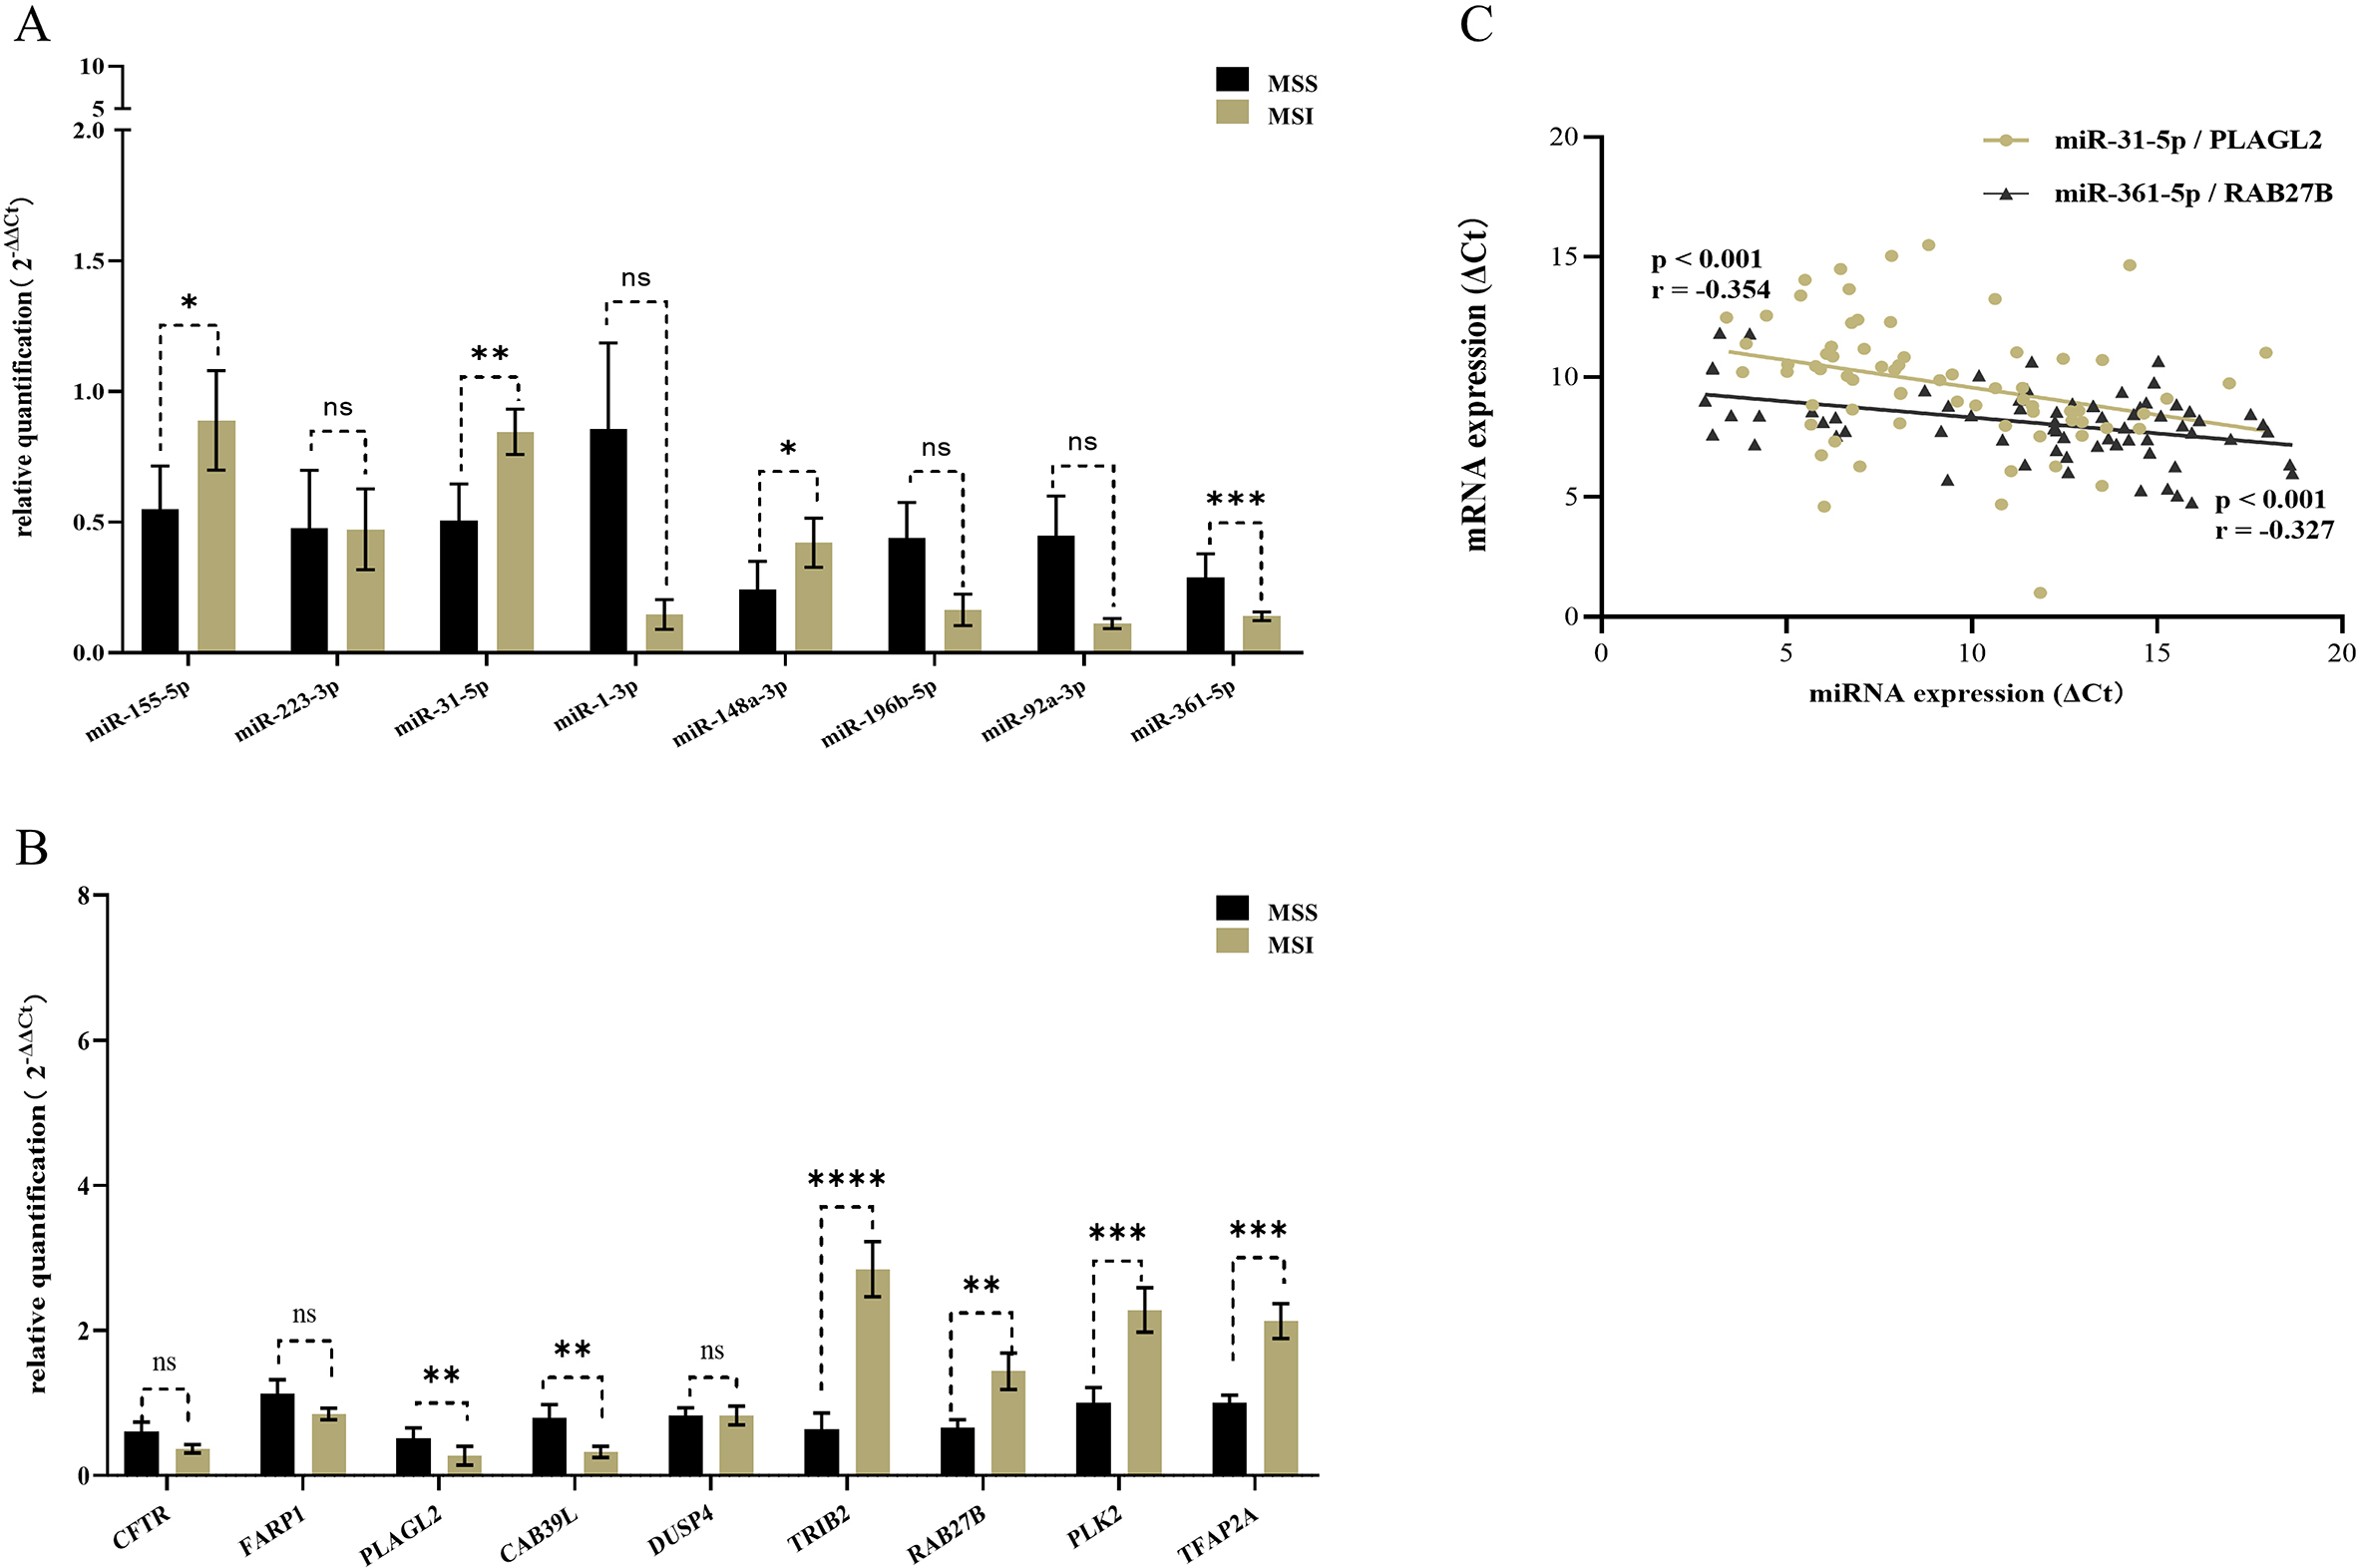
MiR-155-5p and miR-31-5p were upregulated in MSI CRCs, while miR-148a-3p and miR-361-5p were downregulated. CAB39L and PLAGL2 were downregulated, while RAB27B, TRIB2, TFAP2A, and PLK2 were upregulated. By the Pearson’s correlation analysis, we identified that miR-31-5p and miR-361-5p were associated with PLAGL2 and RAB27B respectively shown in Fig. 4C and Table 5.
Evaluation of predictive value of miRNA-mRNA regulatory pairs in CRC
The logistic regression analysis was used to evaluated the predictive value of a panel including 2 miRNA-mRNA regulatory pairs: miR-31-5p/ PLAGL2 and miR-361-5p/ RAB27B in TCGA and validated in 80 samples. ROC curves were plotted in Fig. 5A and D. We also used DCA to verify the clinical applicability of 15 alternative models. They all showed that the complex model based on 4 signatures (the red line shown in Fig. 5C and F) could predict the CRC much better than other 14 models. Clinical impact curves were plotted to demonstrate the significance of the complex predictive model shown in Fig. 5B and E.
Association analysis of clinical pathological features and miRNA/mRNA expression level in CRC
Clinical pathological data of CRCs were summarized in Table 1. Because of no enough clinical information, we evaluated miRNAs and mRNAs expression levels in multiple subgroups in TCGA shown in Fig. S5A–C. ROC curve was used to find the best cutoff which was as the basis for grouping of expression levels of miRNAs and mRNAs shown in Fig. S2. MiR-31-5p and RAB27B were associated with gender, and miR-361-5p and PLAGL2 were dysregulated in different sites. As shown in Fig. S5C, we found that the expression level of miR-30-5p was associated with the stage of MSI CRCs and MSS CRCs.
Cox regression analysis for the prediction of overall survival in MSS CRCs
Cox regression analysis for the prediction of overall survival in MSS CRCs
MSS: microsatellite stable; CRC: colorectal cancer; HR: hazard ration; CI: confidence interval.
Receiver operating characteristic (ROC) curves, decision curve analysis (DCA) and Clinical impact curves of the complex predictive model including 4 signatures (miR-31-5p, PLAGL2, miR-361-5p and RAB27B) to distinguish MSI CRCs from MSS CRCs. ROC curves of the complex predictive model in TCGA training cohort (A) and external validation cohort (D). The X axis shows the high-risk threshold, and the Y axis represents the standardized net benefit. Clinical impact curves of the complex model including the above mentioned 4 signatures for predicting MSI status in TCGA training cohort (B) and external validation cohort (E). The number of high-risk patients (blue dotted line) and the number of high-risk patients with events (red solid line) are plotted. The decision curve analysis of 15 models, of which a complex predictive model containing all 4 signatures (miR-31-5p, PLAGL2, miR-361-5p and RAB27B) (red solid line), 4 models containing 3 signatures (green dotted lines), 6 models containing 2 signatures (magenta dotted lines) and 4 models containing 1 signature (blue dotted lines) in TCGA training cohort (C) and external validation cohort (F).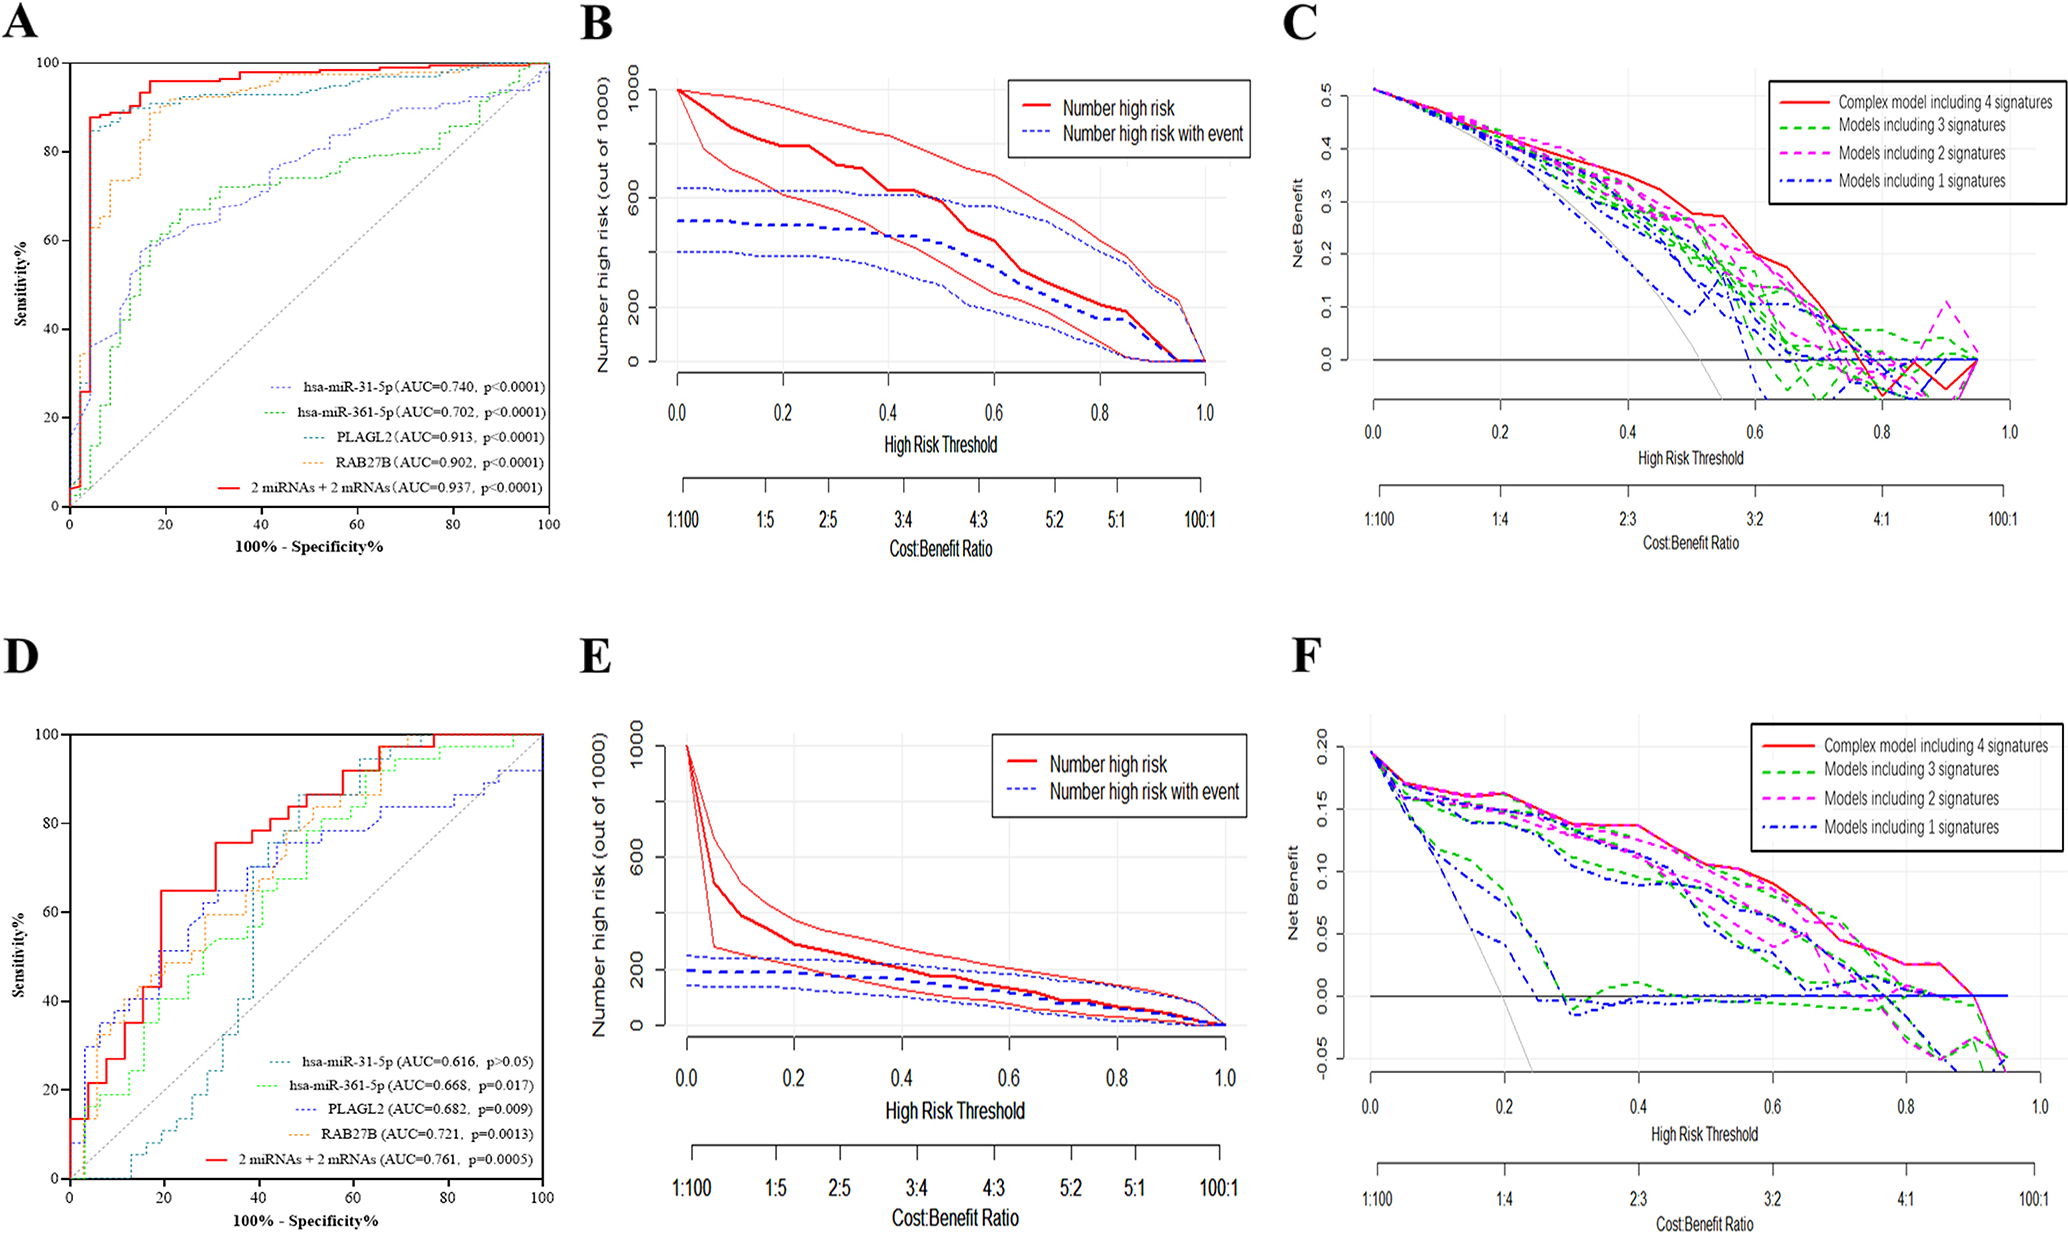
We further studied the expression level of miR-31-5p and miR-361-5p in MSI versus MSS in 32 cancer types based on TCGA data that miR-31-5p was found upregulated in MSI in 6 cancer types (fold change
And then we found BRAF gene mutation and RAS gene family (HRAS, KRAS and NRAS) mutation were associated with the microsatellite instability listed in Table S5. The level of miR-31-5p was found to be higher in BRAF-mutated CRCs, and its target gene PLAGL2 was downregulated in BRAF-mutated CRCs shown in Fig. S6A. MiR-31-5p by targeting PLAGL2 and miR-361-5p by targeting RAB27B also played an important role in RAS gene family mutation shown in Fig. S6B.
Because of no enough OS data in MSI TCGA-CRC data, the HR of different clinical features only in MSS CRC was estimated by univariate and multivariate cox regression analysis. Gender, age, and the high expression of miR-31-5p could be as independent risk factors for MSS CRC listed in Table 6. KM curves showed that the miR-31-5p, miR-361-5p, and RAB27B have impact on the OS of MSS CRCs shown in Fig. S4B.
The profiles of immune-related subtype distribution pattern in MSI CRCs (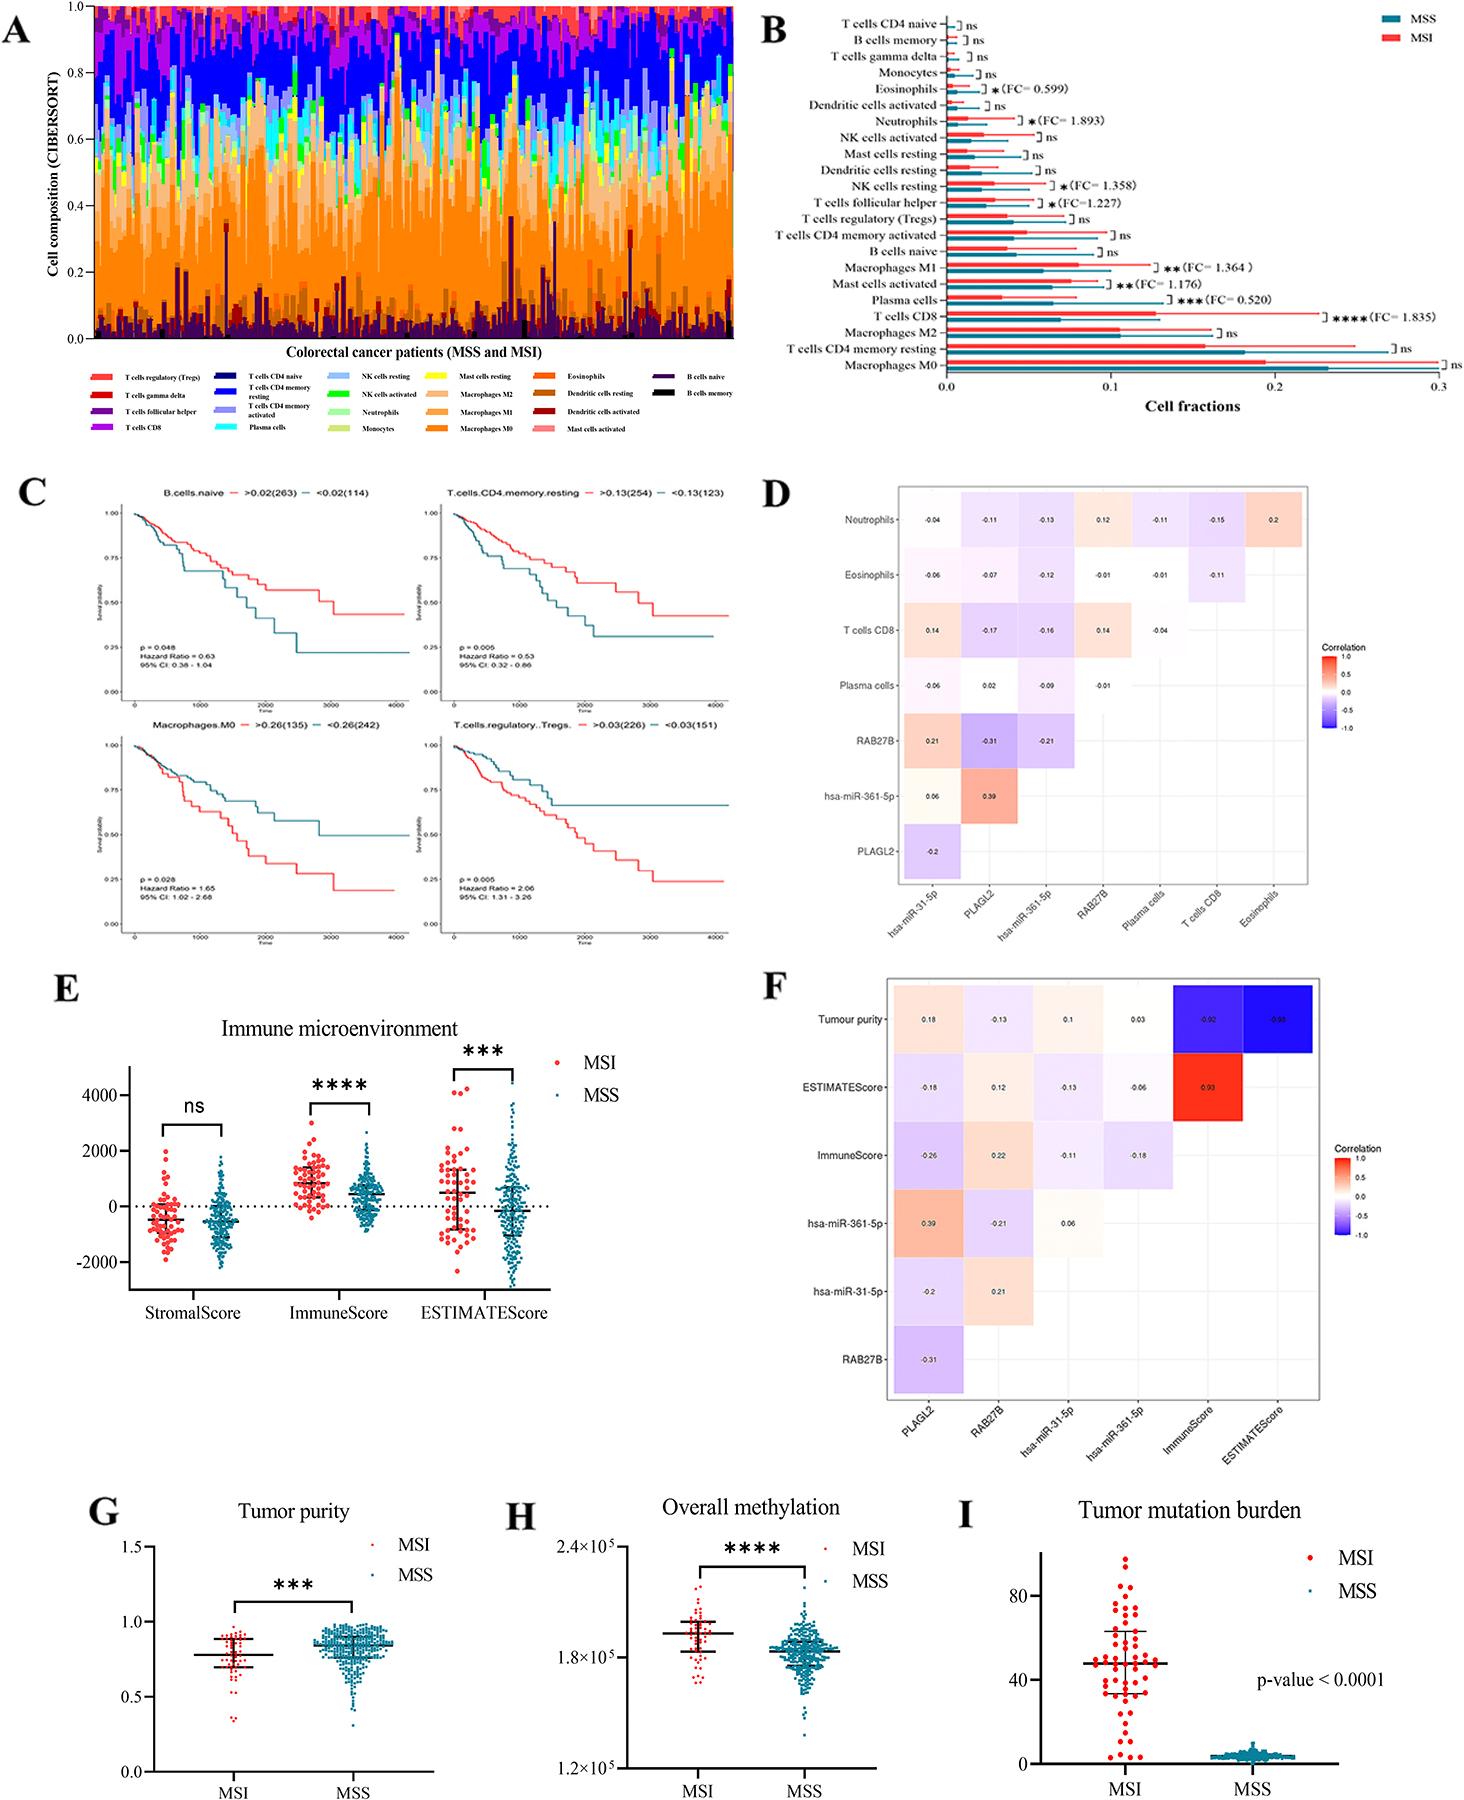
We applied an established computational method (CIBERSORT) to bulk gene expression profiles of CRC to infer the proportions of 22 subsets of immune cells shown in Fig. 6A and listed in Table S6. We found that 4 of 8 types which were differentially expressed in CRCs versus NCs were associated with OS of CRC. We further investigated associations between each cell type and miRNA/ target mRNA expression. The levels of miR-31-5p and target gene PLAGL2, and miR-361-5p and target gene RAB27B were significantly correlated with CD8
Discussion
We reported that MSI CRCs and MSS CRCs were different in many molecular aspects, such as the miRNA/mRNA expression profiles, overall methylation, BRAF and RAS gene family mutations in our study. Indeed, the differentially expressed miRNAs and mRNAs were associated with the above-mentioned aspects after our analysis.
Function analysis and cMap analysis were conducted that candidate DEMs and DEGs which were screened from TCGA, GEO, and results in published articles were associated with classic cancer-related signaling pathways. Notably, fatty acid metabolism which is the enriched KEGG pathways has been paid enough attention to so far. Fatty acid synthase (FASN) overexpression is associated with MSI-H, independent of sex, tumor location, p53, or KRAS/BRAF status [22]. Then, the connectivity map analysis guided us to 35 potential drugs such as MEK inhibitor. The result also provided evidence that 108 dysregulated genes could represent the molecular background of MSI or MSS.
In this study, we adopted the strict criterion to identify vital miRNA-mRNA regulatory pairs. Briefly, the target mRNA of DEMs should be differentially expressed, significant negative correlated with DEM regulator by Pearson’s correlation, and further validated by two databases containing experimentally validated miRNA-target interactions, miRTarbase and Tarbase. Then, we detected the expression level of 10 negatively correlated miRNA-mRNA regulatory pairs in colon tissues. Ultimately, two pivotal pairs (miR-31-5p/PLAGL2 and miR-361-5p/RAB27B) were considered for inclusion in the logistic regression model. ROC curves and DCA indicated that the complex model (miR-31-5p
We summarized the clinical pathological features in TCGA and miR-31-5p was found to be differentially expressed in different tumor stages of MSI CRC and MSS CRC. RAS gene family (HRAS, KRAS and NRAS) mutation status and BRAF mutation status were confirmed to interact with the expression level of miR-31-5p, miR-361-5p and their target genes. Interestingly, the high expression level of miR-31-5p might be a risk factor in MSS CRC patients and it could be a prognostic biomarker of MSS CRC. MiR-31-5p by targeting PLAGL2 and miR-361-5p by targeting RAB27B could have an impact on tumor microenvironment by interacting with tumor-related inflammation and infiltration of macrophages and CD8
In our study, the differences in miRNA and targeted mRNA expression between MSI CRCs versus MSS CRCs were reported and bio-informatic analysis on these significantly differentially expressed molecules had revealed the potential association with cell cycle, cell proliferation, cell motility, and innate immune response especially toll-like receptors signaling pathway based on function annotation and pathway enrichment analysis. Phenotype analysis of tumor microenvironment has confirmed that two miRNA-mRNA regulatory pairs which could distinguish MSI CRCs versus MSS CRCs might play an important role in tumor-related immunity. Additional studies on the molecular and biological functions of these differentially expressed miRNAs and genes, and the possibility of therapeutic targets for regulating the tumor microenvironment to enhance immunogenicity that could improve the sensitivity of MSI CRCs to immunotherapy will be required to substantiate this hypothesis.
Conclusion
This study established the miRNA-mRNA regulatory network and generated a predictive model of the combination of miRNAs and mRNAs to distinguish MSI CRCs versus MSS CRCs. Real-time detecting the expression levels of miRNAs and target mRNAs during the development of the colorectal cancer may expand the population of CRC who may be earlier access to benefit from immune checkpoint inhibitor-based immunotherapy.
Author contributions
Conception and design: Wei Zhu, Wenfang Cheng and Tongshan Wang.
Administrative support: Wei Zhu.
Provision of study materials or patients: Wei Zhu and Guoxin Song.
Collection and assembly of data: Cheng Liu and Xuan Zou.
Data analysis and interpretation: Cheng Liu, Xingchen Fan, Shuang Peng, and Shiyu Zhang.
Manuscript writing: All authors.
Final approval of manuscript: All authors.
Supplementary data
The supplementary files are available to download from http://dx.doi.org/10.3233/CBM-210408.
Footnotes
Acknowledgments
We thank openbiox community and Hiplot team (https://hiplot.com.cn) for providing technical assistance and valuable tools for data analysis and visualization.