Abstract
BACKGROUND:
Pancreatic ductal adenocarcinoma (PDAC) prognosis has not improved over the last decades because of the lack of effective diagnostic and therapeutic methods in the early stage of the disease.
METHODS:
Several gene expression profiles were downloaded from the Expression Omnibus (GEO) database. We calculated the differentially expressed mRNAs (DEGs) and miRNAs (DEmiRs). Then, we constructed a miRNA-mRNA regulatory network by using the miRWalk database. For the DEGs regulated by DEmiRs, we introduced GEPIA to confirm these DEGs’ expression and effect on overall survival. We used other GEO datasets and mRNA-miRNA target databases to validate these DEGs and their relationship with DEmiRs. All these potential core DEGs regulated by DEmiRs were also analyzed at the single-cell level to confirm their cell type source.
RESULTS:
CCNB2 and KCNN4, which were regulated by several micro RNAs, showed relatively high expression levels in PDAC patients and significant association with worse overall survival. Furthermore, we identified many DEGs at single-cell level and found that 10 oncogenes were significantly upregulated in type 2 ductal cell type, thereby further demonstrating that type 2 ductal cells might be major sources of malignant cells and are valuable therapeutic targets in PDAC.
CONCLUSIONS:
Our data added some new insights into the molecular mechanism of PDAC and may be helpful for finding potential biomarkers for diagnosis. These discovery at single-cell level may also be useful for developing new therapeutic targets for PDAC patients.
Introduction
Pancreatic ductal adenocarcinoma (PDAC) is among the most aggressive and fatal malignancies. Patients with PDAC are often asymptomatic, and many have lymph node and distant metastases, as well as vessel invasion upon diagnosis [1]. Despite radical surgery and adjuvant therapies, overall prognosis has not improved over the last decades due to the lack of effective diagnostic and therapeutic methods in the early stage of the disease.
Misregulation of gene expression and mutations of noncoding RNAs can cause tumorigenesis and progression [2]. miRNAs are small noncoding RNAs that bind the messenger RNAs (mRNA) of hundreds of genes; they result in the degradation of the target mRNA or inhibition of translation and play a significant role in the development and progression of pancreatic cancer [3]. Recently, novel approaches such as gene therapy offer a promising avenue for pancreatic cancer. Targeting oncogenic miRNA strongly inhibits pancreatic cancer tumor growth both in vitro and in vivo [4]. Using “antisense” means that synthetic nucleic acid sequence can silence target mRNA of pancreatic cancer and stabilize the suppression of tumorigenicity [5]. Researchers have proved that miRNA can regulate the expression of mRNA, including membrane proteins, which is the source of cell type biomarkers [6, 7]. However, few studies connected the mRNA regulated by miRNA with cell markers. Therefore, revealing differentially expressed miRNAs (DEmiRs) and identifying the target mRNAs (differentially expressed gene, DEGs) to construct miRNA-mRNA regulatory network of PDAC holds huge potential for biomarkers that can be used in diagnosis and therapy; these networks can serve as predictors of drug response in pancreatic cancer.
Most datasets and analyses of miRNA and mRNA expression are dominated by an entire tumor sample, thus averaging the expression profiles of the constituent cells [8]. Single-cell RNA sequencing (scRNA-seq) technology can measure cell transcription directly in tumor samples. It is of great value to understand the different genes of a single cell in the tumor microenvironment through this technique. Recent research adopted single-cell transcriptome profiling to illustrate the breast cancer transcriptome shaped by the tumor cells and immune cells in the surrounding microenvironment [9]. Another study demonstrated the impact of the stroma in shaping tumor architecture by altering inherent patterns of tumor glands in pancreatic cancer through single-cell technologies [10].
Our study aimed to construct a miRNA-mRNA regulatory network through bioinformatics analysis to find the hub miRNAs and their target functional mRNAs in PDAC. Then, we located the cell type of hub mRNA enrichment at single-cell level to provide potential biomarkers of diagnosis and treatment for pancreatic cancer.
Materials and methods
Microarray data
Gene expression profiles of GSE119794 were acquired from the National Center for Biotechnology Information (NCBI) Gene Expression Omnibus (GEO) database (
The series matrix TXT files and platform TXT files of the databases were downloaded separately.
Screening for DEGs and DemiRs
The DESeq2 package (version 1.28.1) in R software (version 4.0.2) was used to identify DEGs and DemiRs in the GEO dataset [11]. The DEGs and DemiRs were screened out according to the cut-off criterion that
GO and KEGG pathway enrichment analyses of DEGs
The ClusterProfiler package (version 3.16.1) was utilized to analyze gene ontology (GO) and Kyoto Encyclopedia of Genes and Genomes (KEGG) pathway enrichment. Adjusted
Prediction of target genes of DemiRs
miRWalk is a database that can predict miRNA target genes [13]. The interaction between DEGs and DemiRs had inverse expression correlation in a regulatory network. Then, we combined the upregulated DEGs and downregulated DemiRs together and searched for their interaction in miRWalks. Moreover, the downregulated DEGs and upregulated DemiRs were grouped together to search the regulatory pairs. The overlapping gene pairs in miRWalks between the predicted DemiRs target genes and DEGs were obtained for miRNA-mRNA network construction. The Cytoscape 3.6.1 software was used to visualize the regulatory network [14].
Validation of DEGs and miRNA-mRNA network
We introduced another GEO dataset GSE71989 [15] consisting of 14 PDAC and 8 normal pancreas tissues to confirm the DEGs regulated by DemiRs. This independent cohort was analyzed with GEO2R to calculated all the DEGs. Besides, we also checked the miRNA-mRNA network in another miRNA target database called targetScan [16].
Volcano plots for DEGs and DEmiRs in PDAC based on the microarray datasets from GEO. The red dots represent the upregulated mRNA and/or miRNA based on 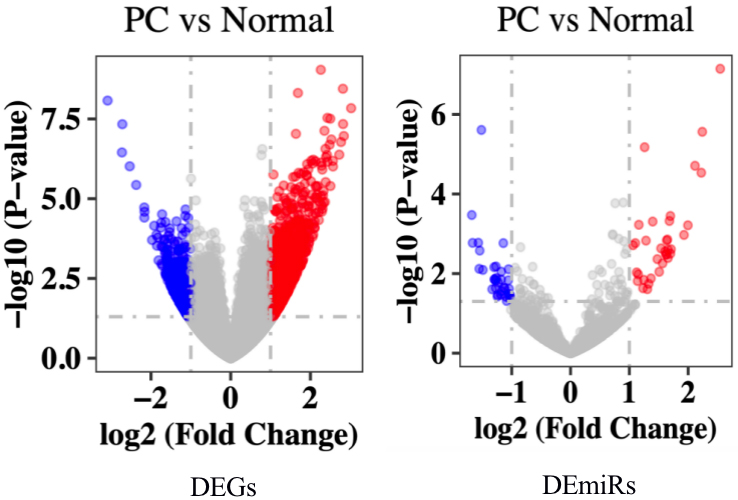
For these DEGs regulated by DEmiRs we introduced an online analysis tool for TCGA datasets, namely, GEPIA, to confirm the DEGs’ expressions and effects on overall survival [17]. Bar plots of each gene’s expression between normal and PDAC samples were plotted. The overall survival (OS) analysis was also finished with the survival analysis module.
Single cell clustering
Finally, we downloaded a total of 57530 single cell expression data from Peng’s PDAC study [18]. First, we performed quality control and filtered cells whose UMI counts were less than 500 or were over 40000, as well as cells with mitochondrial gene expression ratios of over 5%. Secondly, we scale-normalized all the left cells with LogNormalise function in Seurat package (version 4.0.2). Thirdly, we calculated the top 2000 variable genes and used these genes clustered in all the cells with tSNE algorithm. Finally, we extracted all the differentially expressed marker genes in each cell cluster and used these marker genes to name each cell cluster. Furthermore, all these potential core DEGs regulated by DEmiRs were compared with cell type marker genes. Heatmaps of these overlapped marker genes and DEGs were plotted to show their expression pattern in different cell types.
Information on DEGs and DEmiRs from GEO dataset
Information on DEGs and DEmiRs from GEO dataset
The heatmap of DEGs and DEmiRs. The abscissa represents the GEO and miRNA IDs. The ordinate represents the mRNA and miRNA names. Heat map colors correspond to DEGs and DEmiRs, as indicated in the color key: red (upregulated) and blue (downregulated). Blue line, normal samples; green line, tumor samples.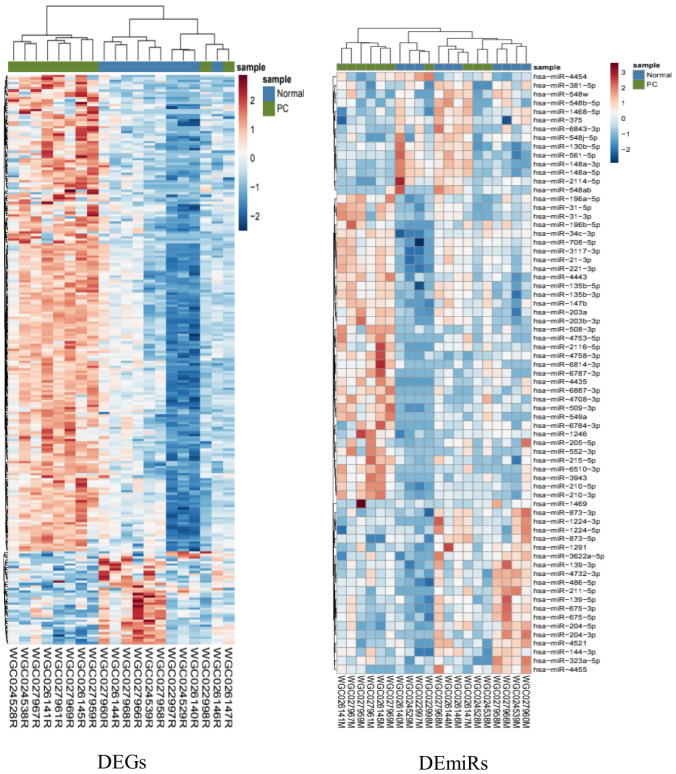
GO enrichment analysis of DEGs. (A) PDAC vs. Normal samples’ upregulated DEGs. (B) PDAC vs. Normal samples’ downregulated DEGs.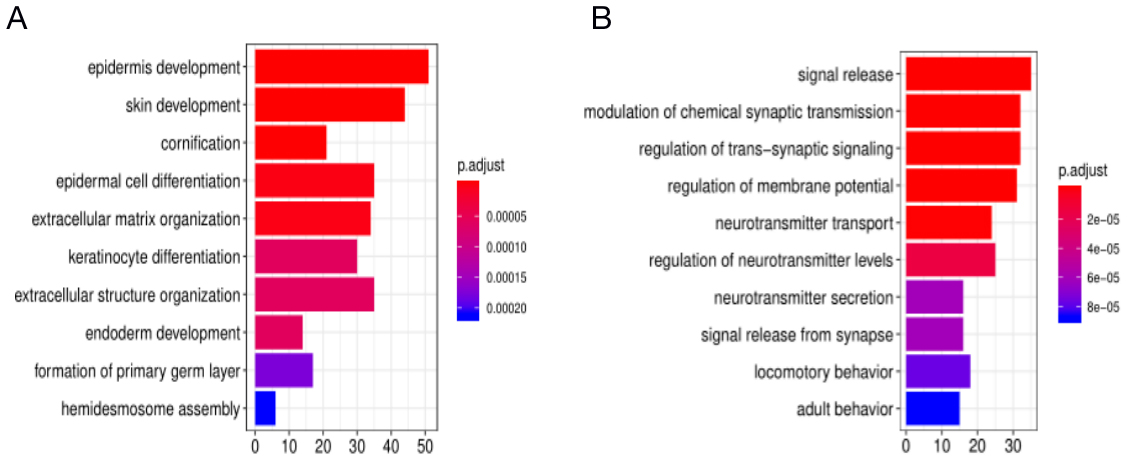
KEGG pathway analysis of DEGs. (A) PDAC vs. Normal samples’ upregulated DEGs. (B) PDAC vs. Normal samples’ downregulated DEGs.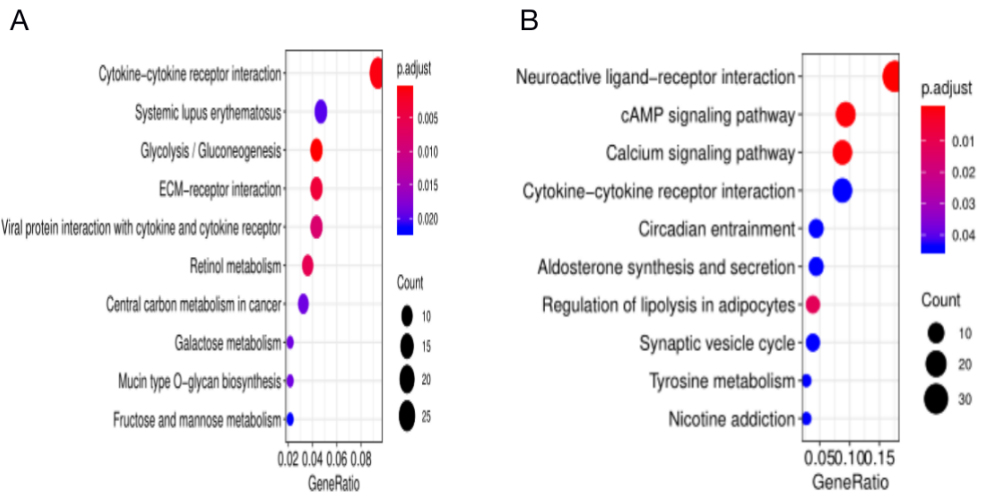
A total of 25369 mRNA and 1993 miRNA were investigated based on high throughput sequencing. A total of 1293 DEGs and 69 DEmiRs were screened by DESeq2 package in R software. Of these, 778 upregulated and 515 downregulated mRNAs and 35 upregulated and 34 downregulated miRNAs were identified (Table 1, Fig. 1). The top upregulated mRNAs (and/or miRNA) and the top downregulated mRNAs (and/or miRNA) were charted on a heat map, as shown in Fig. 2.
Function and pathway enrichment analysis
GO enrichment analysis based on the biological process (BP) showed that upregulated DEGs were significantly enriched (top 10 based on adjusted P value) in epidermis development, skin development, and cornification. Downregulated DEGs were significantly enriched in signal release, modulation of chemical synaptic transmission, and regulation of trans-synaptic signaling (Fig. 3). In addition, KEGG pathway analysis showed that the upregulated DEGs were significantly enriched in cytokine-cytokine receptor interaction, glycolysis, and ECM-receptor interaction signaling pathways. The downregulated DEGs were significantly enriched in neuroactive ligand-receptor interaction, cAMP, and calcium signaling pathways (Fig. 4).
Prediction of miRNA-mRNA regulatory network
As previously described [19], many mRNAs can be inhibited by miRNAs. The results from miRWalk 2.0 database showed that 68 pairs of regulatory genes, including 25 upregulated miRNA and 41 downregulated mRNA in miRNA upregulation and mRNA downregulation groups, were present. There were 127 pairs of regulatory genes, including 30 downregulated miRNA and 68 upregulated mRNA, in miRNA downregulation and mRNA upregulation groups (Supplementary Table 1). By intersecting the predicted target DEGs in miRWalk and DEmiRs, 68 downregulated miRNA and 41 upregulated miRNA with an inverse correlation with target mRNA were identified (Fig. 5). We constructed two groups of regulatory network, including up_miRNA vs DEGs_down_network and down_miRNA vs DEGs_up_network. In addition, the expressed differences of DEmiRs and DEGs (fold change)
The intersection analysis of DEmiR targeted genes and DEGs in miRWalk. up_miRNA_target: upregulated miRNA targeted genes in miRWalk (marked in red); down_miRNA_target: downregulated miRNA targeted genes in miRWalk (marked in yellow); up_DEGs: upregulated DEGs (marked in green); down_DEGs: downregulated DEGs (marked in purple).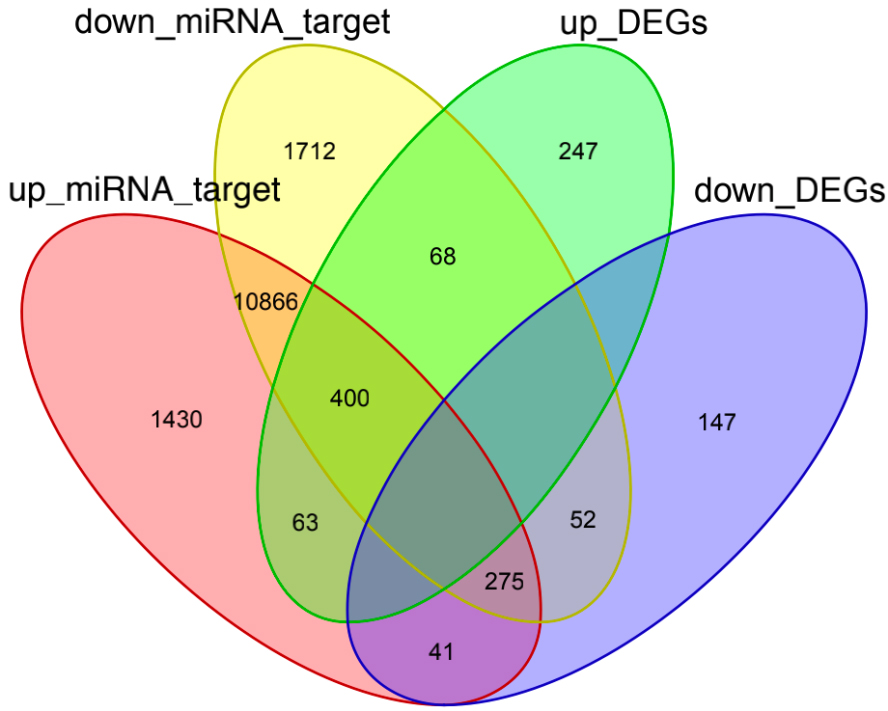
miRNA-mRNA regulatory network. Green circles indicate target genes, and purple circles indicate miRNA. (A) up_miRNA vs DEGs_down_network: upregulated miRNA and target DEGs downregulated; down_miRNA vs (B) DEGs_up_network: downregulated miRNA and target DEGs upregulated. The expression differences of DEmiRs and DEGs (fold change) 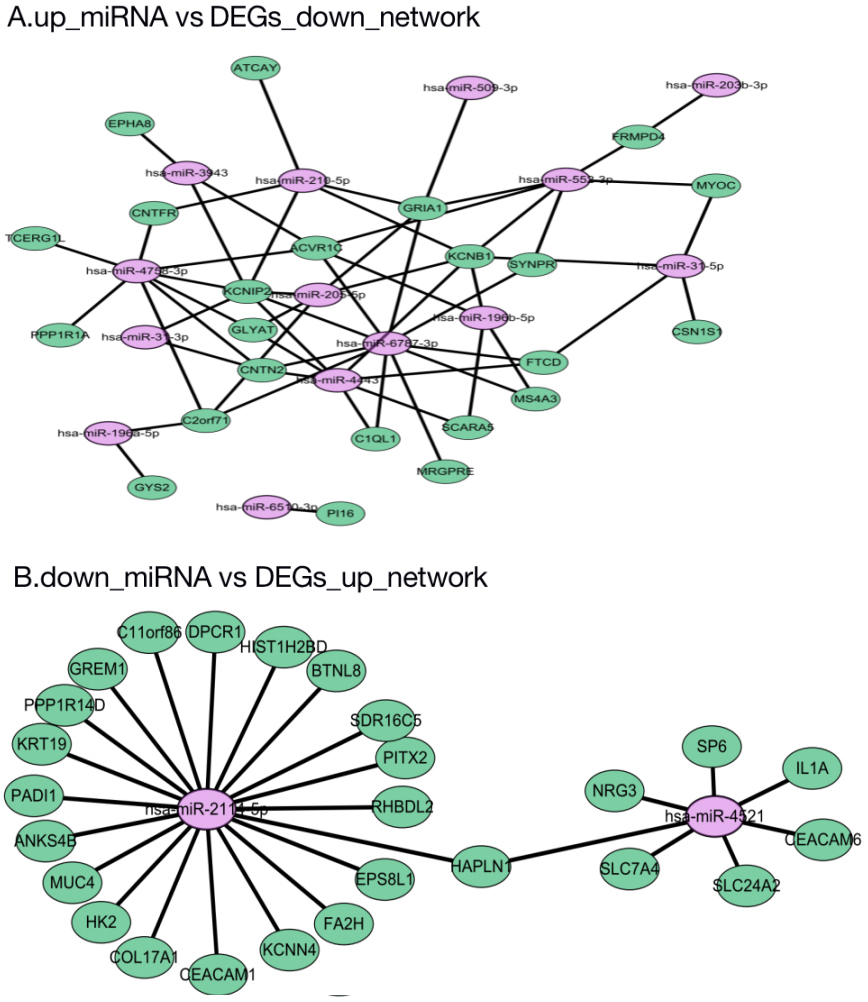
After we constructed these miRNA-mRNA regulatory networks, we introduced another PDAC cohort to confirm the expression pattern of these DEGs regulated by DEmiRs. In these downregulated DEmiRs, the upregulated DEG subgroup 46/68 (67.6%) mRNAs were confirmed, and 60/127 (47.2%) regulation pairs were confirmed. In these upregulated DEmiRs, downregulated DEG subgroup 36/41 (87.8%) mRNAs and 44/68 (64.7%) regulation pairs were confirmed.
Survival analysis of hub DEGs
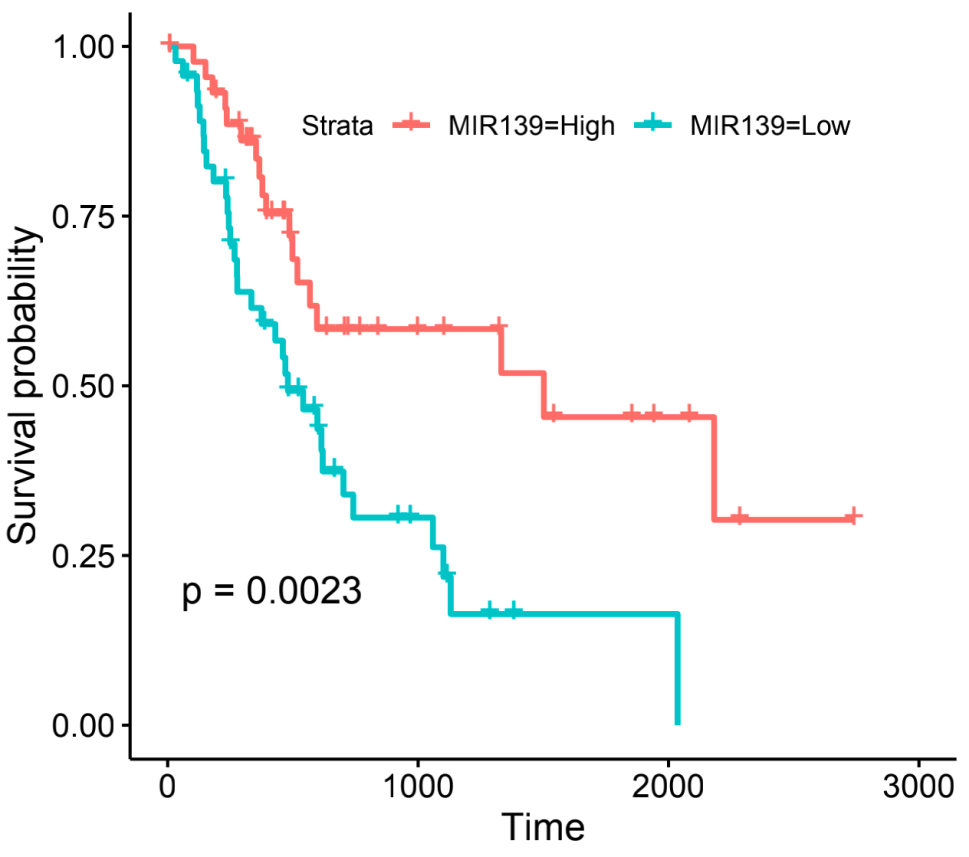
The prognostic values of DEGs regulated by DEmiRs were assessed from the TCGA database in GEPIA. Seven downregulated DEGs’ intersection with TCGA database had no prognostic value in the miRNA upregulation and mRNA downregulation groups. Fifty upregulated DEGs were in intersection with TCGA database in miRNA downregulation and mRNA upregulation groups. Patients with PDAC that had CCNB2 (regulated by miR-139-5p) and KCNN4 (regulated by miR-204-5p) showed worse overall survival (Fig. 7). In addition, we found that hsa-miR-139-5p, which regulates CCNB2, showed a significantly worse prognosis with lower expression level in TCGA (
Prognostic value of two genes in PDAC patients. Plots of the prognostic value of (A) CCNB2 and (B) KCNN4 were assessed from the TCGA database. 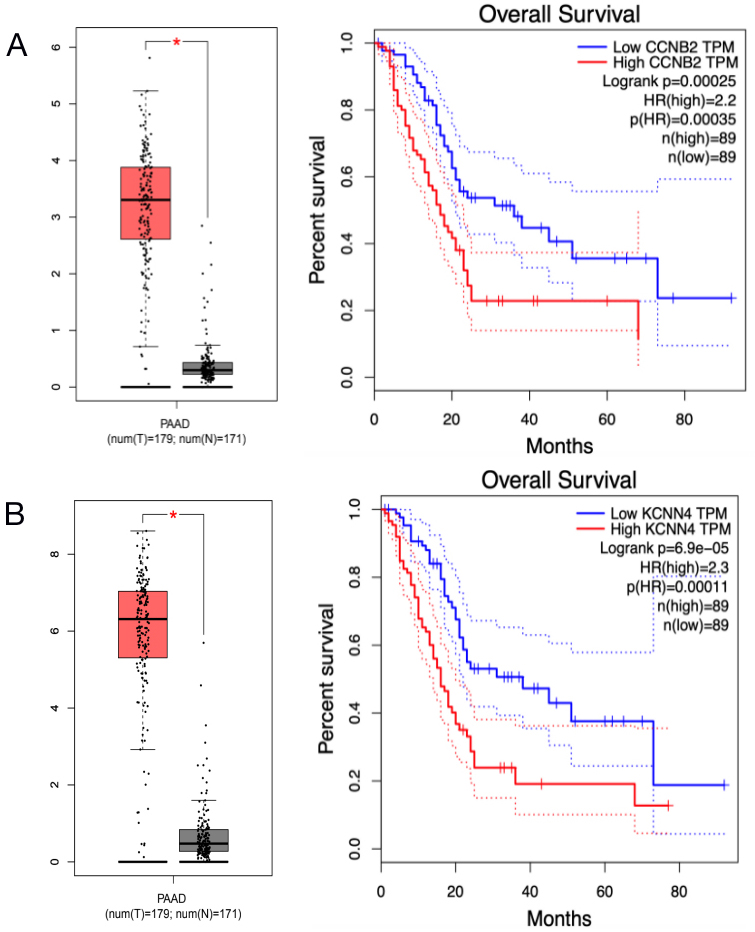
The 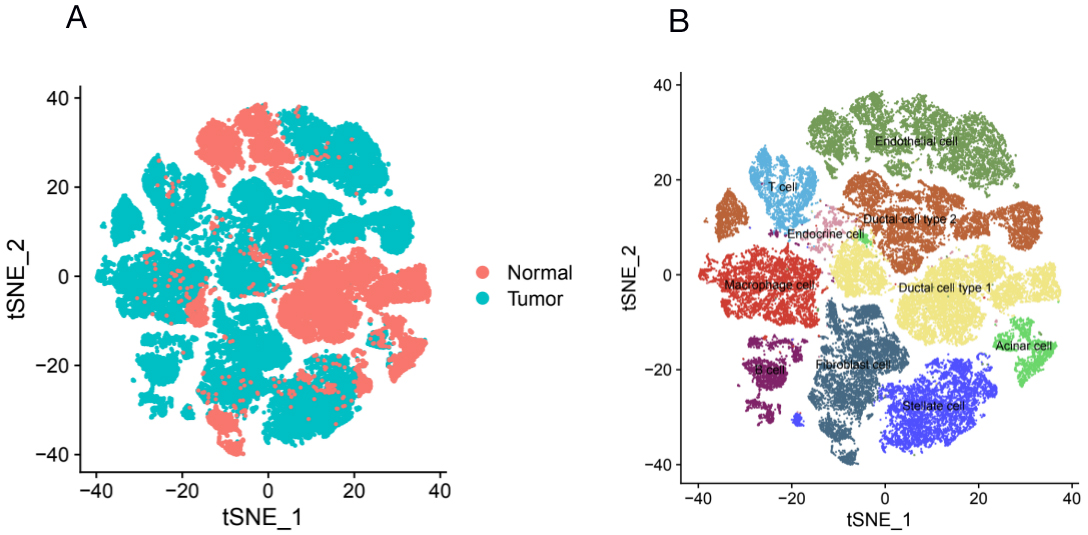
The
Discussion
Detailed molecular mechanisms underlying PDAC are still obscure. The functional pattern of miRNA-mRNA regulatory network is shown in the occurrence and development of a variety of cancers, including lung, gastric, and hepatic cancers [20, 21, 22]. However, a comprehensive miRNA-mRNA regulatory network in PDAC remains largely insufficient. In the present study, we analyzed mRNA expression of GEO datasets and identified a total of 1293 DEGs (comprising 778 upregulated and 515 downregulated mRNAs) and 69 DEmiRs (comprising 35 upregulated and 34 downregulated miRNAs) in PDAC samples (Table 1, Figs 1 and 2). GO enrichment analyses of BP group showed that upregulated DEGs were significantly enriched (top 10 based on adjusted
We constructed two groups of miRNA-mRNA regulatory networks through overlapping gene pairs in MiRWalk, and interactions between the predicted DEmiR target genes and DEGs were obtained (Fig. 6). In addition, expression differences in DEmiRs and DEGs (fold change)
Upregulated DEGs’ expression pattern at single-cell level.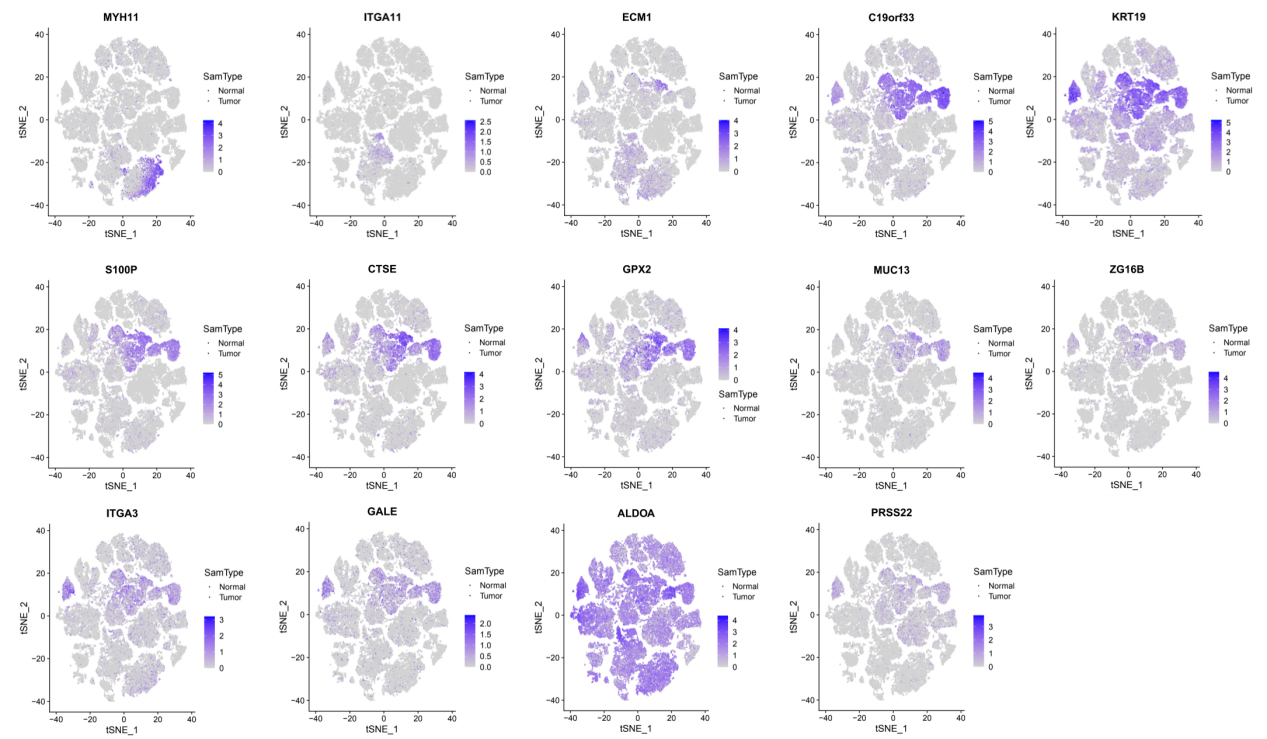
Downregulated DEGs’ expression pattern at single-cell level.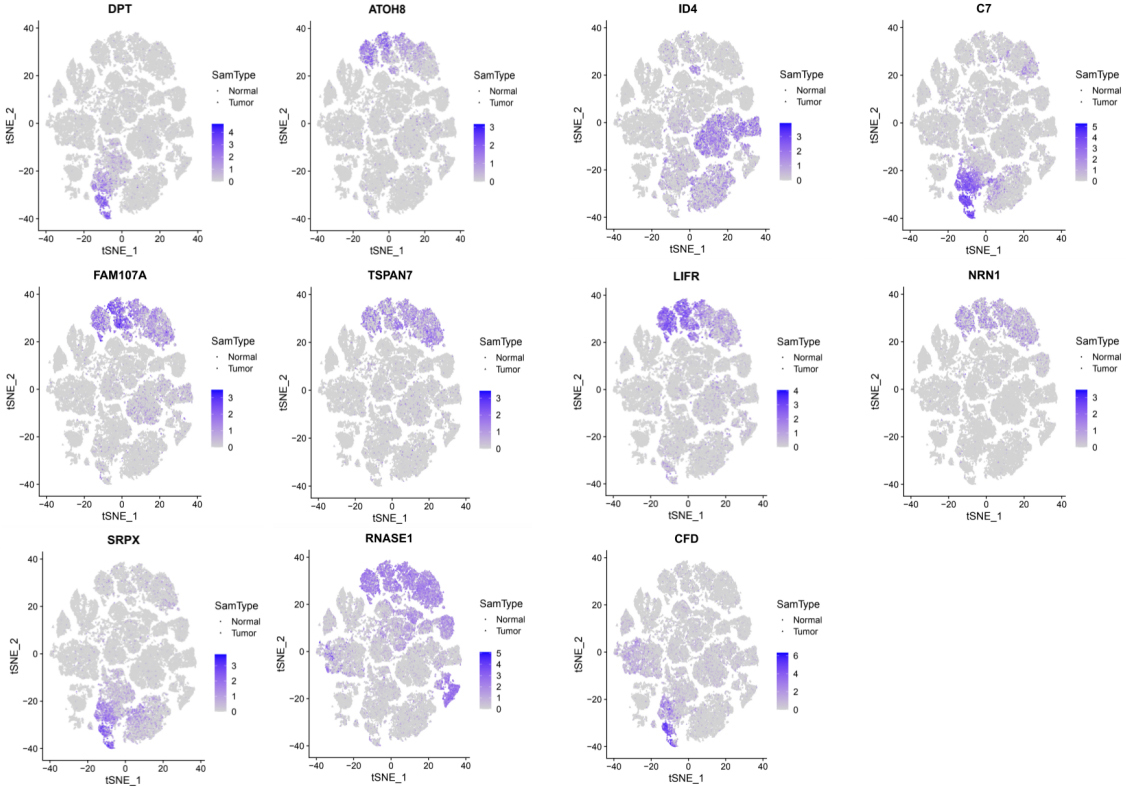
studies have reported on HAPLN1 or its correlation with miR-2114/miR-4521 in PDAC. The mechanism underlying their functions in PDAC needs to be further elucidated.
The prognostic values of DEGs regulated by DEmiRs were assessed from the TCGA database. We found that seven downregulated DEGs’ intersection in the TCGA database had no prognostic value in miRNA upregulation and mRNA downregulation groups. PDAC patients with upregulated expressions of CCNB2 and KCNN4 showed worse overall survival in miRNA downregulation and mRNA upregulation groups (Supplementary Table 1, Figure 7). Cyclin B2 (CCNB2), the target of miR-139 in our study, is a member of the cyclin family of proteins and plays a key role in the progression of G2/M transition. Interestingly, hsa-miR-139-5p showed a significantly worse prognosis with lower expression level in TCGA (Supplementary Figure 1), which was contrary to the prognostic trend of CCNB2. Recent research identified CCNB2 as a potential target gene of miR-139 in HCC [33]. Other studies reported that CCNB2 was correlated with worse survival of PDAC [35], but worse survival does not involve the interactions between CCNB2 and miR-139. Therefore, CCNB2/miR-139 may be identified as a potential target of PDAC therapy when experimental evidence elucidates the underlying mechanisms. Potassium Calcium-Activated Channel Subfamily N Member 4 (KCNN4), which was the target of miR-204-5p in our research, reportedly serves as an oncogene in various cancers [36]. It was reported that patients with high KCNN4 amplification in HCC tissue exhibited shorter disease-free survival, and knockdown of KCNN4 expression could reduce the migration and invasion abilities of HCC [37]. In addition, inhibiting KCNN4 can inhibit the cell proliferation of colorectal cancer [38]. Higher KCNN4 expression was correlated with advanced TNM stages and predicted a poor prognosis in patients with PDAC, which indicated that KCNN4 is a promising therapeutic target [39]. The correlative mechanisms and pathways of miR-204-5p/KCNN4 in PDAC need to be determined.
Many studies could prove that DEGs were up/down regulated in PDAC due to the complexity of cell types and completely different functions of cells in pancreatic tissue. Thus, identifying DEGs’ expression pattern at single-cell level in PDAC is of great significance for the development of clinical diagnosis and targeted therapy. With the advances in single-cell technologies, intratumoral heterogeneity in cell states with the tumor microenvironment have been revealed. Such information is critically needed for the comprehensive understanding of the mechanisms underlying cancer evolution; this detail integrates with multiple layers of information for individual cancer cells through single-cell multi-omics [40]. Peng et al. employed single-cell RNA-seq (scRNA-seq) to identified 10 distinct subpopulations (“clusters”) from 57,530 individual pancreatic cells of PDAC [18]. In our study, because of certain limitations of single-cell sequencing, not all genes were measured. Thus, we only identified 14 upregulated and 11 downregulated DEGs that were analyzed in the single cell dataset (Figs 9 and 10). Previous studies showed that type 2 ductal cells had much higher expressions of poor prognosis PDAC markers, such as CEACAM1/5/6 and KRT19, thereby suggesting that type 2 might be a type of malignant ductal cells [36]. Our results showed that ECM1, C19orf33, KRT19, S100P, CTSE, GPX2, MUC13, ZG16B, ITGA3, and GALE showed significantly higher expression in type 2 ductal cells. The high expressions of ECM1, KRT19, GPX2, MUC13, ZG16B, and ITGA3 promote tumor growth and were associated with poor prognosis in PDAC patients [41, 42, 43, 44, 45, 46]. S100P regulated circular chemorepellent-induced defects (CCIDs) in lymphatic endothelial monolayers of PDAC, suggesting that S100P may be a promising target to inhibit lymph node metastasis [47]. CTSE identified the hub gene and might be the diagnosis target of PDAC [48]. Notably, the correlative mechanisms and pathways of C19orf33 and GALE in PDAC have not been determined. Precnet studies show that C19orf33 was associated with an aggressive phenotype of breast cancer [49]. GALE was upregulated and played an important role in promoting the development of human glioma [50]. More details of the mechanism associated with PDAC of these two genes need to be investigated. These DEGs that promote cancer progression exist in type 2 ductal cells, thereby further demonstrating that type 2 ductal cells are the major source of malignant cells in PDAC. In addition, although there was no obvious evidence, upregulated DEGs (MYH11 and ITGA11) and downregulated DEGs (DPT, C7, SRPX, CFD, ATOH8, FAM107A, LIFR, TSPAN7, ID4, RNASE1, and NRN1) were highly expressed in fibroblast cells, endothelial, and/or stellate cells in PDAC and/or normal samples in our results and may represent the transformation of normal pancreatic cells into cancer cells.
In conclusion, we identified a total of 1293 DEGs and 69 DEmiRs in PDAC and constructed two groups of miRNA-mRNA regulatory network. CCNB2 and KCNN4, which were regulated by several micro RNAs, showed relatively high expression levels in patients with PDAC and significant association with worse overall survival. Of which, CCNB2/miR-139 may be considered as a promising therapeutic target in PDAC. Furthermore, we identified many DEGs at single-cell level and found 10 oncogenes that were significantly upregulated in type 2 ductal cell type. This finding demonstrated that type 2 ductal cells are a major source of malignant cells and valuable therapeutic target in PDAC. Our data added some new insights into the molecular mechanism of PDAC and may be helpful for finding potential biomarkers for diagnosis. These discovery at single-cell level may also be useful for developing new therapeutic targets for PDAC patients.
Author contributions
Interpretation or analysis of data: Bingqing Du and Fang Su.
Preparation of the manuscript: Huihong Liang and Hao Wang.
Revision for important intellectual content: Xiaodong Song.
Supervision: Zili Shao and Yisheng Wei.
Supplementary data
The supplementary files are available to download from http://dx.doi.org/10.3233/CBM-210271.
sj-xlsx-1-cbm-10.3233_CBM-210271.xlsx - Supplemental material
Supplemental material, sj-xlsx-1-cbm-10.3233_CBM-210271.xlsx
Footnotes
Acknowledgments
This work was supported by the Doctoral Initiation Project of the Second Affiliated Hospital of Guangzhou Medical University funding (010G271111 to Bingqing Du) and the National Natural Science Foundation of China Grants (81672436 to YiSheng Wei).
Supplementary data
Prognostic value of miR-139 in PDAC patients. Red line represents the high expression of miR-139 in PDAC. Green line represents the low expression of miR-139 in PDAC.