
Abstract
BACKGROUND:
Although advances have been made in cancer immunotherapy, patient benefits remain elusive. For non-small cell lung cancer (NSCLC), monoclonal antibodies targeting programmed death-1 (PD-1) and programmed death ligand-1 (PD-L1) have shown survival benefit compared to chemotherapy. Personalization of treatment would be facilitated by a priori identification of patients likely to benefit.
OBJECTIVE:
This pilot study applied a suite of machine learning methods to analyze mass cytometry data of immune cell lineage and surface markers from blood samples of a small cohort (
METHODS:
Four different comparisons were evaluated between data collected at an initial visit (baseline), after 12-weeks of immunotherapy, and from healthy (control) samples: healthy vs patients at baseline, Responders vs Non-Responders at baseline, Healthy vs 12-week Responders, and Responders vs Non-Responders at 12-weeks. The algorithms Random Forest, Partial Least Squares Discriminant Analysis, Multi-Layer Perceptron, and Elastic Net were applied to find features differentiating between these groups and provide for the capability to predict outcomes.
RESULTS:
Particular combinations and proportions of immune cell lineage and surface markers were sufficient to accurately discriminate between the groups without overfitting the data. In particular, markers associated with the B-cell phenotype were identified as key features.
CONCLUSIONS:
This study illustrates a comprehensive machine learning analysis of circulating immune cell characteristics of NSCLC patients with the potential to predict response to immunotherapy. Upon further evaluation in a larger cohort, the proposed methodology could help guide personalized treatment selection in clinical practice.
Introduction
Challenges facing immunocheckpoint blockade therapy were recently reviewed [1]. In particular for non-small cell lung cancer (NSCLC), monoclonal antibodies Pembrolizumab and Nivolumab targeting programmed death-1 (PD1) and Atezolizumab and Durvalumab targeting programmed death ligand-1 (PD-L1) [2, 3, 4]. have shown limited but effective objective response rates (ORR) of
Evaluation of immune cell lineage and surface markers may provide a better understanding of the effects of anti-PD-1 and anti-PD-L1 therapy in NSCLC patients. However, these molecular data are often large and complex to analyze. Mathematical models based on statistics and machine learning algorithms applied to intricate datasets may allow for detection of complex associations that may not be identifiable by simpler analyses such as correlations and linear regressions. Different methods have been employed to build such predictive models for application to NSCLC computed tomography (CT) imaging [13], oral cancer [14], and coronary heart disease [15], among others [16, 17, 18, 19]. Recently, we applied machine learning to metabolomic profiles of NSCLC patient tissue samples to predict disease control and progressive disease groups as response to first-line therapy [20].
This pilot study applies a suite of machine learning models to analyze immune cell surface and lineage expression data from a small set of NSCLC patients treated with monoclonal antibodies at both initial and 12-week visit timepoints. The primary study goal is to determine which patients will respond to treatment based on their relative immune cell numbers and proportions of cell surface and lineage marker expression. Secondary goals include identifying which features are potentially important in prediction and to help elucidate immune cell response changes post therapy. Longer term, differences between responders and non-responders could lead to evaluation of potential therapeutic targets.
Materials and methods
Sample collection
All specimens were collected following approved Internal Review Board protocols at University of Louisville Hospital (IRB 15.0273) from patients with known NSCLC. The samples were obtained with the understanding and written consent of each subject. The study conforms with the Code of Ethics of the World Medical Association (Declaration of Helsinki), printed in the British Medical Journal (18 July 1964). Demographic information, including age, sex, race, smoking history, personal history of malignancy, and relevant family history were recorded. Samples were collected by the clinical team, blinded to the research analysis.
Patient characteristics
Patient data were collected at the UofL Health – Brown Cancer Center. There were six healthy controls, thirteen NSCLC patients, four of which did not respond to treatment, and nine who had no cancer growth after 12-weeks of treatment. Further classifying the NSCLC, eleven of the patients had adenocarcinoma and two had squamous cell carcinoma. One patient had a previous history of cancer, which was successfully treated. Mean patient age was 66 with most patients lying in 53–78 range; only patients of white and African American races were represented.
Evaluation of response
Data were collected at an initial visit and after 12-weeks at follow-up. Output variable was a two-level factor on whether the cancer progressed (non-responders) or stabilized/regressed (responders), determined via computed tomography (CT).
Human PBMC isolation
Whole blood samples were centrifuged at 1600 rpm for 10 min. Plasma was aspirated and aliquoted into 1 mL Eppendorf tubes and immediately stored at
Mass cytometry sample preparation and data collection
Cell expression and lineage markers were collected using Maxpar Direct Immune Profiling kit (Fluidigm, SKU 201325) and time-of-flight mass cytometry (cyTOF) techniques. PBMCs were isolated as described above. Cells were stained according to manufacturer’s instructions. Briefly, 0.8–1.5
Prior to acquisition, samples were washed twice with Cell Staining Buffer and kept on ice until acquisition. Cells were resuspended at a concentration of 1 million cells/mL in Cell Acquisition Solution containing a 1/9 dilution of EQ 4 Element Beads (Fluidigm). Samples were acquired on a Helios (Fluidigm) at an event rate of
The study was limited to the markers provided in this kit, and because a kit was used, determining that some markers are not useful in outcome prediction may not reduce the materials, time, or cost of testing a sample. This differentiation will, however, provide insight to the downstream effects of immunotherapy treatment. Markers collected are shown in Supplementary Table 1. Maxpar changed their kit during the course of the study, so only samples detected by both versions of the kit were considered for analysis. Supplementary Table 2 and Supplementary Table 3 summarize the roles and cell populations affiliated with each of the markers used.
R cytometry libraries
R packages flowCore, FlowWorkspace, openCyto, ggCyto, and flowTrans were downloaded from Bioconductor open-source software for bioinformatics and were instrumental in performing storage, handling, gating, and transformation of the mass cytometry data.
Preprocessing: Mass cytometry normalization
Median calibration bead expression was computed for each set of data collected by CyTOF. The variance among the calibration bead expression was found to be insignificant, so no normalization based on calibration beads was performed.
Data transformation for improved gating
To better identify distributions in the data collected from mass cytometry, hyperbolic arcsin transform was performed on the data. flowTrans was used to optimize the parameters
Gating strategy to identify immune cells
Several layers of gating are required to attain useable data by removing doublets and dead cells so their expression does not influence later determination of cell types [22]. Approach is summarized in Supplementary Fig. 1:
Determine intact cells by gating cells with high DNA 191Ir and low signal in an empty channel (in this case 140Ce) Calibration beads should be visible in empty channels only – data with high DNA 191Ir and high bead signal should not be used. DNA 191Ir and 193Ir should be strongly correlated – upper right is left off because those are likely cell doublets; this will not remove them all, but limits them. Cells with lots of metal (and doublets) show higher event length, so filter those out; cell size may correlate with event length, but it is not causative. High Rh indicates cell was dead before the test so it should not be used; CD45 marks immune cells.
Gating for immune cells
Gating was automated by specifying minimum and maximum thresholds for trough detection. This separated little to no expression from high expression of a given marker. Examples are shown in Supplementary Fig. 2 for 1D and 2D gating. In initial analysis, B-cell markers commonly good predictive features, so B-cells were chosen as the predominant cell investigated. Following initial gating to isolate immune cells, rest of the gating was performed as specified by Supplementary Table 4 on hyperbolic arcsin transformed data.
Forming input variables
Gating was automated by specifying minimum and maximum thresholds for trough detection. This separated little to no expression from high expression of a given marker. Examples are shown in Supplementary Fig. 2 for 1D and 2D gating. In initial analysis, B-cell markers commonly good predictive features, so B-cells were chosen as the predominant cell investigated. Following initial gating to isolate immune cells, rest of the gating was performed as specified by Supplementary Table 4 on hyperbolic arcsin transformed data.
Model type and parameters
The models chosen for analysis include Multilayer Perceptron (MLP), Elastic Net (EN), Random Forest (RF), and Partial Least Squares Discriminant Analysis (PLSDA). These models represent machine learning algorithms that have been successfully applied to two-class outcome prediction problems. Logistic regression models were made using one feature at a time. Each type of model has parameters built into its architecture that can be varied as part of the optimization process. Every parameter setting was chosen via experimentation using a range of values. Models were trained using the caret R package [23]. Some settings and reporting measures were adjusted for incompatibility with model types.
Model validation
0.632 Bootstrapping was chosen as validation method. It involves many iterations of sampling the data with replacement to create a large group of sets. Each iteration has data that was not selected, and these samples are known as out-of-bag samples used for validation. Set of samples from each iteration is used to train the models and validate the results. Number of sampling iterations used for the validation was determined by experimentation. When model coefficients stabilized, the lower limit on iterations was found. Ten thousand iterations were found to be sufficient for each dataset. Some of these iterations were discarded when out-of-bag samples did not have at least one sample from each of the two outcome variables.
Assessing model performance
Performance metrics including AUROC (area under the receiver operating characteristic (ROC) curve), sensitivity, sensitivity, balanced accuracy, and kappa were recorded for every trained model, while AUROC was used as metric for validation. Pracma R package function trapz was used to compute AUROC trapezoidal estimate. The trainControl function of caret, which sets up many parameters for the train function, has a parameter called selectionFunction. It was set to “oneSE” so that the selected model after training was with the AUROC within one squared error of the best. This was done to avoid model overfitting.
Feature importance
The varImp function from caret R package was used to determine which variables were most important in making the prediction for each model. With a large set of features, each model could select a different set and still have great performance. To add another metric for identifying important variables, Spearman’s rho statistic was used to determine rank-based association. Features that have low
The varImp function from caret R package was used to determine which variables were most important in making the prediction for each model. PLSDA weights are a function of the reduction of the sums of squares across the number of PLS component. Elastic Net variable importance is the absolute value of the coefficients of the tuned model. For Random Forest varImp calculates the mean of the (scaled) class-specific decreases in accuracy and reports it for each of the classes. MLP and other models that do not have a predefined method use a filtering approach where an ROC curve analysis is conducted on each feature [23].
Patient characteristics
Patient characteristics
Study Workflow. (A) Study profile. Of 13 patients eligible for the study and placed on anti-PD-1 therapy, 9 patients had regressed or stable disease, and 4 had disease progression at a twelve-week follow-up. 3 non-responders were on Pembrolizumab and 1 was on atezolizumab. (B) Maxpar Direct Immune Profiling Kit for mass cytometry was used to determine cell expression and lineage markers. Variable importance was used to select feature subsets before training PLS-DA, RF and MLP models. (C) Visual example of model training and validation. For bootstrapping validation, n randomly selected samples are drawn with replacement from a population with n samples. Samples that are drawn are known as in-bag samples and are used as the training data for the models. Any unselected data is known as out-of-bag and is used for model validation. This process is repeated 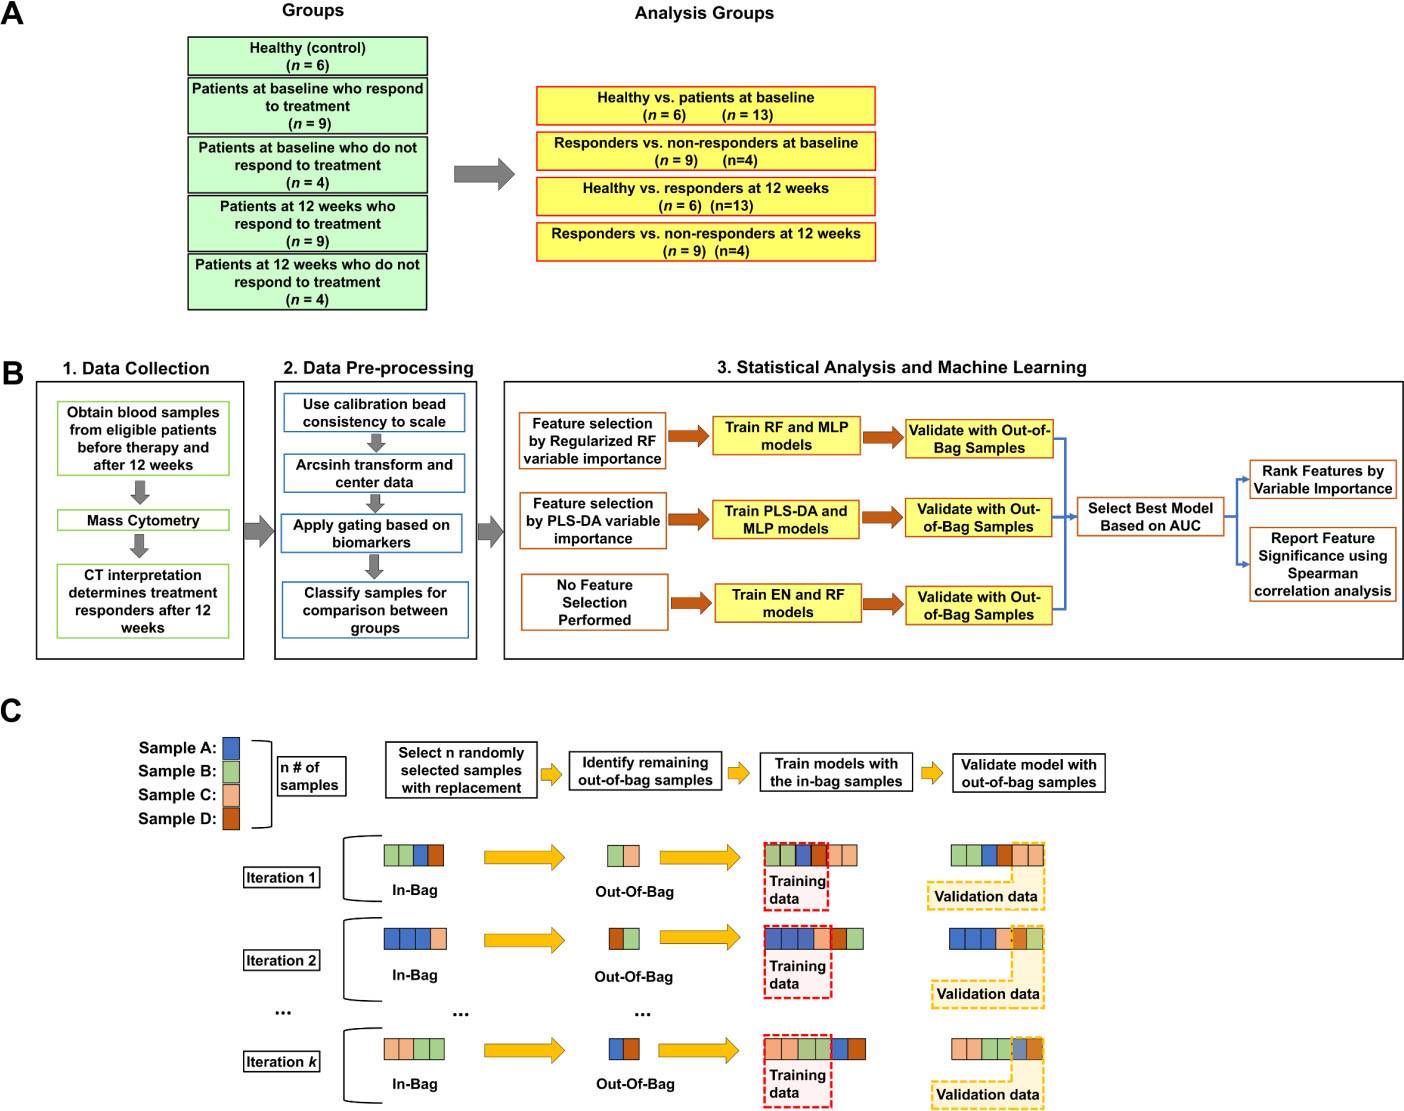
Classification model results: (A) Healthy; (B) Baseline Responders vs Non-Responders at baseline; (C) Healthy vs 12-week Responders; (D) Responders vs Non-Responders at 12 weeks. Each classification shows AUROC for highest performing model and variable importance graph ranking. Darker bars indicate subset of features needed for the best model to perform as shown in ROC plots. Colour figure online.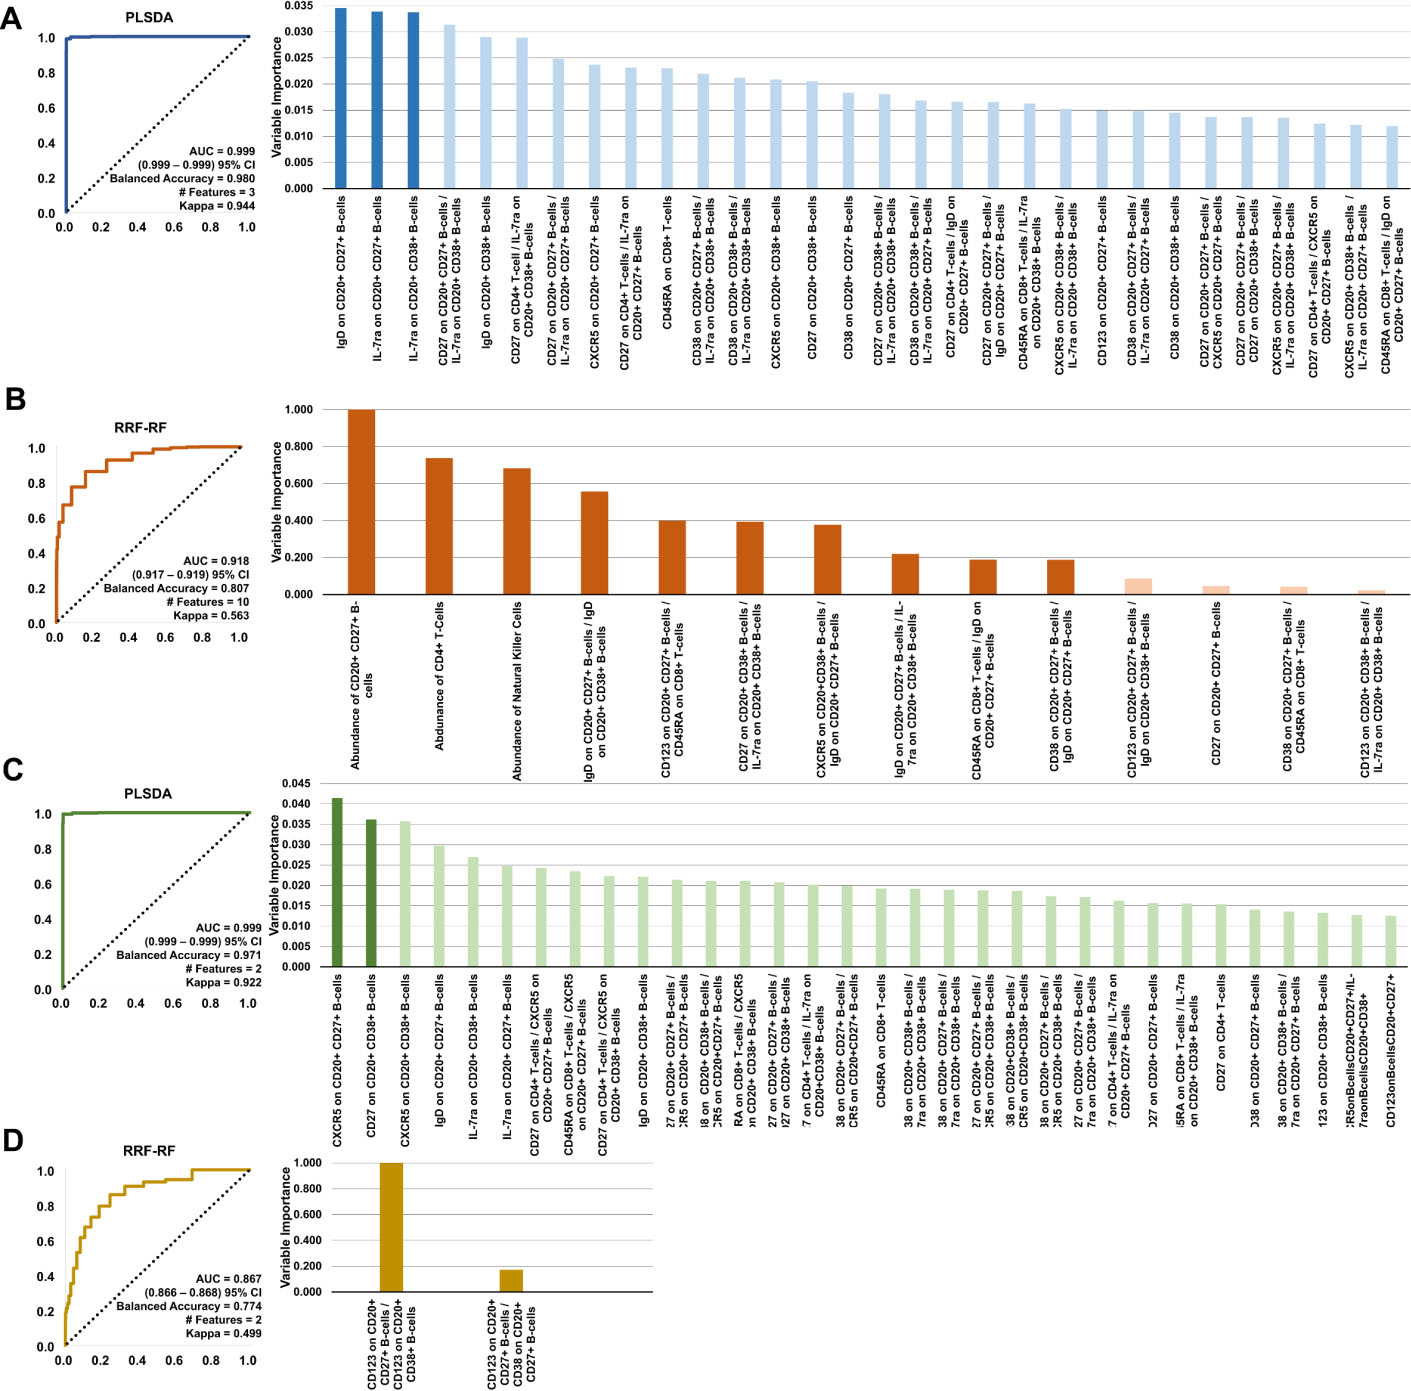
Regularized Random Forest (RRF) and Partial Least Squares (PLS) methods were used for feature selection with the RF and MLP models. The models were made with an increasing number of top variables until a peak model performance was found. The other models did not require feature selection because it is intrinsic to them. Accordingly, the six models used for predictive analysis were: RF, RRF-RF, RRF-MLP, PLSDA, PLS-MLP, and EN, where models with two names (e.g., RRF-RF) denote first the feature selection method hyphenated with the predictive model. Corresponding optimal model parameters are in Supplementary Table 5.
Model outcome summaries. Features used to build the best performing models are indicated in the selected features column
Model outcome summaries. Features used to build the best performing models are indicated in the selected features column
Patient characteristics are summarized in Table 1. A flow diagram of study workflow is in Fig. 1, describing the training of the models and their validation.
The following four patient comparisons were evaluated between data collected at an initial visit (baseline), after 12-weeks of immunotherapy, and from healthy (control) samples: healthy vs patients at baseline, Responders vs Non-Responders at baseline, Healthy vs 12-week Responders, and Responders vs Non-Responders at 12-weeks. The algorithms Random Forest (RF), Partial Least Squares Discriminant Analysis (PLS-DA), Multi-Layer Perceptron (MLP), and Elastic Net (EN) were applied to find features differentiating between these groups and provide for the capability to predict outcomes. Figure 2 reports the highest performing models for each of the patient classifications: Healthy vs. patients at baseline with PLS-DA (AUC
Relative abundance of key features for each comparison. Each box represents 1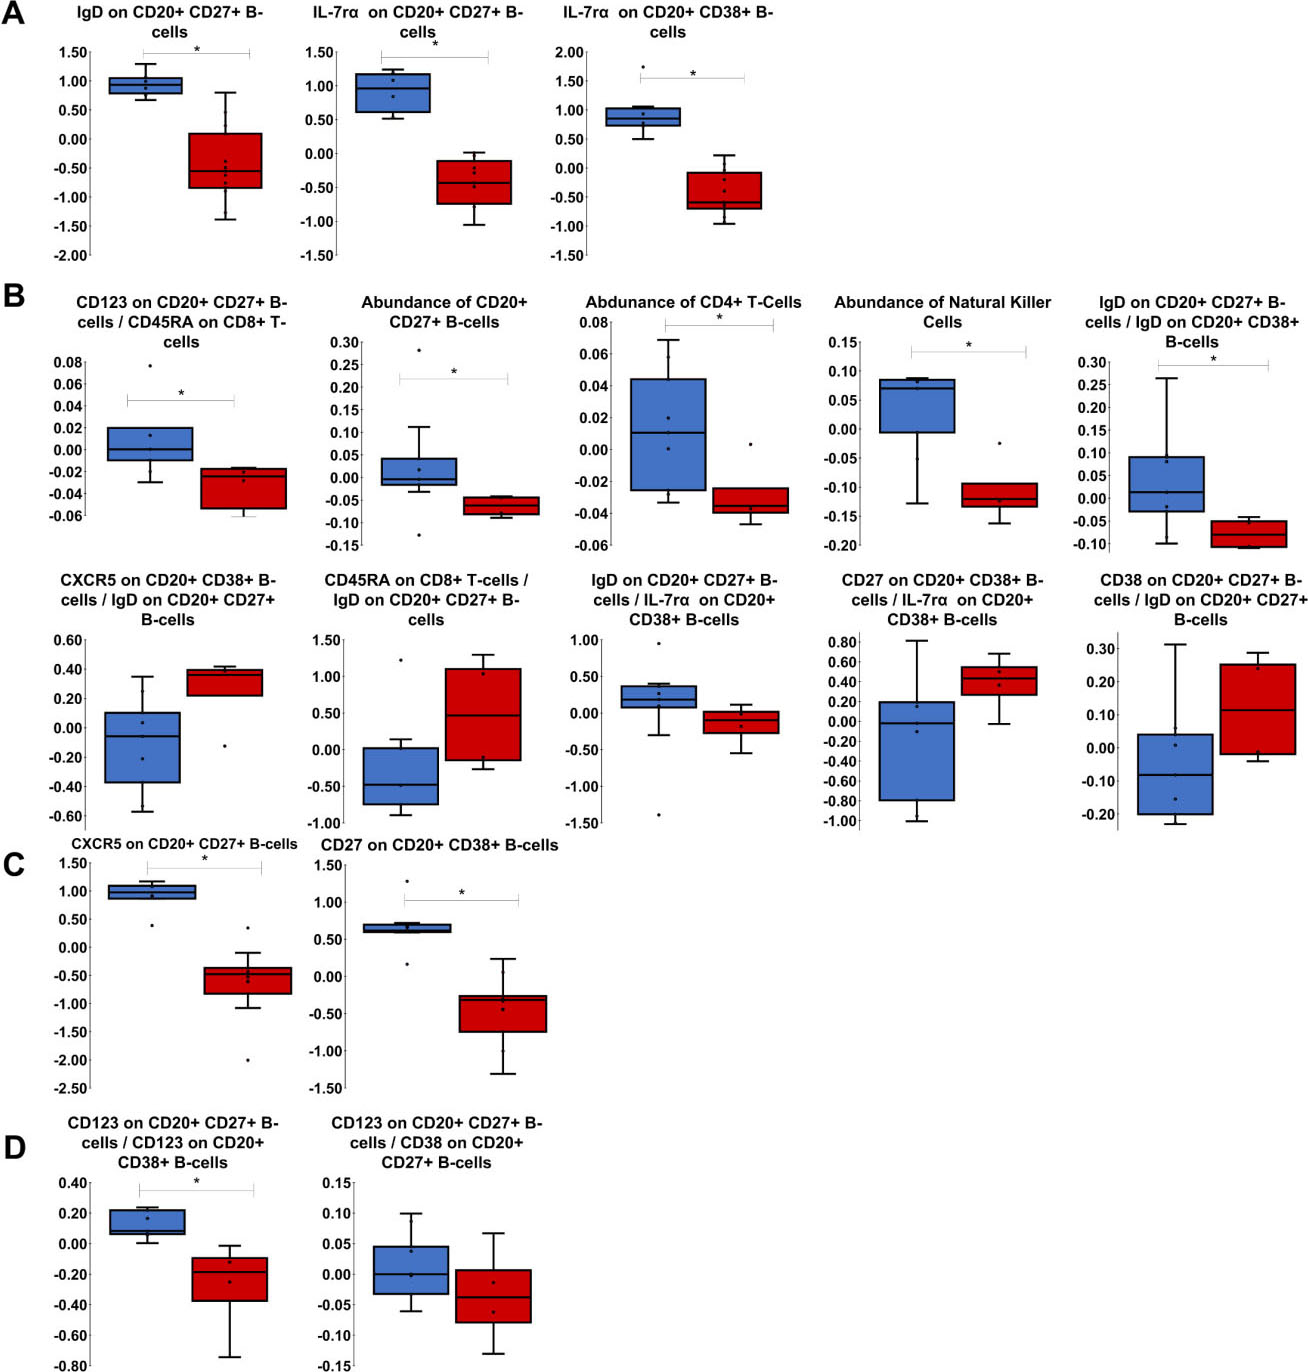
For Healthy vs Baseline comparison (Figs 2A and 3A), PLS-DA was the best performing model, and it only needed the three features of IgD on B-cells that are CD20
Comparison of Responders vs Non-Responders at baseline (Figs 2B and 3B) evaluated all samples before immunotherapy. RRF-RF was the best performing model with 10 features selected as important. Five of these were significant with Wilcoxon rank-sum test in addition to being selected by variable importance: amount of CD20
Healthy subjects and 12-week Responders were best predicted by the PLS-DA model (Figs 2C and 3C), with only two features: CXCR5 on B-cells that are CD20
This proof-of-concept study applied a variety of machine learning approaches and feature selection methods to predict response of NSCLC patients to any one of nivolumab, pembrolizumab, atezolizumab, and durvalumab immunotherapies based on mass cytometry data of blood-borne immune cell lineage and surface markers. Four different patient comparisons were evaluated: healthy vs baseline, responders vs non-responders at baseline, healthy vs 12-week responders, and responders vs non-responders at 12-weeks. Homogenizing the groups based on the immunotherapy is another route for analysis that could provide essential information to better understand how each treatment affects the immune system differently, but there were insufficient samples to perform that analysis in this study. Some research has been done comparing each of the PD-1/PD-L1 inhibitors, and in many ways, there is no significant difference in NSCLC progression between nivolumab, pembrolizumab, atezolizumab, and durvalumab [24, 25]. One difference that was noted is that durvalumab had a better overall response rate than atezolizumab [24]. The 95% confidence interval on the hazard ratio, however, nearly expanded to 1 by reaching 0.98, so further investigation may be warranted. The differences in the side effect profiles of each treatment certainly prove that they affect the immune system differently, but since the cancers do not progress differently, we suspect these features of the immune system were insignificant to the model predictions. For this reason and because they all affect the same receptor/ligand combination, the four immunotherapies were considered interchangeable in this analysis. The study adhered to CHARMS checklist [26] to ensure the integrity of the prediction models. Although the number of samples was small, the number of features obtained through the study methodology was sufficient to accurately differentiate between the samples without overfitting to the data. A traditional method of validation, k-fold cross-validation, was unable to be used because its limitations with small sample sizes. Bootstrapping validation, as used in this study does not have the same restrictions, and with high enough iterations, simulates outcomes comparable to k-fold cross-validation. More samples would be needed for an additional layer of external validation.
Regularized Random Forest feature selection followed by a Random Forest model (RRF-RF) and partial least squares discriminant analysis (PLSDA) had the highest AUC (
The cell types chosen for evaluation this study (Supplementary Table 4) represent fundamental cells that make up the innate and adaptive immune systems. The role of cytotoxic CD8
Higher IL-7R
One of the highest ranked features in the Baseline Responders vs Baseline Non-Responders comparison was the abundance of NK cells (Fig. 3B). Patients who saw improvement with immunotherapy had more NK cells than those who had cancer progression. It is known that the NSCLC tumor microenvironment suppresses NK cell function [36]. Higher abundance of NK cells prior to treatment suggests that immune cell function may be less altered by the tumor and thus immunotherapy is able to trigger an effective response. Another highly ranked feature in this patient comparison was the abundance of CD4
Several proportions of surface markers between immune cells were found to be significantly higher in Responders than in Non-Responders at baseline (Fig. 3B), including CD123 on CD20
CXCR5 on CD20
The proportion of CD123 on CD20
Combinations of immunotherapy with radiotherapy have been studied, but it remains unclear which patients would benefit from combination treatment [45]. Chemotherapy options have been compared to antibody treatments for determination of which would be a more successful first line treatment. Docetaxel has been studied as an alternative to Pembrolizumab in NSCLC, and it was concluded that Pembrolizumab offered overall longer survival [46]. Although combination therapies have become standard of care, this study focused on patients on monoclonal antibody monotherapies to isolate relevant features for analysis.
The features highlighted in this study should be investigated further to assess their involvement in NSCLC immunotherapy response and prediction of patient outcomes. Variables other than immune cell lineage and surface markers may also contribute to these outcomes. Of note, some features found in this study may have no clinical significance, and their importance to prediction might be accredited to random chance based on the small sample size or to unknown mechanisms of interaction in the immune response. Limitations of this study include the small number of samples and the existence of potential confounding factors such as age, ethnicity, and type of immunotherapy. These limitations could cause the models to have poor generalization to patient populations with dissimilar characteristics, and because of this, the models should be validated with additional data sets. This validation would strengthen the argument for use of monoclonal antibody monotherapy on NSCLC patients based on particular immune profile characteristics.
Author contributions
Conception: AM, SM, HM, RK, PN, JY, HF.
Interpretation or analysis of data: AM, SM, HM, XH, JY, HF.
Preparation of the manuscript: AM, SM, HM, JY, HF.
Revision for important intellectual content: AM, SM, HM, JY, HF.
Supervision: JY, HF.
Supplementary data
The supplementary files are available to download from http://dx.doi.org/10.3233/CBM-210529.
sj-pdf-1-cbm-10.3233_CBM-210529.pdf - Supplemental material
Supplemental material, sj-pdf-1-cbm-10.3233_CBM-210529.pdf
Footnotes
Acknowledgments
Authors acknowledge the UofL Health – Brown Cancer Center Biorepository and the Brown Cancer Center Clinical Trial office for their support of this project. HF acknowledges partial support by the National Institutes of Health/National Cancer Institute grant R15CA203605. JY acknowledges partial support by the National Institutes of Health/National Cancer Institute grant R01CA213990. CyTOF was performed in the Functional Immunomics Core supported by NIH P20GM135004.