
Abstract
BACKGROUND:
Extracellular vesicles(EVs) is an emerging approach of cancer liquid biopsy. Although the precipitation-based method with commercial kits has gained popularity as the second most commonly used technique, these protocols vary tremendously with many included reagents still unknown to the community.
METHODS:
In this study, we assigned each of the 3 clinical plasma samples into 6 aliquots to assess five commercial EV isolation kits, in comparison with ultracentrifugation(UC). We implemented a standardized EV preparation and transcriptome analysis workflow except the EV isolation methods used. The metrics of EVs and its RNA cargo (evRNA) were compared to assess the technical variations versus the biological variations in the clinical setting.
RESULTS:
Although the size range of the isolated EVs demonstrated a similar distribution, we found significant technical variability among these methods, in terms of EV amount, purity, subpopulations and RNA integrity. Such variabilities were further relayed to a drastic divergence of evRNA expression on a transcriptome-wide fashion.
CONCLUSIONS:
Our study demonstrated a highly variable result from polymeric precipitation-based EV isolation methods, making EVs based biomarker analysis difficult to interpret and reproduce. We highlighted the importance of benchmarking and transparent reporting of the precipitation-based protocols in the liquid biopsy research.
Introduction
According to the EV-TRACK public database, a number of isolations techniques are currently available for EV research covering multiple study aims. We found the precipitation-based EV isolation techniques remained as the second commonly used method for EV preparation in the community, especially for the biomarker discovery (A). The overall workflow of this study. Blood specimens from metastatic, primary tumor patient and healthy control were divided into 6 aliquots for plasma preparation, EV isolation, RNA extraction, library construction and next-generation sequencing. All samples were processed with unifying protocol except the different EV isolation methods being used (B).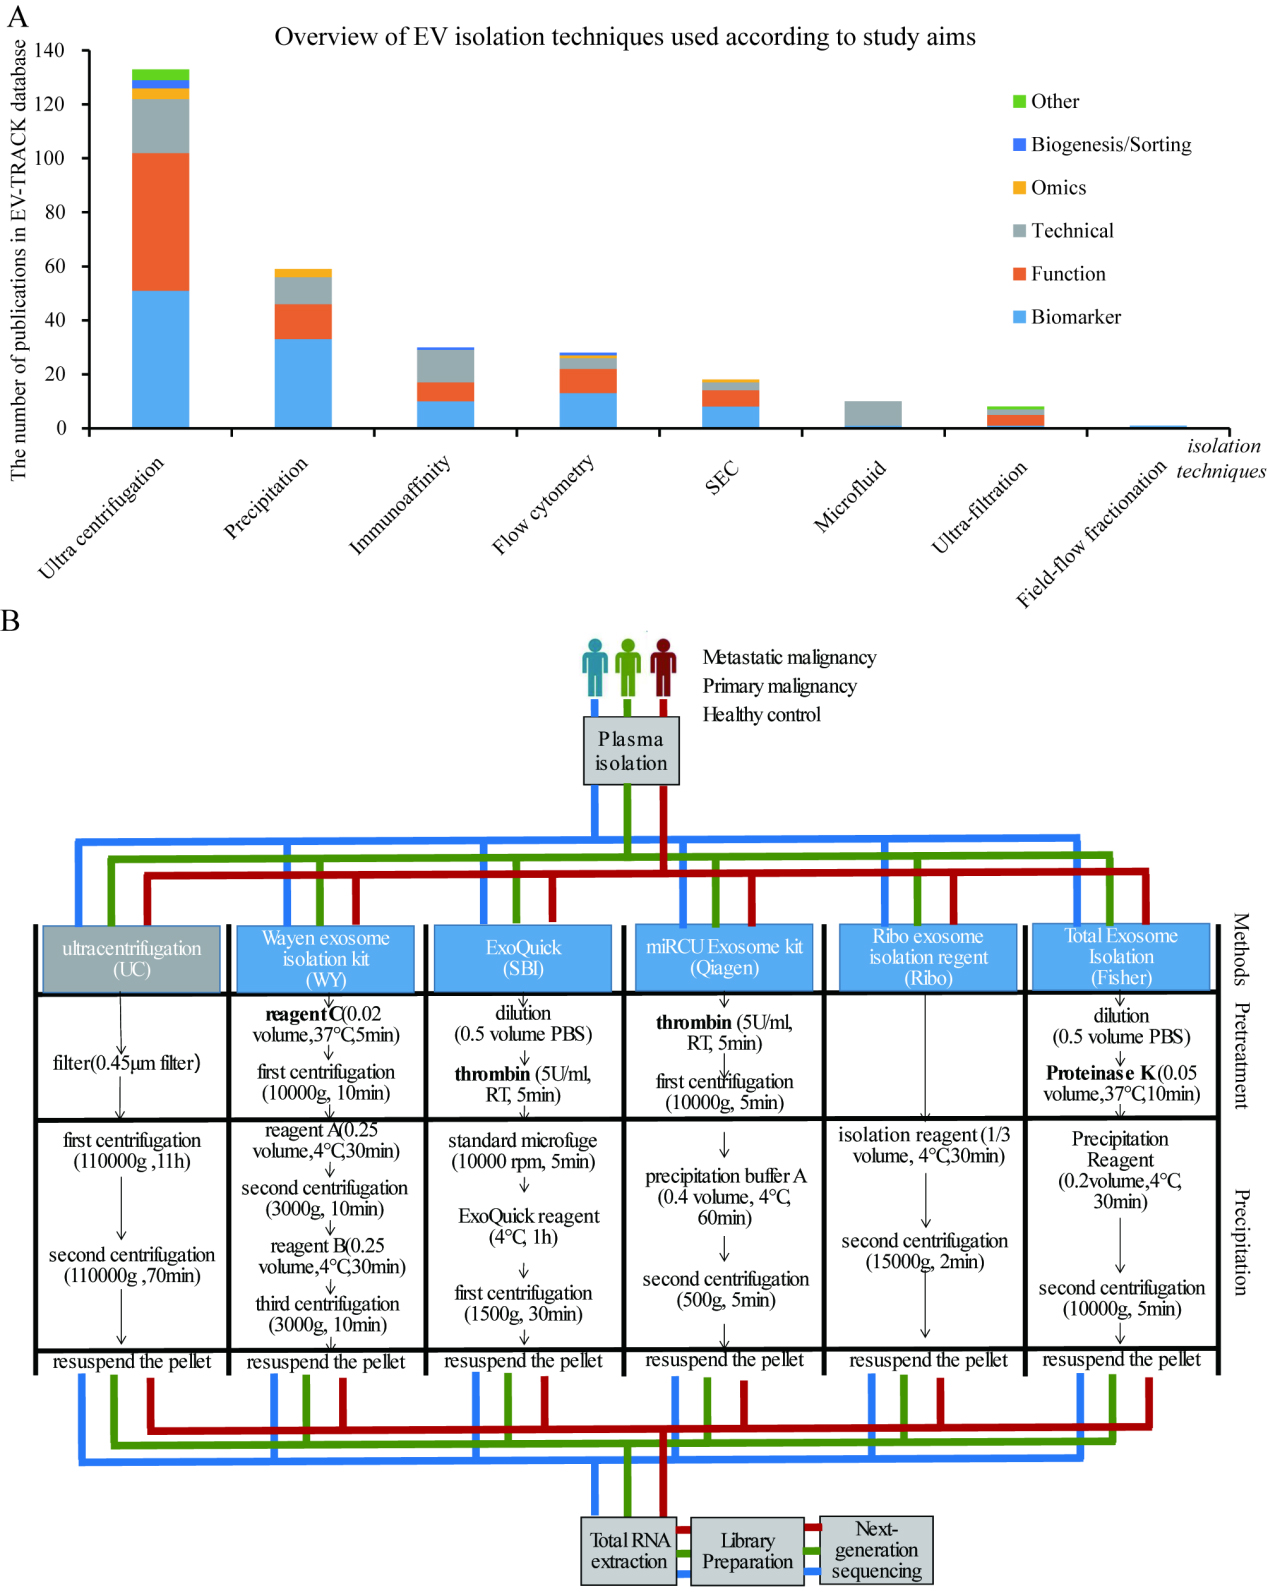
Liquid biopsy of circulating nucleic acids is now gaining popularity in clinics to track predictive and prognostic biomarkers of cancer. Extracellular vesicles (EVs) are groups of particles secreted by almost all cells and tissues into the body fluid, which contain nucleic acids and proteins related to tumor progression [1], immune response [2], and antigen presentation [3]. They are therefore viewed as an emerging target for liquid biopsy techniques [4]. There are numerous isolation techniques currently available with translational potential for the clinical detection of EV biomarkers. Of these, the polymeric precipitation-based EV isolation has been widely accepted in the field as the second most commonly-used technique following ultracentrifugation (UC) in the literature (Fig. 1A and Supplementary Table 1), possibly due to its efficiency, scalability and high recovery rate for the clinical samples [5]. Extensive work has been done comparing the precipitation-based technique with methods based on other principles such as UC [6, 7], size-exclusion chromatography (SEC) [8, 9], immunoaffinity-based approaches [6], and so on. However, it has been noted that rather than being a single entity, the precipitation-based techniques are surprisingly far from being standardized. The isolation protocols vary tremendously from one to another, with many of the precipitating reagent (PEG, dextrans, polyvinyls, and so on.) and other adjuvants unspecified. To date, there is still a lack of data validating the homogeneity and reproducibility of these precipitation-based methods with clinical samples in a high-throughput manner.
In this study, we implemented a standardized workflow with patient-derived blood samples to assess five commercial EV isolation kits, in comparison with UC as a reference. We found a notable technical variability of the EV yielded by different precipitation-based methods, which further led to a significant divergence of the extracellular RNA (evRNA) on a transcriptome-wide fashion. Our study conforms to previous guidelines [10] and has been registered in the EV-TRACK knowledgebase (EV-TRACK ID: EV200008).
Patients and specimens
The study protocol was approved by the Institutional Review Board (IRB) as part of our longitudinal observational clinical research project registered at clinicaltrial.gov (trial ID: NCT03108677). A total of 18 mL blood plasma samples was obtained from the peripheral blood of metastatic osteosarcoma pooled from three patients (Met group), and then equally divided into six aliquots of 3 mL to compare the six isolation methods. Similarly, six aliquots of 3 mL plasma samples from non-metastatic primary osteosarcoma pooled from three patients (Pri group) and six aliquots of 3 mL plasma samples pooled from three healthy control subjects (Con group) were also prepared. All patients and healthy controls were matched according to gender and age. Patients were free of any systemic treatment for at least one month before the blood was drawn to minimize a potential inter-individual variation. All plasma samples were collected using the Vacutainer Glass Blood Collection Tubes with Acid Citrate Dextrose (BD, USA) and centrifuged at 2000
EV isolation
We selected five EV isolation kits based on the precipitation-based principle widely used in the researcher’s community: the ExoQuick Plasma Prep and the Exosome Precipitation Kit (System Biosciences [SBI], Cat.no. EXOQ5TM-1), the Total Exosome Isolation (from plasma) (Thermo Fisher Scientific [Fisher], Cat.no. 4484450), the Wayen Exosome Isolation kit (H-Wayen biotechnologies [WY], Cat.no. EIQ3-02001), the Ribo Exosome Isolation Reagent (for plasma or serum) (RIBOBIO, [Ribo] Cat.no. C10110-2) and the miRCURY Exosome Kits (QIAGEN, [Qiagen] Cat.no. 76603). A brief overview of the technical protocols of UC, WY, SBI, Fisher, Ribo and Qiagen has been illustrated in Fig. 1B. Notably, the instructions by Fisher, WY, Qiagen, and SBI included the implementation of a thrombin/proteinase/unknown reagents pretreatment step according to the manufacturer’s instructions while that of Ribo did not. The operating steps of EV extraction with every kit were performed in accordance with the respective instructions.
As a control for the various EV isolation kits, UC was also performed. Plasma was first diluted 1:2 with PBS, and then centrifuged at 10,000
Western blot (WB) analysis
To further evaluate the vesicle-associated biomarkers of the extracted EVs, EV pellets as well as the U2OS cell lysate (CL) was used. The U2OS cell-line was purchased from The Cell Bank of Type Culture Collection of Chinese Academy of Sciences, Shanghai, China (www.cellbank.org.cn) with the corresponding STR profiling as a cell-line authentication. According to the previous guildeline [11], an array of protein markers for defining the presence of EV were used, including CD63, CD81, CD9, TSG101, and Calnexin. Albumin (ALB) and Apolipoprotein A-1 (ApoA 1) were used as an indicator of co-precipitate contaminations in EV pellets. Vimentin (VIM) were also included as a potential surface cancer marker of sarcoma [12]. Radioimmunoprecipitation Assay (RIPA) buffer (EpiZyme, Cat.no. pc101) was added into the EV lysis samples and they were put on ice for 30 min. They were then centrifuged at 12000
Nanoparticle tracking analysis (NTA)
The concentration and the size distribution of the EV suspensions were measured using a ZetaView nanoparticle tracking analyzer. This machine is equipped with a 405 nm laser which detects the size and quantity of sample particles. Videos of 60 s duration were taken by its camera 0.743
Transmission electron microscopy (TEM)
To prepare samples for TEM, 20
Total evRNA library preparation and next-generation sequencing
Total EV RNA was extracted using the miRNeasy Micro Kit (Qiagen), following the standard manufacturer’s instructions, and an Agilent 2200 Bioanalyzer TapeStation (Agilent Technologies) and the ND-1000 Nanodrop (ThermoFisher) were used to measure the RNA size distribution and quantification. RNA-seq library preparation and next-generation sequencing were performed by Guangzhou RiboBio Co., Ltd. Briefly, a strand-specific RNA-seq library was prepared using the NEB Next Ultra RNA Library Prep Kit for Illumina (NEB #E7645, New England Biolabs) according to the manufacturer’s instructions. Total evRNA, ranging from 50 ng–200 ng, was fragmented, followed by cDNA synthesis, end-repair, A-base addition, and ligation of the index adapters. The original protocol was adjusted so that the RNA fragmentation was performed with the First Strand Synthesis Reaction Buffer and the Random Primer Mix at 90
Bioinformatics analysis
In order to apply the RNA-seq data bioinformatics pipeline in a reproducible manner, we adopted VIPER (Visualization Pipeline for RNA-seq analysis) [16], a standardized analysis workflow that combines tools of RNA-seq analysis from raw sequencing data, through alignment and quality control, into downstream expression. Briefly, the transcriptome assembly was performed with the human reference genome Hg19 using STAR [17]. Following rRNA removal, a gene count matrix was output from RSEM [18] and gene expression was quantified in FPKM (fragments per kilobase per million fragments mapped) for further analysis. Read quality metrics were measured using RSeQC [19] to estimate the gene body coverage and the UTR content. The expression matrix from Cufflinks was processed to generate a pairwise sample-sample clustering map and sample-feature (gene) hierarchical clustering map to depict the similarity/distance within each sample. RNA biotypes were evaluated by FeatureCount [20] using the gene count matrix. To assess the variability caused by technical factors (the six different isolation methods) and biological factors (Con, Pri, and Met), we compared gene expression variability as the standard deviation (SD) divided by the median of the expression value in a normalized manner. For each gene, we compared the variability across the three disease conditions from UC, as well as from the commercial kits (averaging across the five kits) to assess the full biological deviation of each gene. We also compared the inter-sample variation, measured as the variability of gene expression among three plasma specimens, with the inter-kit variation, measured as the variability of gene expression among the five commercial kits. Finally, we evaluated the overlap of the top 50 most expressed genes in UC, Ribo, WY, Qiagen, and SBI with a Venn graph, neglecting the Fisher kits due to the failure of library preparation in the Fisher_con evRNA.
Statistical analysis
Because the assumption of equal variance and normal distribution was not guaranteed regarding the EVs and the evRNA statistics, and repeat measurement of the same sample was performed across different kits, we compared the EV yield of different methods using Friedman test with R ver4.0.0. To identify the correlation of various characteristics of EV across different kits, the repeat measure correlation analysis was conducted using R package (“rmcorr”) [21].
Comparison of the EV pellets from various isolation methods. (A) The physical appearance of EV pellets from each method. (B) The size distribution of EV isolated by different methods using nanoparticle tracking analysis (NTA). (C) The number of EV per milliliter of blood plasma. (D) The amount of co-precipitated protein in each sample isolated by different methods.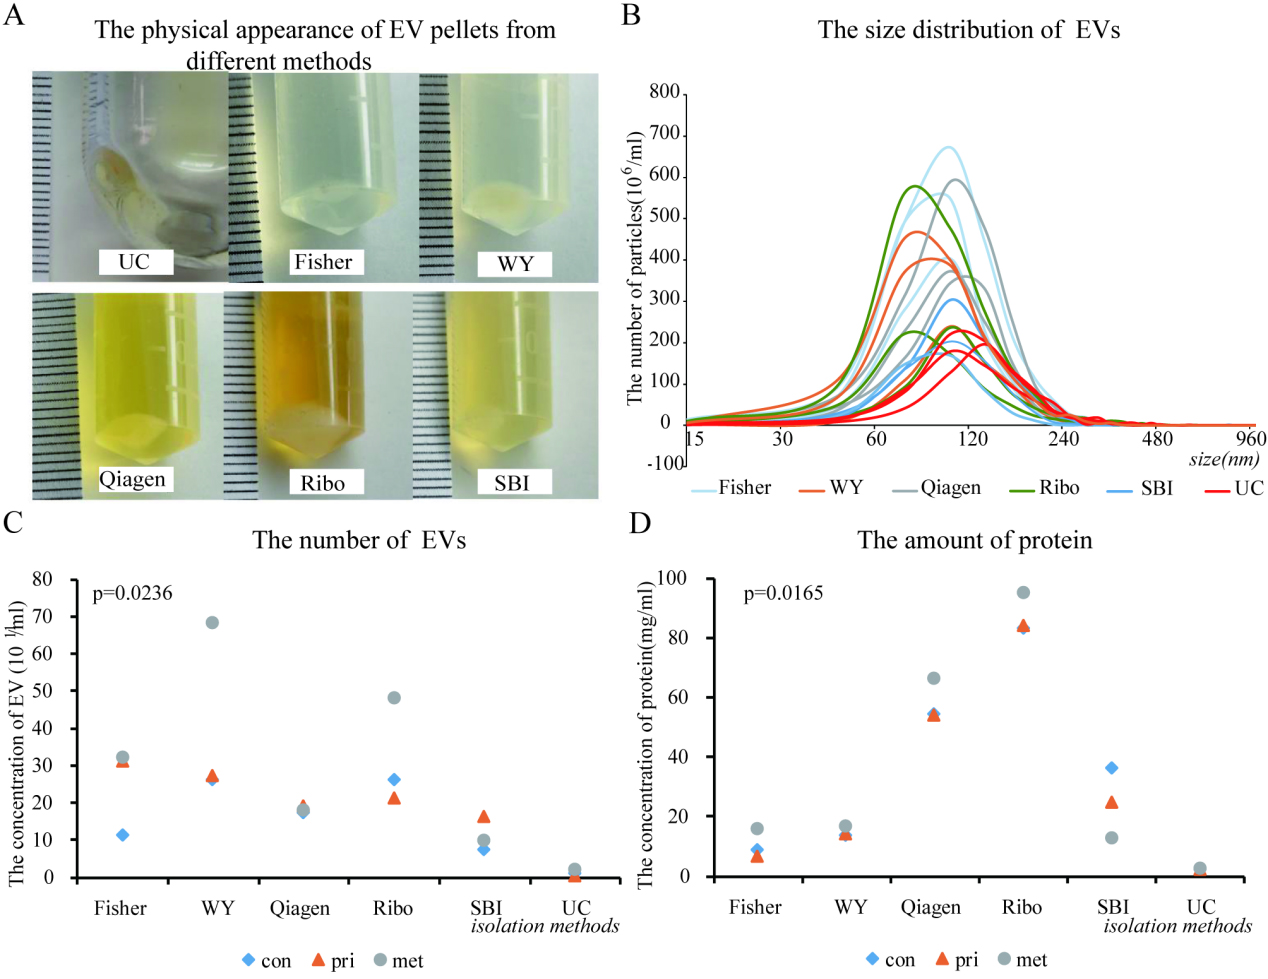
Transmission electron microscopy (TEM) and vesicle-associated biomarkers assay of the EV. (A) An exemplary graph of TEM suggested a cup-shaped vesicles with a size of approximately 100 nm. To assess the subpopulation of EV from different methods, western blotting of various vesicle-associated biomarkers were compared among different EV isolation method (B) and (C).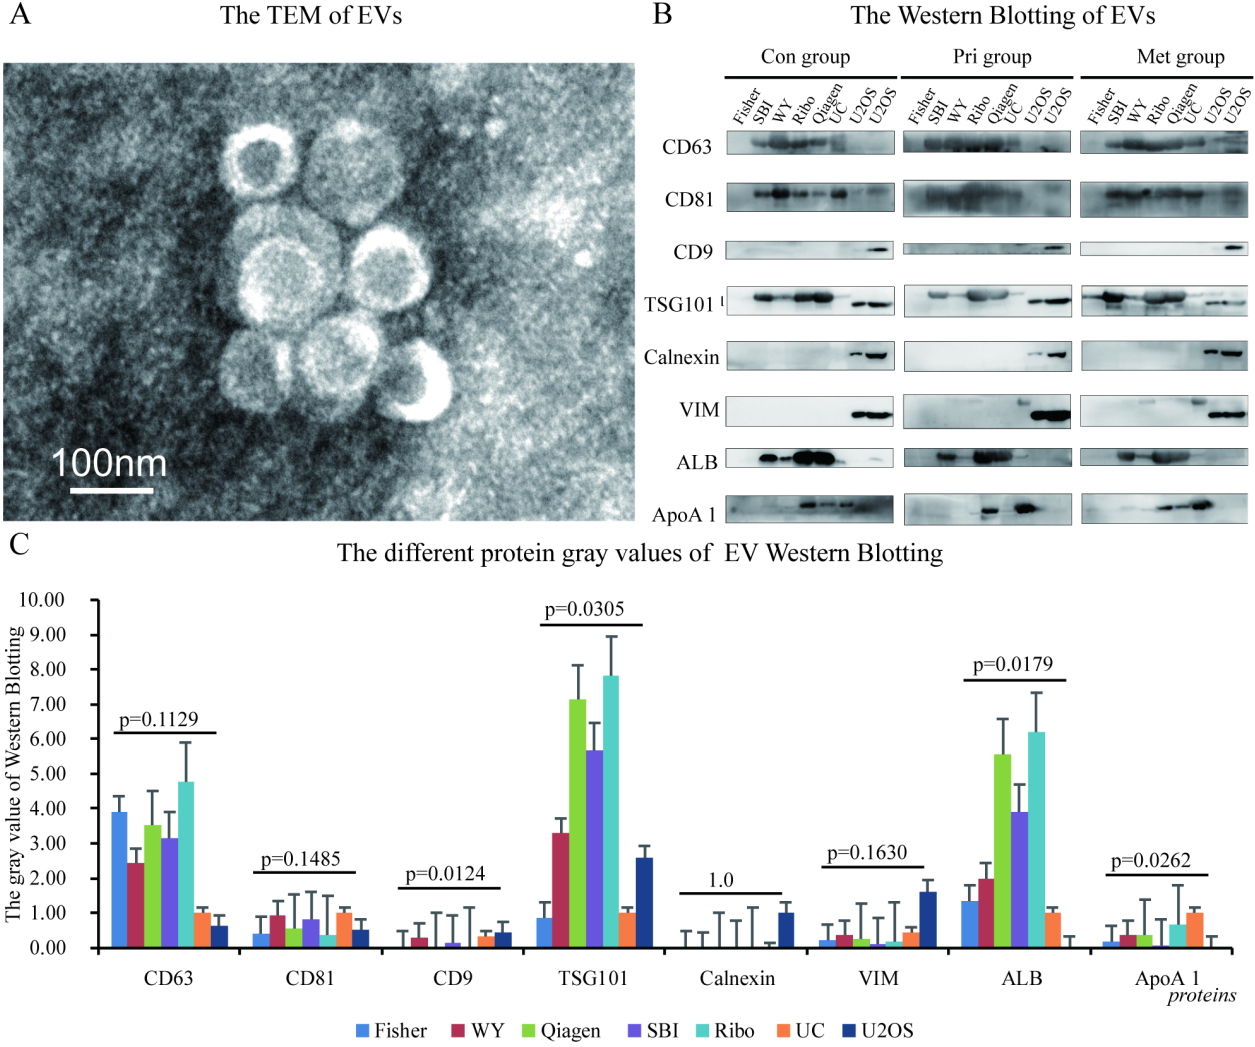
The size of EV isolated by different methods were not significantly different among the isolation methods (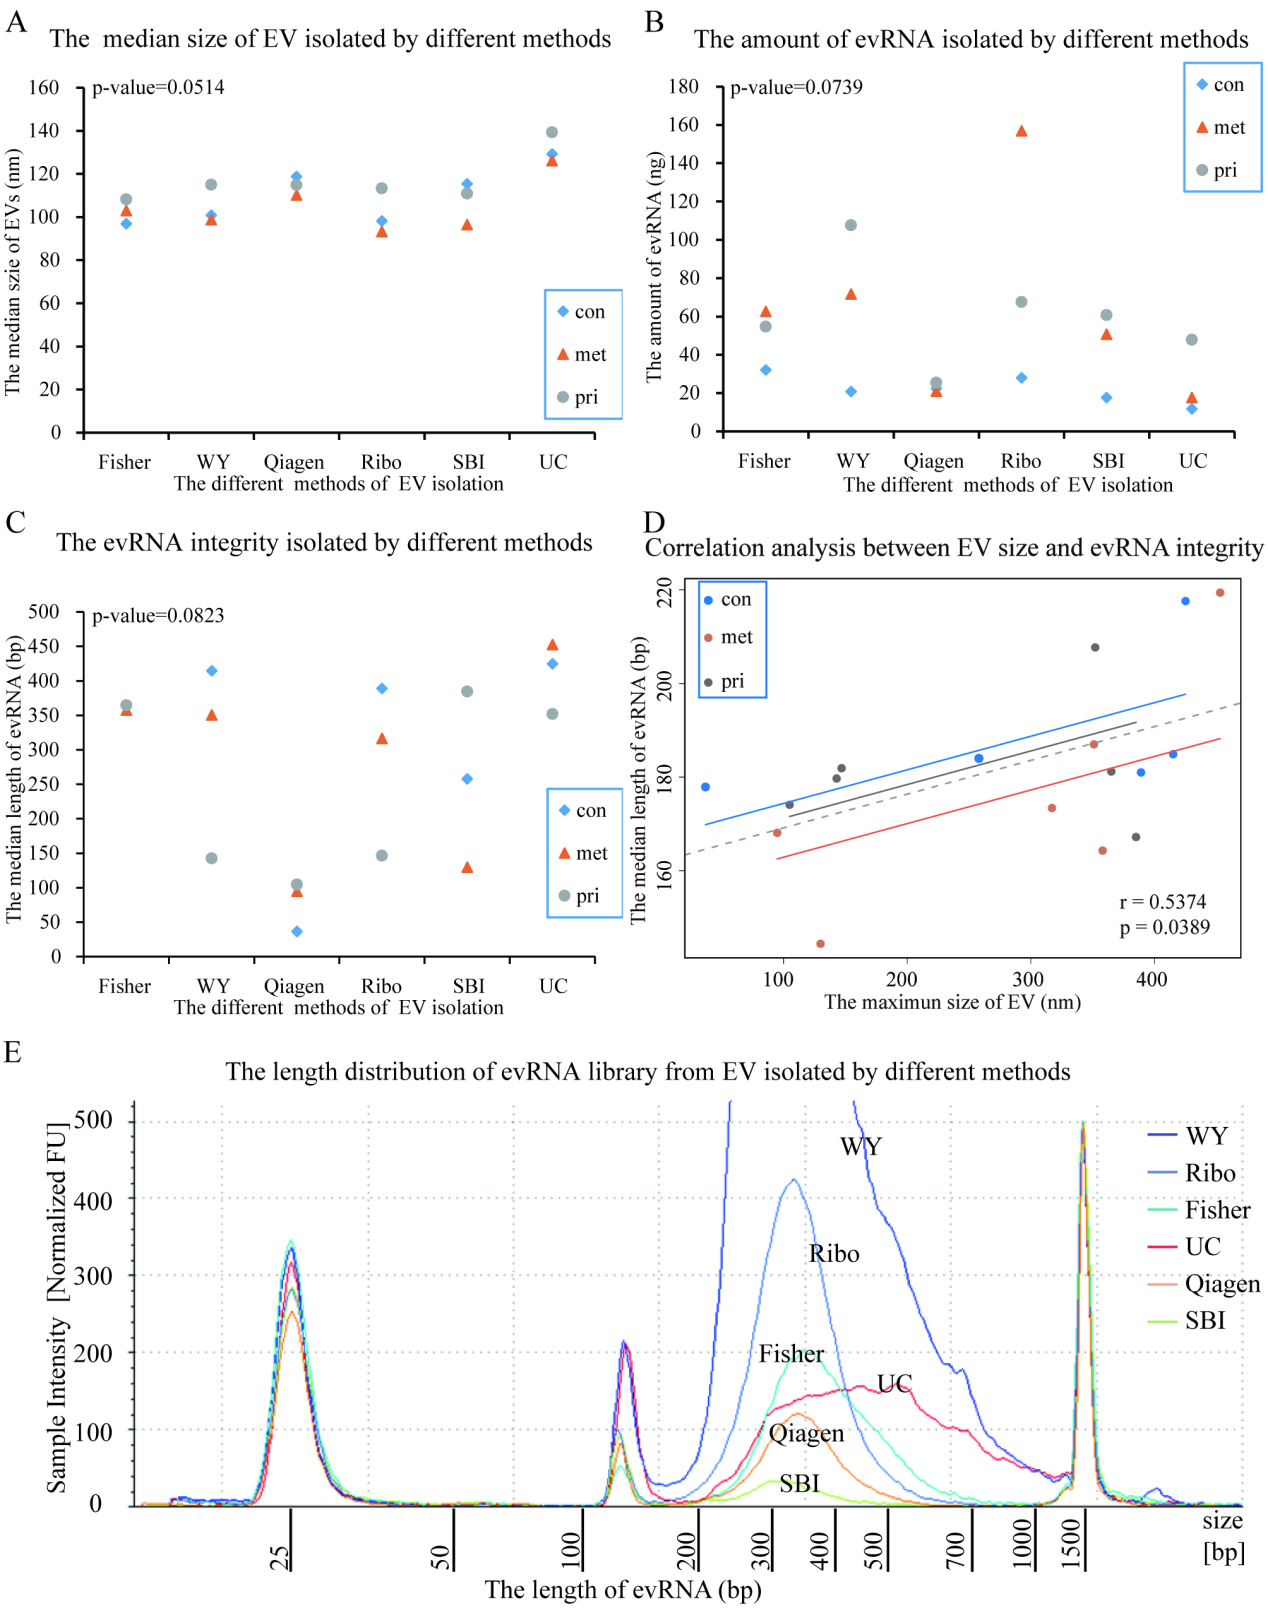
The distribution of mapped reads along the length of transcripts suggested various degrees of bias in the RNA library preparation. The X axis represents all the detected gene transcript with the length normalized to 100%. The Y axis represents the coverage of sequencing reads along the length of the gene transcript (A). A wide variation of 5’UTR, 3’UTR and CDS distribution was found among different EV samples by these 6 methodologies (B). Similarly, the proportion of short-noncoding RNA, pseudogene, long-noncoding RNA and protein-coding genes identified were variable among the transcriptome libraries of evRNA isolated by different methods (C).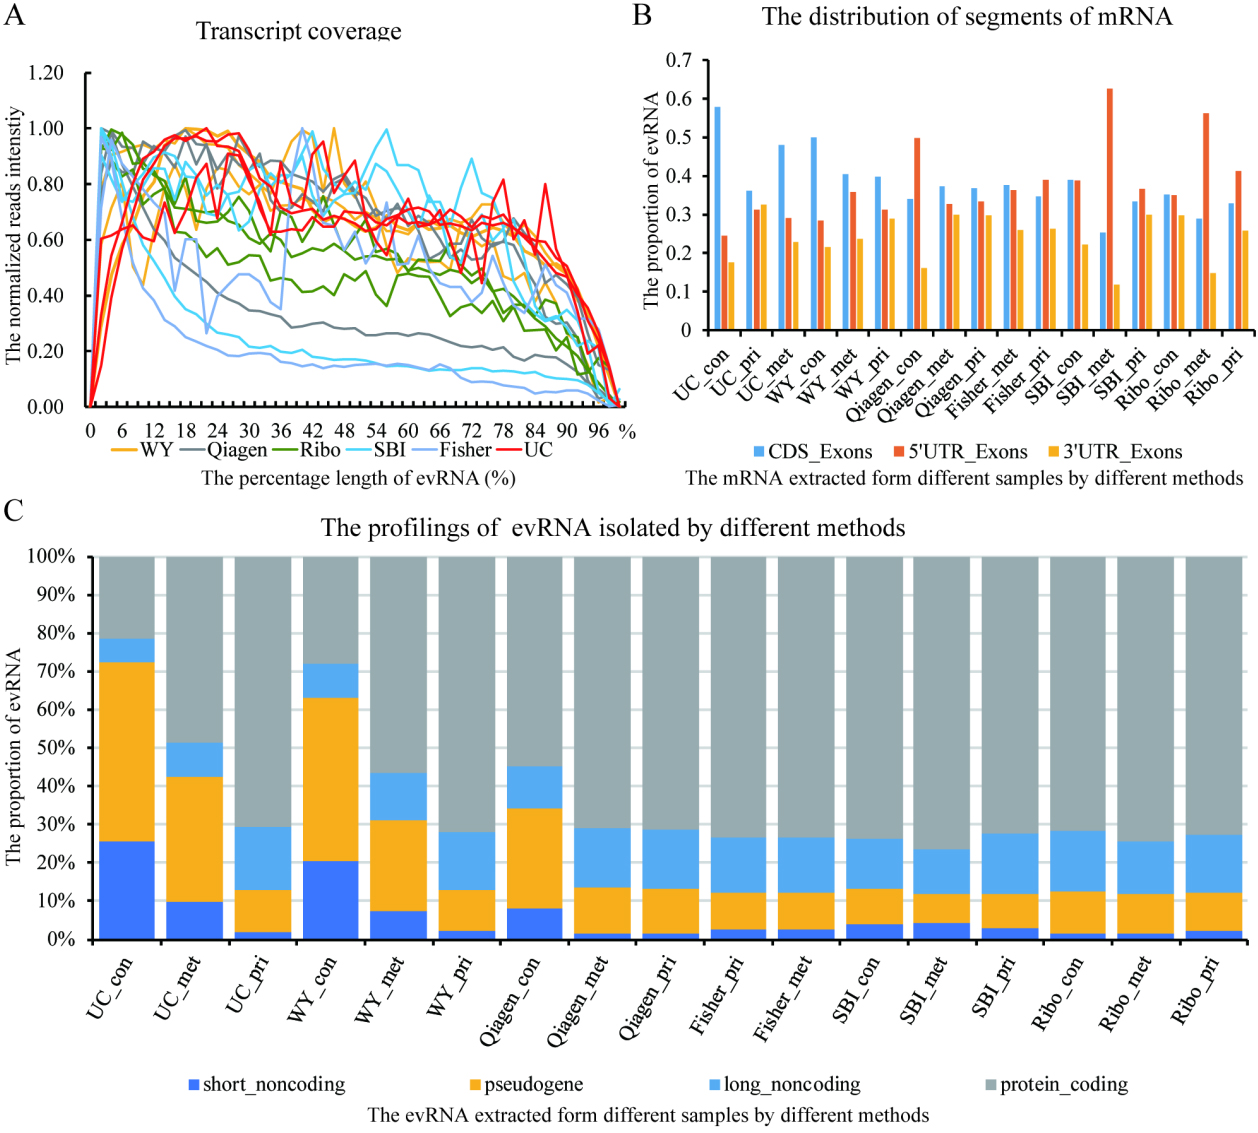
Samples from the same plasma source were poorly clustered together as shown by the sample-feature and method-feature hierarchical clustering analysis (A). The biological variation of evRNA gene expression were found to greater in UC compared to the commercial kit protocol among various gene size (B). For most of the genes, the inter-sample (biological) variation were less than the inter-method (technical) variation in evRNA expression from the 5 commercial kits (C). The Venn diagram of top expressed 50 RNAs identified from different methods in the health control (D), metastatic osteosarcoma plasma (E), and the primary osteosarcoma plasma (F) suggest an approximately 20% (10 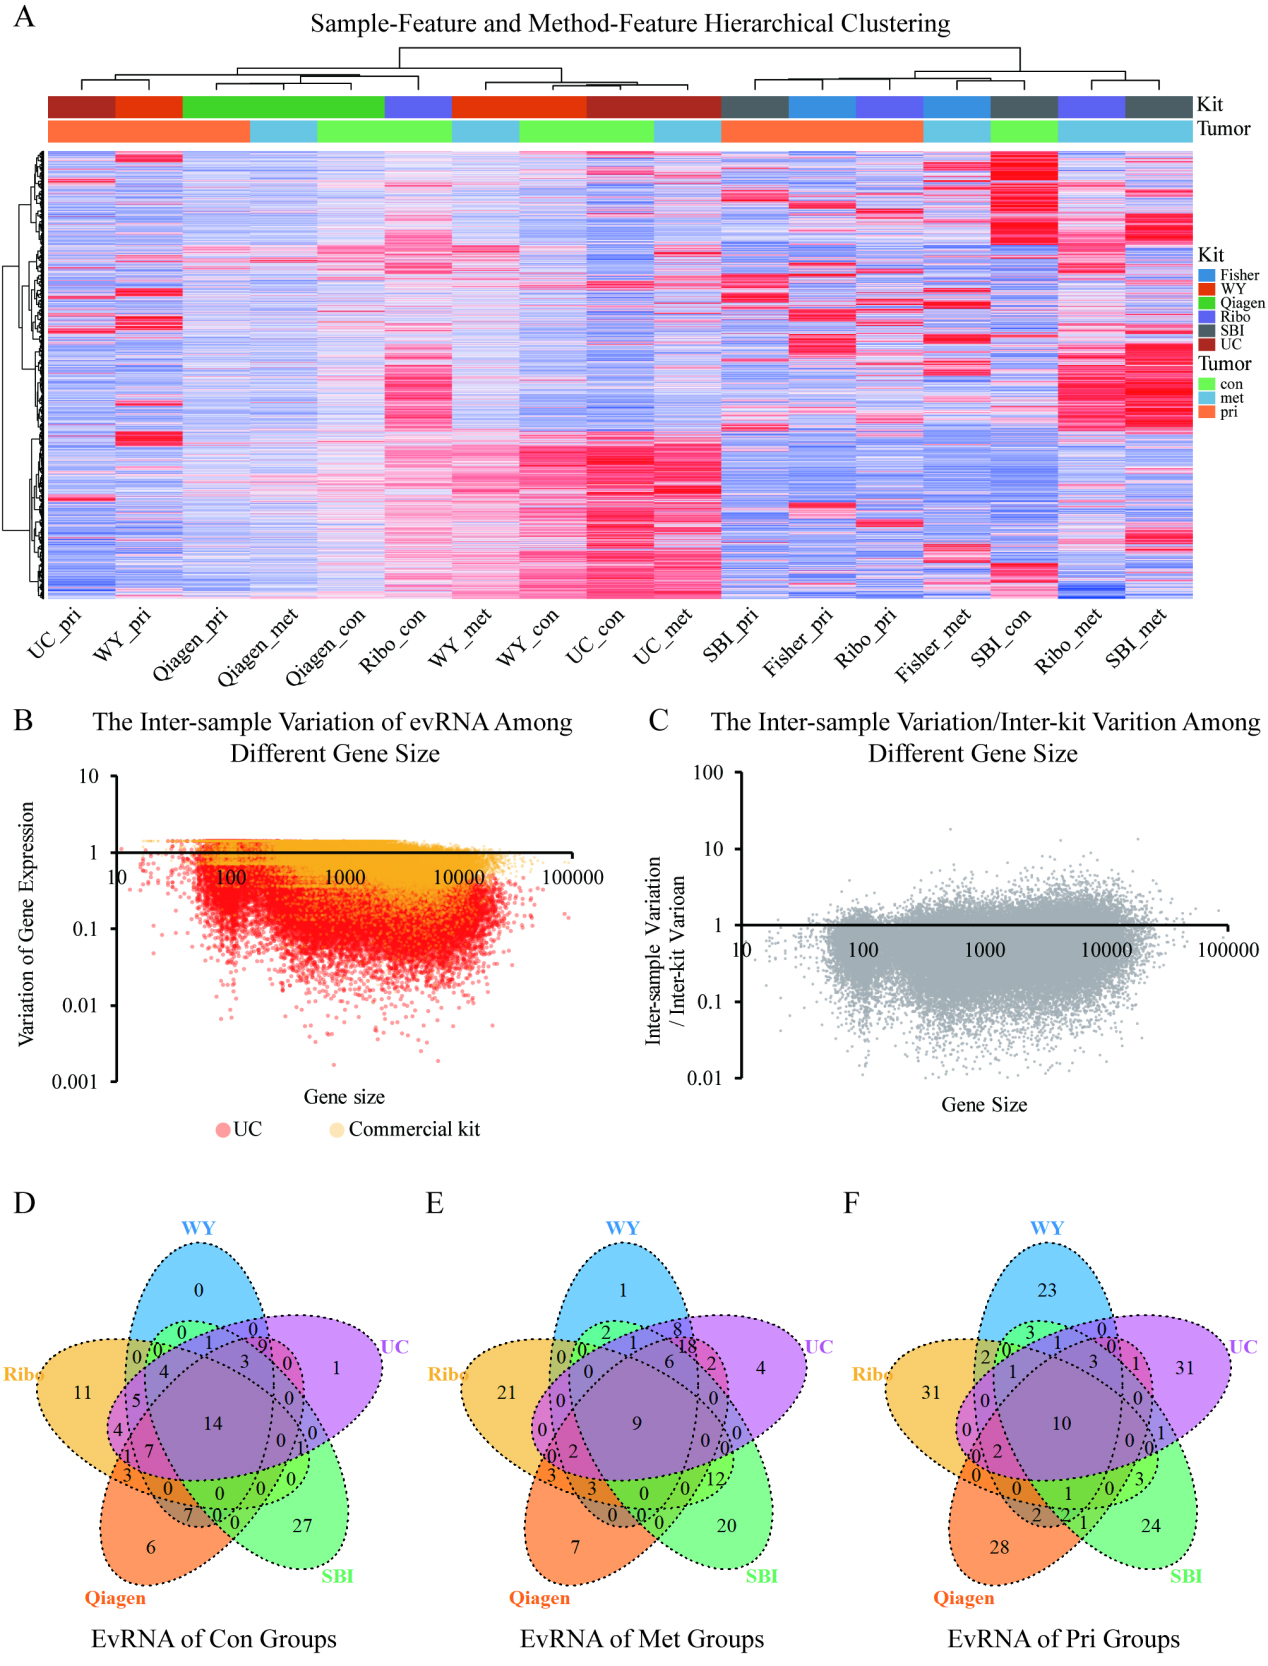
The characteristics of EV pellets were inconsistent with different isolation methods
The EV-containing pellets were generated through various commercial kits following the manufacturer’s protocols. However, the products of the different methods were found to be drastically different in appearance (Fig. 2A) even before any subsequent analyses were done. For example, pellets from Ribo yielded a large amount of sediment within a thick, yellow, and opaque supernatant. In contrast, methods with Fisher and SBI generated a small volume of pellets within a transparent and a translucent medium, respectively. The EV pellets from UC were almost invisible, with only minor obscuration at the bottom. Using NTA, we found that the size of the EVs ranged mainly from 30 nm to 240 nm (Fig. 2B and Supplementary Table 2), comparable to that previously reported in the literature as “exosome”, “exosome-like extracellular vesicles”, and so on., as briefly tabulated in Supplementary Table 3. There was no significant difference in the median size among EVs from different isolation methods. However, the total number of EVs (
Heterogeneous expression of vesicle-associated markers among different isolation kits
TEM suggested the cup-shaped vesicles with a size of approximately 100 nm consistent with the known morphology of EVs (Fig. 3A). We then proceeded to further identify whether there were discrepancies in the EV subpopulations among these methods using the EV markers (CD9, CD63, CD81, TSG101, and Vimentin), a non-EV marker (calnexin), and plasma protein (albumin and Apolipoprotein A I), as detected by the Western blot (Fig. 3B and C). The negative expression of Calnexin for each sample indicates the absence of cellular debris contamination in all of these isolation kits. As hypothesized [7], the well-established surface markers such as CD63 (
In contrast, significantly different immune-labeling of CD9 and TSG101 revealed a heterogeneous subpopulation of EVs among the five isolation commercial kits. Similarly, the amount of the plasma-derived protein such as ALB and ApoA 1 was tremendously influenced by the method used, with a 3 fold-5 fold inter-method variance observed in our investigation. Noteworthy, UC tends to generally produce less protein co-precipitation while yielding a greater amount of ApoA 1, which is a potential source of a non-EV RNA contamination [22]. Such results reinforce our aforementioned observations that precipitation-based isolation, even based on the same isolation principle, may lead to a highly variable composition of EV subpopulations and the non-EV aggregates.
Comparison of evRNA yielded by different isolation kits
We next investigated the extent to which the technical variation between the precipitation-based techniques impacted the subsequent downstream RNA analysis. The transcriptome profiling of EVs, especially in the case of the long-RNA, is a recent and fast-advancing field of liquid biopsy and is potentially more vulnerable to various disruptive factors during library construction than that observed in microRNA profiling. We, therefore, chose to sequence the total transcriptome of the EVs with a directional total RNA library preparation protocol focusing on relatively long RNA sequences (insert size
Transcriptome sequencing reveals a heterogeneous RNA repertoire resulting from different EV isolation techniques
Using next-generation sequencing, a total of 17 transcriptomes of the plasma EVs were successfully profiled for all samples (three plasma samples by six methods excluding Fisher_con, due to failed library preparation)(Supplementary Table 6). It has been reported that the EV transcriptome is biologically biased toward a fragmented pattern and an enrichment of the UTR gene regions [23], all of which may influence the accuracy of evRNA biomarker quantification. Noteworthy, we found these biological biases may also be artificial, at least in part, due to the inter-method technical variation. As shown in Fig. 5A and B, we found a 5’-3’ end RNA coverage bias as well as a deviation in the UTR-to-coding-region ratio to various degrees across samples. Furthermore, the landscape of different RNA species demonstrated that the percentage of short noncoding RNA, pseudogenes, long noncoding RNA, and protein-coding RNA was different between isolation methods (Fig. 5C). Methods using UC, WY and, to a much lesser extent, Qiagen was likely to over-present short non-coding genes and pseudogenes, while under-presenting long non-coding and protein-coding genes. These technical variations were likely due to an artificial effect of the various commercial kits upon the fragmentation, reverse transcription and other steps within the strand-oriented library preparation protocols.
The RNA profile of EVs was strongly impacted by technical variation rather than biological variation
In order to compare the biological variability (inter-sample) with the technical variability (inter-kit) at a transcriptome-wide level, we first performed hierarchical clustering of the RNA-seq profile of each sample. We found that samples from the same biological specimen were poorly clustered, while different bio-specimens processed with the same kit were sometimes closely or completely grouped together, such as processing with Qiagen, SBI, etc (Fig. 6A and Supplementary Fig. S2).
We next calculated the average expression of each gene across the five commercial kits, followed by computing the gene expression variability among the Con, Pri, and Met specimens. As shown in Fig. 6B, the variability among the three specimens from commercial kits was lower than that from UC regardless of the size of the gene, indicating that the precipitation-based isolation kits generally failed to capture the full biological variability of the transcriptome compared to the UC. Furthermore, the ratio of the variability among the three specimens (inter-specimen variation) to the variability among the five commercial kits (inter-kit variation) was less than 1 for the majority of genes (Fig. 6C), demonstrating a greater impact of technical over biological variability on the transcriptome. Likewise, by assessing the overlap among the 50 most abundant genes of each method, we found only about 9
Discussion
EVs are nano-sized lipid membrane-bound particles actively shed into, and stably retained within biological fluids such as plasma [24]. EVs are known to enclose a rich source of biomolecules such as DNA, RNA, protein, and so on, and are emerging as a promising target for a non-invasive liquid biopsy. To date, the precipitation-based technique remains the second most commonly-used technique (Fig. 1B) following UC in public databases [25] and is recommended by some researchers [26, 27] in the field of clinical biomarker research. The currently available precipitation-based commercial kits mainly rely on the volume-excluding polymers (e.g. PEG, dextrans, polyvinyls) [5] that decrease the solubility of EVs within biological fluids. However, the major disadvantage of the precipitation approach relates to the impurity of EV pellets, which is caused by the precipitating agent and the co-precipitated particles that contaminate the final preparation. It remains as-yet unknown whether and how such drawbacks may impact the EV output and its downstream analysis for liquid biopsy. Nevertheless, there is a lack of data on the validation of the standardization and reproducibility across these precipitation-based isolation kits using actual clinical samples.
Our study aimed to provide this validation by testing five commercial EV isolation kits and comparing them with UC. To guarantee the uniformity and the comparability of different conditions, the clinical specimen, as well as the experimental/analytical workflow, was identical apart from the EV isolation method used. We demonstrated a non-negligible technical variability in the EV pellets in terms of quantity and quality from different precipitation-based methods. Noteworthy, such technical variation was relayed downstream to a divergence of the RNA expression level on a transcriptome-wide fashion, potentially hampering the comparability and the reproducibility of biomarker evaluation across different studies. Such variation seems unlikely to be easily corrected by data normalization, since the hierarchical clustering analysis (Fig. 6A) using normalized expression value as well as sample-sample correlation analysis neglecting the exact gene expression value(Supplementary Fig. S1) both demonstrate a poor agreement of the same EV sample processed by different kits. Furthermore, several unique characteristics of evRNA previously reported have been shown to be influenced by the choice of method, such as the abundant protein-coding RNA [28], highly fragmented transcripts [29, 23], and an UTR-enrichment [29, 23] in the EVs.
The heterogeneous results obtained from the different precipitation-based isolation methods may be due to several reasons. First and foremost, the different commercial isolation kits need more transparent specification and reporting of the reagents and/or protocols included. For instance, information on the volume-excluding polymers used (PEG, dextrans, polyvinyls, and so on.) within each product remains to be elucidated. Although PEG has been mentioned as the main reagent chosen by some companies such as SBI and Thermo-Fisher [5], such information remains to be confirmed in the official documentation of these products. The use of thrombin (SBI, Qiagen), proteinase (Thermo-Fisher) or “reagent C” (Wayen) may increase the recovery of EVs whereas they may also damage or create bias among certain EV subpopulations [30, 31]. Furthermore, the difficult-to-remove co-precipitates of the protein aggregates/chemical compounds and other non-EV particles from the plasma may, at least in part, negatively affect multiple steps within the strand-oriented library preparation protocols, thereby creating a bias in the downstream transcriptome biomarker analysis. It has been known that some plasma RNA-binding proteins, such as the ribonucleoprotein and lipoprotein, distort the final evRNA composition. The highly variable 5’/3’ end coverage and insert sizes of the evRNA found in our study may also indicate differential RNA fragmentation and/or reverse transcription [32] due to the impurity of EV pellets, caused by the unknown co-precipitates of commercial kits. Finally, the plasma from cancer patients is a complex fluid with less abundant and more heterogeneous EV content compared with the serum or samples from healthy individuals. For example, one-tenth of the EVs have been found in plasma than in the serum [33], due to the absence of platelet-derived EVs [34]. In contrast, the heterogeneity of cancer cells may selectively produce a heterogeneous and complicated population of the EV cargo, further amplifying the differences in the EV subpopulations isolated. Noteworthy, we found EVs at a fewer order of magnitude in the healthy control samples than that in the sarcoma patients, indicating that the majority of EVs in our sample may originate from tumor cells or the related micro-environment.
In our study, WY, followed by Qiagen, seems to yield a transcriptome landscape more similar to UC than the other kits according to the clustering, venn diagraph and intra-kit correlation analysis (Fig. 6 and Supplementary Fig. S1). However, whether such commercial kits represent the most consistent and sensitive method for evRNA research needs to be interpreted with cautions. First, such similarity might be simply due to the more similar RNA size and biotype distribution of the RNA libarary to UC, rather than a higher technical stability or sensitivity of the methods. Second, our study did not include a spike-in RNA control as a benchmark for absolute gene quantification. Neither did we replicate the UC isolation procedure with one single blood sample to verify UC method itself as the conceptually most consistent way for evRNA quantification. Rather than assigning a rank to varous commercial kits, our study demonstrated a highly variable and unpredictable result of the polymeric precipitation-based EV isolation technique across different precipitation methods. Such technical divergence may make the EV-based biomarker studies difficult to interpret and reproduce, therefore warranting adequate benchmarking and transparent reporting of the protocols in liquid biopsy research.
Footnotes
Acknowledgments
This study was supported by a grant of Innovative Research Groups of the National Natural Science Foundation of China (GRANT NO. 81773298), a grant to 2017 Scientific Innovation Program (Clinical Medicine) of Shanghai Science and Technology Committee (GRANT NO. 17411951900), the Shanghai Municipal Commission of Health and Family Planning (GRANT NO. 201740139) and Chinese Society of Clinical Oncology (Y-HR2017-028).
Supplementary data
The supplementary files are available to download from http://dx.doi.org/10.3233/CBM-201651.