Abstract
BACKGROUND:
Gastric cancer (GC) is one of the most deadliest tumours worldwide, and its prognosis remains poor.
OBJECTIVE:
This study aims to identify and validate hub genes associated with the progression and prognosis of GC by constructing a weighted correlation network.
METHODS:
The gene co-expression network was constructed by the WGCNA package based on GC samples and clinical data from the TCGA database. The module of interest that was highly related to clinical traits, including stage, grade and overall survival (OS), was identified. GO and KEGG pathway enrichment analyses were performed using the clusterprofiler package in R. Cytoscape software was used to identify the 10 hub genes. Differential expression and survival analyses were performed on GEPIA web resources and verified by four GEO datasets and our clinical gastric specimens. The receiver operating characteristic (ROC) curves of hub genes were plotted using the pROC package in R. The potential pathogenic mechanisms of hub genes were analysed using gene set enrichment analysis (GSEA) software.
RESULTS:
A total of ten modules were detected, and the magenta module was identified as highly related to OS, stage and grade. Enrichment analysis of magenta module indicated that ECM-receptor interaction, focal adhesion, PI3K-Akt pathway, proteoglycans in cancer were significantly enriched. The PPI network identified ten hub genes, namely COL1A1, COL1A2, FN1, POSTN, THBS2, COL11A1, SPP1, MMP13, COMP, and SERPINE1. Three hub genes (FN1, COL1A1 and SERPINE1) were finally identified to be associated with carcinogenicity and poor prognosis of GC, and all were independent risk factors for GC. The area under the curve (AUC) values of FN1, COL1A1 and SERPINE1 for the prediction of GC were 0.702, 0.917 and 0.812, respectively. GSEA showed that three hub genes share 15 common upregulated biological pathways, including hypoxia, epithelial mesenchymal transition, angiogenesis, and apoptosis.
CONCLUSION:
We identified FN1, COL1A1 and SERPINE1 as being associated with the progression and poor prognosis of GC.
Abbreviation
Introduction
According to the 2018 Global Cancer data, GC is the fifth most common and the third most deadliest tumour worldwide [1]. In 2020, it is estimated approximately 27600 new cases of GC and 11010 GC deaths in the United States [2]. The high incidence and mortality of GC cause a very large burden of disease globally and individually each year. The prognosis of GC depends on the pathological stage, tumour site, histological type, biological behaviour and therapeutic measures [3, 4]. Tumours with late stage or high-level grade usually have a poor prognosis. A large retrospective study from Japan revealed that the 5-year overall survival rate for stage IV GC patients was far lower than that for stage IA GC patients (16.4% vs 91.5%) [5]. In fact, most GC patients were diagnosed at advanced stages and have an unfavourable prognosis due to a lack of evaluation and treatment strategies. Therefore, it is of great significance to find new therapeutic and prognostic molecular biomarkers of GC.
Currently, emerging microarray and high-throughput sequencing technologies have provided a large amount of available sequencing data. Bioinformatics analysis can help researchers discover new drugs and new molecular markers related to cancers [6, 7, 8, 9]. The Cancer Genome Atlas (TCGA) analysis project [10] and Gene Expression Omnibus (GEO) [11] are the two most widely used databases for researchers. Weighted gene co-expression network analysis (WGCNA) is an R package widely used to identify modules related to different clinical traits [12]. By clustering co-expression genes based on expression data at the gene level, WGCNA can identify significant modules responsible for clinical traits. Some studies that have identified some gene markers for GC by WGCNA commonly use differentially expressed genes to construct networks [13, 14, 15, 16], which may destroy genetic diversity and not reflect the true cluster results. Instead, top variant genes are more reasonable for WGCNA. The pathological stage and histological grade are two important factors affecting prognosis. Identifying the module of interest related to stage, grade and overall survival simultaneously might help to identify true genes that could act as diagnostic and prognostic biomarkers of GC. However, related research has not been reported.
Flow chart of the study design. Firstly, the RNA-seq and clinical data were downloaded from the TCGA database and top 5000 variant genes were selected to construct WGCNA network. Secondly, by WGCNA network, we identified the interest module that was related to survival status, stage and grade, in addition, the GO and KEGG enrichment analyses of interest module were also explored. Thirdly, we selected 10 hub genes from the interest module by using cytoscape software and explored their expression and prognostic value in gastric cancer (GC), in which we identified three hub genes that were differentially expressed in GC and related to poor prognosis of GC. At last, we performed verification analysis by using several sequencing data from GEO database and our experiments including immunohistochemical staining (IHC), western blot (WB) and quantitative real-time fluorescence PCR (qRT-PCR) with gastric tissue specimens. Meanwhile, univariate and multivariate cox analysis, GSEA and ROC curve were also performed.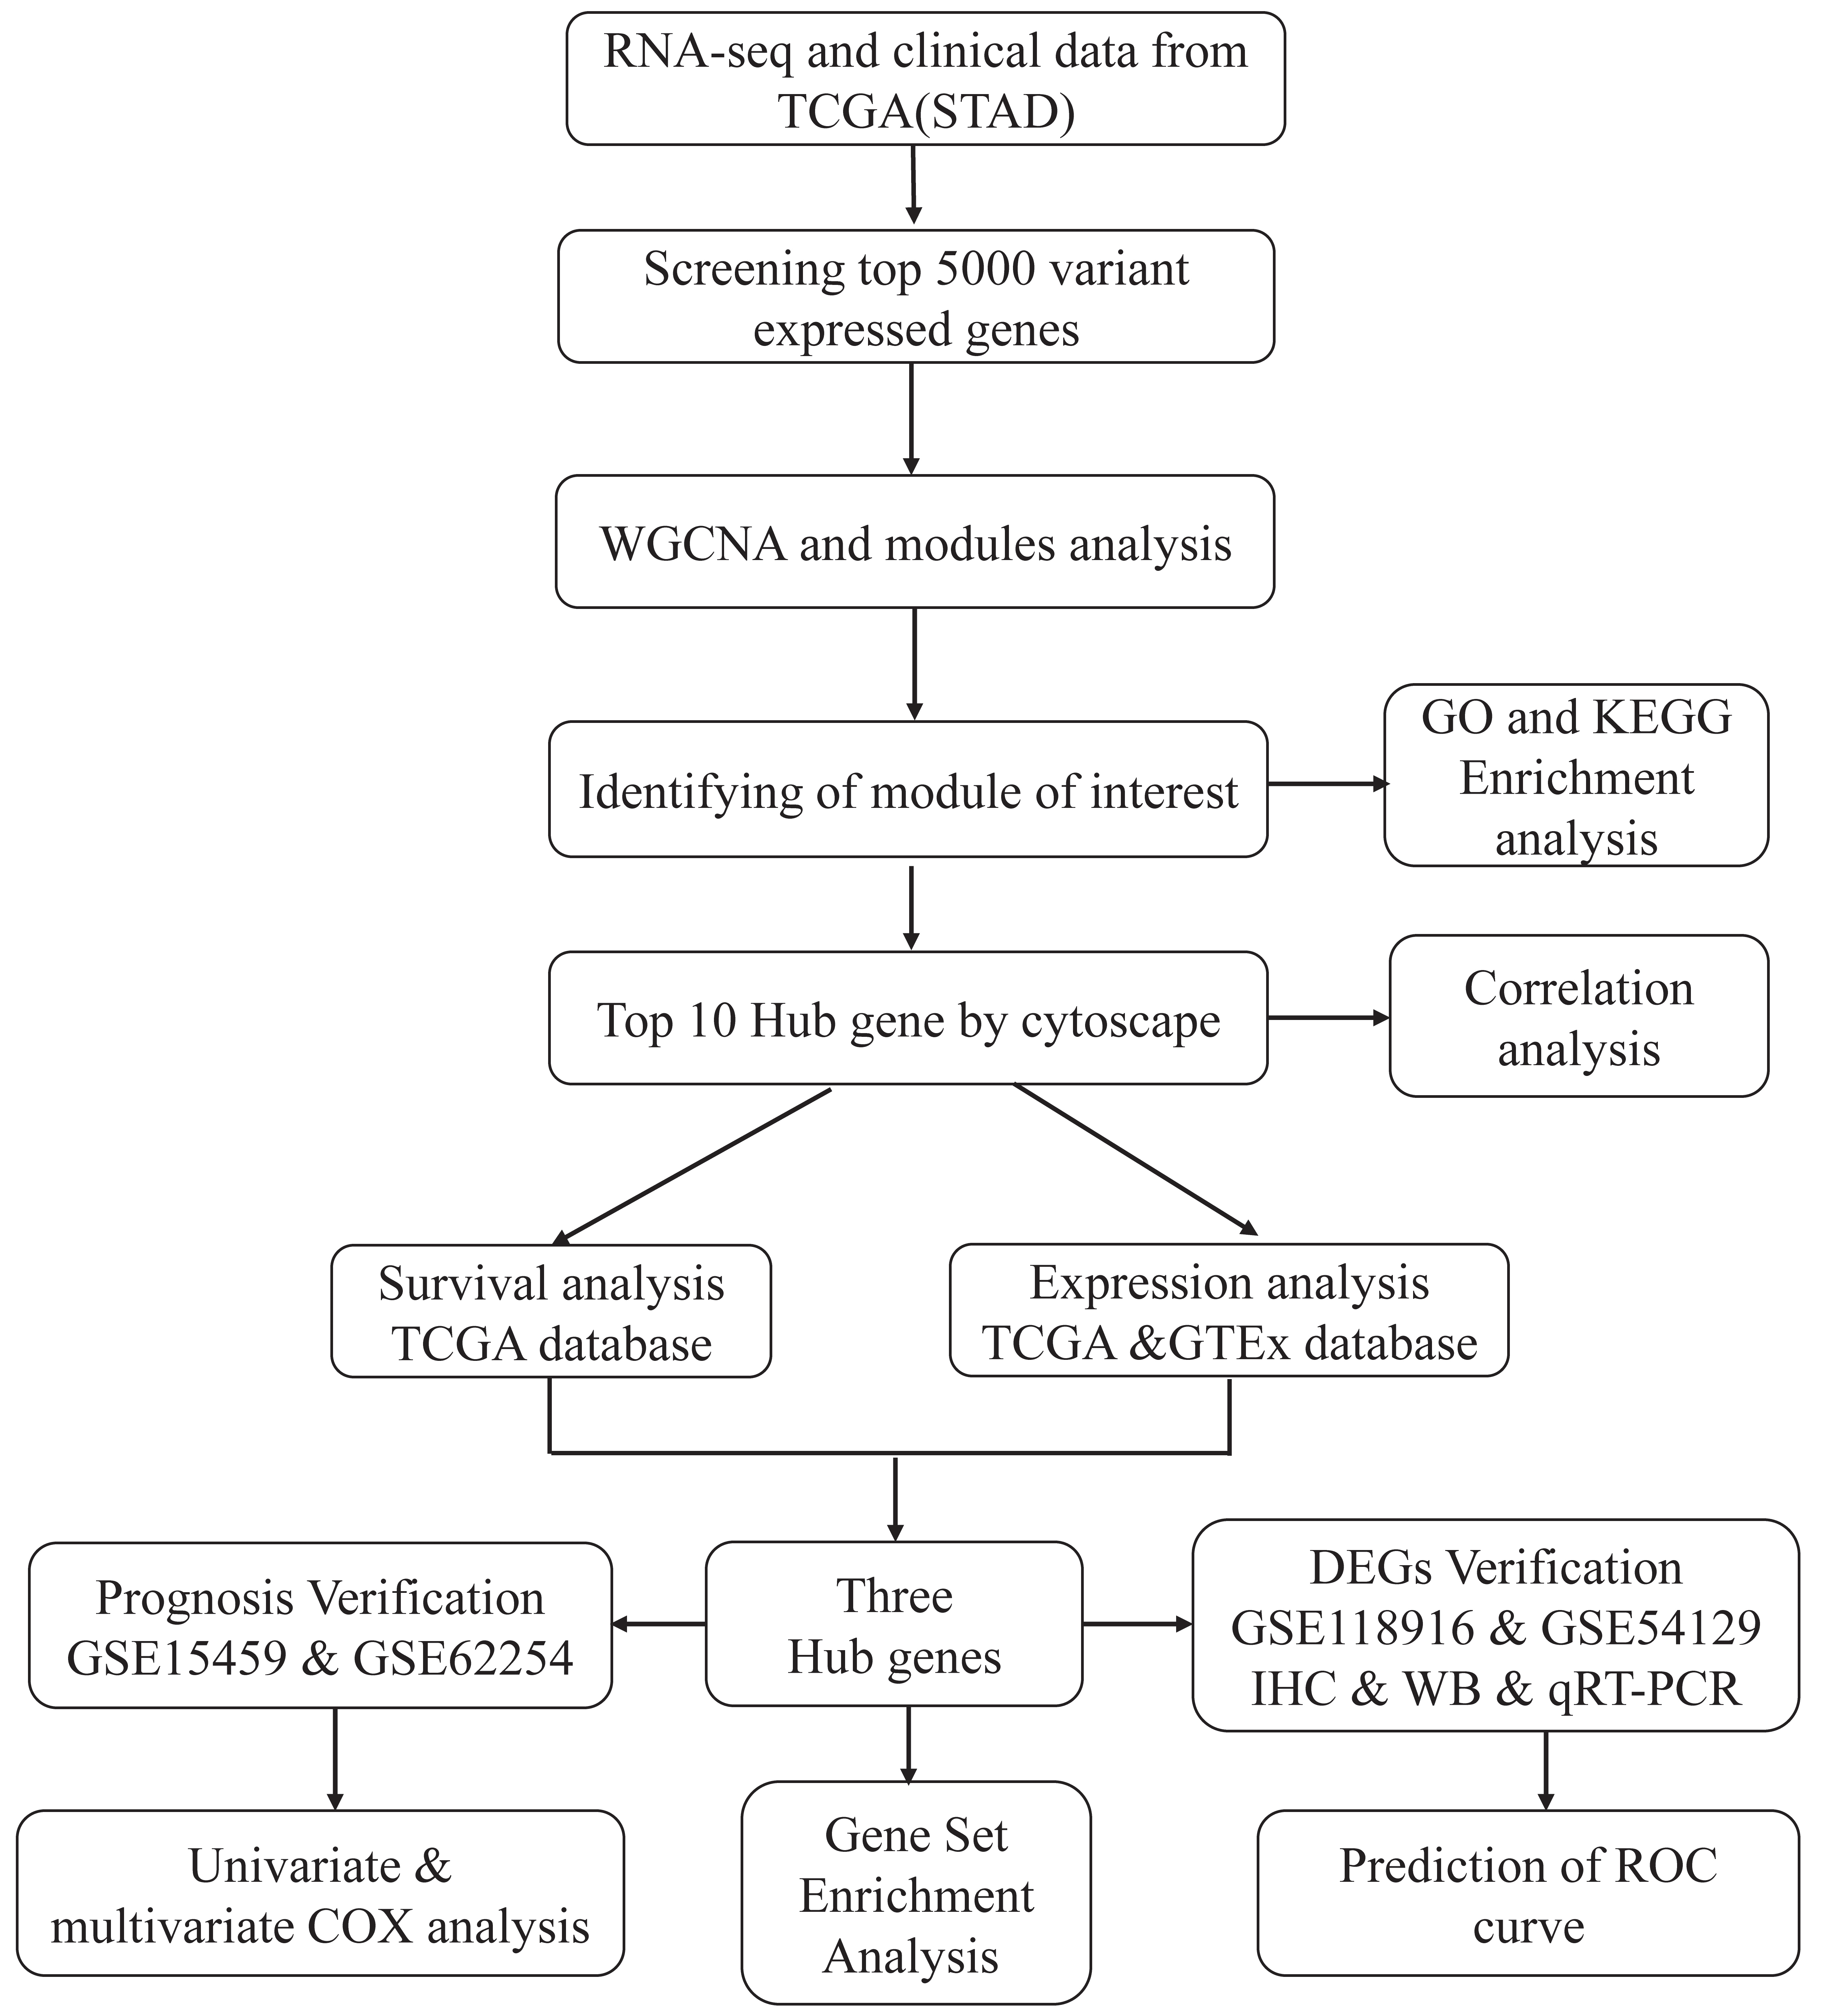
In this study, we first performed WGCNA to find significant modules correlated with clinical traits including age, sex, stage, grade, and overall survival (OS) of GC based on GC samples from the TCGA database. Then Gene Ontology (GO) and KEGG pathway enrichment analyses were performed to identify the biological significance of the selected modules. Third, the 10 hub genes of interest module were selected by a PPI network using Cytoscape software and were analysed at mRNA expression levels and prognostic values on the GEPIA online resource. Furthermore, we selected statistically significant genes at the expression and prognosis levels as true hub genes. In addition, we performed verification experiments using GEO datasets and our clinical gastric specimens. The ROC curves were also plotted in the prediction of GC. Finally, GSEA was conducted to explore the potential pathogenic mechanism of true hub genes.
Data collection from the TCGA and GEO database
The workflow for the current study is presented in Fig. 1. The HTSeq count matrix of 407 gastric samples (375 tumours and 32 normal tissues) was downloaded from the TCGA database using Genomic Data Commons Client (
Data process for WGCNA
For WGCNA, we used the voom function [18] in the limma [19] package to normalize the TCGA count data. A large number of genes are not differentially expressed between samples. These genes must be excluded because they may produce unreal correlation. In this study, we selected the top 5000 most variant genes for WGCNA. The median absolute deviation (MAD) was used as a robust measure of variability [20, 21].
Gene co-expression network construction
A gene co-expression network was constructed using the R WGCNA package [12]. The samples were clustered with hierarchical clustering analysis by the hclust function [22] to check if outlier samples existed. The function pickSoftThreshold [23] was used to select appropriate soft thresholding powers
Identification of module of interest
The moduleEigengenes function was used to calculate the module eigengene (ME). The correlation between MEs and clinical traits, including age, sex, stage, grade, survival status (OS), and overall survival time (OS.time), was evaluated by Pearson’s correlation tests.
Identification of hub genes with a PPI network
Hub genes usually refer to those with a high degree of intra-module connectivity. To identify hub nodes, a PPI network based on the selected module was constructed in the STRING database (
Differential expression and survival analysis
Gene Expression Profiling Interactive Analysis (GEPIA) is a bioinformatics platform based on expression and survival information from the TCGA database, as well as expression data from the GTEx database [27]. To analyse the expression levels of 10 hub genes between GC and normal gastric tissue, data from both the TCGA and GTEx databases were used. One-way ANOVA was used for the hypothesis test. Genes with
Verification of differentially expressed and prognostic genes by GEO databases
To verify the expression levels of hub genes, we selected two different types of GC datasets. GSE54129 contains 21 normal gastric tissues and 111 GC samples; GSE118916 contains 15 paired GC and adjacent normal tissues. The mRNA expression levels of the GC and normal groups were compared with
Gastric tissue specimens and immunohistochemistry
We collected 20 pairs of paraffin-embedded human GC and normal gastric tissue specimens from surgical samples at the First Affiliated Hospital of Nanchang University. All patients signed informed consent forms and the study was approved by the Ethics Committee of the First Affiliated Hospital of Nanchang University. Immunohistochemical staining was conducted at a concentration of 1:1200 for FN1 (66042-1-Ig), 1:2000 for COL1A1 (67288-1-Ig) and 1:1800 for SERPINE1 (66261-1-Ig). All antibodies were purchased from Proteintech
The primers used in the real-time quantitative PCR analysis
The primers used in the real-time quantitative PCR analysis
Twenty pairs of GC and normal gastric tissues preserved at
RNA extraction and real-time quantitative PCR analysis
Total RNA was extracted using TRIzol reagents (Takara, Dalian, China) and reverse transcribed into cDNA using the PrimeScript RT reagent kit (Takara, Dalian, China) according to the instructions as the same with our previous study [29]. SYBR Green Master Mix (Thermo Fisher Scientific) was used to detect the mRNA expression levels of FN1, COL1A1 and SERPINE1 in the QuantStudio
Diagnostic efficiency evaluation for GC
To explore whether the mRNA levels of the three hub genes exhibit diagnostic efficiency for distinguishing GC from normal gastric tissues, we performed receiver operating characteristic (ROC) curve analysis. Briefly, the expression profile of 407 gastric samples (375 tumour tissues and 32 normal tissues) was downloaded from the TCGA-STAD dataset and log2 transformed in R (version 3.6.1). The pROC package [30] was used to plot ROC curves and calculate the areas under the curves (AUCs) values in R (version 3.6.1).
GSEAs of three hub genes based on the TCGA RNA-seq data
Gene set enrichment analysis (GSEA) is a computational approach for identifying potential biological pathways based on RNA expression profiles [31]. To explore the possible carcinogenic process of selected hub genes, we performed GSEA using GSE software (version 4.3.0) based on the TCGA data. A total of 375 GC samples were divided into high and low expression groups according to the median expression value of each hub gene. The hallmark gene_sets (h.all.v7.0 symbols.gmt) were used for analyses. The number of permutations was 1000, and the permutation type was phenotype (gene_high vs gene low). NES (normalized enrichment score)
Construction of WGCNA network. (A), Clustering dendrogram of 335 GC samples and clinical traits. Colors: white means low, red means high. (B), Visualizing the gene network with a heatmap plot. The heatmap depicts the topological overlap matrix (TOM) among all genes in the analysis. (C), Clustering dendrogram of genes together with assigned module colors. (D), Analysis of network topology for various soft-thresholding powers.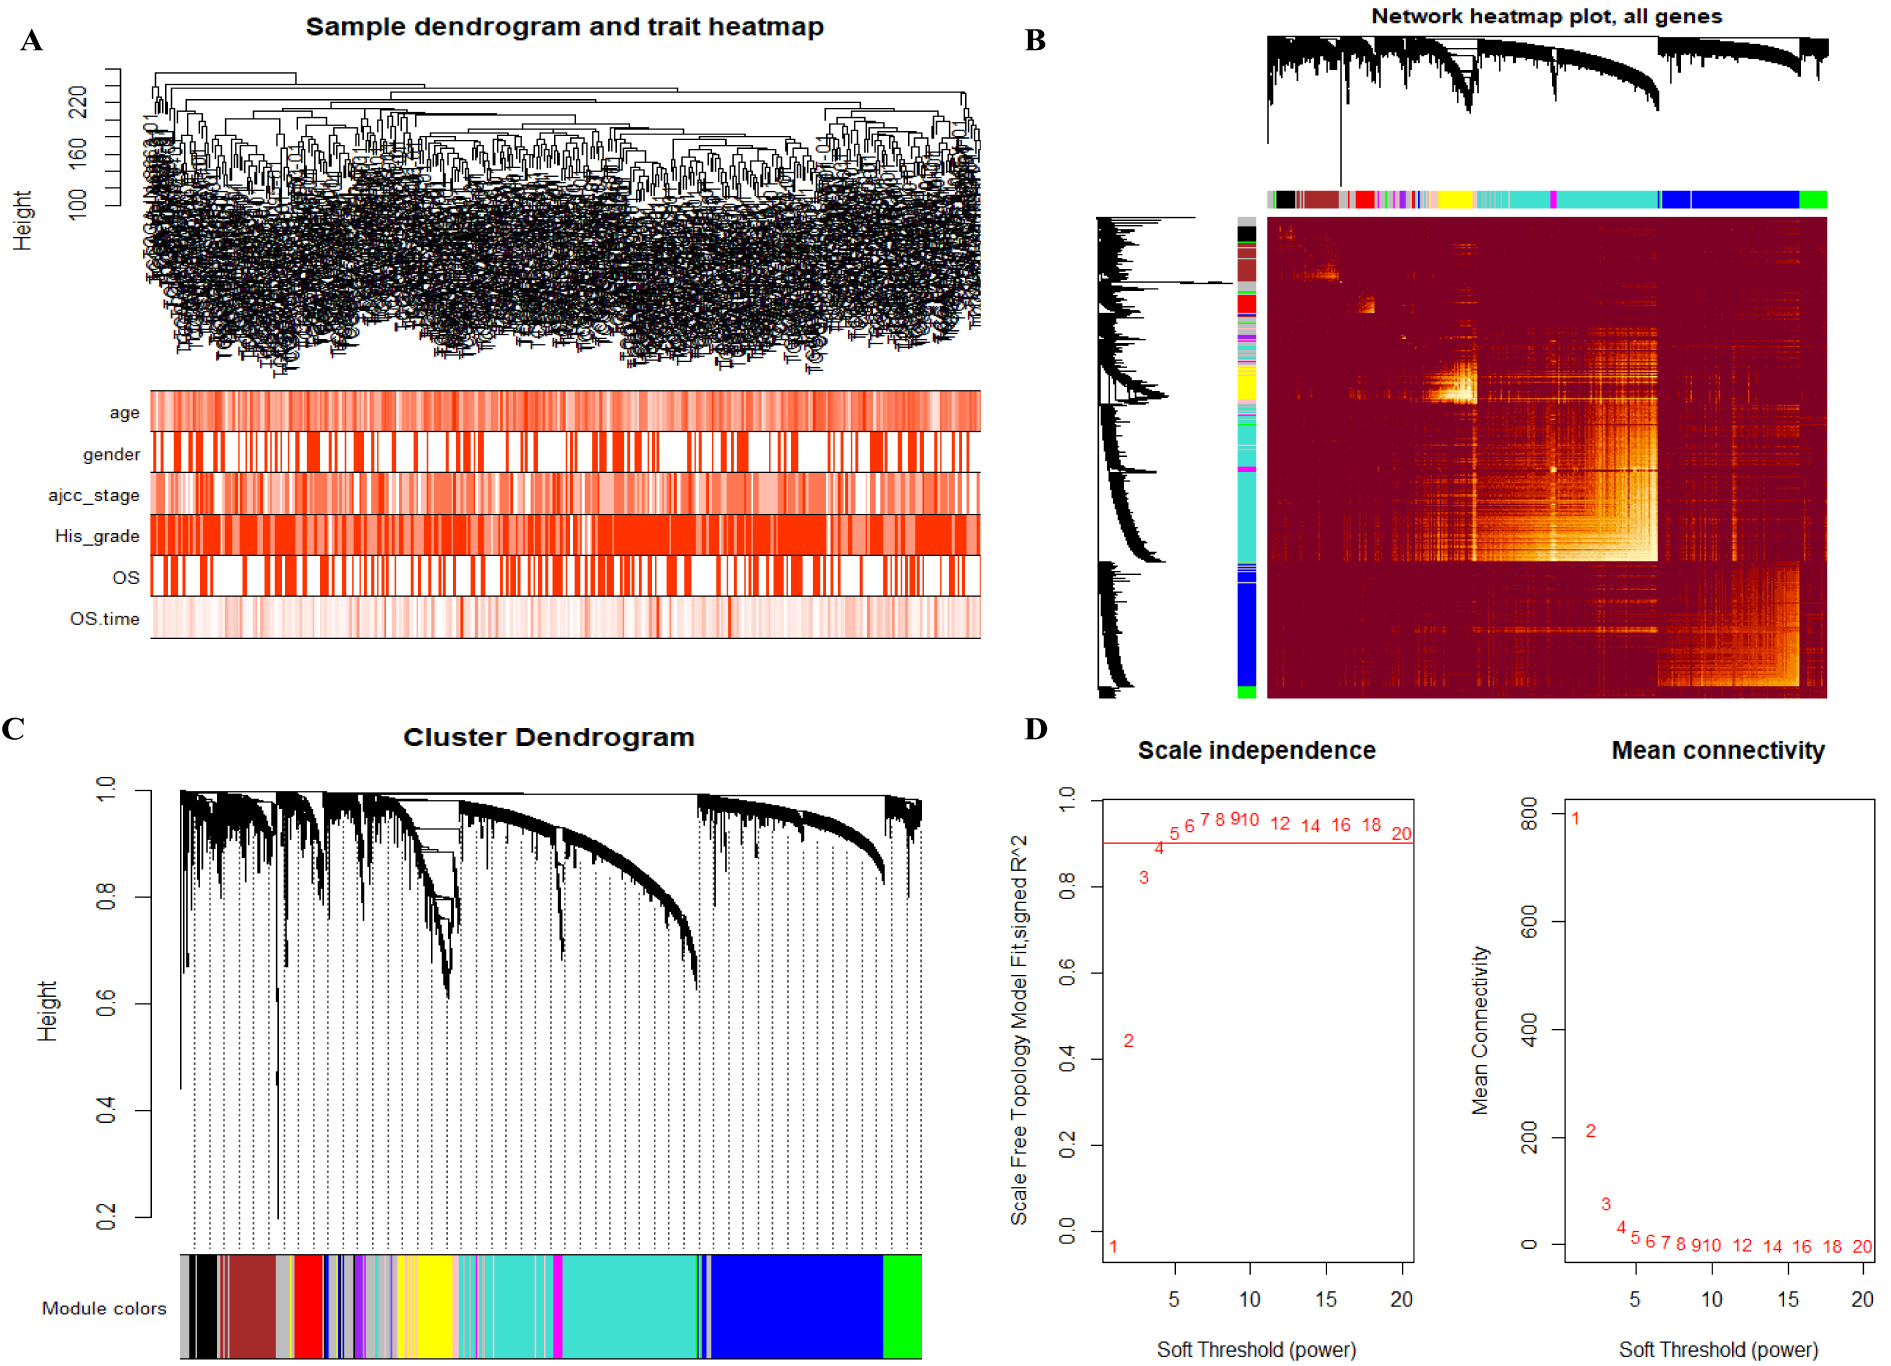
Identification of the module of interest. (A), Heatmap of module-trait relationships. (B), The clustering eigengenes of network among different modules and grade. (C), The eigengene adiacency heatmap of network among different modules and grade. (D) The clustering eigengenes of network among different modules and stage. (E) The clustering eigengenes of network among different modules and OS. (F–H), Scatterplot of gene significance and Module Membership in the magenta module for OS (F), grade (G) and stage (H).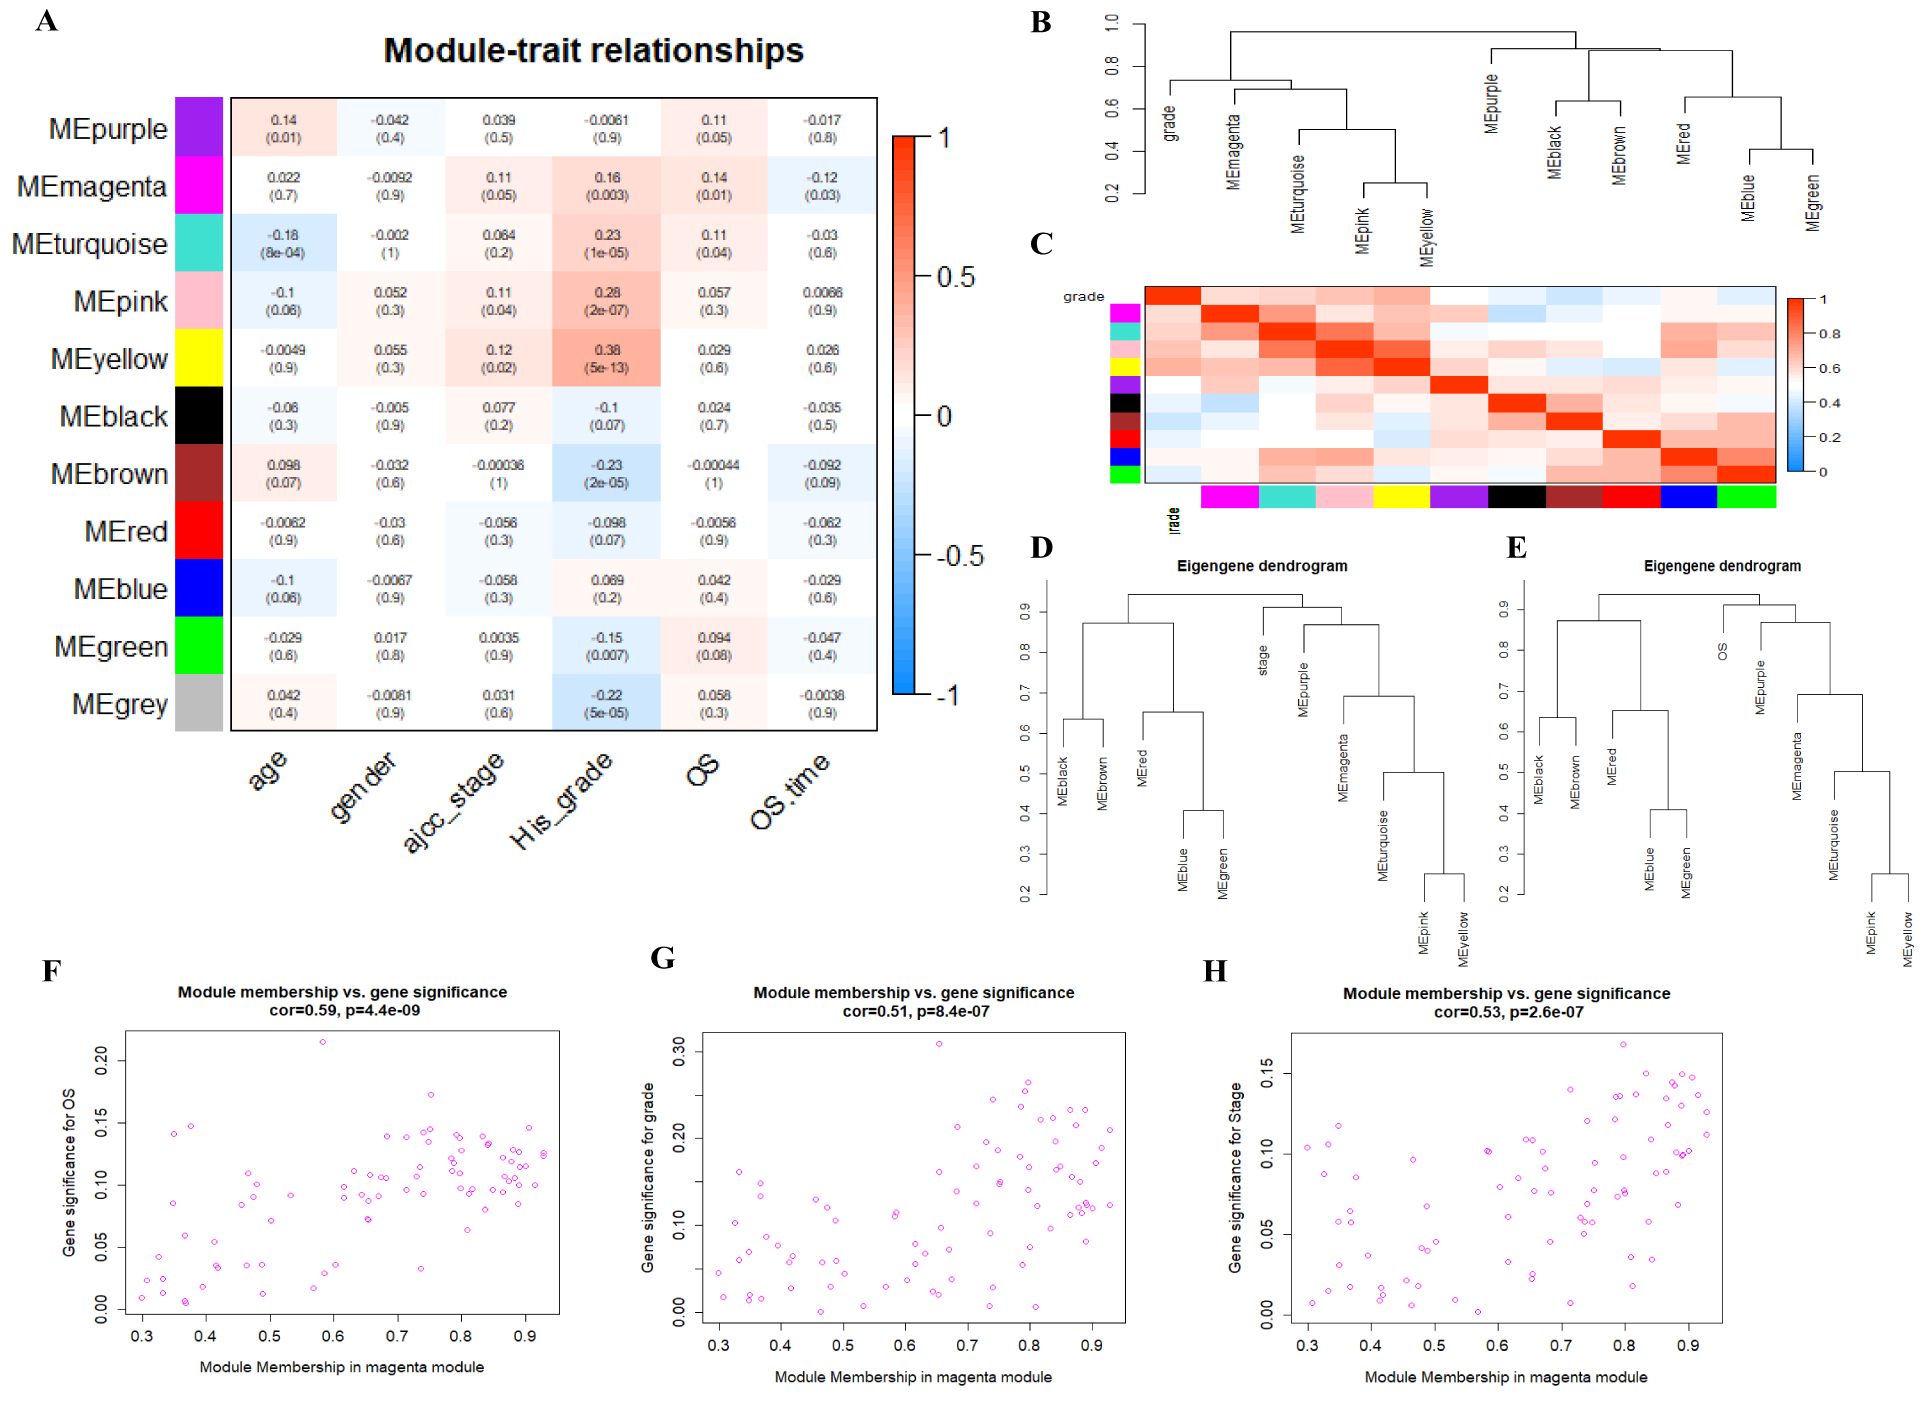
Gene co-expression network and module analysis
The top 5000 most variant genes based on the MAD value in 335 GC samples from the TCGA database were first used for hierarchical clustering analysis. There were no outlier samples to be excluded. The relationship between clinical features and the sample dendrogram was visualized (Fig. 2A). The WGCNA network was then visualized with a topological overlap matrix (TOM) heatmap of all genes (Fig. 2B). According to the clustering dendrogram of genes correlated with different modules, ten co-expressed modules were identified (Fig. 2C). In this study, power 4 (scale free R2
Identification of modules associated with clinical characteristics
To identify modules that were significantly associated with clinical traits, the module-trait relationship was visualized with a heatmap (Fig. 3A). The results showed that the yellow module was highly correlated with grade and stage. Nevertheless, it is noteworthy that the magenta module was positively associated with stage, grade, and OS and negatively associated with OS.time simultaneously. To quantify module similarity with grade, stage or OS by eigengene correlation, an eigengene network was conducted. The eigengene dendrogram of grade (Fig. 3B) and the eigengene adjacency heatmap of grade (Fig. 3C) showed the magenta module was more relevant to grade than the yellow module. Similarly, we found that magenta module was also highly clustered with stage (Fig. 3D) and OS (Fig. 3E) by eigengene dendrogram. Furthermore, scatter plots of gene significance (GS) and module membership (MM) in magenta module analysis showed that magenta module genes were highly related to OS (Fig. 3F), stage (Fig. 3G) and grade (Fig. 3H). Therefore, the magenta module was considered as the most relevant to progression and prognosis of gastric cancer and selected for the subsequent analysis.
Enrichment analyses of the selected module
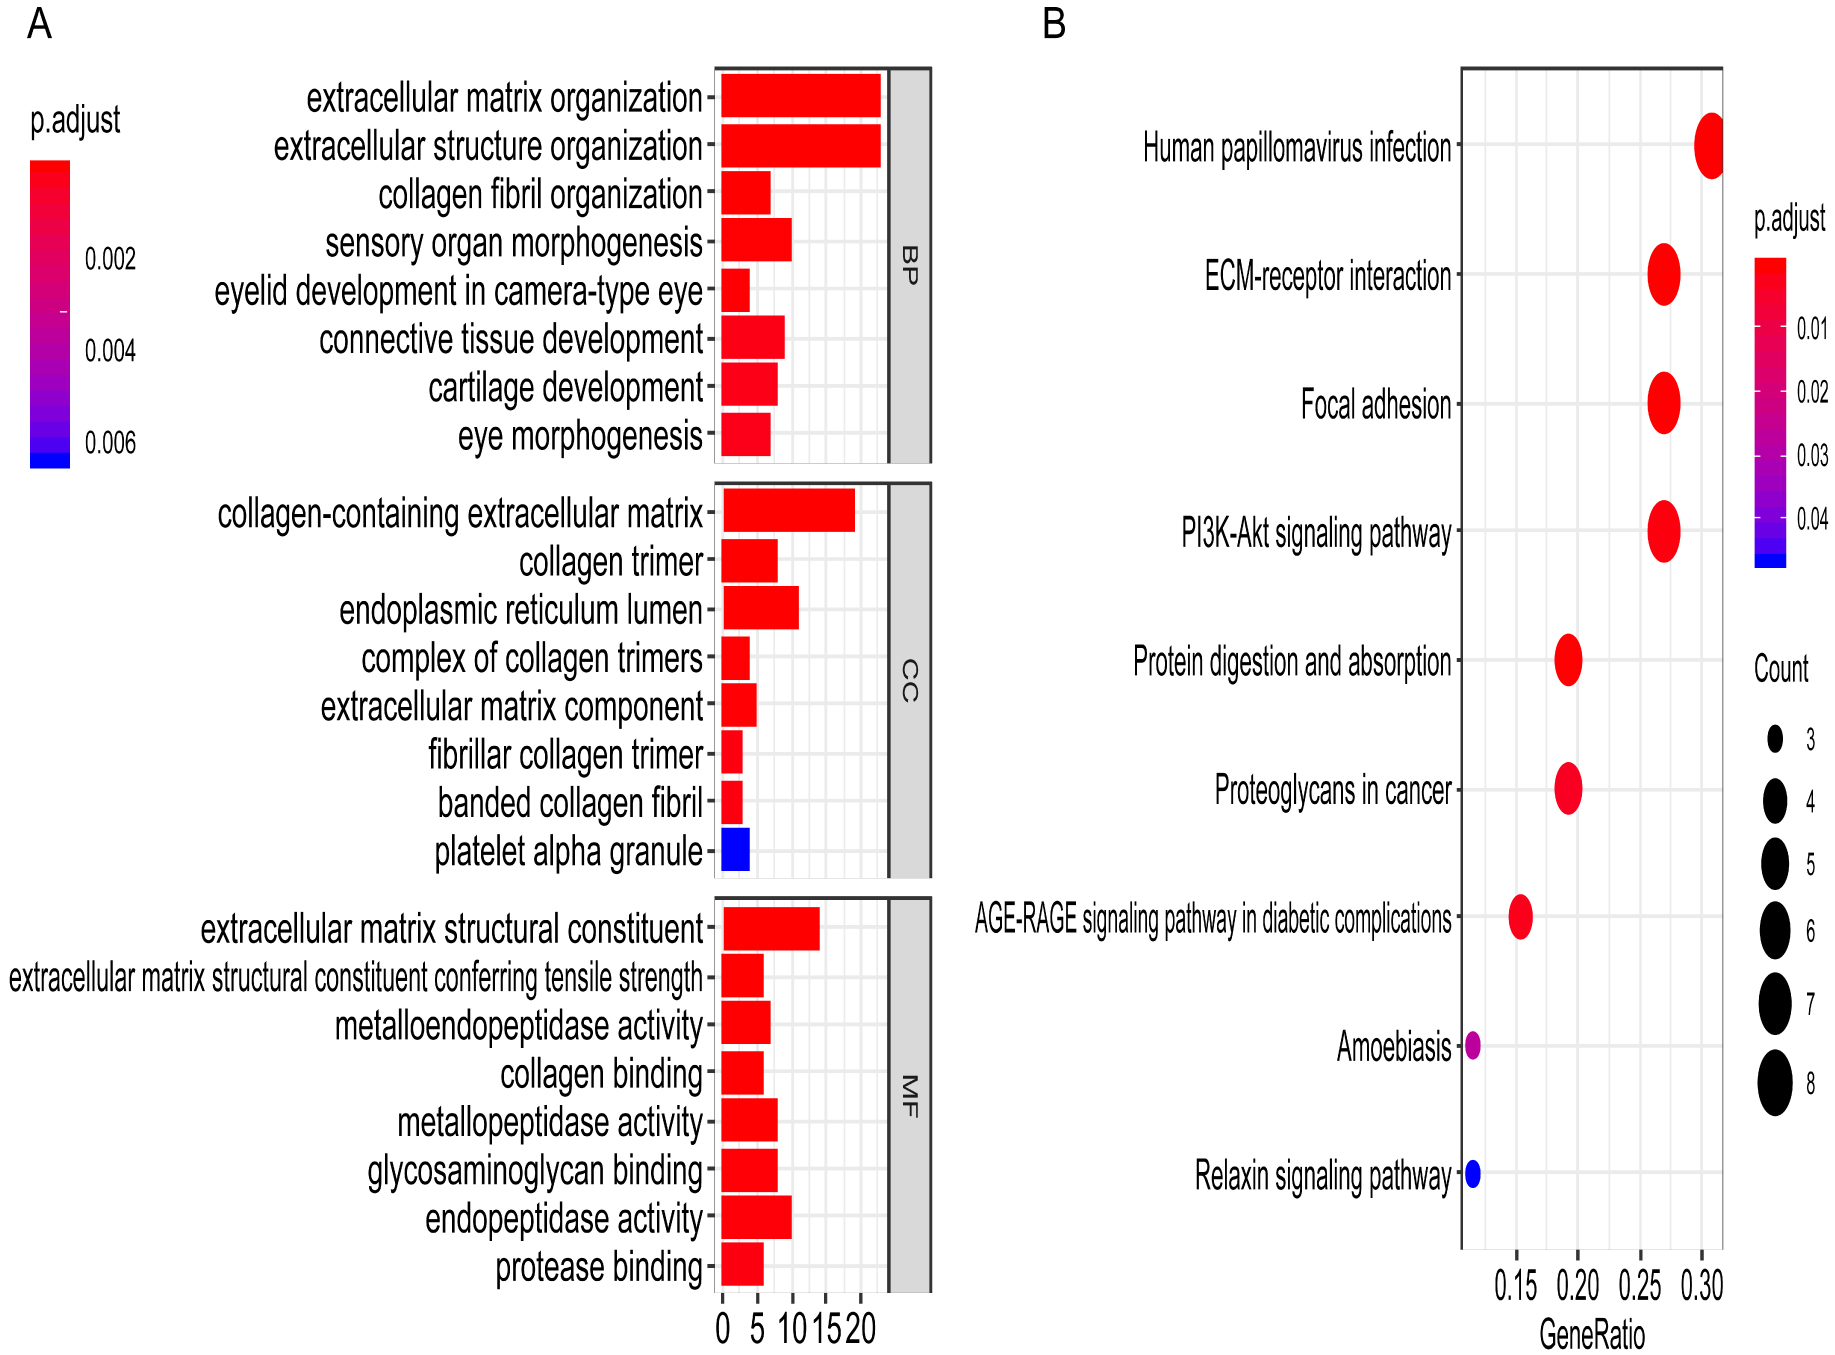
To explore the biological process of the magenta module, 83 genes in the magenta module were included to perform GO and KEGG pathway enrichment analyses. GO enrichment analysis showed that extracellular matrix, collagen fibril organization in the biological process (BP), collagen-containing extracellular matrix, collagen, fibrillar collagen trimer in cellular component (CC) and extracellular matrix, collagen binding and metallopeptidase activity in molecular function (MF) were significantly enriched (Fig. S1A). KEGG pathway analysis showed that ECM-receptor interaction, focal adhesion, PI3K-Akt pathway, and proteoglycans in cancer were mainly enriched (Fig. S1B). Therefore, we speculated that magenta module genes were associated with extracellular matrix-related cancer signalling pathways.
Identification of hub genes by PPI network construction
The genes in magenta module were constructed with a PPI network in Cytoscape software. The MCC algorithm of the plugin cytoHubba plugin was used to calculate the 10 hub genes: COL1A1, COL1A2, FN1, POSTN, THBS2, COL11A1, SPP1, MMP13, COMP, SERPINE1 (Fig. 4A). The correlation heatmap revealed that COL11A1, POSTN, COL1A2, COL1A1, THBS2, and FN1 were highly relevant to each other (Fig. 4B).
Identification of 10 hub genes. (A), 10 hub genes were identified by cytoscape software. Genes (also named nodes) with deeper colors indicate higher scores by MCC algorithm of cytohubba plugin. (B), the correlation of expression levels among 10 hub genes. The deeper colors indicate higher correlation between each other.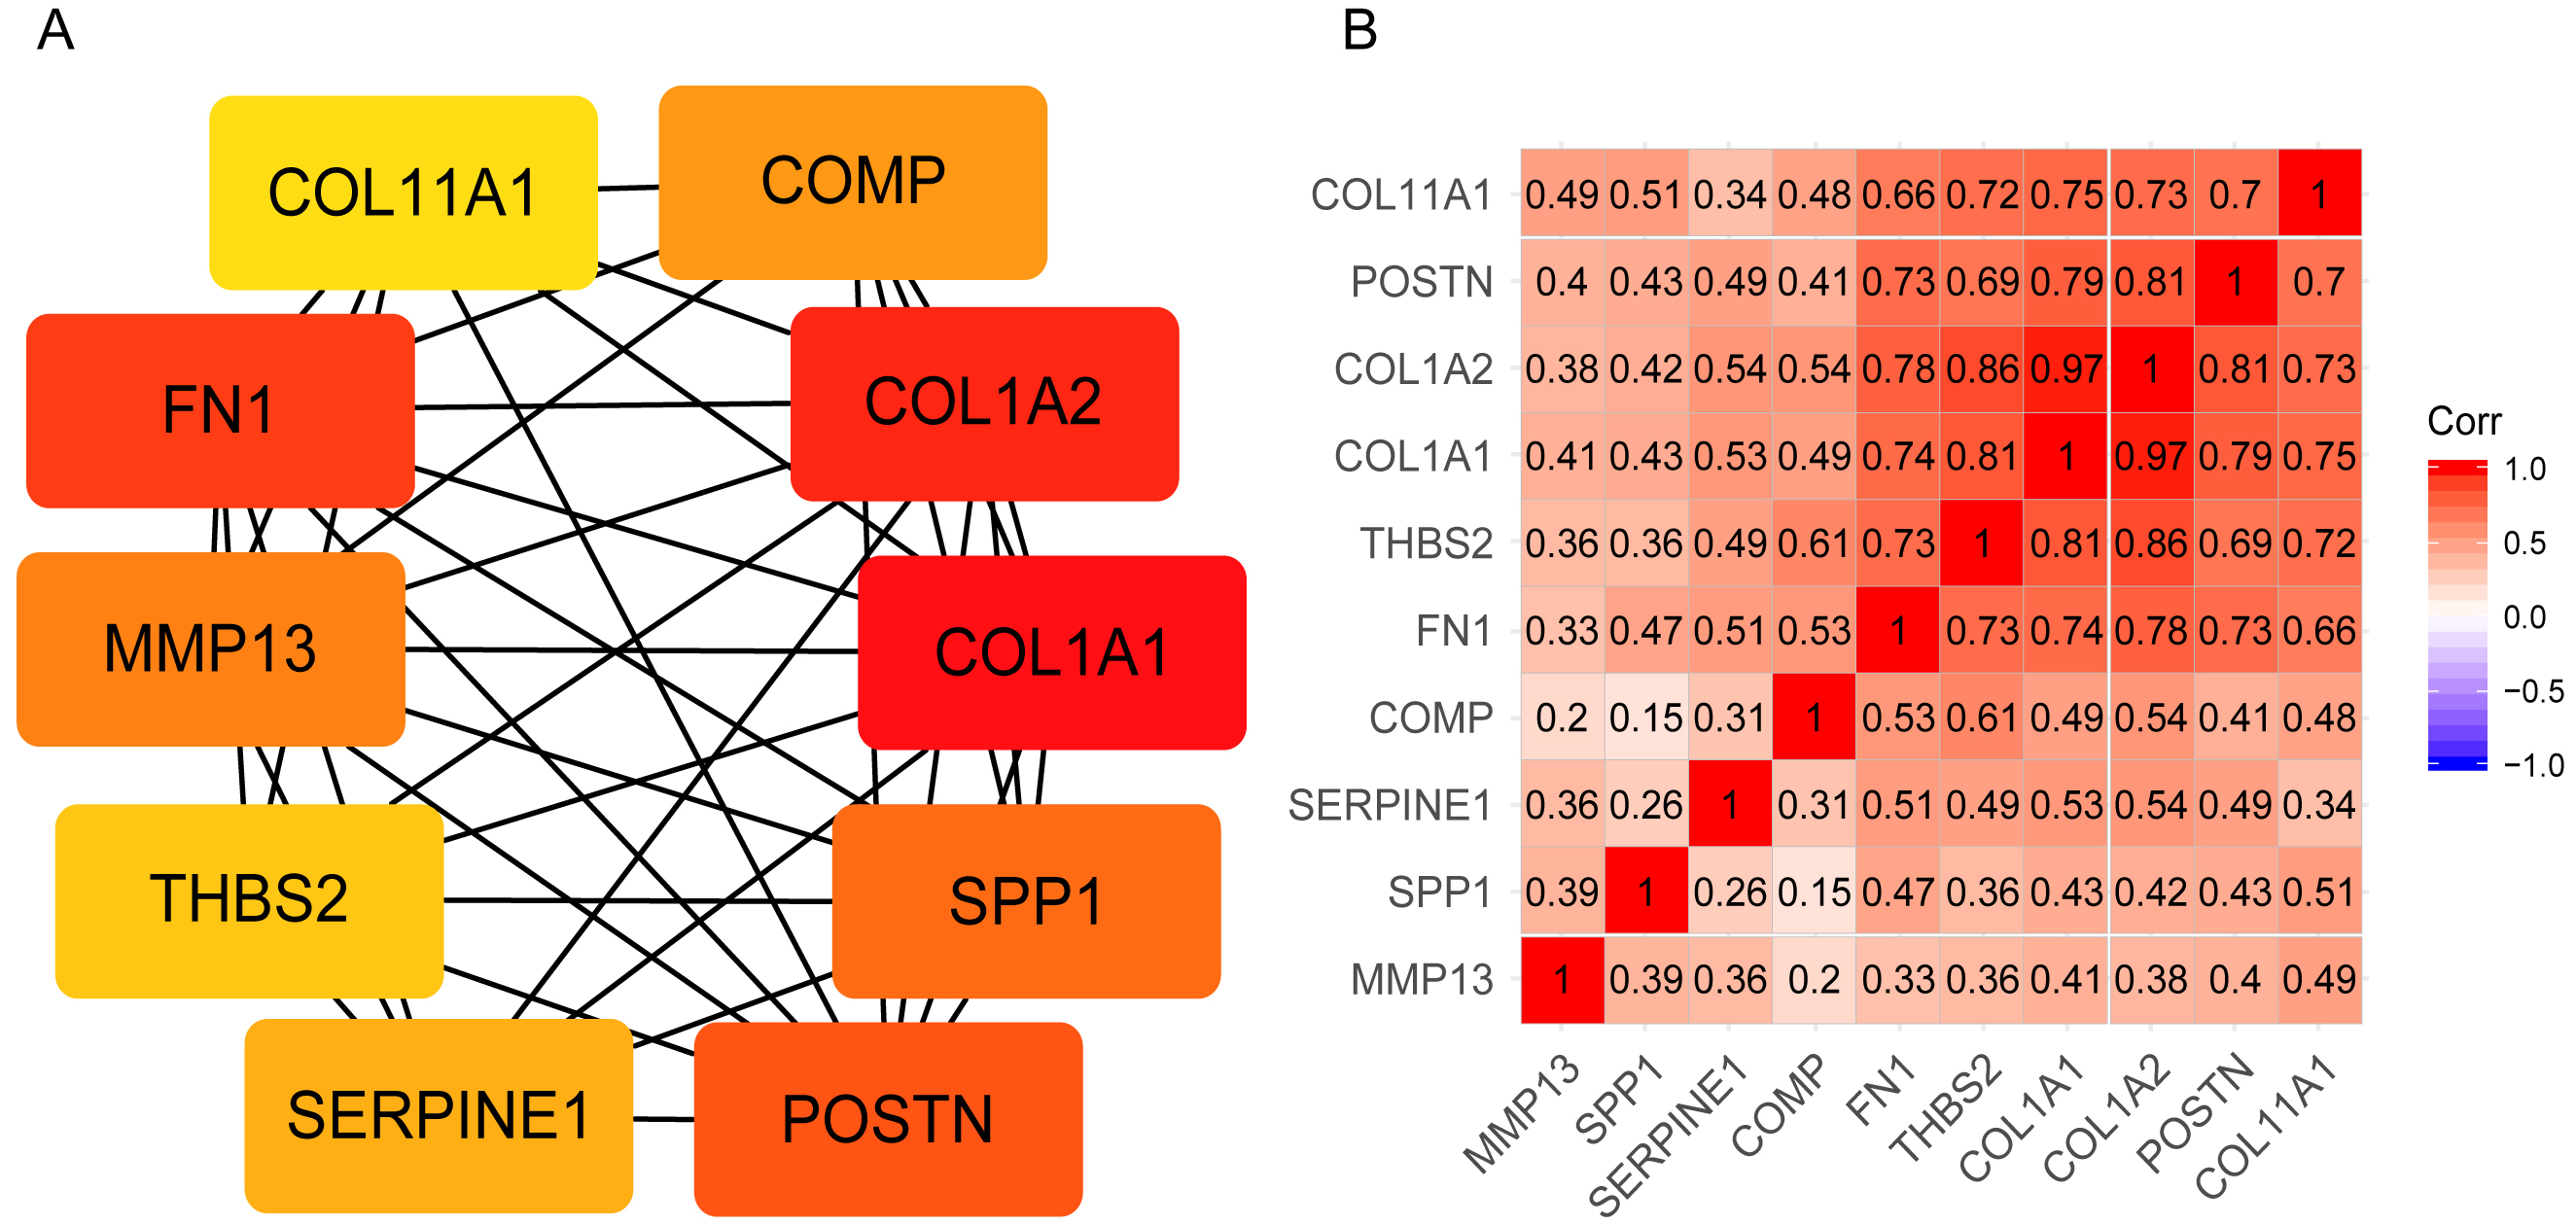
Expression profiles of ten hub genes based on TCGA and GTEx database on GEPIA platform. Red bar refers to gastric cancer samples (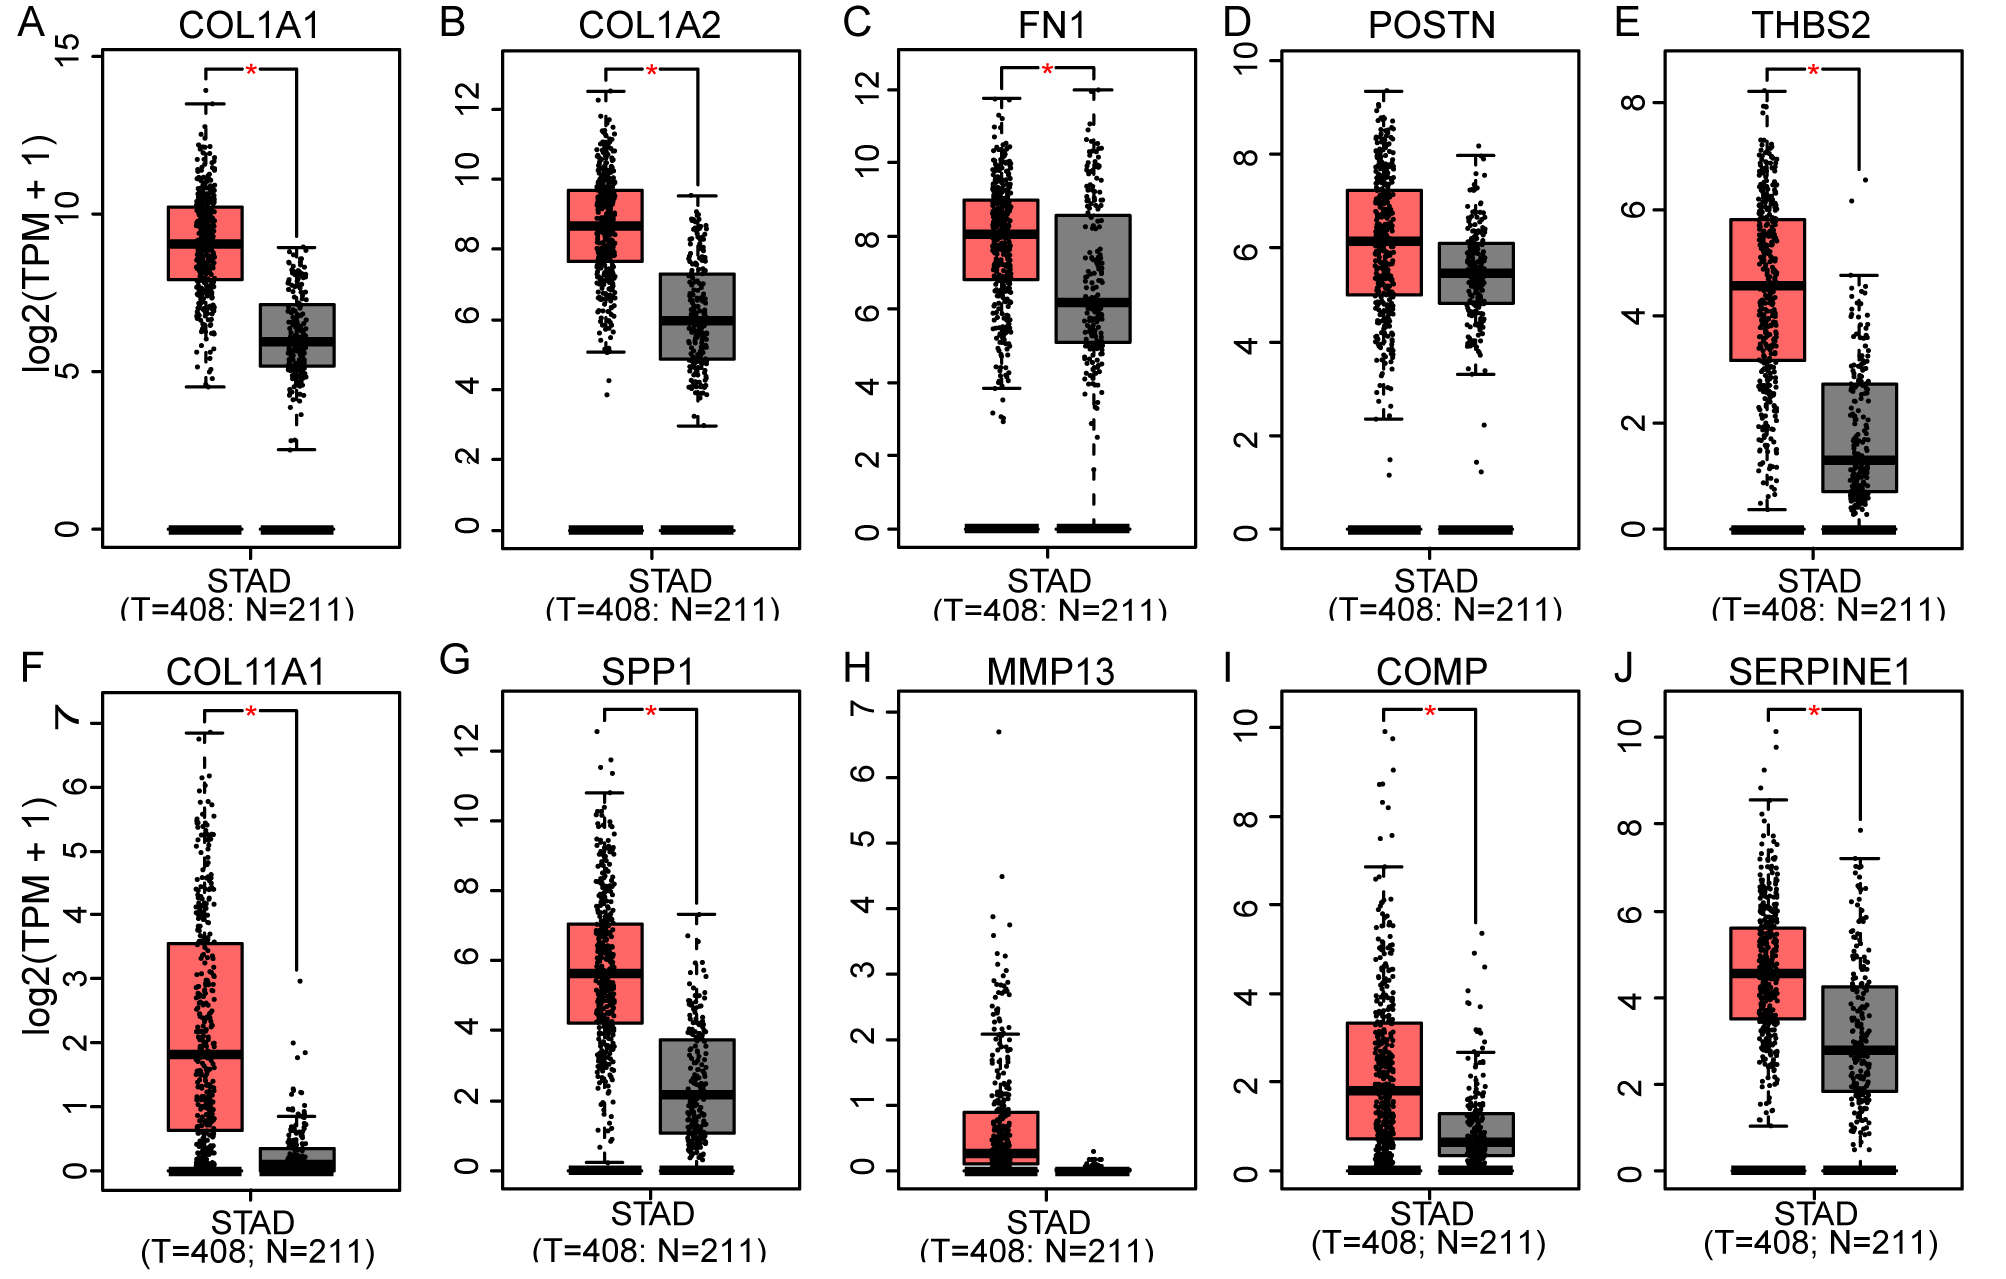
Survival analysis of ten hub genes based on TCGA database on GEPIA platform. The median expression level of each hub gene was as the cut-off value of overall survival for COL1A1 (A), COL1A2 (B), FN1 (C), POSTN (D), THBS2 (E), COL11A1 (F), SPP1 (G), MMP13 (H), COMP (I) and SERPINE1 (J). The Log-rank test was used for hypothesis test. The value of cox proportional hazard ratio (HR) was also calculated. Genes with Logank 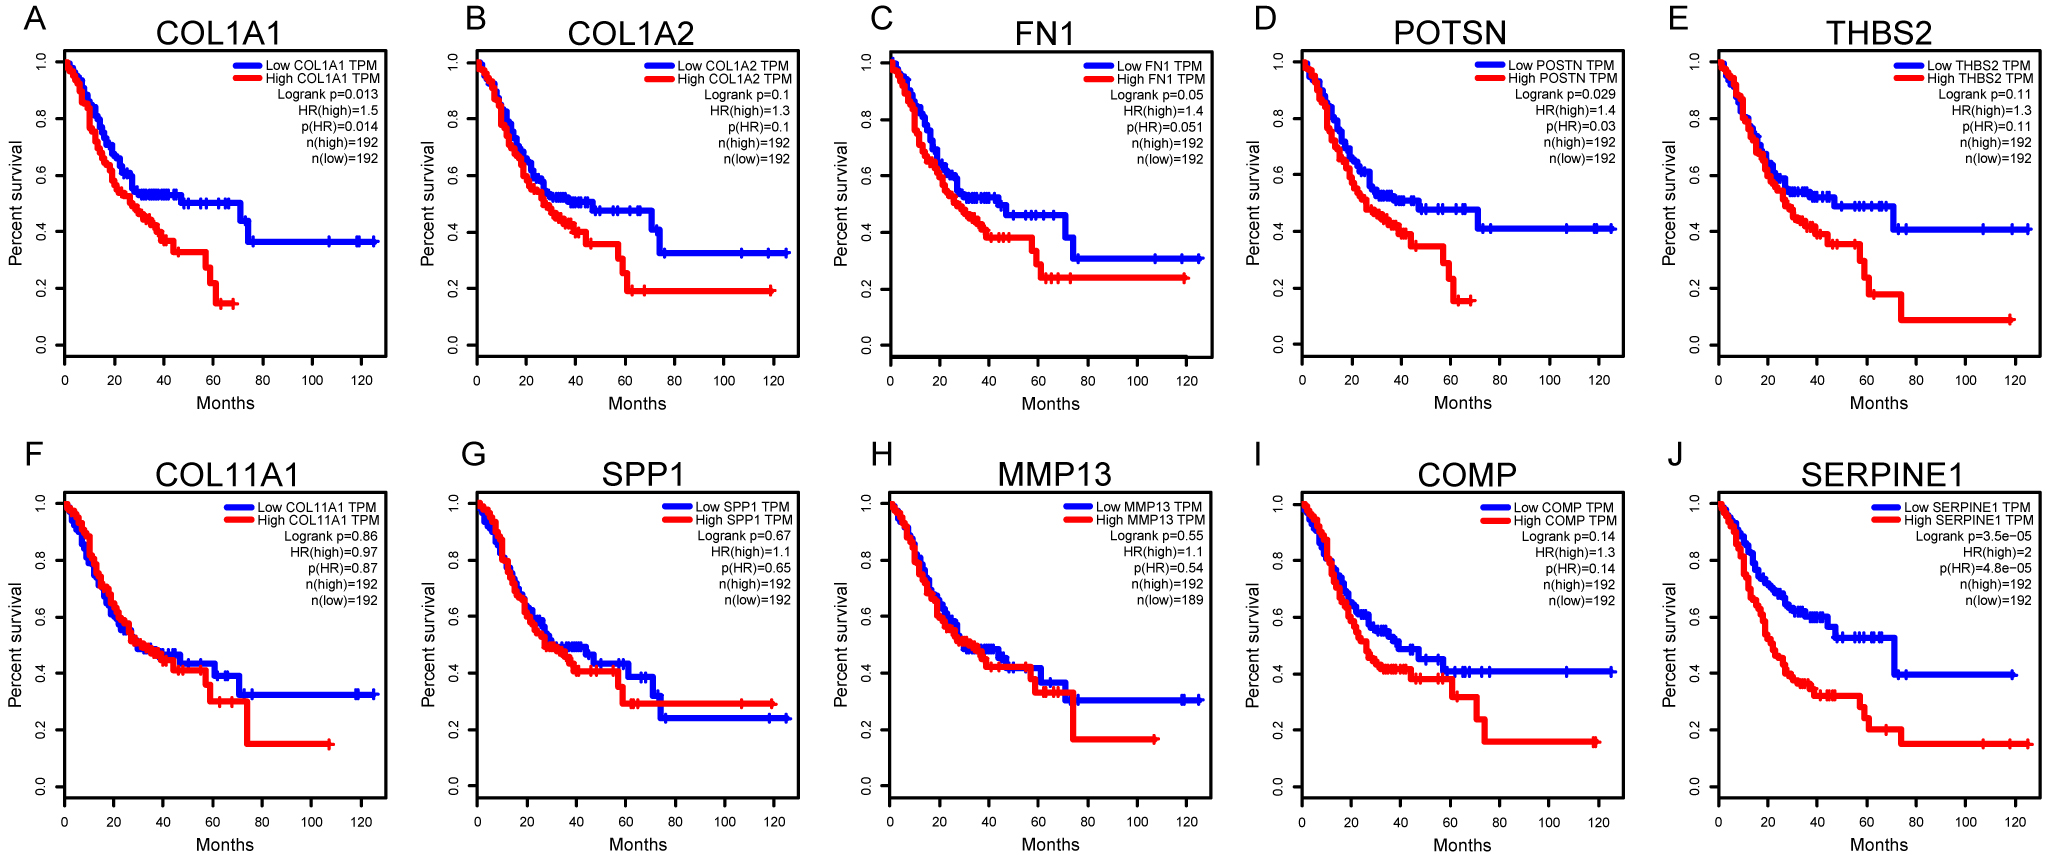
To identify the expression levels of 10 hub genes in GC tissues and normal gastric tissues, both the TCGA and GTEx expression profiles were analysed on the GEPIA platform. The results showed that COL1A1, COL1A2, FN1, THBS2, COL11A1, SPP1, COMP and SERPINE1 were significantly more highly expressed in GC tissues than in normal gastric tissues (Fig. 5A–J). The survival analysis suggested that four genes (COL1A1, FN1, POSTN, and SERPINE1) were identified as significant prognosis-related genes (Fig. 6). By intersecting the DEGs and significant prognosis-related genes, we identified three hub genes (COL1A1, FN1, and SERPINE1) associated with the progression and prognosis of GC.
The relative mRNA levels of FN1, COL1A1 and SERPINE1 in GEO datasets and our experiments with surgical gastric specimens. (A–C), the relative FN1 mRNA levels in GSE54129, GSE118916 and our clinical specimens; (D–F), the relative COL1A1 mNRA levels in GSE54129, GSE118916 and our clinical specimens; (G–I), the relative SERPINE1 mNRA levels in GSE54129, GSE118916 and our clinical specimens. 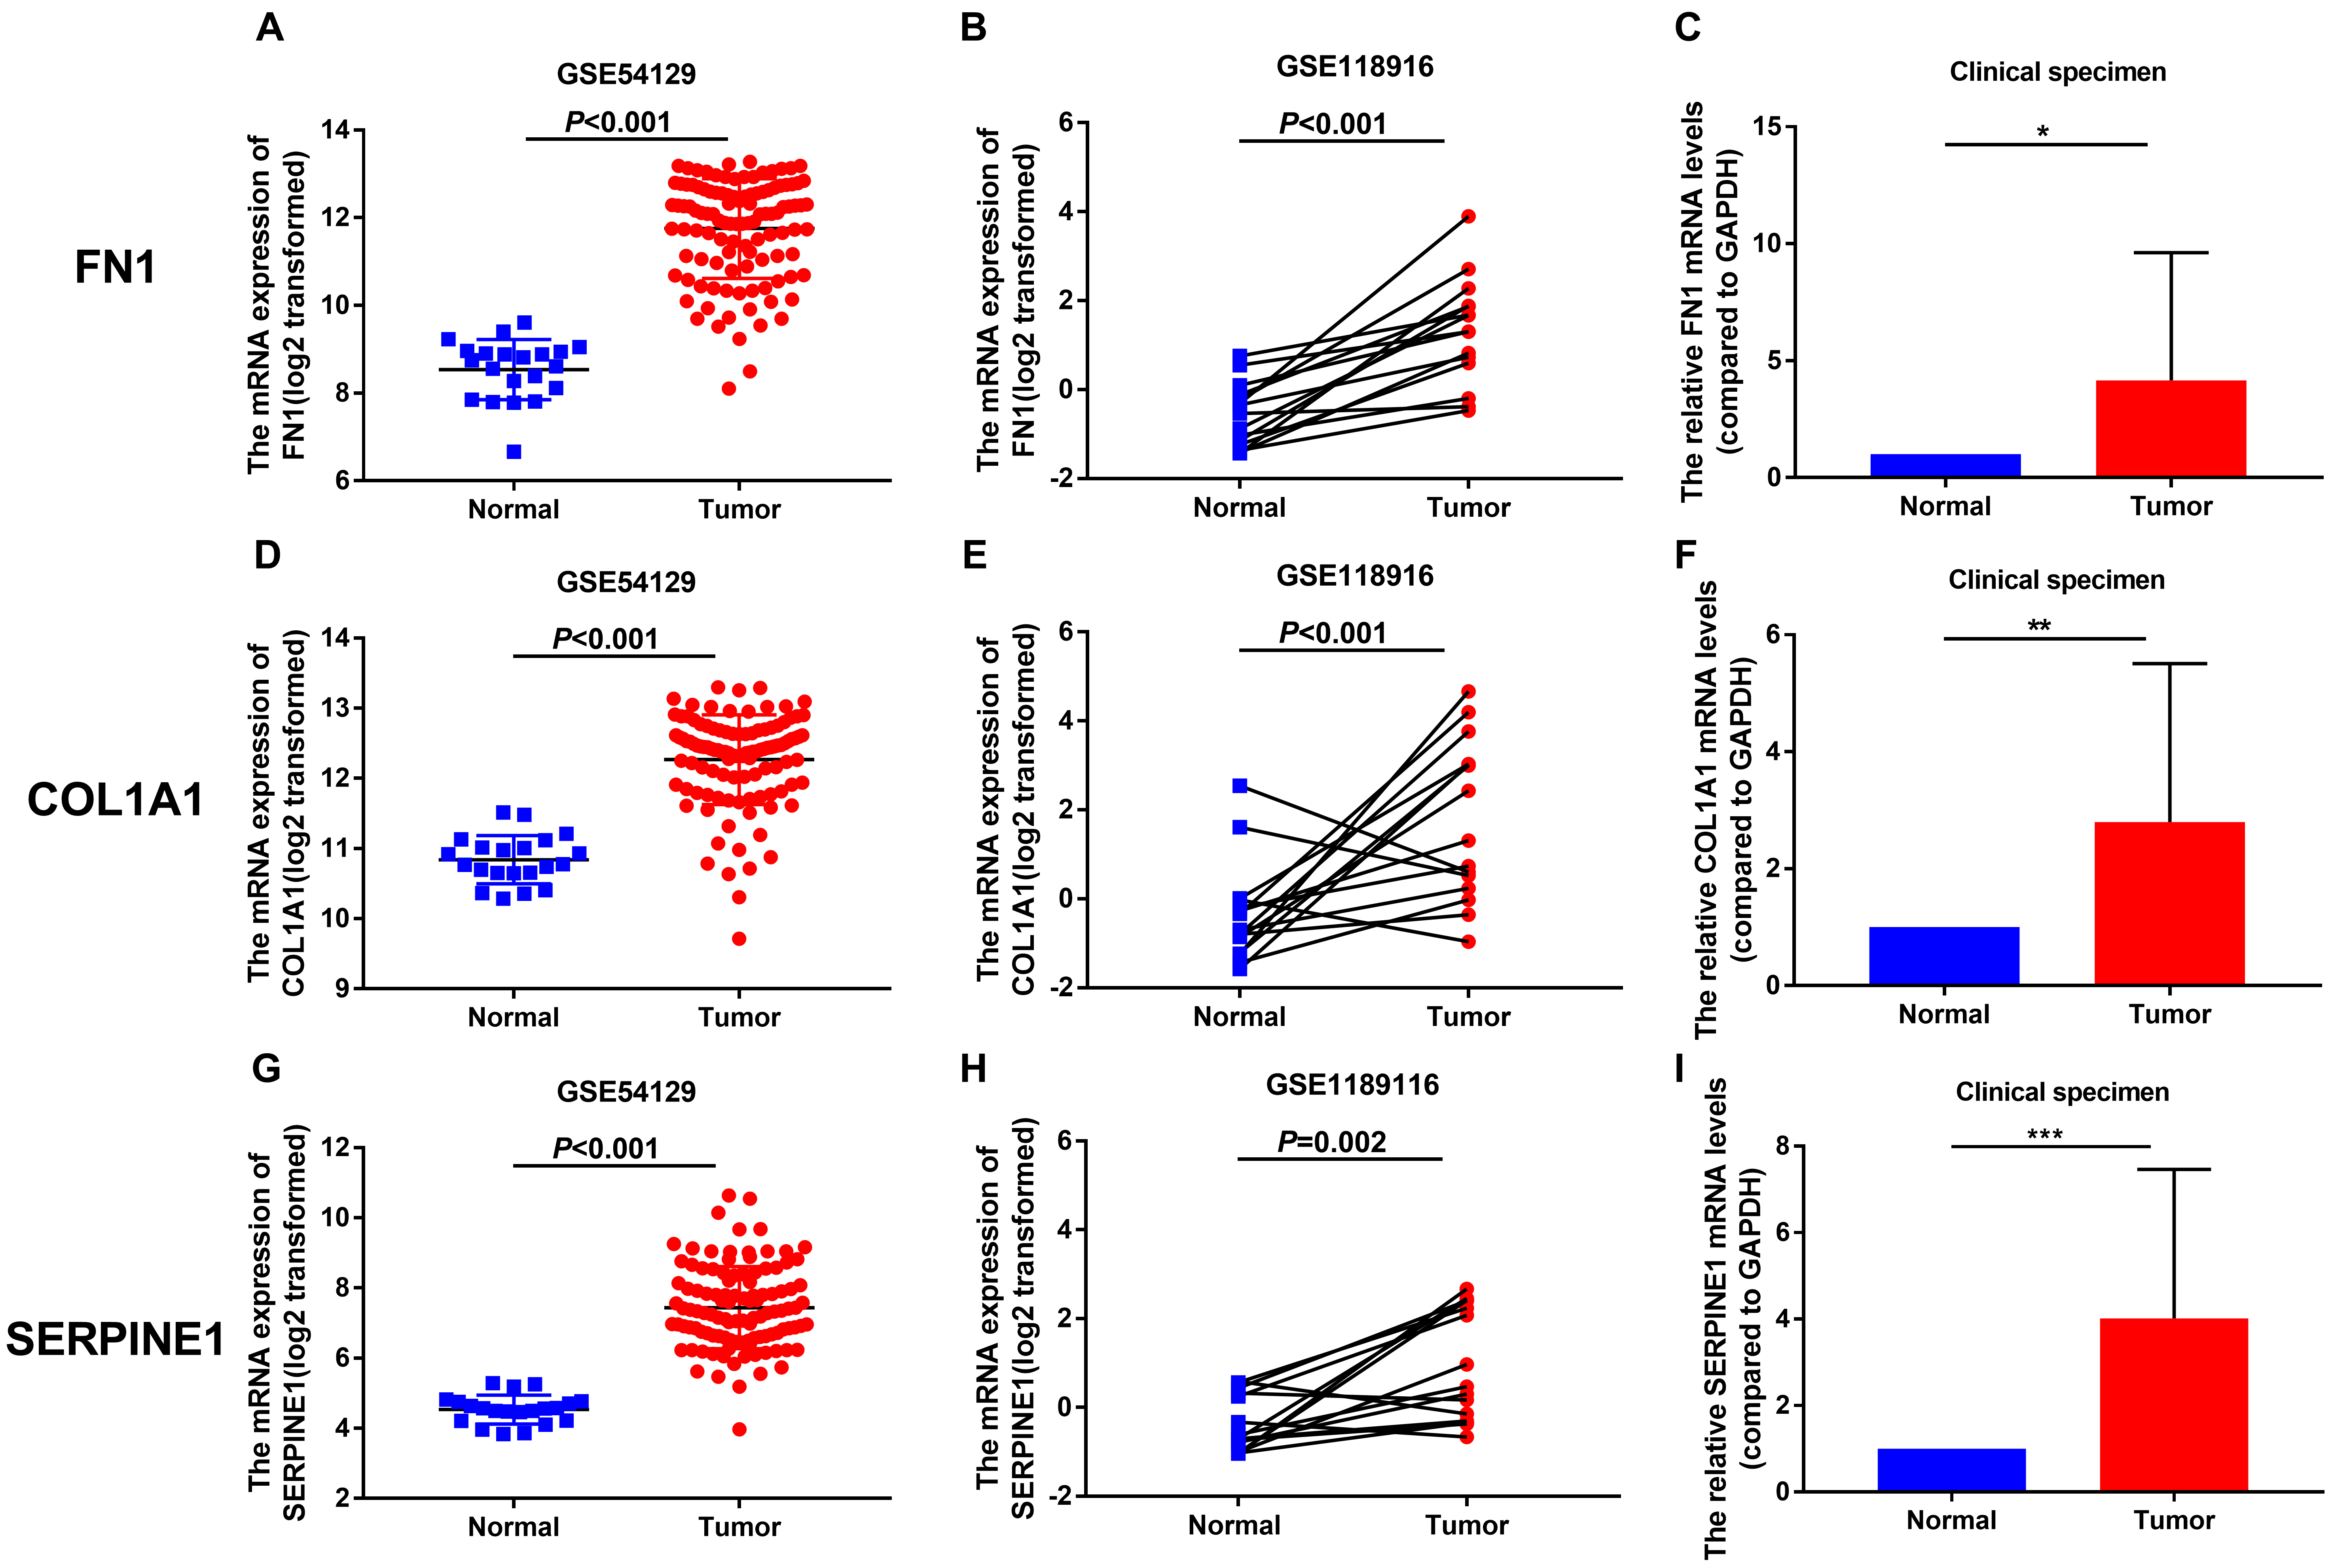
The results of immunohistochemical staining for FN1, COL1A1 and SERPINE1 in our experiments with surgical gastric specimens. (A), the FN1 expression in normal gastric tissues and GC specimens. (B), the COL1A1 expression in normal gastric tissues and GC specimens. (C), the SERPINE1 expression in normal gastric tissues and GC specimens. The objective lens of 100 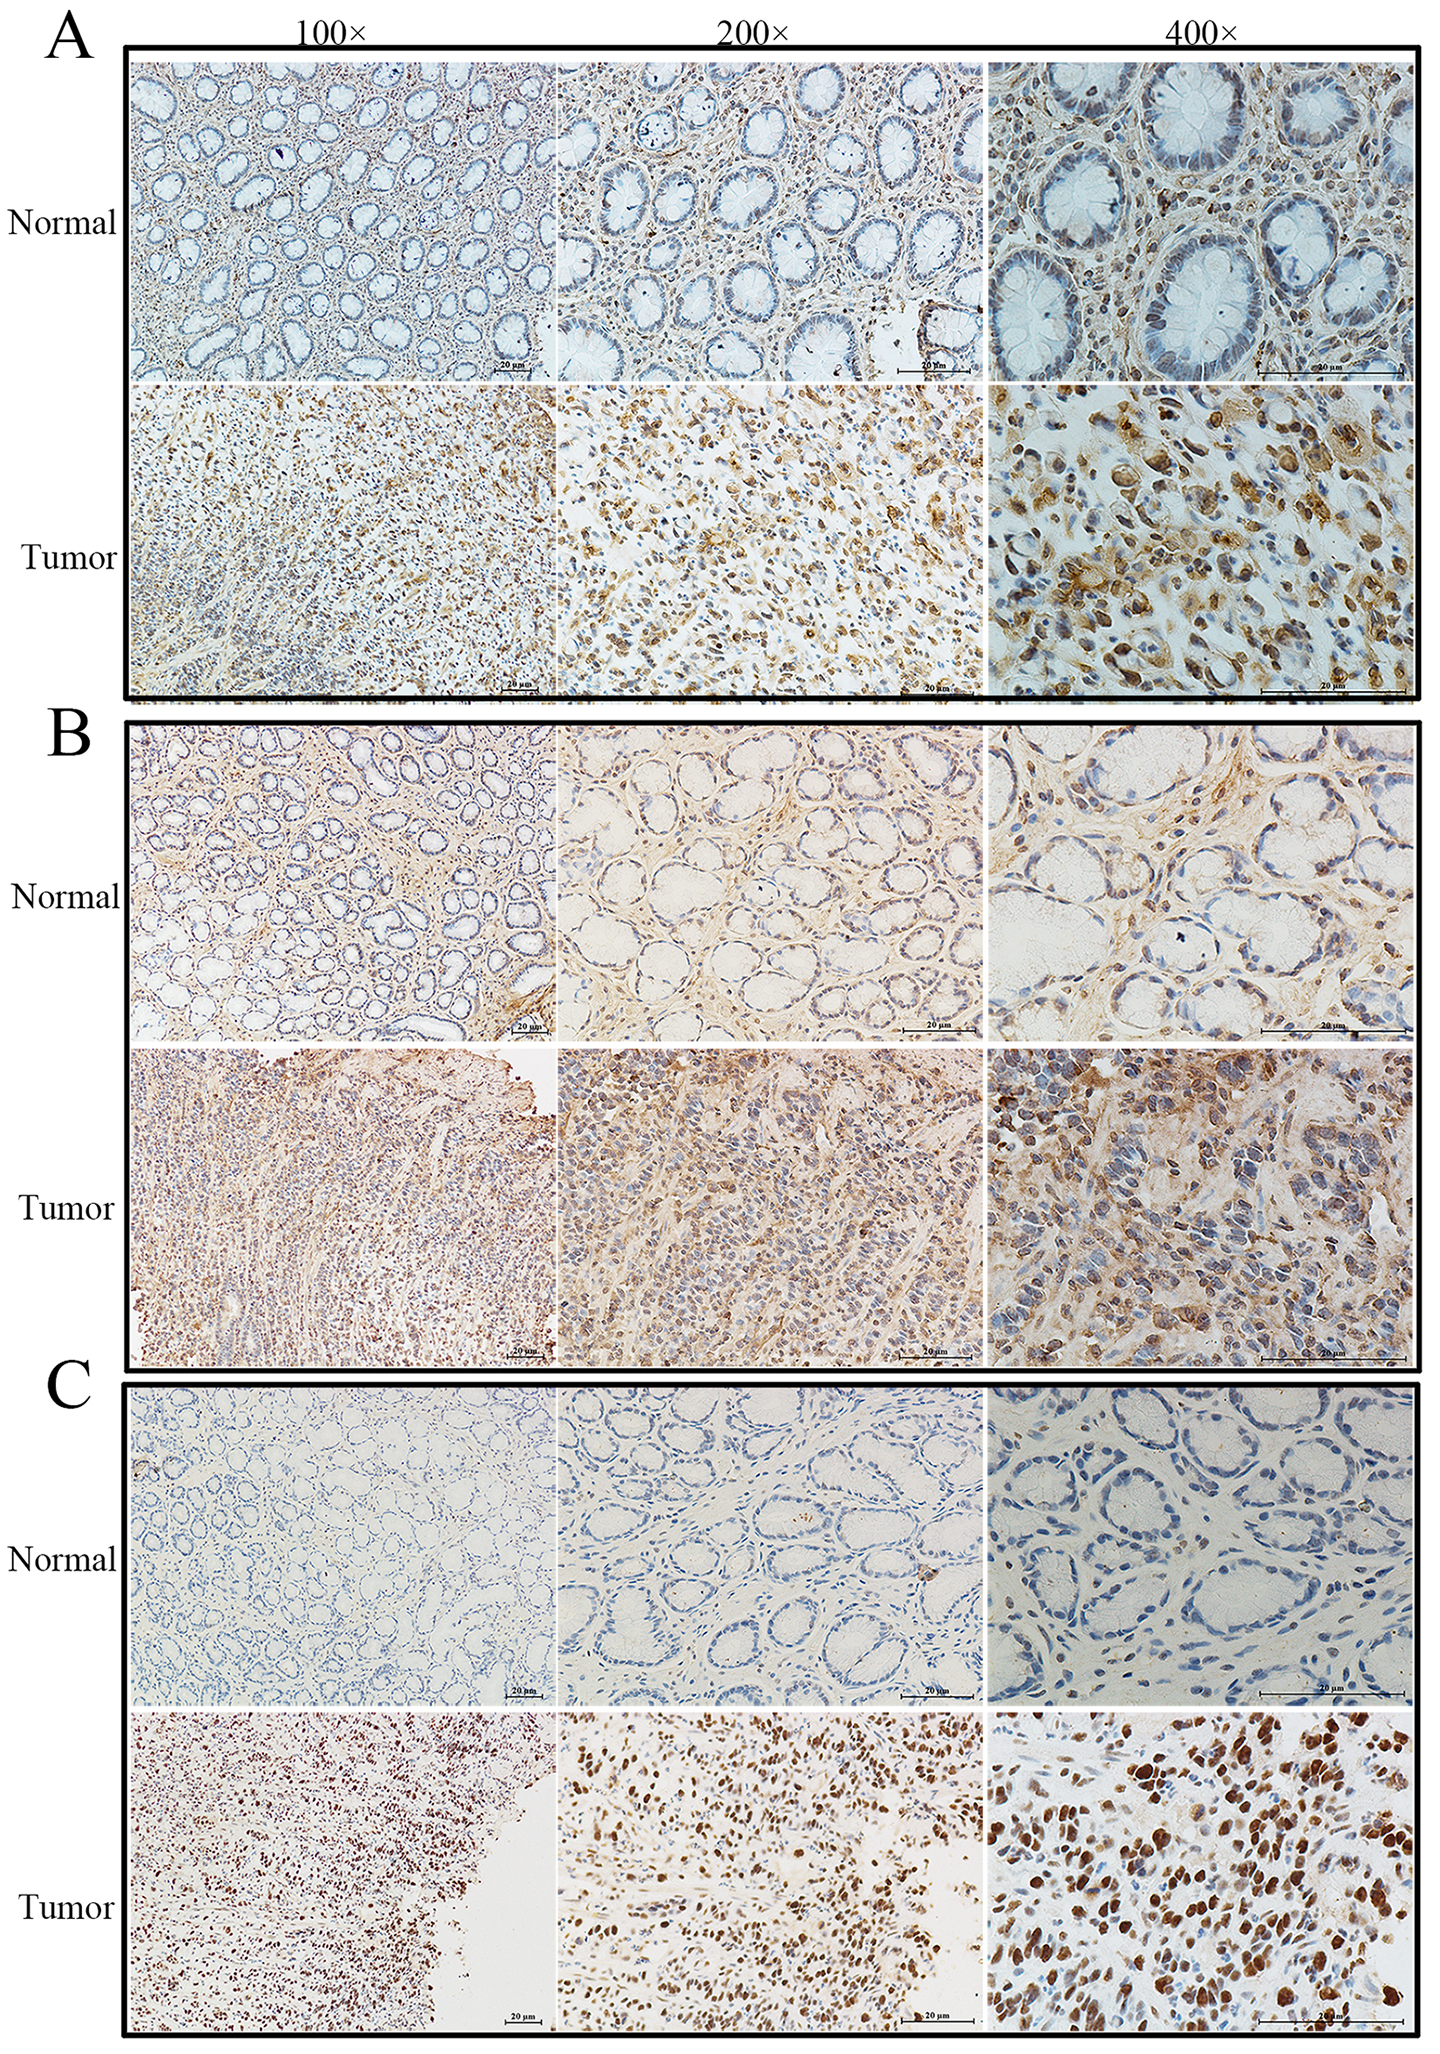
To verify the expression levels of the three hub genes in GC, we used two independent GEO databases and our clinical gastric tissues. The results showed that the relative mRNA levels of FN1, COL1A1 and SERPINE1 were significantly higher in GC in GSE54129 (Fig. 7A, D, G), GSE118916 (Fig. 7B, E, H) and our 20 pairs of clinical gastric specimens (Fig. 7C, F, I). The IHC results showed that FN1, COL1A1 and SERPINE1 were more highly expressed in GC tissues than in normal gastric tissues (Fig. 8A–C). In addition, WB results indicated that FN1, COL1A1 and SERPINE1 were significantly more highly expressed in GC (Fig. 9A–E). Therefore, the results above verified that FN1, COL1A1 and SERPINE1 were three hub genes influencing the development of GC.
Hub gene validation in prognosis values and diagnostic evaluation
To verify the prognostic value of the three hub genes, we first performed survival analysis of two independent GEO databases at the Kaplan-Meier Plotter online resource. The results showed that overexpression of the three hub genes was all significantly associated with poor prognosis of GC in both GSE15459 (Fig. 10A–C) and GSE62254 (Fig. 10D and E). In addition, univariate and multivariate Cox regression analyses revealed that high expression levels of FN1, COL1A1 and SERPINE1 were independent risk factors for poor prognosis of GC (Table 2).
Univariate and multivariate analysis of FN1, COL1A1 and SERPINE1 mRNA expression levels and clinical parameters in TCGA gastric cancer patients
Univariate and multivariate analysis of FN1, COL1A1 and SERPINE1 mRNA expression levels and clinical parameters in TCGA gastric cancer patients
Note:
The results of western blot for FN1, COL1A1 and SERPINE1 in our experiments with surgical gastric specimens. (A–B), the ECL exposed images of WB in 12 pairs of GC and normal gastric tissues. (D–E), the statistical histograms of WB for FN1, COL1A1 and SERPINE1. 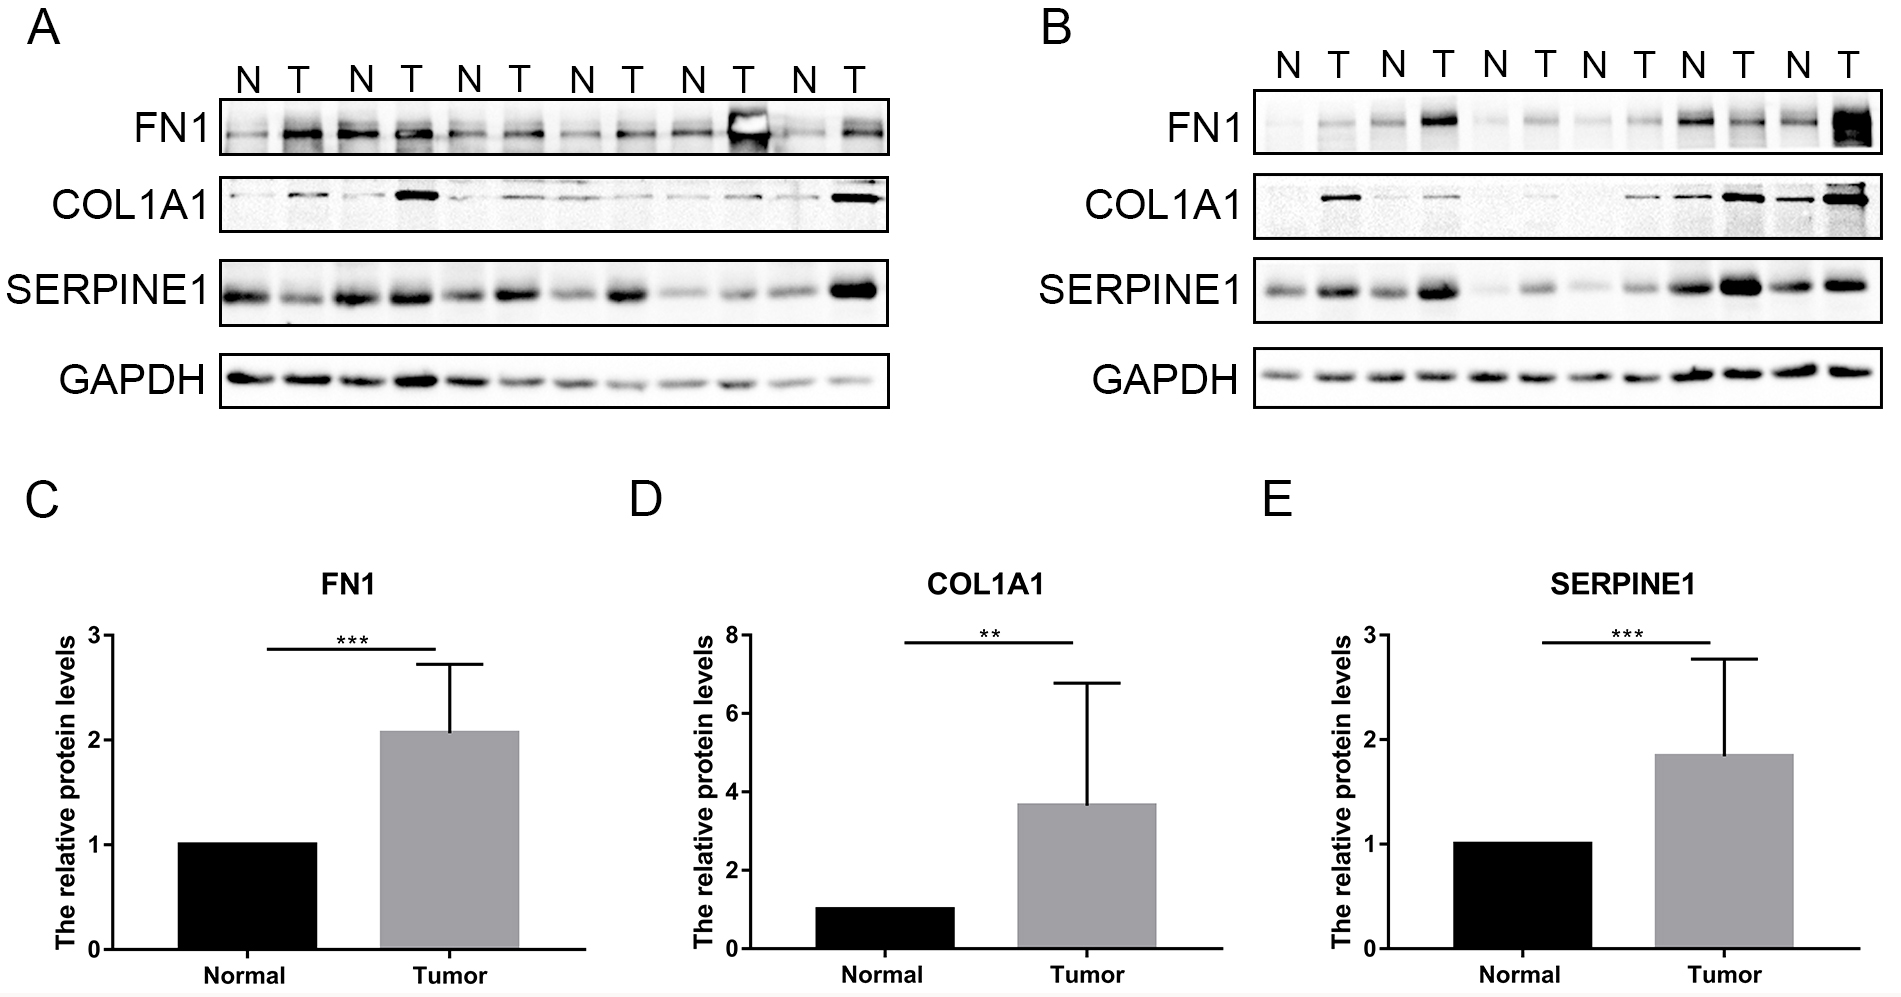
Co-enriched Hallmark genesets of COL1A1, FN1 and SERPINE1 by GSEA anlysis
Note: NES: normalized enrichment score; NOM
Survival analysis of FN1, COL1A1 and SERPINE1 based on GSE15459 (A–C) and GSE62254 (D–F) datasets from Kaplan-Meier Plotter platform. Logrank method was used for hypothesis test. 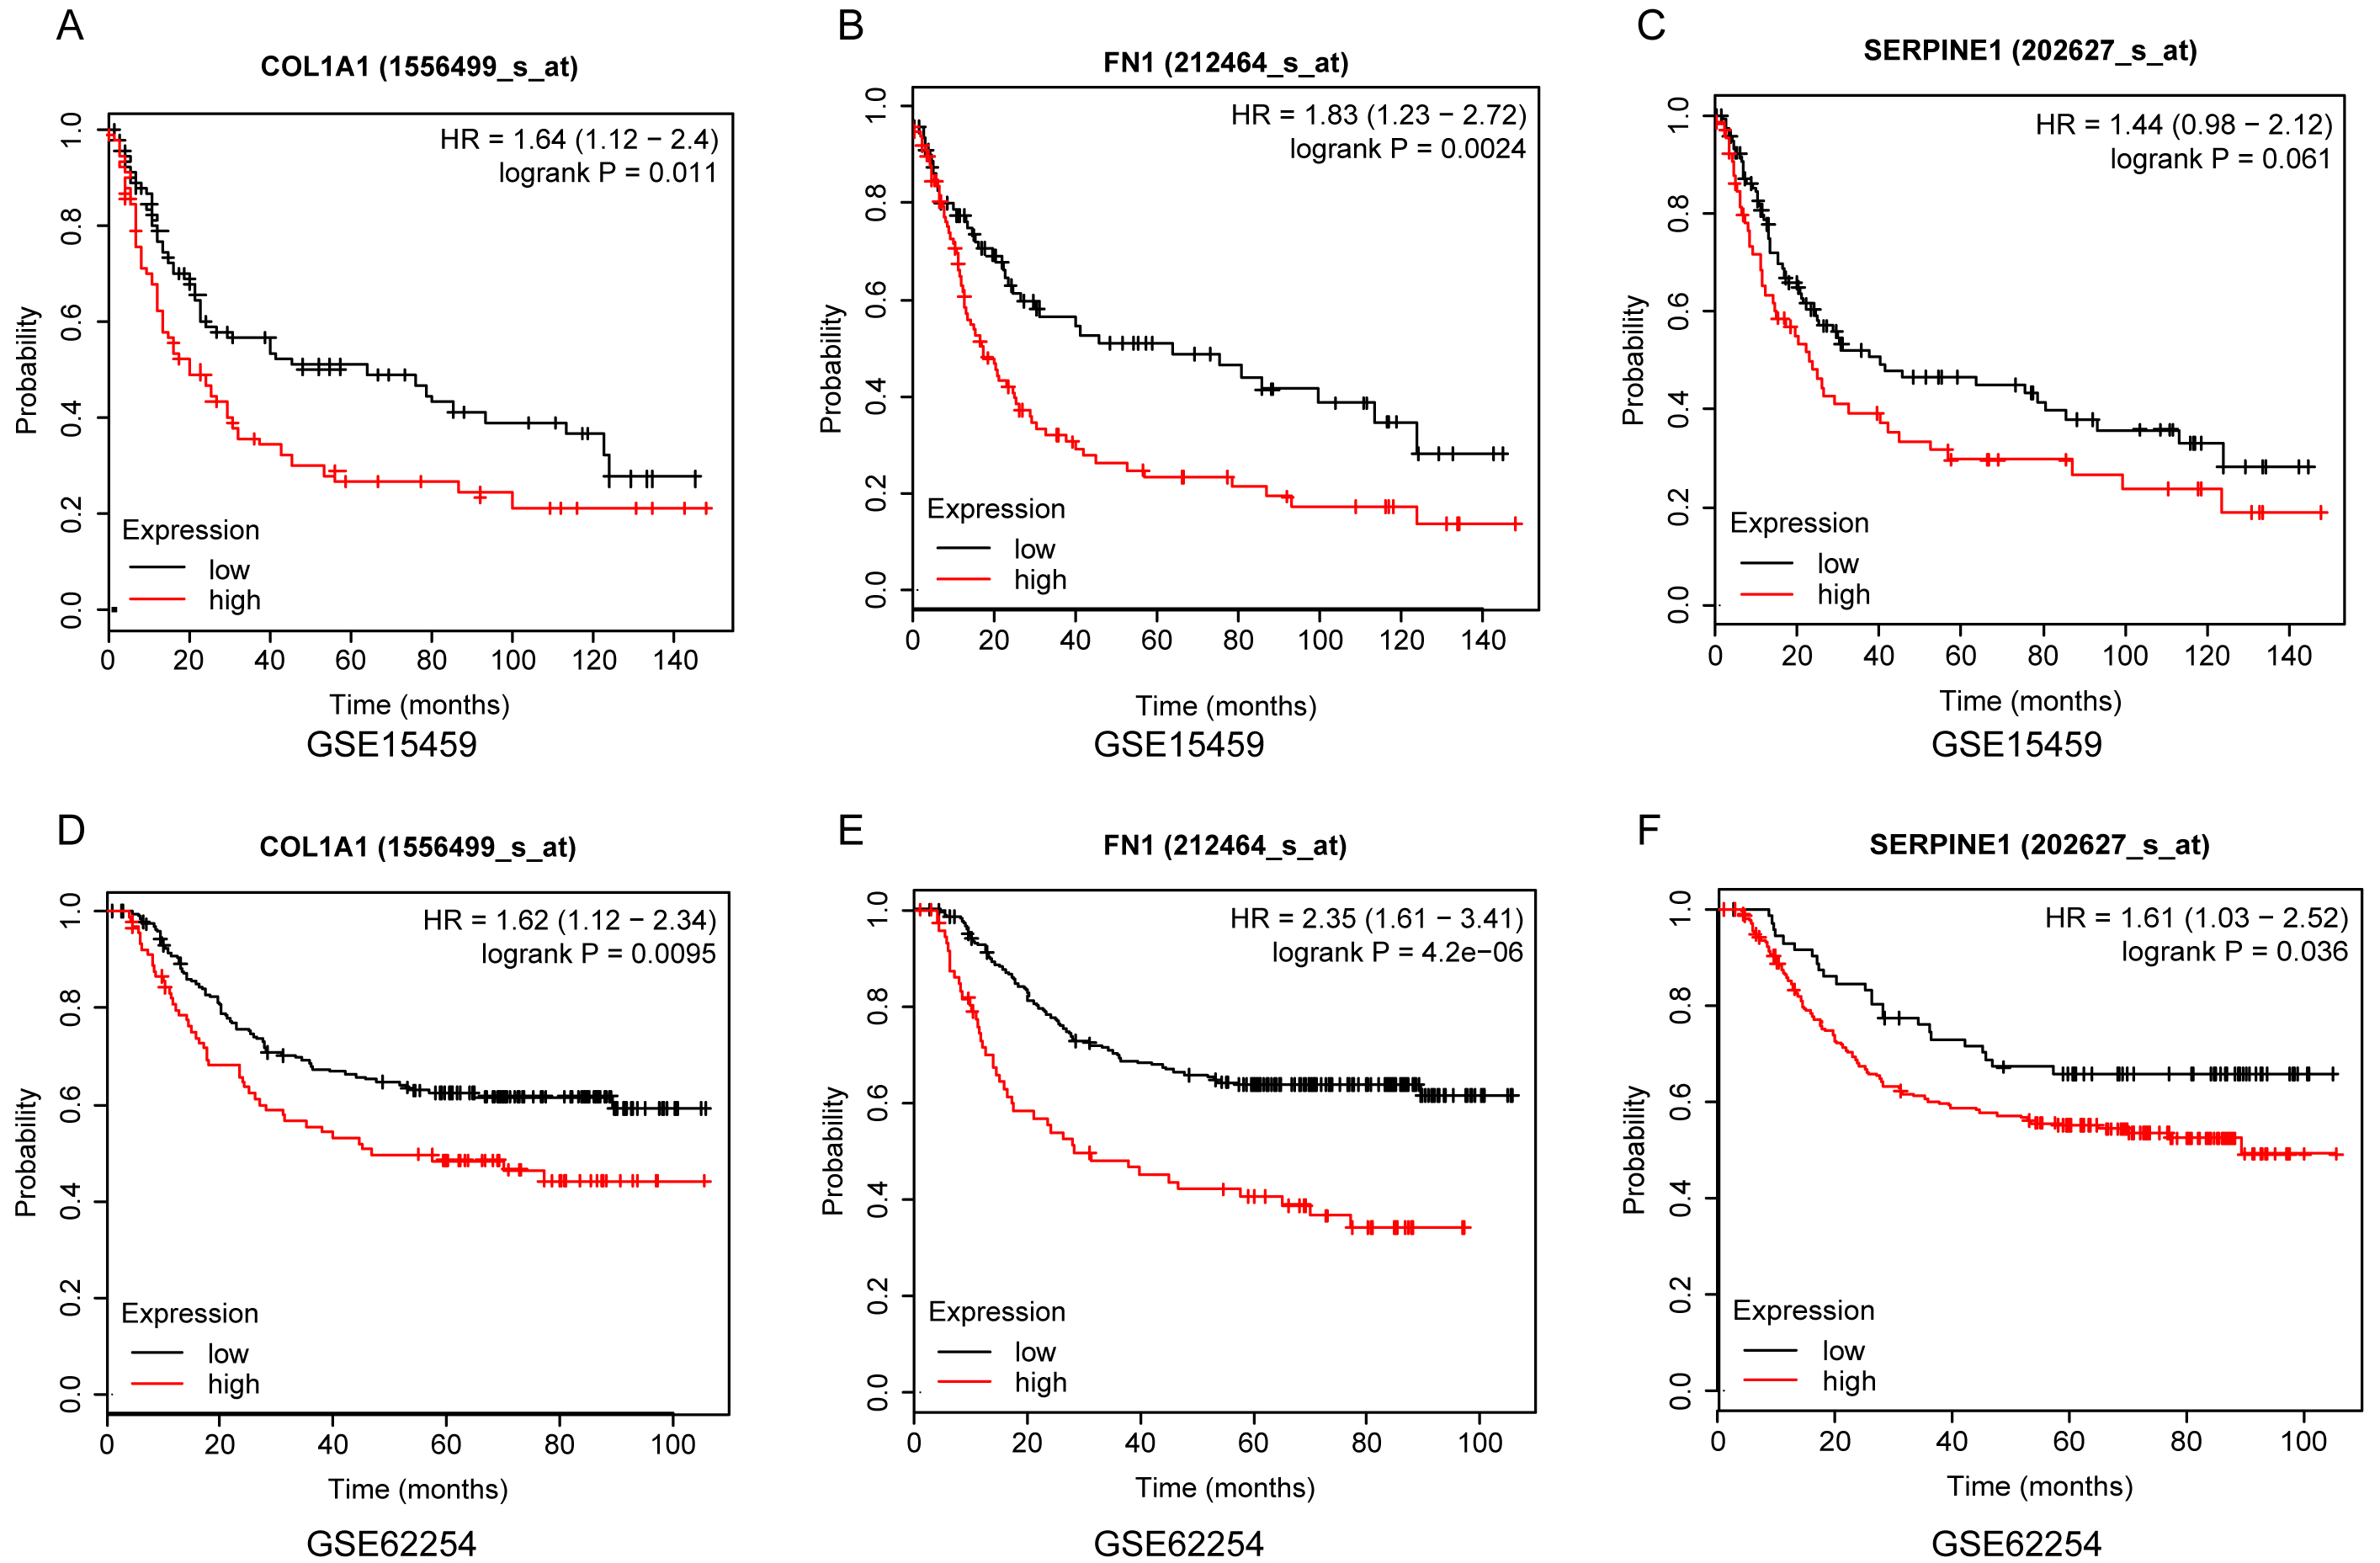
ROC curve of FN1, COL1A1 and SERPINE1 mRNA expression levels for prediction of GC. (A), ROC curve of FN1; (B), ROC curve of COL1A1; (C), ROC curve of SERPINE1.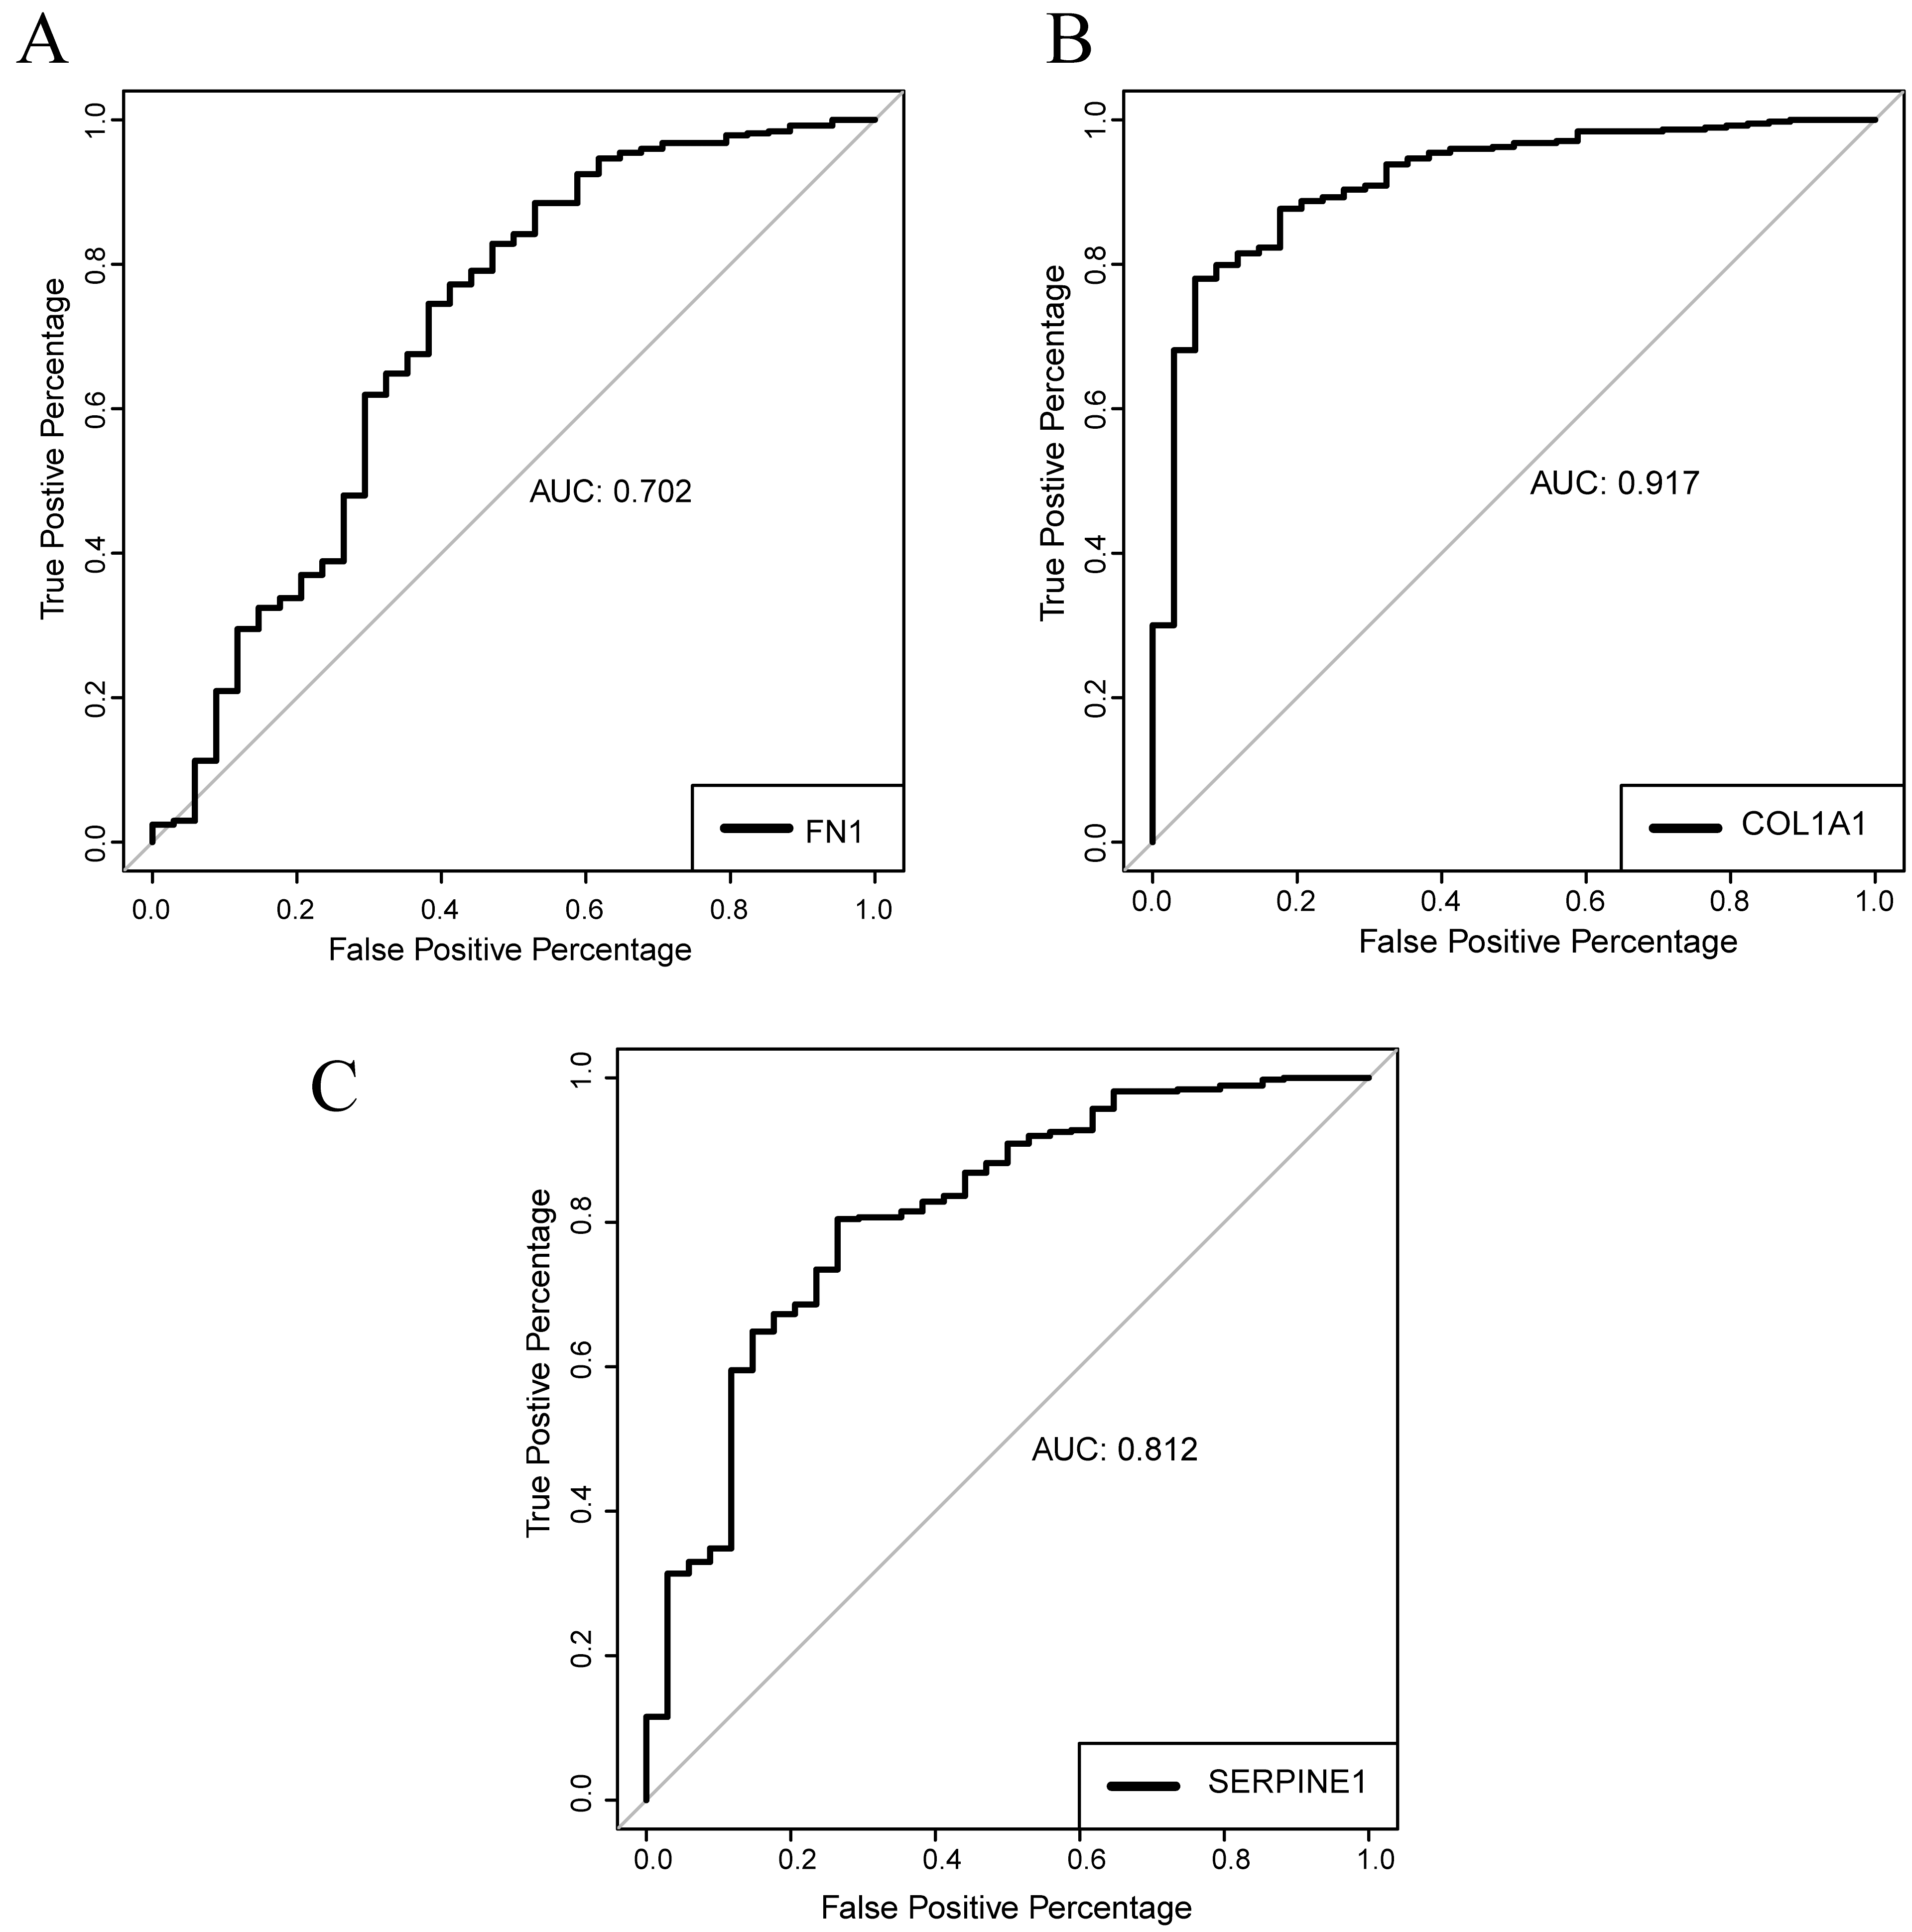
The ROC curve showed that the AUC areas of FN1, COL1A1 and SERPINE1 were 0.702, 0.917 and 0.812, respectively, suggesting that three hub genes might be good diagnostic biomarkers of GC.
To evaluate the potential carcinogenic mechanisms of FN1, COL1A1 and SERPINE1, we performed GSEA based on hallmark gene sets. The results showed that the majority of significantly enriched pathways among COL1A1, FN1 and SERPINE1 were the same. A total of 15 coenriched pathways were identified, including hypoxia, epithelial mesenchymal transition (EMT), angiogenesis, apical junction, apoptosis, inflammatory response, TGF-
Discussion
Identifying potential prognostic and therapeutic biomarkers is very important for cancers [32, 33]. In fact, there have been some studies using WGCNA to explore the correlation between gene modules of gastric cancer and clinical traits [13, 34]. However, as most of the studies use differentially expressed genes as input data of WGCNA, it may destroy genetic diversity and not reflect the true cluster results. In the current study, WGCNA was performed based on the TCGA database at the overall level.
We identified a magenta module that was highly correlated with stage, grade and overall survival. Enrichment analysis showed that the magenta module mainly functioned as extracellular matrix (ECM) components and was related to the ECM-receptor interactions, focal adhesion, and the PI3K-Akt pathway. Increasing evidence has shown that overexpressed ECM proteins such as collagen, fibroblasts, and laminin contribute to promoting cancer cell proliferation, migration and invasion [35, 36, 37]. A recent study reviewed the role of the ECM in different stages of gastric cancer, and indicated that ECM components, receptors and associated signalling molecules should be used as predictive biomarkers or as potential targets in gastric cancer [38].
To identify hub genes of the magenta module, we performed a PPI network [39] and selected ten hub genes for further study. The ten hub genes were highly relevant to each other, indicating that they might have similar functions in GC. Among ten hub genes, eight genes (COL1A1, COL1A2, FN1, THBS2, COL11A1, SPP1, COMP and SERPINE1) were significantly more highly expressed in GC tissues than in normal gastric tissues, among which three DEGs (FN1, COL1A1 and SERPINE1) were significantly associated with poor prognosis in GC.
The COL1A1 gene encodes type I collagen which constitutes a major component of the extracellular matrix. Both GEO and experimental verification from our clinical specimens showed that COL1A1 was more highly expressed in GC tissues than in normal gastric tissues. Univariate Cox regression analyses revealed that high expression levels of COL1A1 were an independent risk factor for poor prognosis of GC. In fact, COL1A1 has been reported to be overexpressed in various tumours such as breast cancer [40], colorectal cancer [41] and hepatocellular cancer [42]. A previous study found that the expression of COL1A1 mRNA was significantly upregulated in GC tissues compared with normal tissues and was related to poor overall survival [43]. Another integrated bioinformatics analysis identified that COL1A1 correlated with the pathogenesis of GC [44]. Together with our results of WGCNA, COL1A1 was considered a crucial oncogene in the progression and prognosis of GC. FN1 encodes fibronectin 1 protein, a glycoprotein of the extracellular matrix that acts as a ligand of the integrin family [45]. In this study, we found that FN1 was highly expressed in GC and was an independent risk factor for GC. Increased FN1 expression levels have been reported in various aggressive tumours and related to the migration and invasion of cancer cells [46, 47, 48]. Although some studies based on bioinformatics or experiments have confirmed that FN1 is overexpressed in GC tissues [49, 50, 51], the potential pathogenic mechanism of FN1 in GC remains unclear. SERPINE1 encodes plasminogen activator inhibitor 1 (PAI-1),which regulates the adhesion balance of cells to ECM [52]. It has been reported that high expression of SERPINE1 may promote invasiveness and aggressiveness and predict poor prognosis in various tumours such as colorectal cancer [53], oral squamous cell carcinoma [54] and breast cancer [55]. Here, we identified SERPINE1 as upregulated in GC tissues and as a prognostic biomarker of GC, which is consistent with some studies based on DNA microarray data [44, 56].
ROC curves are usually used to assess the diagnostic efficiency between two methods. The AUC values of the ROC curves of FN1, COL1A1 and SERPINE1 were all greater than 0.7, suggesting that these genes might be good diagnostic biomarkers of GC.
GSEA revealed that overexpression of three hub genes shared 15 common upregulated biological pathways including hypoxia, epithelial mesenchymal transition, angiogenesis, apical junction, apoptosis, inflammatory response, myogenesis, TGF-
Conclusion
We identified FN1, COL1A1 and SERPINE1 as associated with the progression and poor prognosis of GC. These genes might be good diagnostic and prognostic biomarkers of GC.
Author contributions
ZQY and XJ contributed equally to preparation of the manuscript. ZQY performed the WGCNA analysis and drafted the manuscript. XJ contributed to WB, qPCR and IHC experimental verification. XJL helped collect GC surgical specimens. ZRL, SCH, WH and RJF contributed to interpretation or analysis of data. YLL, SYP and WFF contributed to revision for important intellectual content. SCH and XY contributed to the supervision of the study. All authors read and approved the final manuscript.
Data availability statement
The datasets generated and/or analyzed in the study are available in the National Center of Biotechnology Information’s GEO database (www.ncbi.nlm. nih.gov/gds/) with the accession no. GSE 54129 and GSE118916 and in the Genomic Data Commons Client (https://portal.gdc.cancer.gov/) for TCGA databases.
Footnotes
Acknowledgments
This research was supported by the National Key Research and Development Program of China (No. 2016YFC1302201), National Natural Science Foundation of China (No. 81970502, No. 81860107, No. 81260076, No.81460115) and Leading Talent Training Plan of the Gan-Po Outstanding Talents 555 Project of Jiangxi Province (2010-3-61).
Conflict of interest
The authors declare that they have no conflict of interests.
Supplementary data
GO and KEGG pathway enrichment analysis of magenta module. (A), Visualization of GO cluster (including BP, CC and MF classification) with a bar chart. BP, biological process; CC, cellular component; MF, molecular function. (B), Visualization of KEGG pathway with a bubble chart.