
Abstract
BACKGROUND:
Patients with oral squamous carcinoma (OSCC) present difficulty in precise diagnosis and poor prognosis.
OBJECTIVE:
We aimed to identify the diagnostic and prognostic indicators in OSCC and provide basis for molecular mechanism investigation of OSCC.
METHODS:
We collected sequencing data and clinical data from TCGA database and screened the differentially expressed mRNAs (DEmRNAs) and lncRNAs (DElncRNAs) in OSCC. Machine learning and modeling were performed to identify the optimal diagnostic markers. In order to determine lncRNAs with prognostic value, survival analysis was performed through combing the expression profiles with the clinical data. Finally, co-expressed DEmRNAs of lncRNAs were identified by interacted network construction and functional annotated by GO and KEGG analysis.
RESULTS:
A total of 1114 (345 up- and 769 down-regulated) DEmRNAs and 156 (86 up- and 70 down-regulated) DElncRNAs were obtained in OSCC. Following the machine learning and modeling, 15 lncRNAs were identified to be the optimal diagnostic indicators of OSCC. Among them, FOXD2.AS1 was significantly associated with survival rate of patients with OSCC. In addition, Focal adhesion and ECM-receptor interaction pathways were found to be involved in OSCC.
CONCLUSIONS
: FOXD2.AS1 might be a prognostic marker for OSCC and our study may provide more information to the further study in OSCC.
Introduction
Oral squamous cell carcinoma (OSCC), a common type of head and neck squamous cell carcinoma (HNSCC), was the eighth most common cancer worldwide, and over 300,000 new OSCC were diagnosed each year [1]. Early detection followed by appropriate treatment could improve the cure rates and quality of life of patients with OSCC [2, 3]. Nevertheless, early oral cancer lesions were often asymptomatic and even diagnosis by general population screening was with false-positive [4, 5]. Thus, the National Institute of Dental and Craniofacial Research and The Oral Cancer Foundation have recommended that research efforts focus on developing novel detection techniques.
Next-generation high-throughput sequencing technologies have been used to generate large amounts of transcript sequences and gene expression data for patients with complicated diseases [6]. Up to date, large amounts of biomarkers were screened in salivary of patients with OSCC, including squamous cell carcinoma antigen (SCCAg) [7], carcino-embryonic antigen (CEA) [8], cyfra 21-1 [9], anti-p53 antibodies [10], interleukin-6 (IL-6) and TNF-a [11] in salivary proteomics, and mutated p53 [12], DNA polymorphism of IL-1b [13], IL-6 [14], IL-8 [15], TNF-a [16] and VEGF [17] and aberrant expressions of CD44 [18] in salivary genomics. Furthermore, a study analyzed salivary microbiota in oral cancer indicated that high salivary counts of C. gingivalis, P. melaninogenica and S. mitis might be diagnostic indicators of OSCC [19]. A study showed that lncRNA, HOTAIR, was differentially expressed in the saliva of the OSCC metastatic patients compared with that of primary cancer controls [20]. However, these biomarkers were discovered with small sample size, and several biomarkers that merely reflected changes of biological variability might not be the “true biomarkers” [21]. Thus, diagnostic indicators with higher accuracy should be identified. In addition, patients with OSCC generally had a poor prognosis, and the 5-year survival rate of OSCC remained less than 50% [22, 23, 24]. Therefore, identification of prognostic markers should also be crucial in investigation of OSCC.
Machine learning was the sub-field artificial intelligence which focused on methods to construct computer programs that learn from experience with respect to some class of tasks and a performance measure [25]. Machine learning methods have been applied to a huge variety of problems in genomics and genetics [26]. In our study, we firstly selected differentially expressed mRNAs (DEmRNAs) and lncRNAs (DElncRNAs) of OSCC in TCGA database and then screened key diagnostic and prognostic lncRNAs by machine learning. Finally, following the DElncRNA-DEmRNA interacted network construction, functional annotation was performed in the co-expressed DEmRNAs of lncRNAs. Our study identified the diagnostic and prognostic markers by combining the gene expression profile and clinical data and provided a molecular basis to the further investigation of OSCC.
Materials and methods
Eligible data of HNSCC screening in TCGA database
The pre-treated grade 3 RNA-Seq data and the clinical data related to HNSCC from the database set-up to October 10
Identification of DEmRNAs and DElncRNAs in OSCC
Clean data was obtained following exclusion of undetectable mRNAs and lncRNAs (a read count value
Identification of optimal diagnostic lncRNA biomarkers for OSCC
Modeling and machine learning algorithm were used to identify optimal diagnostic lncRNA biomarkers for OSCC. Firstly, feature selection procedures were performed: the LASSO algorithm analysis was conducted using the ‘glmnet’ package (
Hierarchical clustering analysis of top100 DEmRNAs (A) and all DElncRNAs (B) in OSCC. Row and column represented tissue samples and DEmRNAs/DElncRNAs, respectively.
OSCC patients characteristics (
To further investigate the optimal diagnostic DElncRNAs for HNSCC, boxplot analysis of the correlation between tumor grades and the expression of lncRNAs were performed. In addition, survival analysis was performed to evaluate the prognostic value of optimal lncRNAs.
Co-expression analysis of the optimal diagnostic lncRNAs and mRNAs
To predict the function of the optimal diagnostic lncRNAs, correlation analysis between lncRNAs and mRNAs was analyzed using Pearson’s correlation coefficient. The co-expression pairs were obtained with
Functional analysis of co-expressed mRNAs of the optimal diagnostic lncRNAs
To further predict the function of the optimal diagnostic lncRNAs, Gene Ontology (GO) and Kyoto Encyclopedia of Genes and Genomes analysis of co-expressed DEmRNAs of which were performed using GeneCoDis3 (
Results
Eligible data collection from TCGA database
In total, 331 cases of OSCC and 44 normal controls were collected from TCGA database, including the clinical data, expression profiles of mRNAs and lncRNAs. Characters of patients, including the OSCC grades and survival rate, were shown on Table 1.
Identification of lncRNA biomarkers for OSCC. (A) Importance value of each DElncRNA ranked according to the mean decrease accuracy. (B) Variance rate of classification performance when increasing numbers of the predictive DElncRNAs.
After DESeq2 analysis and filtering, 1114 (345 up- and 769 down-regulated) DEmRNAs and 156 (86 up- and 70 down-regulated) DElncRNAs were obtained between patients with OSCC and normal controls. Hierarchical clustering analysis of the top 100 DEmRNAs and all DElncRNAs was presented in Fig. 1A and B, respectively.
Identification of the optimal diagnostic lncRNAs
A total of 30 diagnostic DElncRNAs were selected following the data dimensions decreasing and ranked according to Mean Decrease Accuary (Table 2, Fig. 2A). A 10-fold cross-validation result demonstrated that the accuracy reached the maximum when the number of lncRNAs was 15 (Fig. 2B). Therefore, the top15 DElncRNAs were selected for the optimal diagnostic lncRNAs. Hierarchical clustering analysis of the 15 lncRNAs was presented in Fig. 3.
Differentially expressed lncRNAs between OSCC and normal tissues following reduced dimensions of the data
Differentially expressed lncRNAs between OSCC and normal tissues following reduced dimensions of the data
Hierarchical clustering analysis of the optimal 15 lncRNAs. Row and column represented tissue samples and lncRNAs, respectively.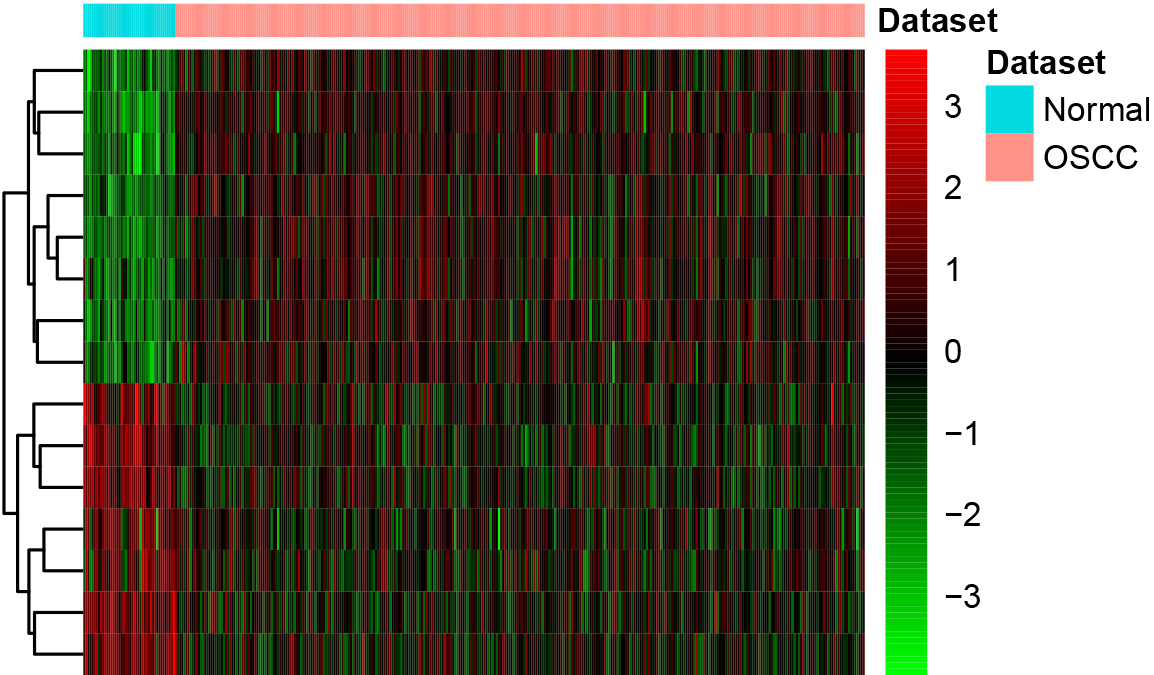
ROC curves of the classification models. The models were based on random forest (A), decision tree model (B) and support vector machine model (C). The value of AUC indicated the performance of the model. ROC, receiver operating characteristic; AUC, area under the curve.
Then, 15 optimal diagnostic lncRNAs were then used to establish the classification models by random Forest package, SVM and decision tree. High AUC value indicated the 15 lncRNAs were correlated to OSCC. The AUC of the random forests model was 0.996 and the specificity and sensitivity of this model were 95.5% and 99.7%, respectively (Fig. 4A). The AUC of the decision tree model was 0.835 and the specificity and sensitivity of this model were 72.7% and 96.4%, respectively (Fig. 4B). The AUC of the SVM model was 0.994, and the specificity and sensitivity of this model were 95.5% and 97.9% (Fig. 4C).
Correlation between 15 biomarkers and clinical data. (A) Box-plot displayed the expression levels of (I) FOXD2.AS1, (II) RP11.159F24.6, (III) RP11.863P13.3, (IV) CTA.384D8.35, (V) RNF144A.AS1, (VI) ST3GAL4.AS1, (VII) RP11.760H22.2, (VIII) RP11.339B21.10, (IX) RP11.426C22.4, (X) CTC.297N7.9, (XI) RP11.10L7.1, (XII) LA16c.380A1.1, (XIII) ADAMTS9.AS1, (XIV) RP11.7K24.3, and (XV) CTC.490G23.2 in normal tissues and OSCC tissues of various tumor grades. 
Continued. (B) Survival curves of (I) FOXD2.AS1, (II) RP11.159F24.6, (III) RP11.863P13.3, (IV) CTA.384D8.35, (V) RNF144A.AS1, (VI) ST3GAL4.AS1, (VII) RP11.760H22.2, (VIII) RP11.339B21.10, (IX) RP11.426C22.4, (X) CTC.297N7.9, (XI) RP11.10L7.1, (XII) LA16c.380A1.1, (XIII) ADAMTS9.AS1, (XIV) RP11.7K24.3, and (XV) CTC.490G23.2. Row and column represented time and survival rate, respectively. Low level and high level were based on the median of gene expression.
DElncRNA-DEmRNA co-expression network. The ellipses and rhombuses represent the DEmRNAs and DElncRNAs, respectively. Red and green colors represent up- and downregulation, respectively. The top10 up/down-regulated DElncRNA/DEmRNA were with yellow border.
Significant enrichment GO terms and KEGG pathways of DEmRNAs co-expressed with DElncRNAs in OSCC. (A) Biological process. (B) Molecular function. (C) Cellular component. (D) KEGG pathways. GO, Gene Ontology; KEGG, Kyoto Encyclopedia of Genes and Genomes; BP, biological process; FDR, false discovery rate; MF, molecular function; CC, cellular component.
Correlation between the 15 lncRNAs and clinical data was analyzed, and the results were shown on the Box-plot (Fig. 5A) and survival curve (Fig. 5B). The Box-plot illustrated that the expression level of the 15 lncRNAs in normal controls were significant lower than which in OSCC, regardless the grades of OSCC. The survival analysis illustrated that the expression level of FOXD2.AS1 was significant association with the survival rate (
Identification and functional analysis of co-expressed mRNAs of the optimal diagnostic lncRNAs
A total of 662 DEmRNAs co-expressed with the 15 DElncRNAs were obtained, resulting in 1333 co-expression pairs and the interacted network was represented in Fig. 6. The top three DElncRNAs that covered the most DEmRNAs were RP11.760H22.2 (degree
In addition, the 662 DEmRNAs were annotated by GO and KEGG analysis (Fig. 7). GO analysis showed that most DEmRNAs significantly enriched into the “signal transduction (FDR
Discussion
Machine learning and survival analysis indicated that FOXD2.AS1 could be a prognostic indicator for OSCC. FOXD2.AS1 was a lncRNA which had been made progress only in recent years [27]. Previous studies have shown that FOXD2.AS1 exhibited higher expression in various malignancies, including gastric [28], lung [29], bladder [30], colorectal [31], nasopharyngeal [32], esophageal [33], hepatocellular [34], thyroid [35] and skin cancer [36]. Multiple researches demonstrated that FOXD2.AS1 could active Wnt/
Regarding the functional annotation of co-expressed DEmRNAs of the 15 lncRNAs, “Focal adhesion” pathways and “ECM-receptor interaction” were found to be involved in various cancers. Studies in kidney cancer revealed that ECM-receptor interaction pathway correlated with cell migration and invasion and dysregulation of the focal adhesion pathway could also enhance the cell migration and invasion [47, 48].
Conclusion
In conclusion, we identified 15 diagnostic lncRNAs, verified the correlation of FOXD2.AS1 and survival rate, and revealed pathways of “Focal adhesion” and “ECM-receptor interaction” might be involved in OSCC.
Footnotes
Acknowledgments
This work was funded by Key Research and Development Projects of Sichuan Science and Technology Department (2018FZ0113), China Stomatological Association Western Medicine Stomatology Clinical Research Fund Project (CSA-W2016-01), Sichuan Science and Technology Support Program (2014SZ0038) and the National Natural Science Foundation of China (81600819).
Conflict of interest
The author declared there was no conflict of interest.