
Abstract
BACKGROUND:
Cholangiocarcinoma (CCA) is the most common biliary malignancy worldwide. However, the molecular mechanisms of its tumorigenesis and progression are still largely unclear.
OBJECTIVE:
This study aimed to explore the hub genes and pathways associated with CCA prognosis by coexpression analysis.
METHODS:
A coexpression network complex was constructed using the top 20% most variant genes in the GSE89748 dataset to find modules associated with prognosis related clinical trait-histology. The hub genes in the clinically significant modules were defined as candidates if they were common in both the coexpression network and protein-protein interaction (PPI) network. Afterwards, survival analysis, expression level analysis and a series of bioinformatic analysis were used to validate the hub genes.
RESULTS:
Twenty-five modules were obtained, and the cyan, light cyan and red modules regarded as closely associated with histology were selected. Subsequently, combining the PPI network complexes and coexpression networks, we screened 20 candidates. After expression and survival analysis, 10 real hub genes (LIMA1, HDAC1, ITGA3, ACTR3, GSK3B, ITGA2, THOC2, PTGES3, HEATR1 and ILF2) were finally identified. Additionally, functional enrichment analysis revealed that the hub genes were mainly enriched in cell cycle-related pathways.
CONCLUSIONS:
Overall, this study identified 10 hub genes and cell cycle-related pathways were closely related to CCA development, progression and prognosis, which may contribute to CCA diagnosis and treatment.
Keywords
Flow chart of data collection, processing, analysis and validation.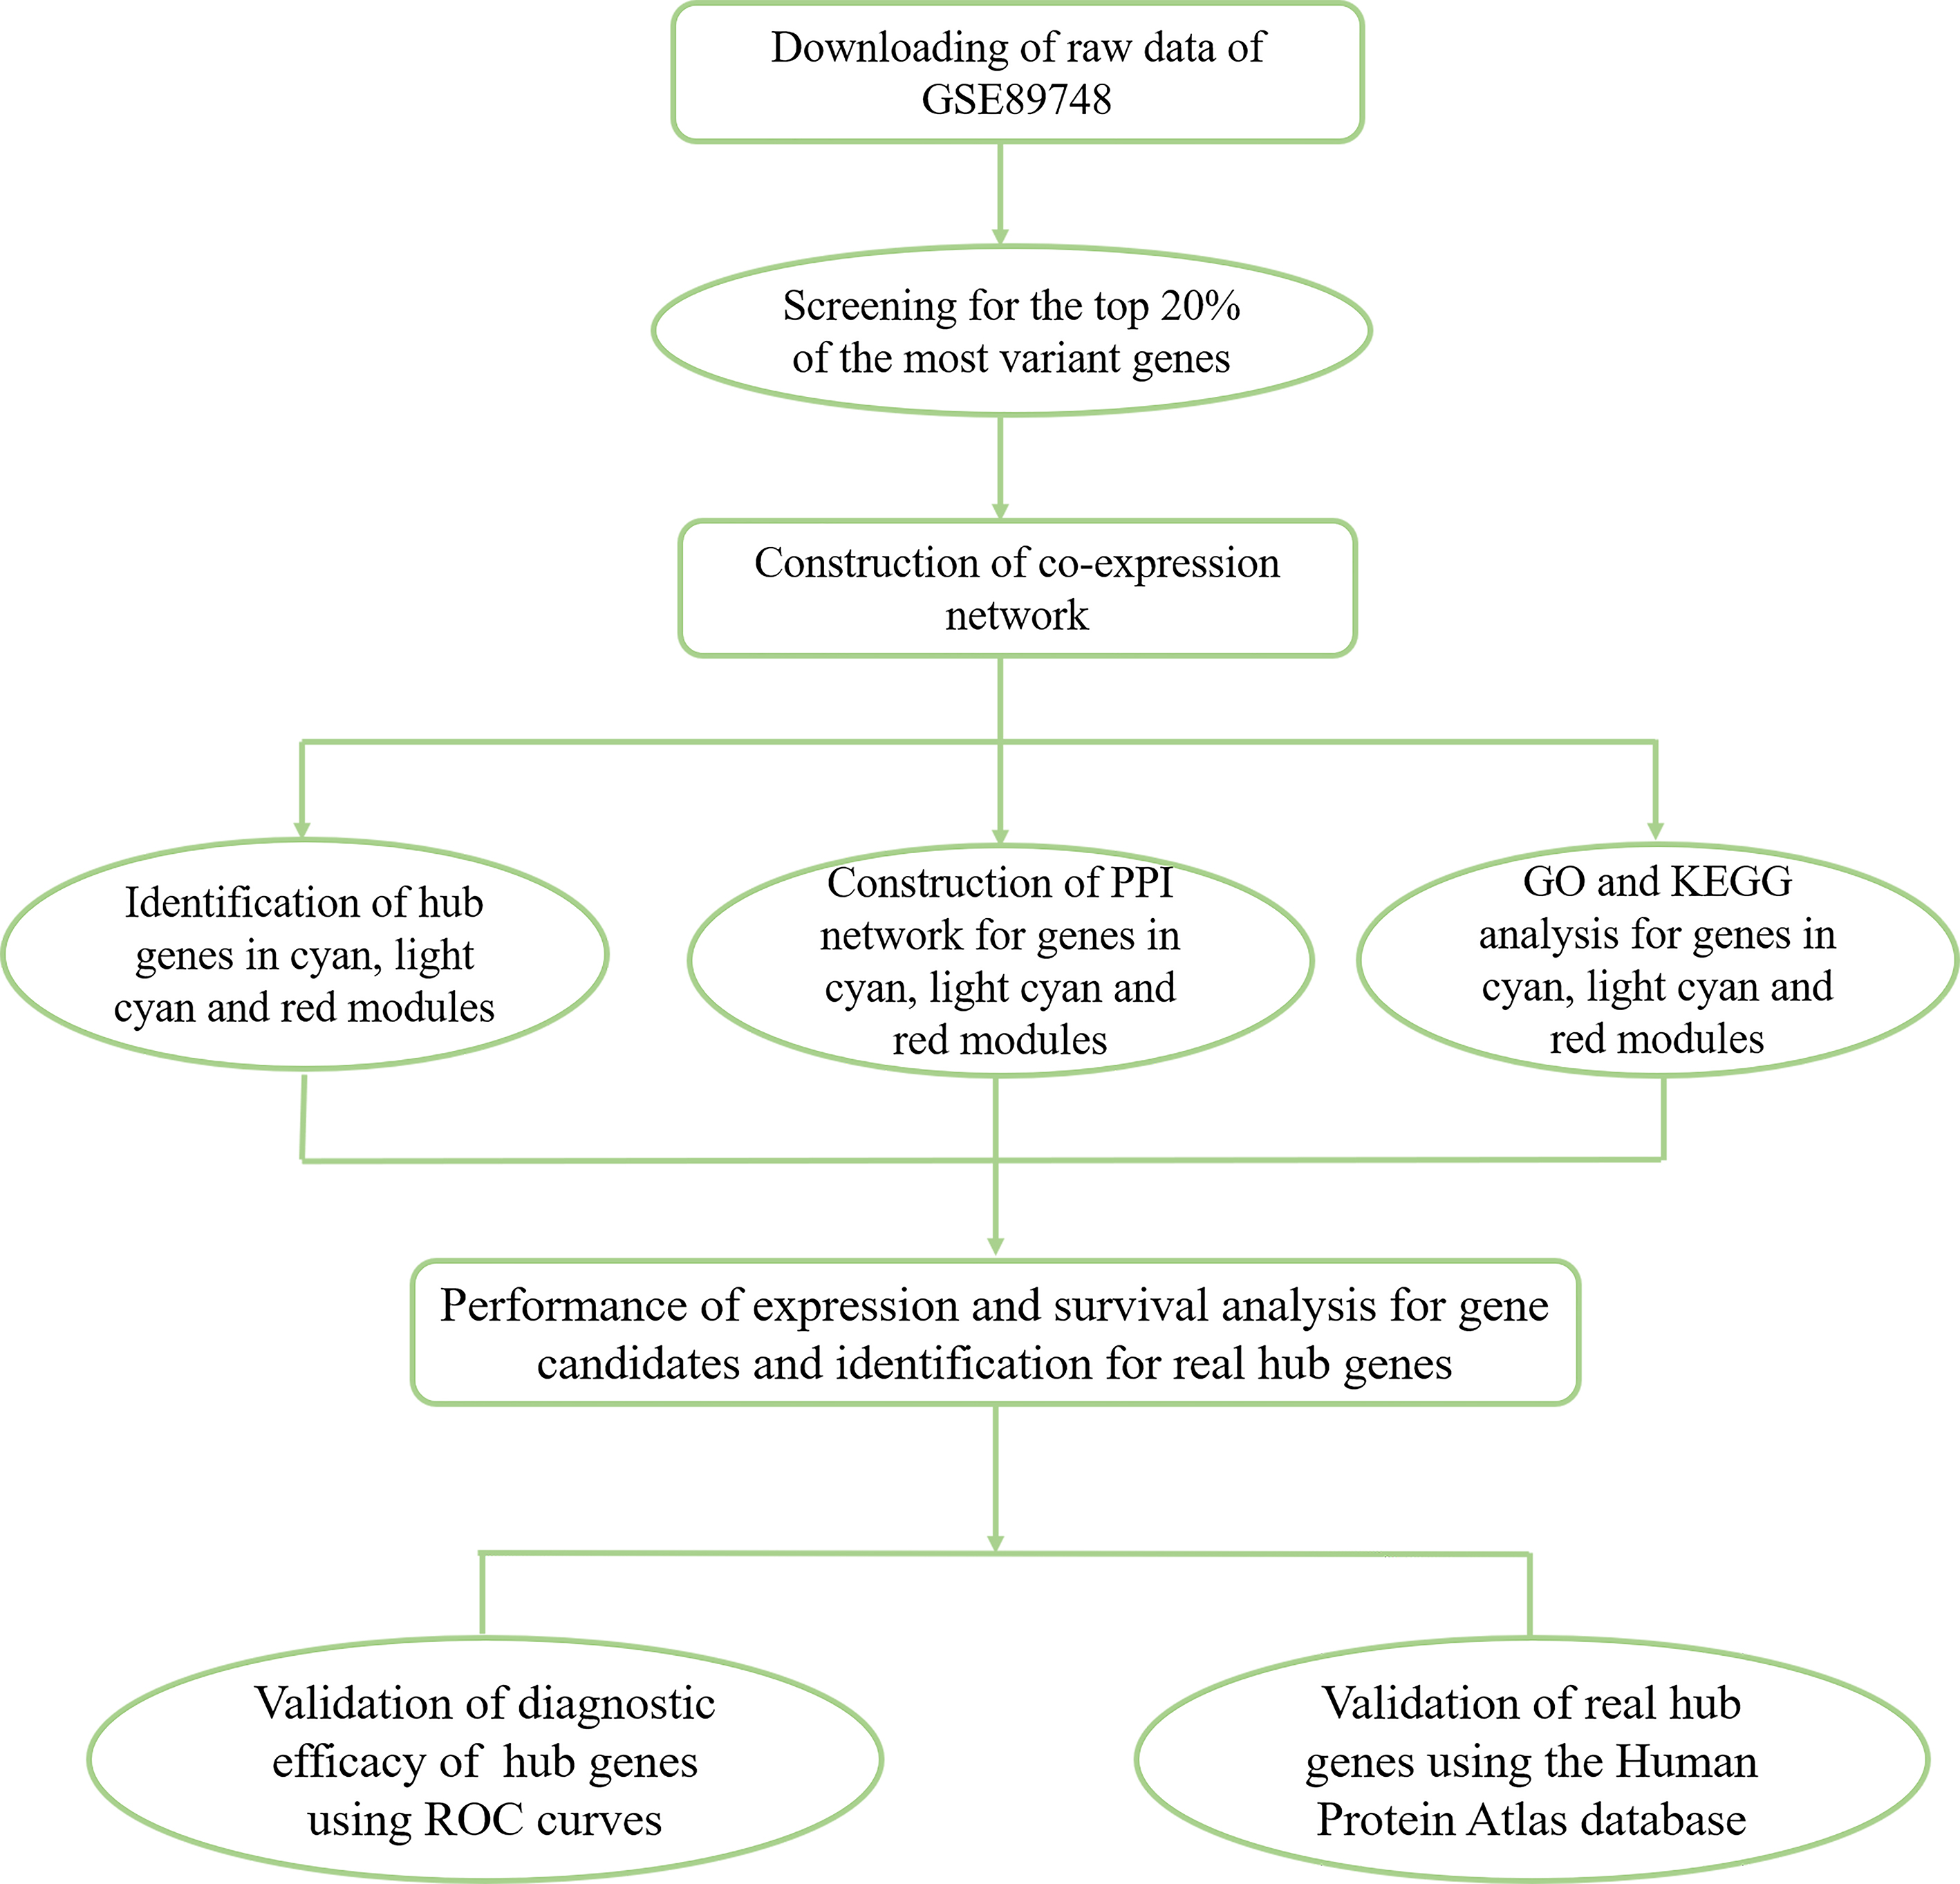
Cholangiocarcinoma (CCA) is the most common biliary tract malignancy and the second most prevalent primary hepatic malignancy after hepatocellular carcinoma (HCC) [1]. CCA combined with HCC was reported to be the third leading cause of cancer-related deaths in China in 2015 [2]. Moreover, despite having a lower CCA incidence rate, the age-adjusted incidence rates of CCA have increased in the United States and Western Europe during the last several decades [3]. At present, the commonly used treatment approaches for CCA include surgical resection, chemotherapy, molecularly targeted therapies and liver transplantation [4, 5]. However, the 5-year overall survival rate of CCA is still dismal, especially in advanced CCA [6]. In addition, the current serum biomarkers used for CCA diagnosis are not sensitive or accurate, and there is a lack of knowledge about CCA development, progression and prognosis [7, 8, 9]. Consequently, a better understanding of the molecular mechanisms of CCA tumorigenesis and progression is critical and may provide new insight into CCA therapy.
Clustering dendrogram of 55 samples with proper clinical data. The clustering was based on the top 20% genes in expression in GSE89748. The colour intensity was proportional to sex, age, histology, status and survival days. 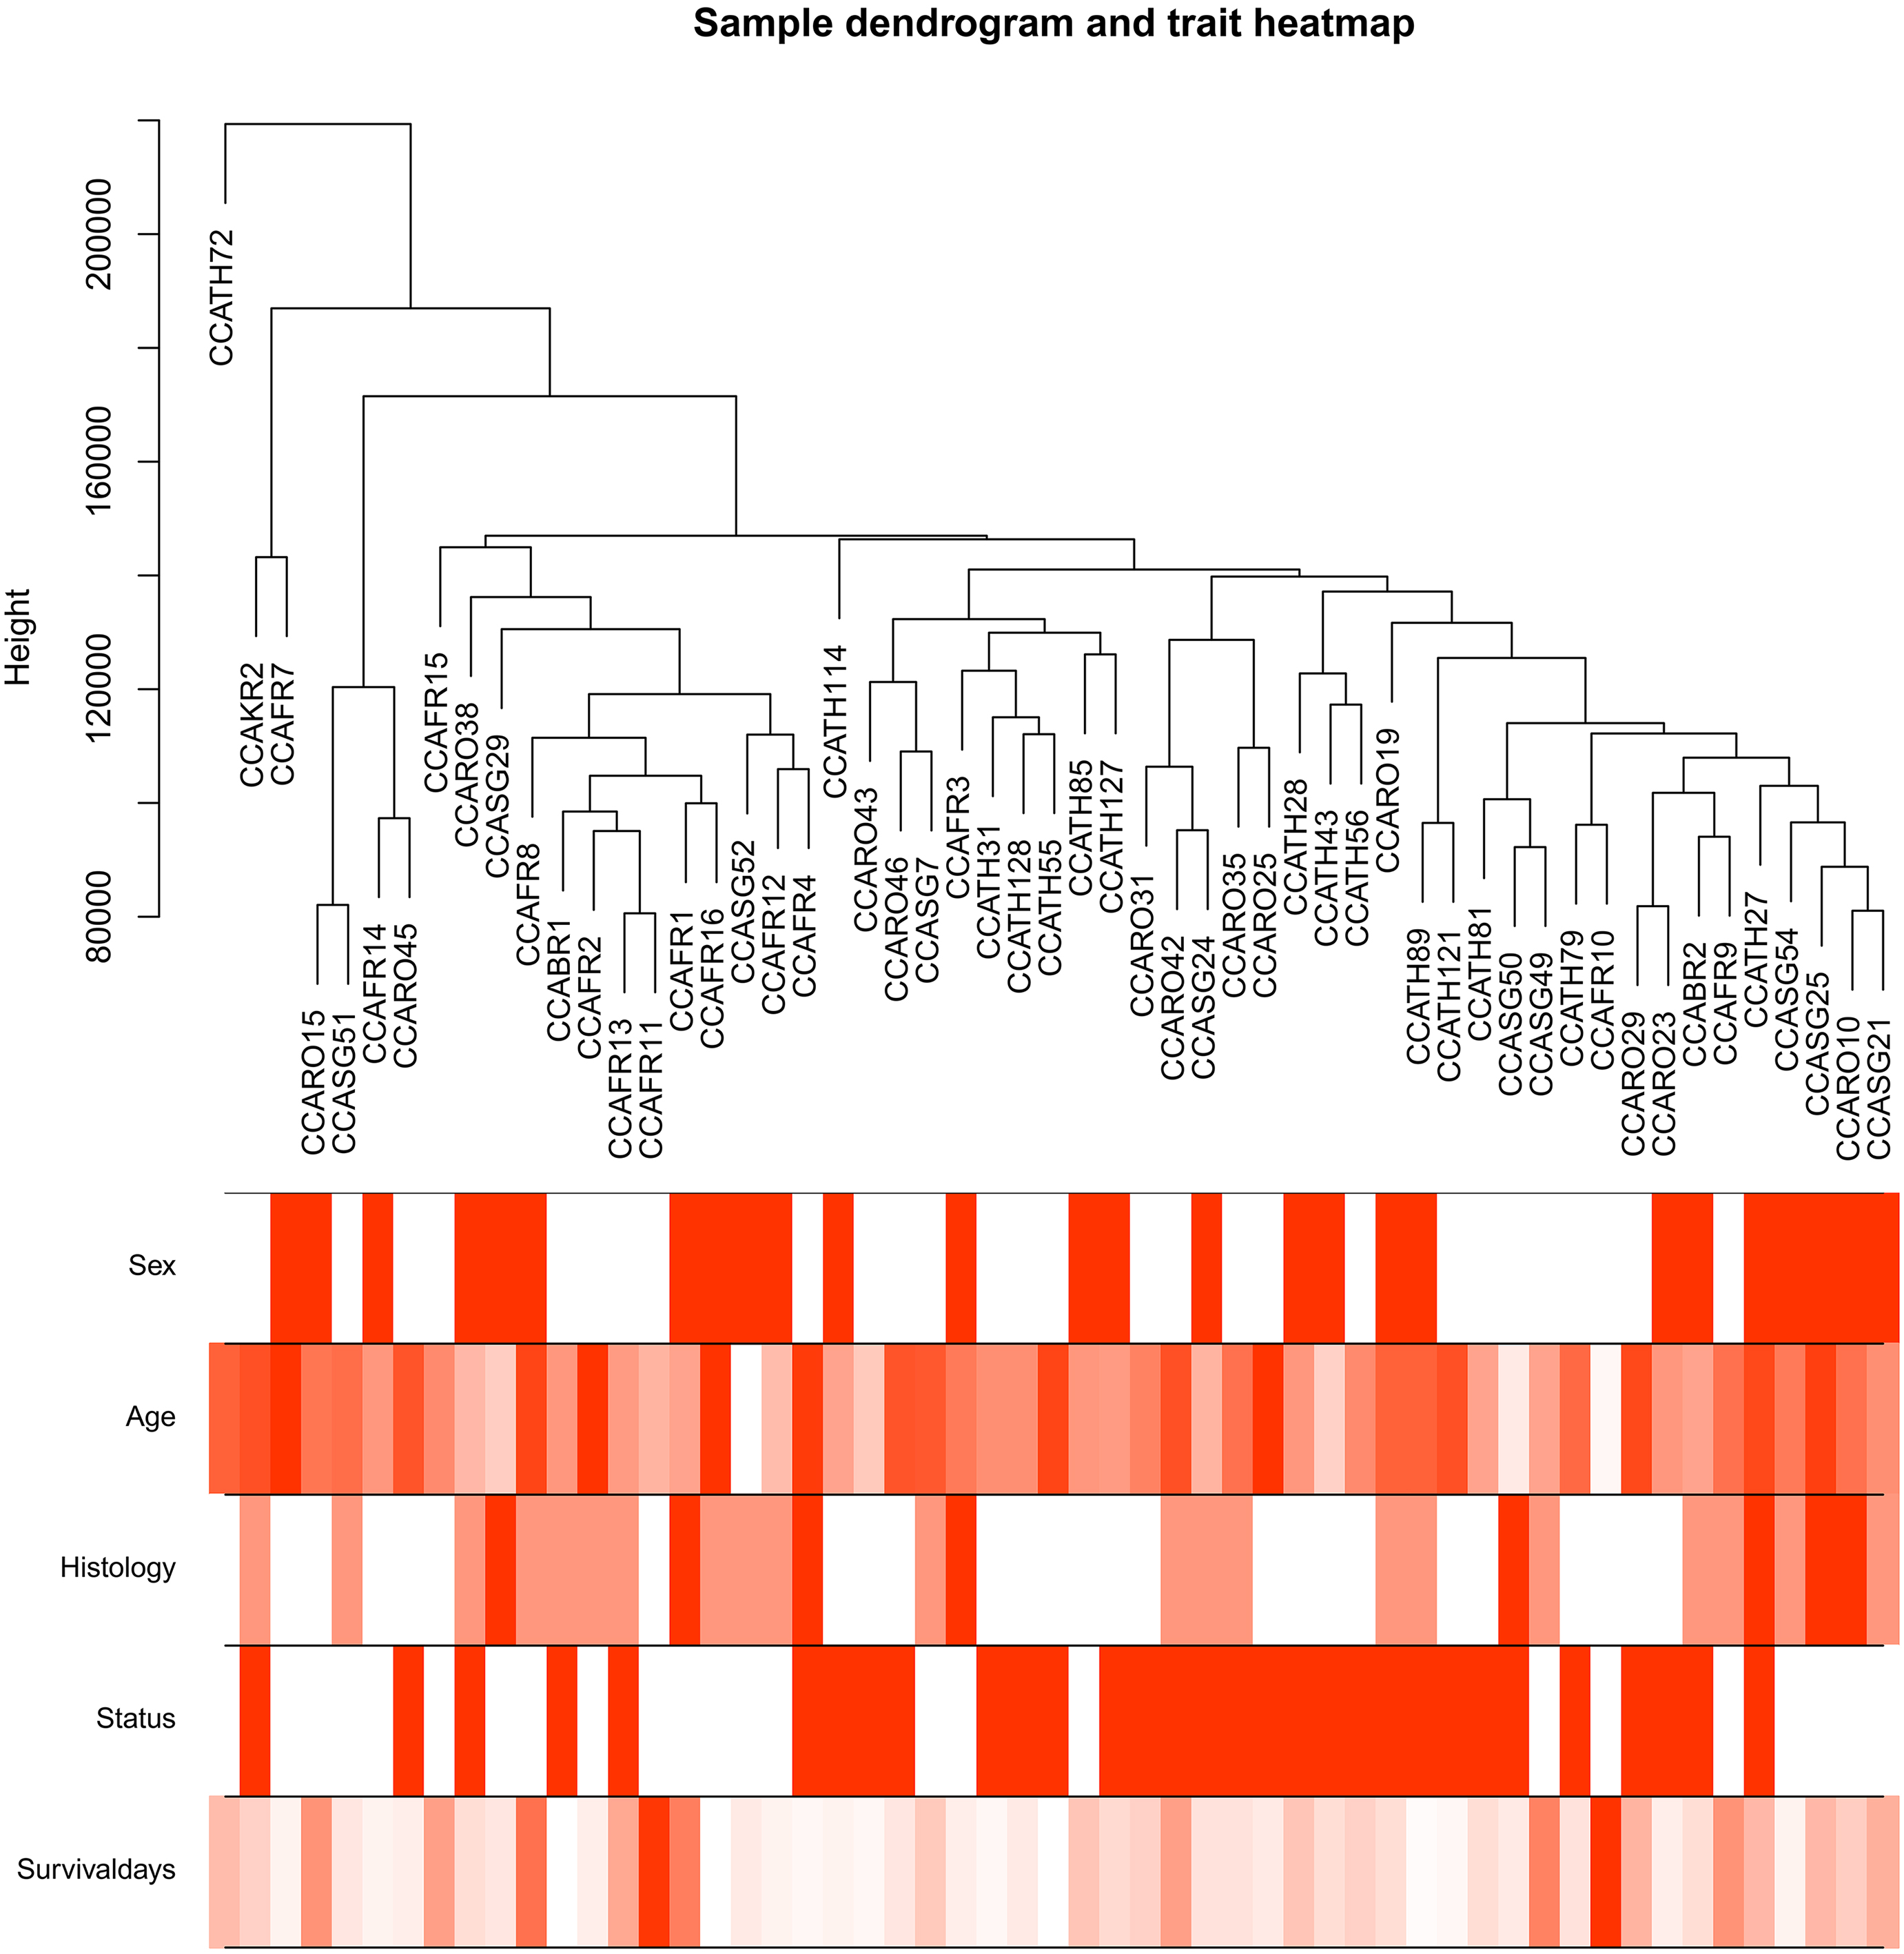
Determination of soft-thresholding power in the WGCNA. (A) Analysis of the scale-free fit index for various soft-thresholding powers (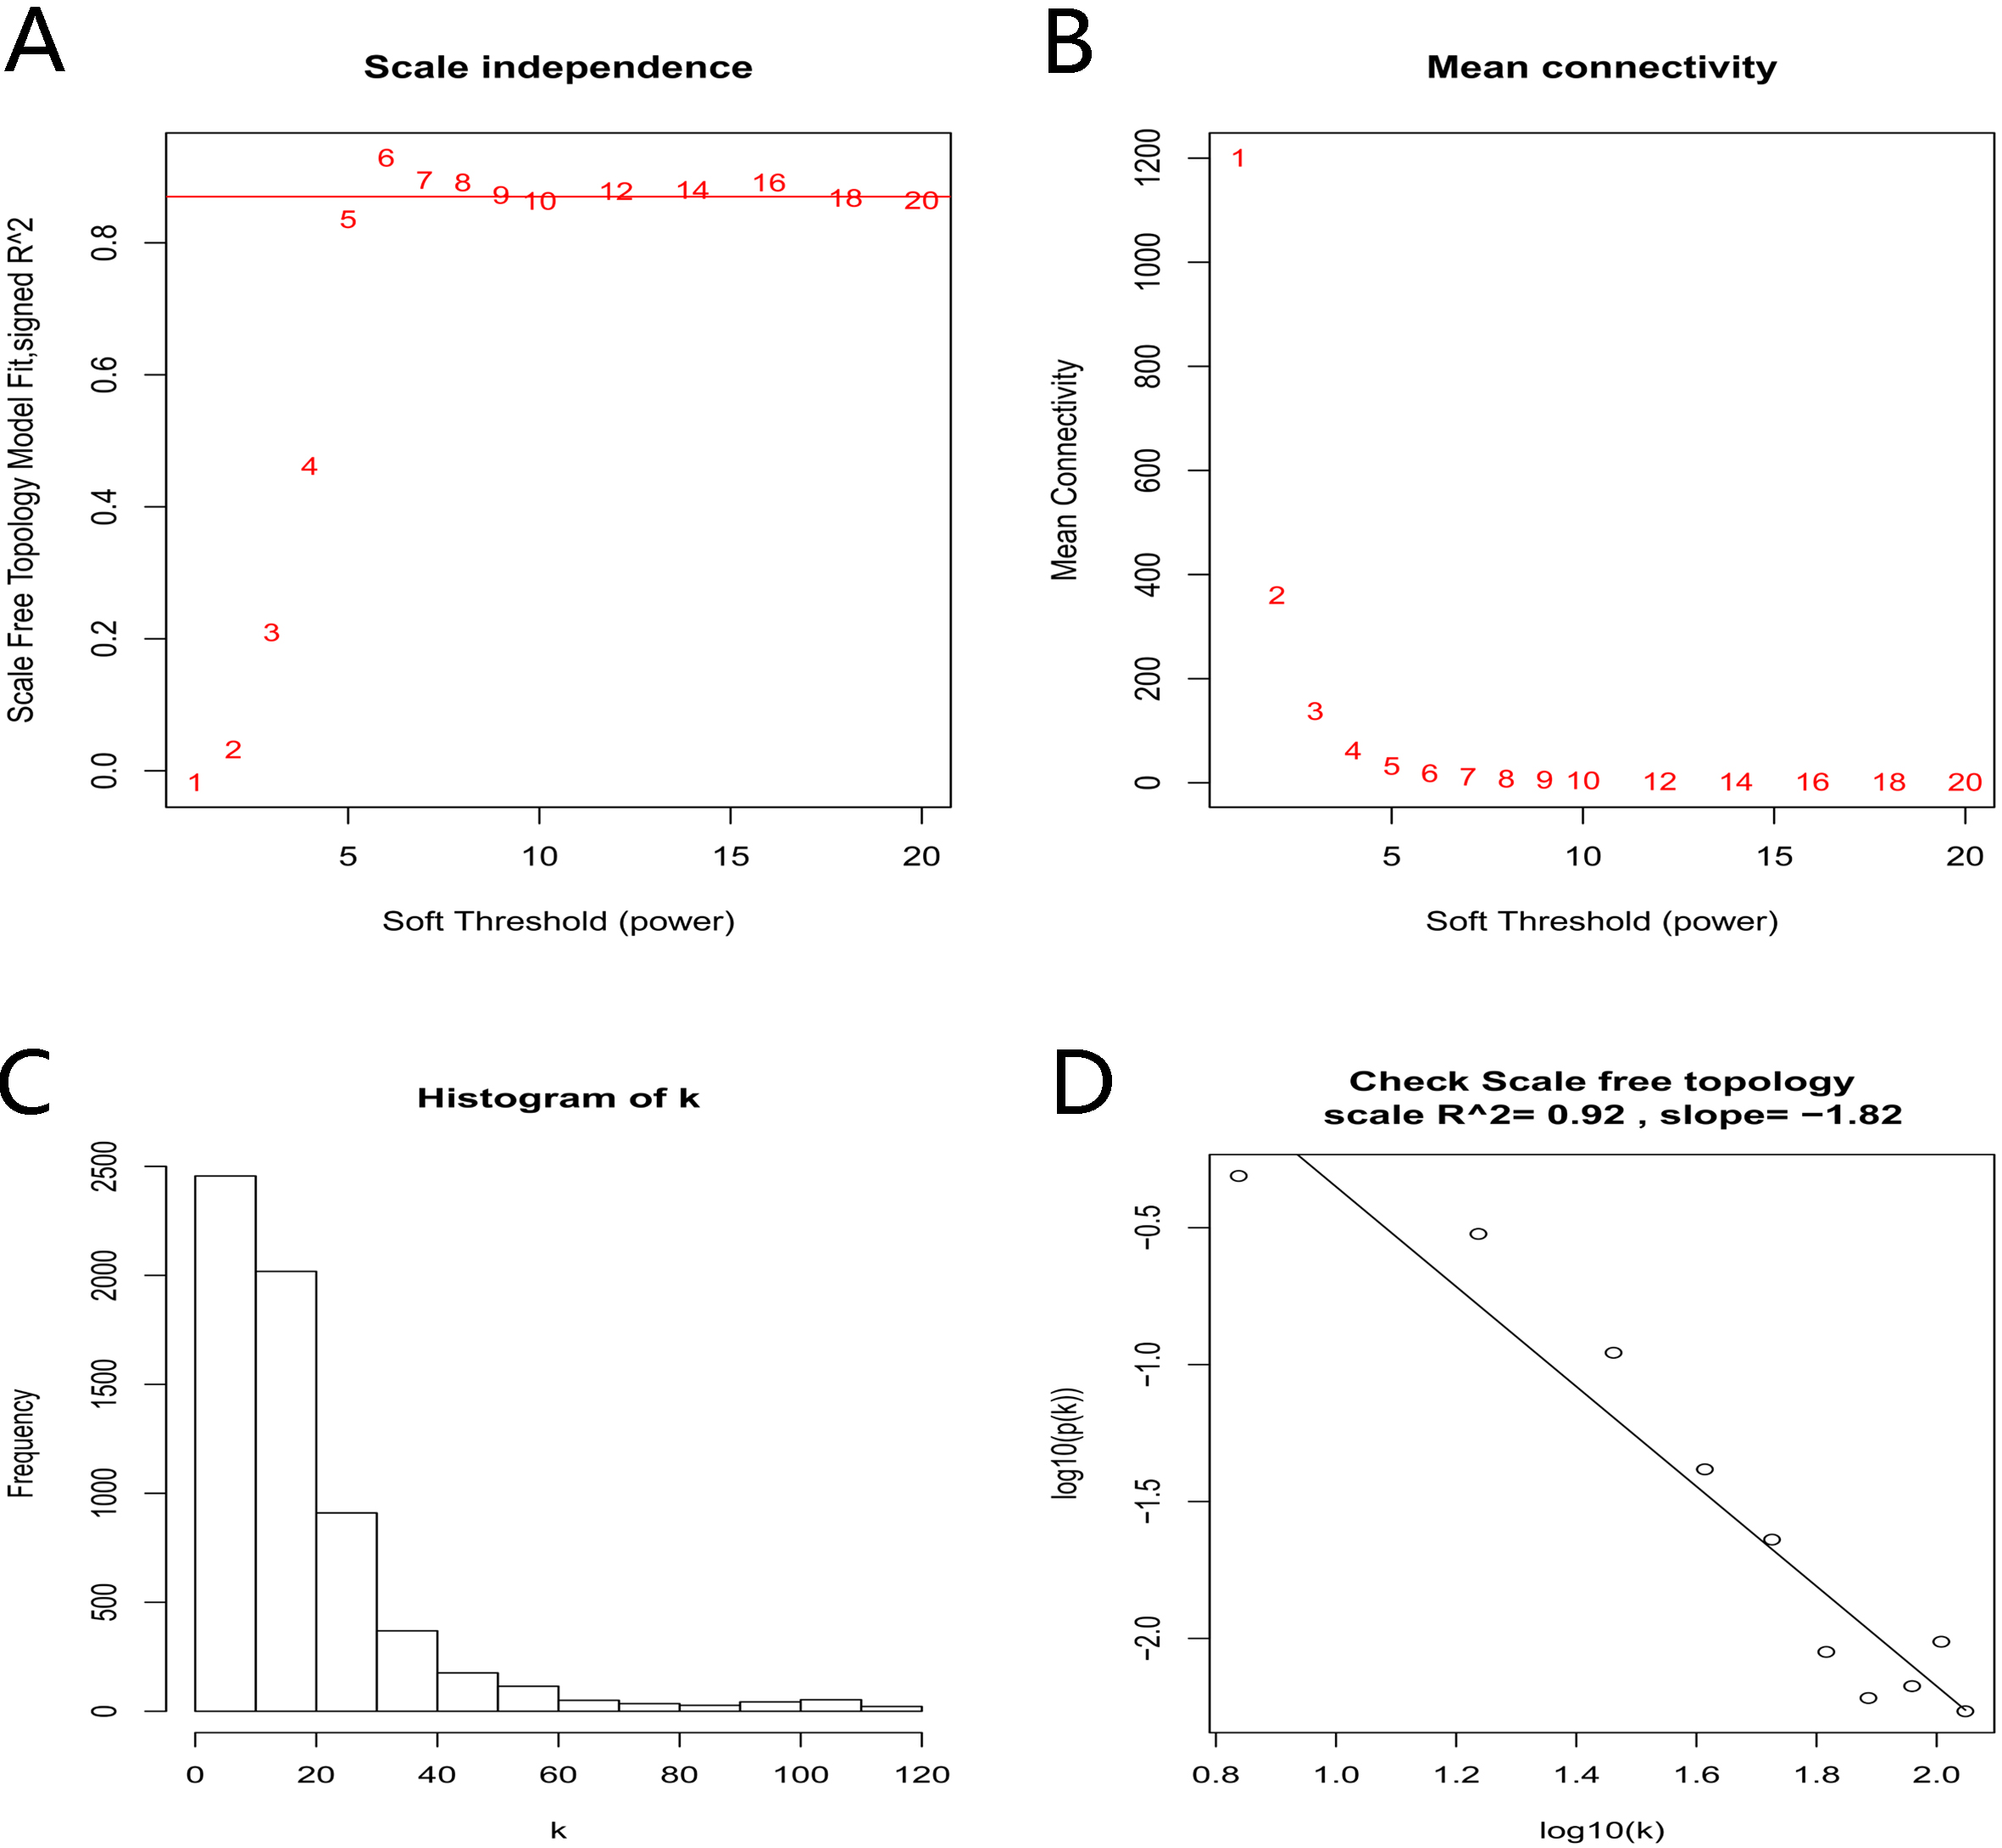
In recent years, gene expression analysis based on high-throughput platforms has been widely used for detecting significant expression changes in thousands of genes and identifying promising biomarkers for the diagnosis and therapy of cancers [10]. Some studies have found many differentially expressed genes (DEGs) that play critical roles in CCA development, progression and prognosis and could be regarded as potential diagnostic and therapeutic targets. Betesh et al. [11] identified fucosylated Fetuin-A as an effective serum marker in the surveillance of people at risk of developing of CCA. Through multiplexed mutational profiling, Zhu et al. [12] demonstrated that KRAS and IDH1 were the most common mutations noted in intrahepatic cholangiocarcinoma (ICC) and were associated with the clinicopathological features of ICC. Weighted gene coexpression network analysis (WGCNA) is a powerful tool that can be used in data exploration or to find modules containing highly correlated genes. It has been widely used for finding hub genes in many malignancies. For instance, Tang et al. [13] used WGCNA and identified five core genes, the dysregulation of which was closely associated with the progression and prognosis of breast cancer. In this study, to further understand the molecular mechanisms of CCA development, progression and prognosis, we used WGCNA to explore modules related to clinical characteristics.
Dataset collection and processing
The workflow of this study is shown in Fig. 1. The CCA-associated dataset GSE89748 submitted by Jusakul Apinya and generated on the GPL10558 platform (Illumina HumanHT-12 V4.0 Expression BeadChip) was downloaded from the Gene Expression Omnibus (GEO) database (
Identification of modules associated with the clinical features of cholangiocarcinoma. (A) Dendrogram of all the top 20% genes in expression clustered based on a dissimilarity measure (1-TOM). (B) Heatmap of the correlation between module eigengenes and clinical features of cholangiocarcinoma, the red modules represent positive correlation between the clinical traits and genes in modules, and the green modules represent negative correlation. (C) Distribution of average gene significance and errors in the modules related to histology of cholangiocarcinoma.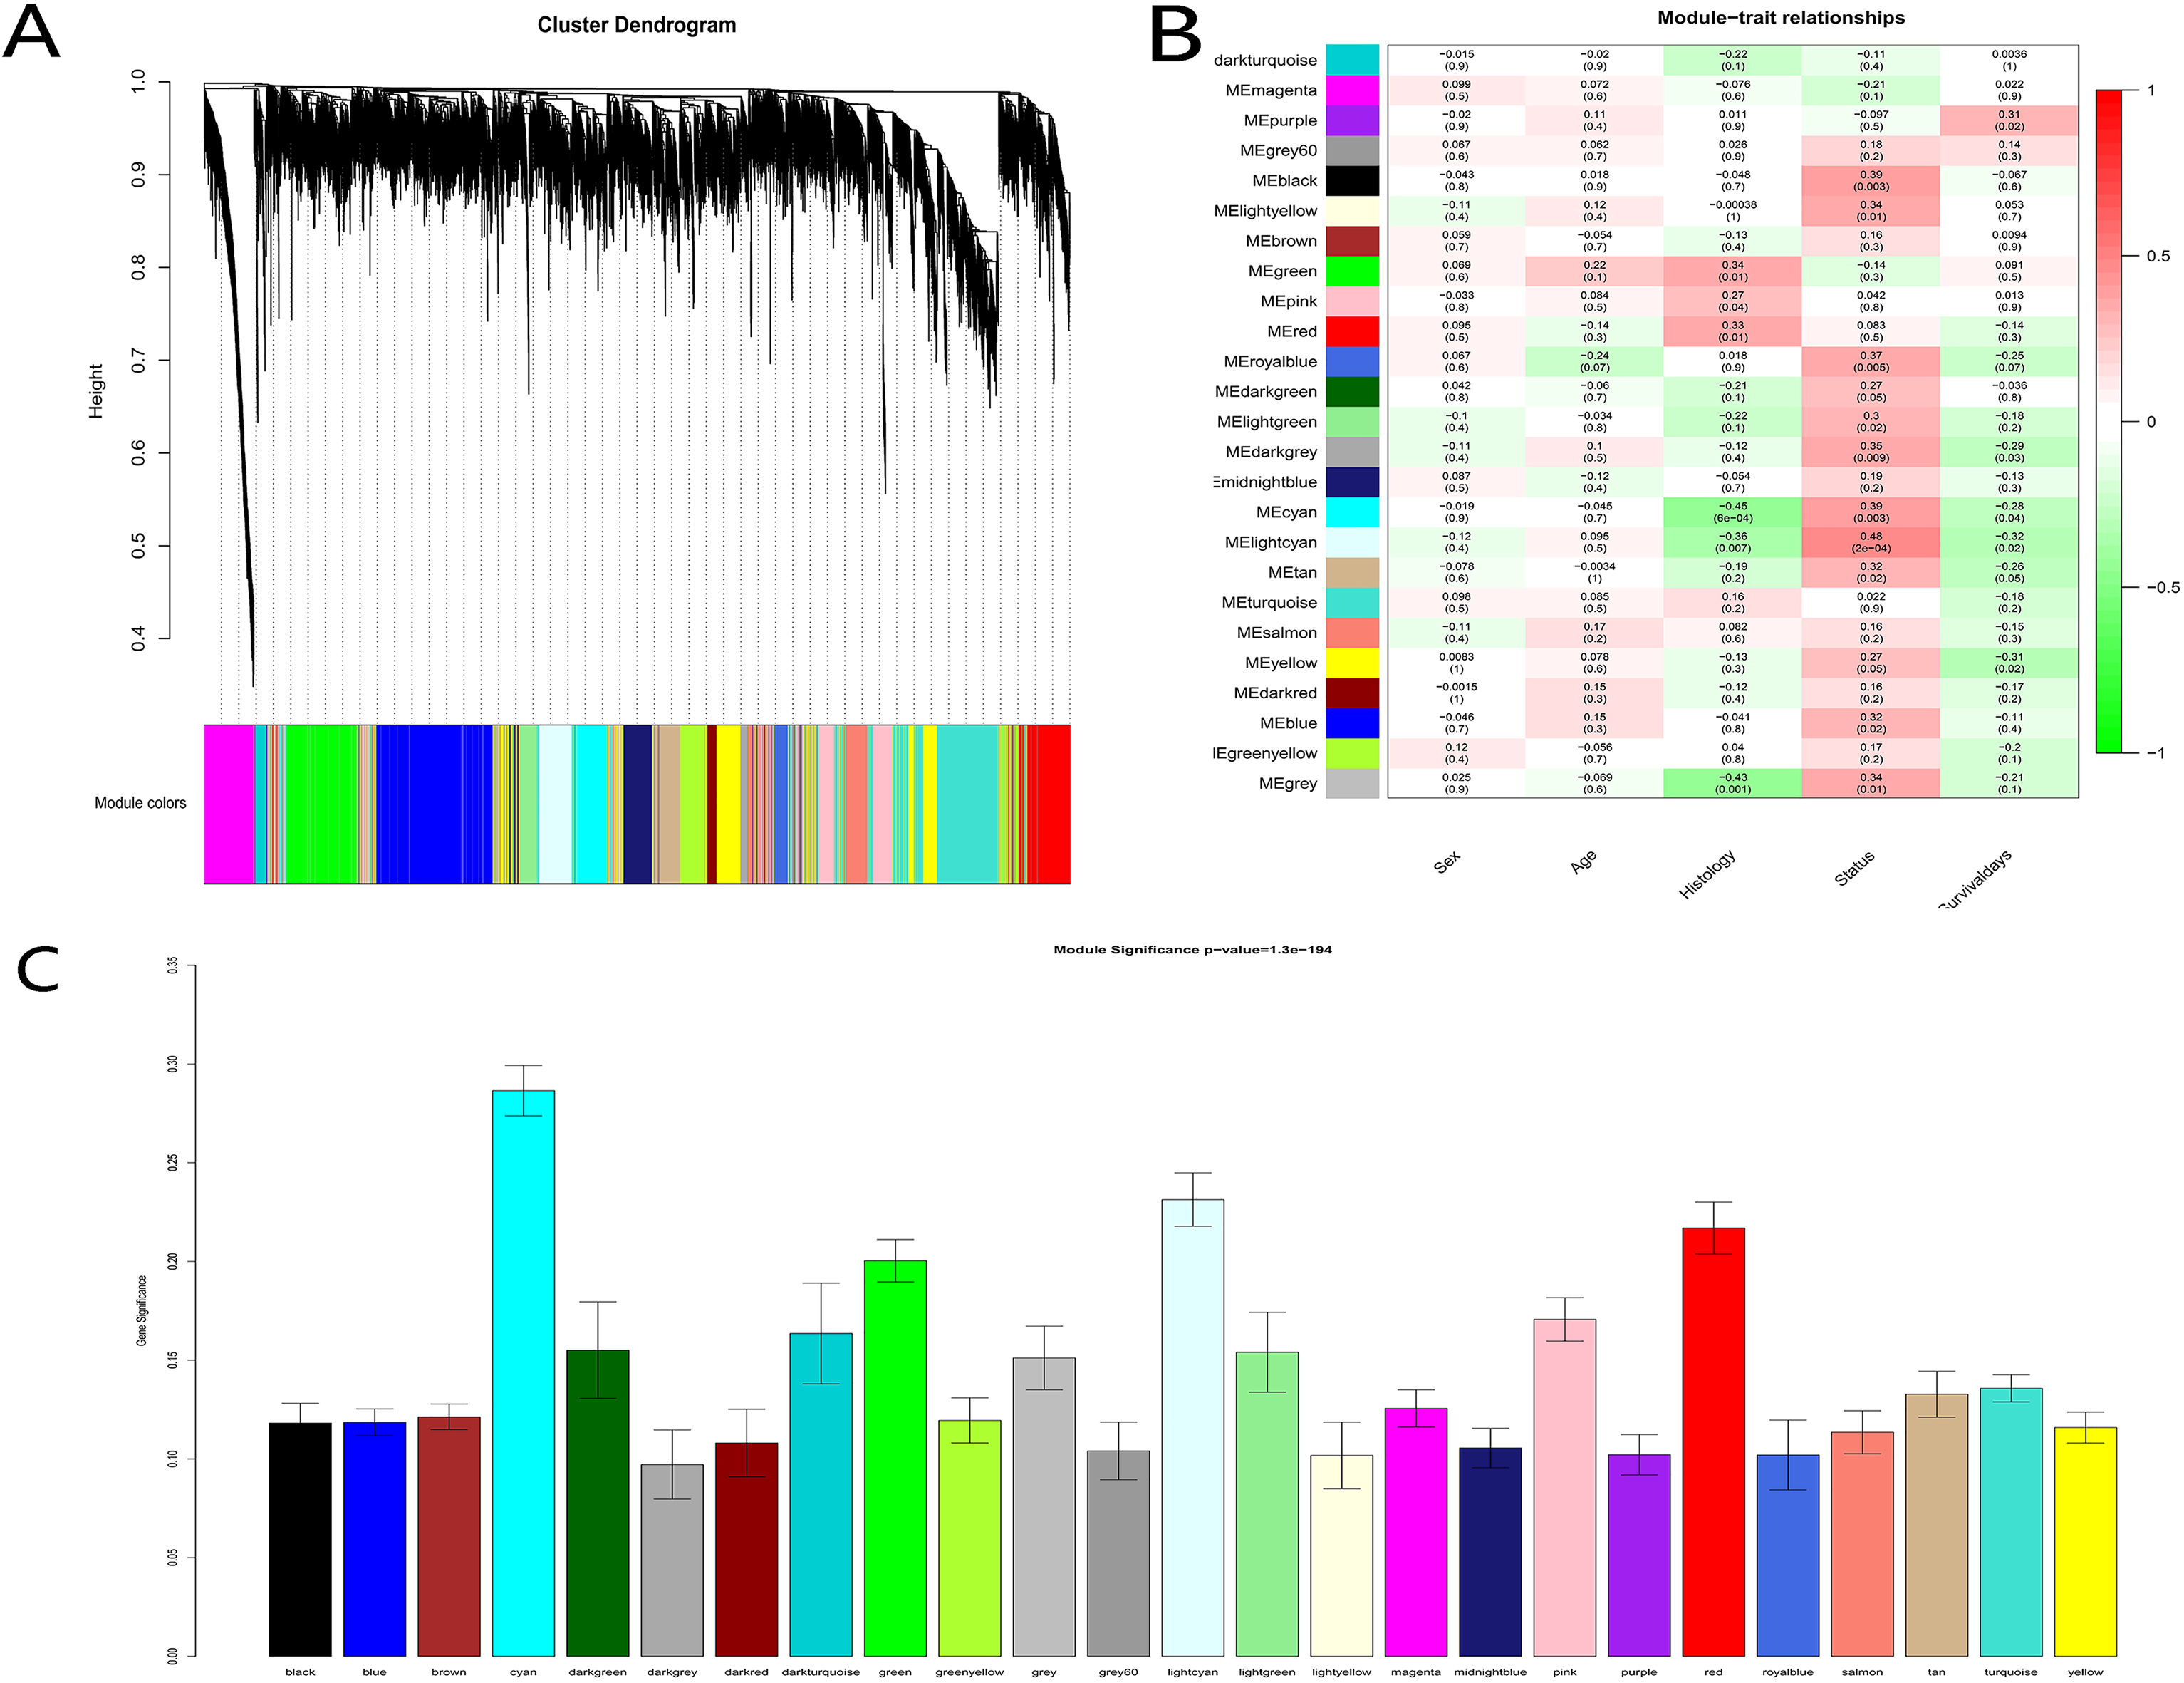
The methods used to construct coexpression networks and to identify clinically relevant modules have been described in previous studies [13, 15, 16]. The “WGCNA” package for the statistical software R (version 3.5.1,
Modules related to clinical characteristics were identified using two approaches. First, in the principal component analysis of each gene module, module eigengenes (MEs) were defined as the first principal component of the module. All genes in a module were represented by the expression of the MEs in that module. Next, we identified the most relevant module by calculating the correlation between the MEs and clinical traits. Second, in the linear regression between clinical traits and gene expression, the gene significance (GS) was the log10 transformation of the P-value of each gene (GS
GO and KEGG pathway enrichment analysis
The molecular and functional characteristics of the genes in the hub modules were analysed using the R package “ggplot2” [21] (version 3.5.1) and the online biological tool The Database for Annotation, Visualization and Integrated Discovery (DAVID) 6.8 (available online:
Gene ontology and Signaling pathway enrichment analysis. GO analysis of cyan (A), light cyan (B) and red (C) module genes. KEGG pathway enrichment analysis of cyan (D), light cyan (E) and red (F) module genes. The X-axis shows the rich factors of each term and the Y-axis shows the description of the GO and KEGG pathway terms. 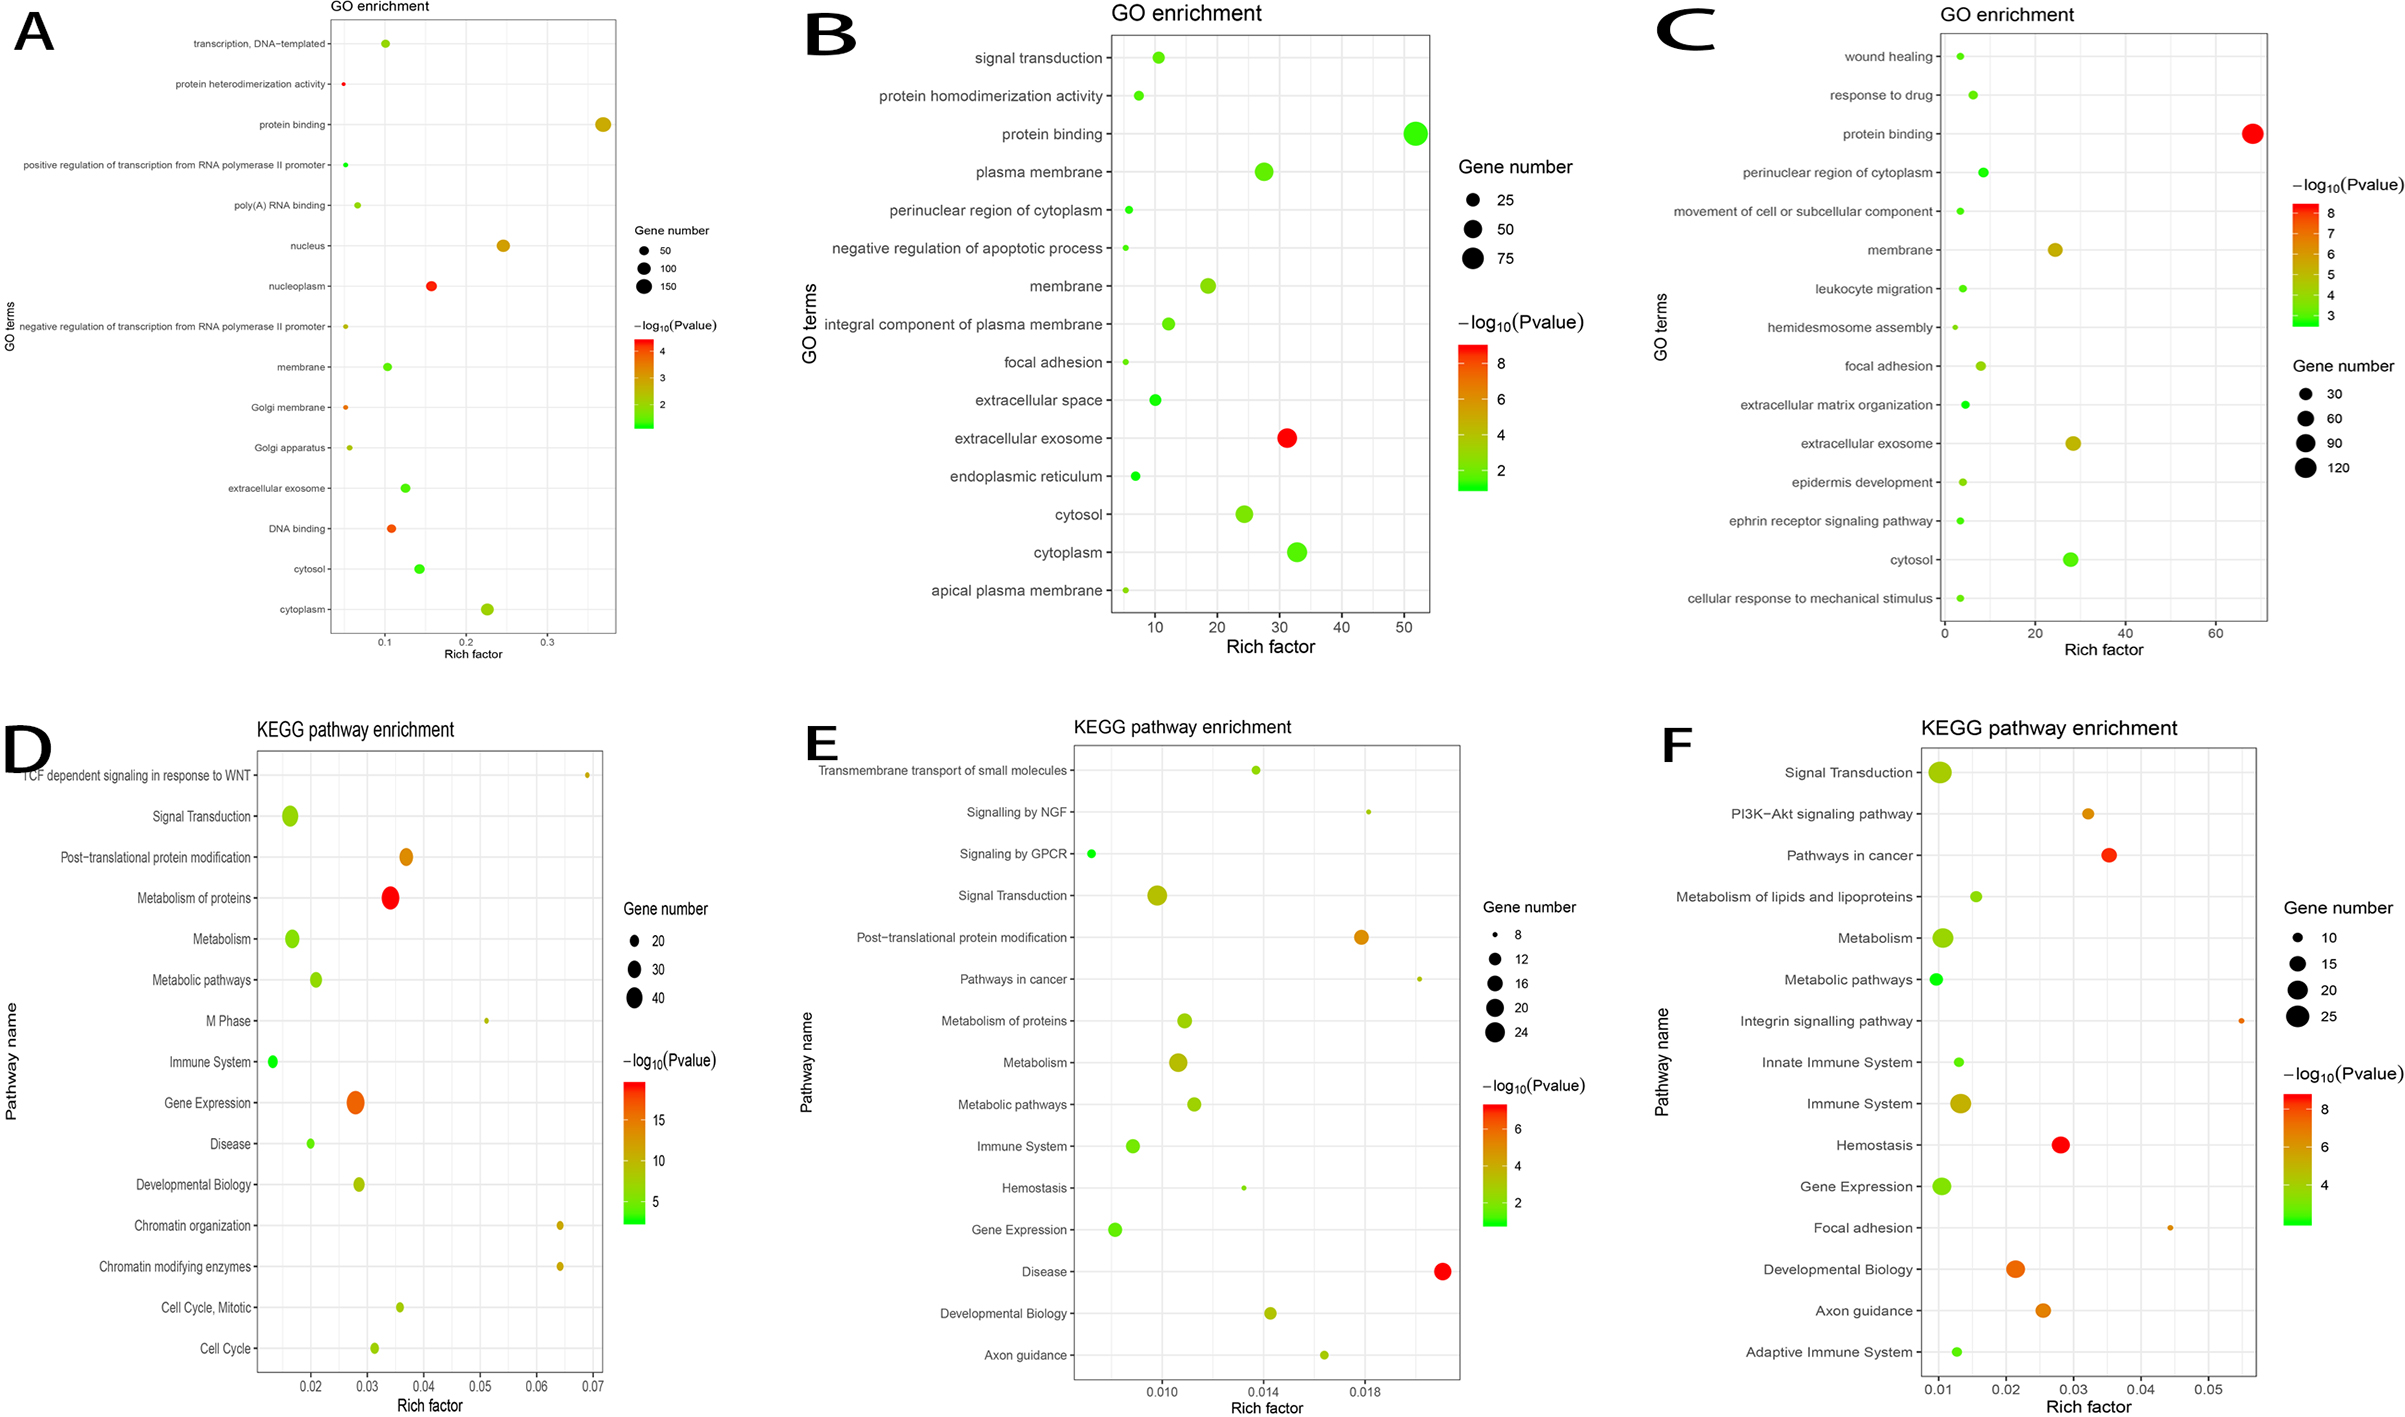
After the identification of the top three modules closely related to histology, hub genes were selected from each module using the following criteria: 1) genes with high within-module connectivity were considered hub genes; consequently, module membership
Identification of the hub genes. PPI network complexes of genes in cyan (A), light cyan (B) and red (C) modules. Scatter plot of module eigengenes in cyan (D), light cyan (E) and red (F) modules. Identification of hub gene candidates in cyan (G), light cyan (H) and red (I) modules.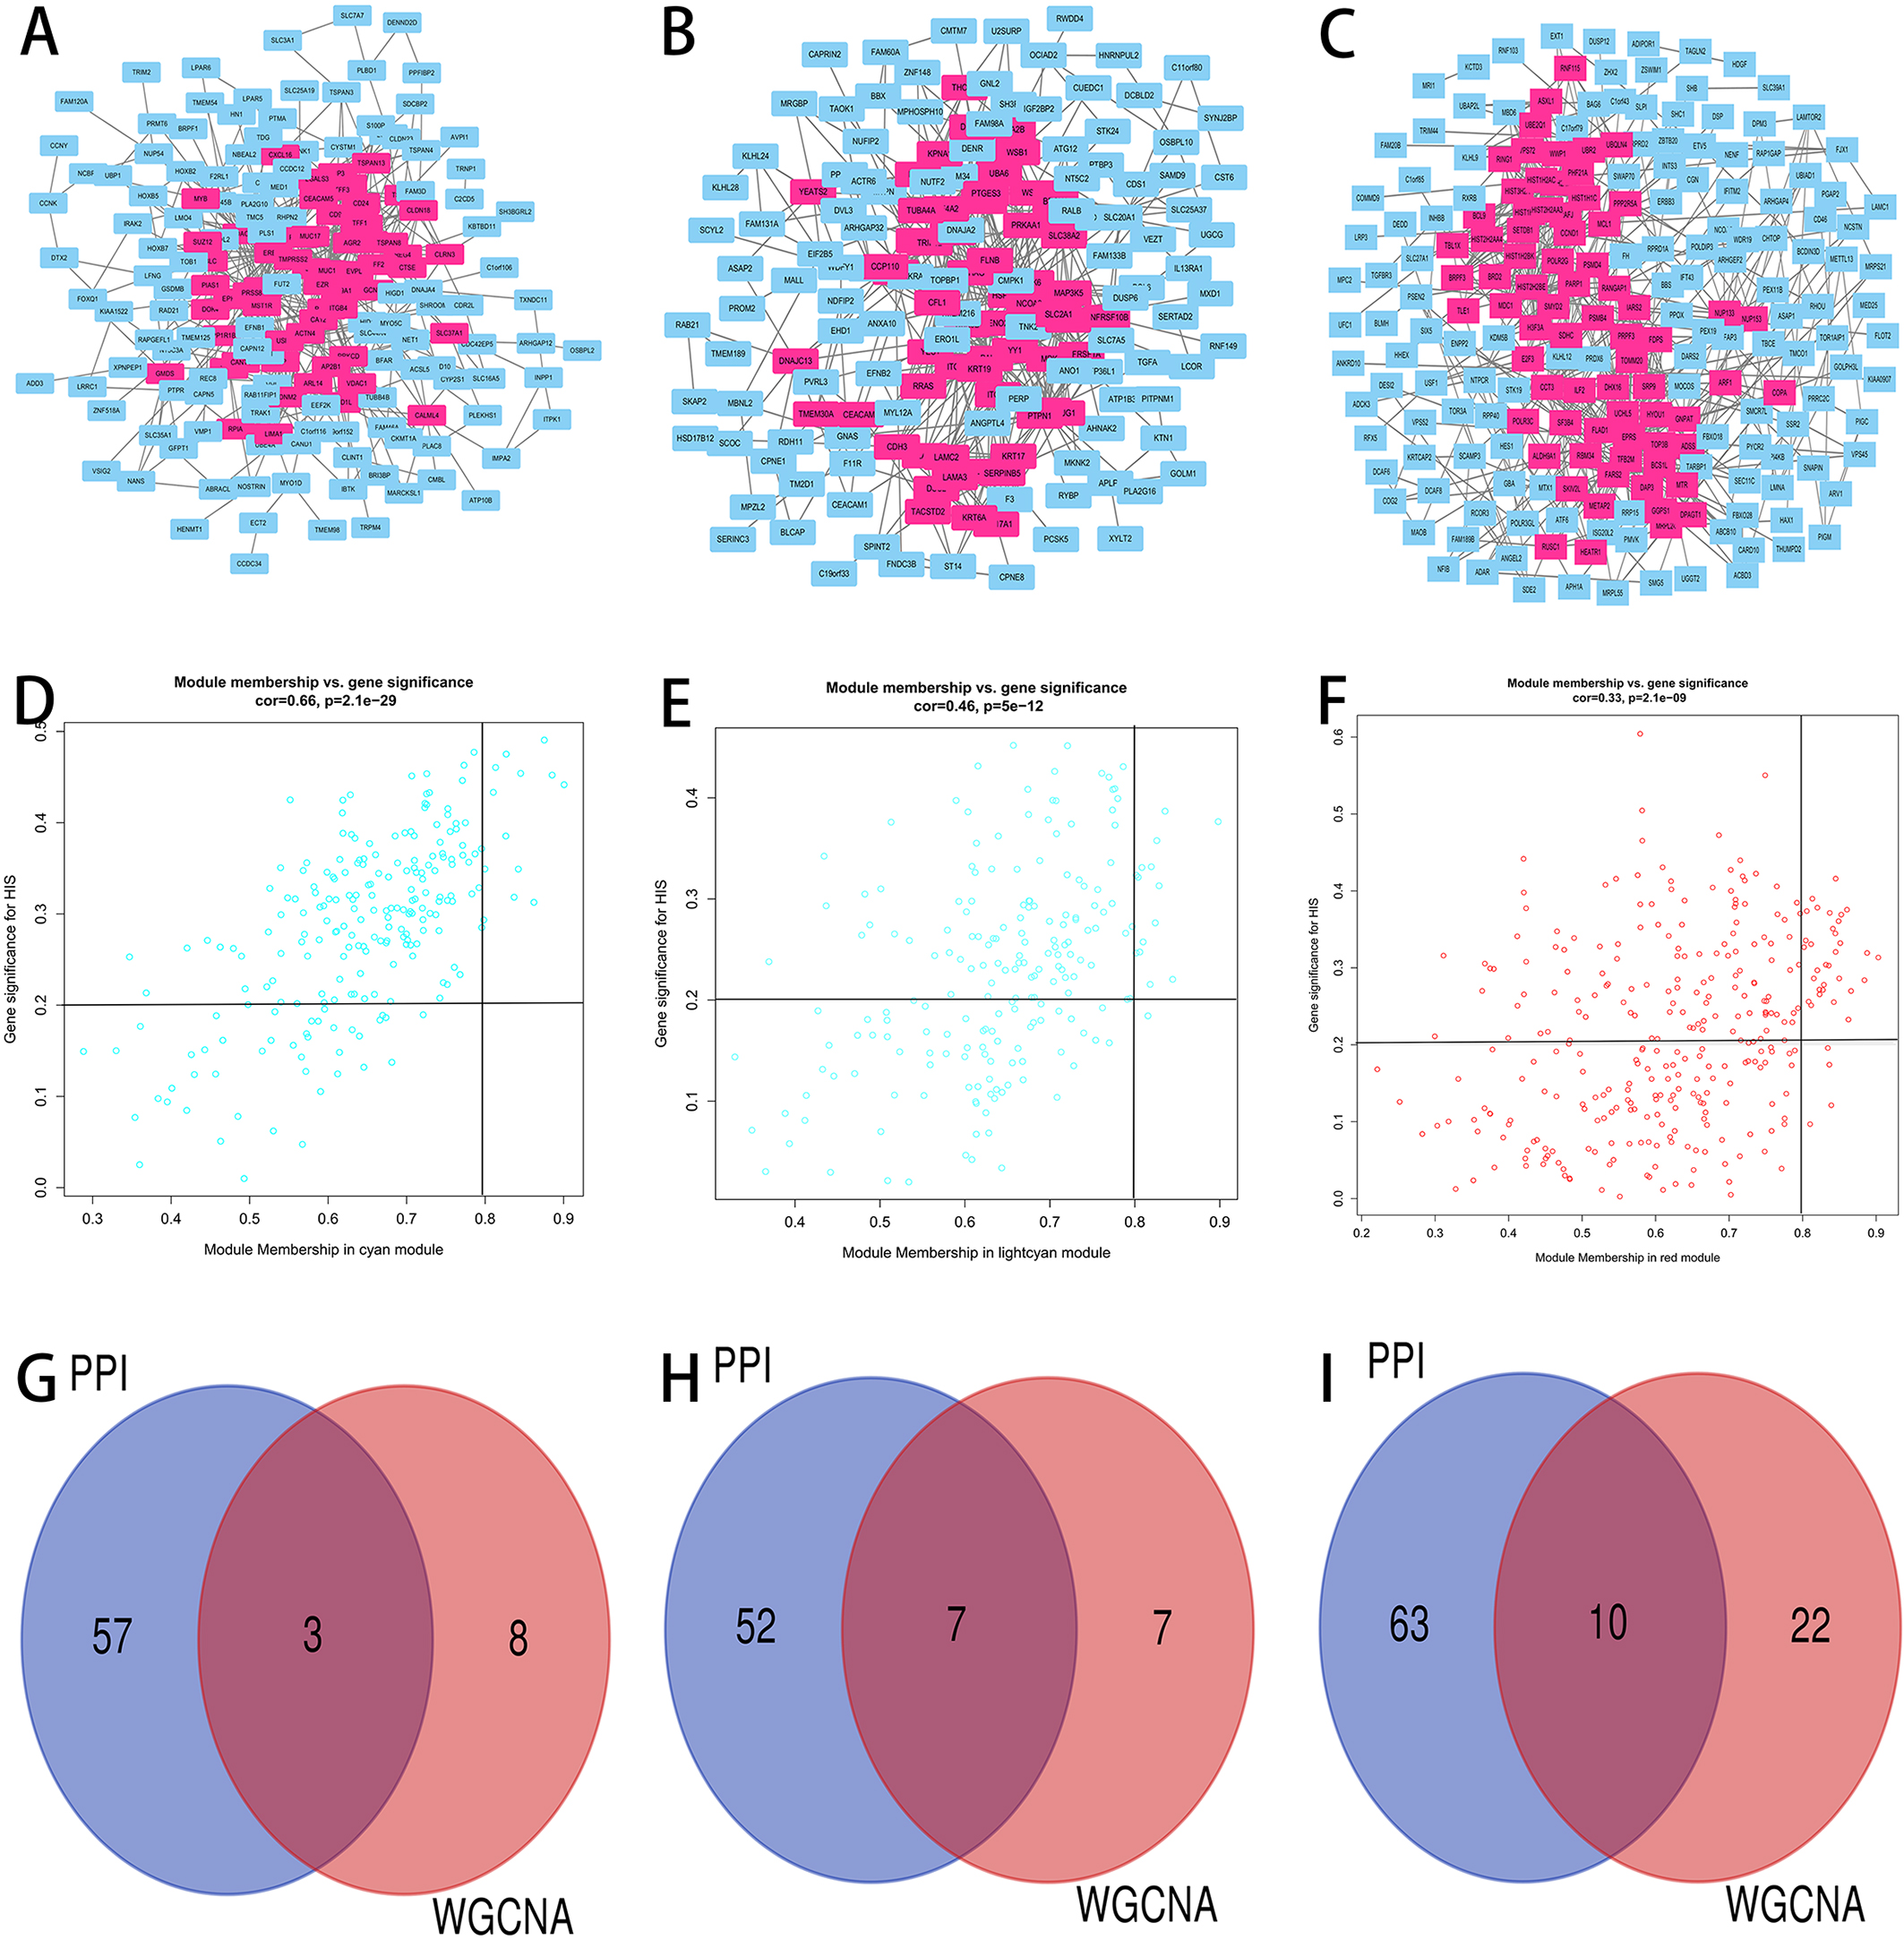
To validate the relationships between the identified hub genes and CCA prognosis, survival analysis was performed. X-tile was employed to find the optimal cut-off value. The expression level, status and survival days were imported into the software, and the optimal points were calculated by the system. Afterwards, the R package “survival” [23] was used to perform Kaplan-Meier analysis [24]. To validate the expression and diagnostic efficacy of the hub genes in external datasets, CCA RNA sequencing data were downloaded from The Cancer Genome Atlas (TCGA) database (available online:
Results
Genes processing
The gene expression profile dataset GSE 89748, containing 72 CCA samples, was downloaded from the NCBI GEO database. A total of 31371 genes were obtained, and 6274 (the top 20% most variant genes) of them were used for WGCNA.
Construction of the weighted gene coexpression network and identification of key modules
After screening, 55 samples with qualified histological results were selected for coexpression construction (Fig. 2). The average linkage hierarchical clustering identified 25 modules, and the cyan, light cyan and red modules were the top three modules closely related to histology. Consequently, these three modules were regarded as the modules connected with CCA prognosis and were selected for further analysis (Fig. 4).
Gene Ontology (GO) and KEGG analysis of the hub genes in the hub modules
According to the results of GO analysis, the genes in the cyan module were mainly enriched in protein binding, nucleus, cytoplasm, nucleoplasm and cytosol. In the light cyan module, the genes were mainly enriched in protein binding, cytoplasm, cytosol, extracellular exosome and plasma membrane. In the red module, the genes were significantly enriched in ;protein binding, cytosol, extracellular exosome, membrane and nuclear region of cytoplasm (Fig. 5A–C). In KEGG analysis, gene expression, signal transduction, metabolism of proteins, metabolism and post-translational protein modification were the top five pathways in which the genes in the cyan module were significantly enriched. In the light cyan module, the genes were mainly enriched in signal transduction, metabolism, disease, post-translational protein modification and metabolism of proteins. The genes in the red module were significantly enriched in signal transduction, metabolism, immune system, gene expression and development biology (Fig. 5D–F).
Identification of hub genes
Based on the criteria described above (
Survival analysis of real hub genes in the dataset GSE89748. (A) LIMA1, (B) HDAC1, (C) ITGA3, (D) ACTR3, (E) GSK3B, (F) ITGA2, (G) THOC2, (H) PTGES3, (I) HEATR1 and (J) ILF2. Red lines represent high expression of hub genes and green lines represent low expression.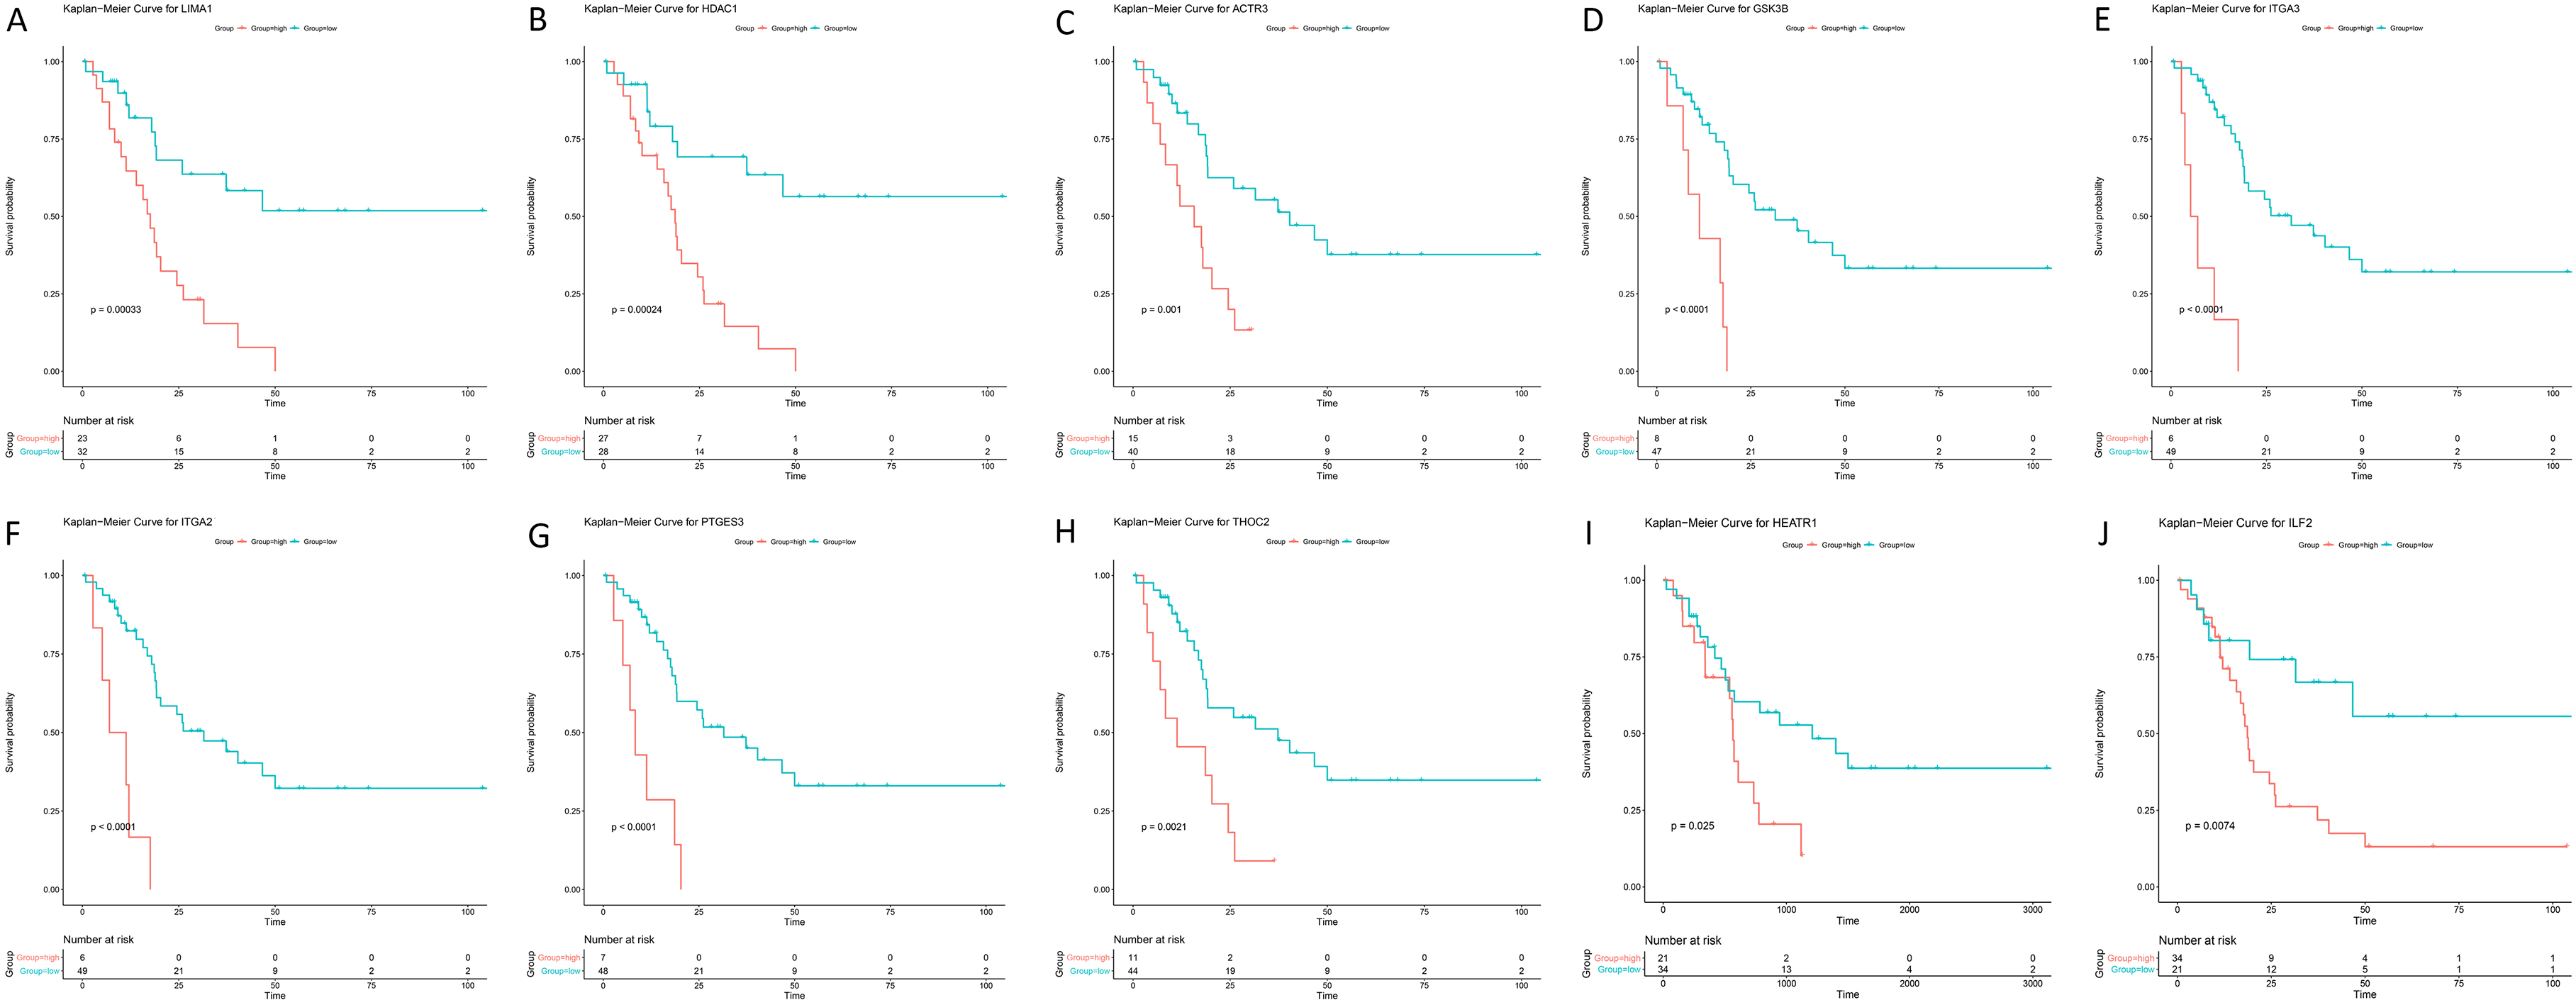
Expression level of the real hub genes in tumour and normal samples. (A) LIMA1, (B) HDAC1, (C) ITGA3, (D) ACTR3, (E) GSK3B, (F) ITGA2, (G) THOC2, (H) PTGES3, (I) HEATR1 and (J) ILF2. Red points represent normal samples and green points represent tumour samples. Two-tailed Student’s t-tests were used to evaluate the statistical significance of differences. 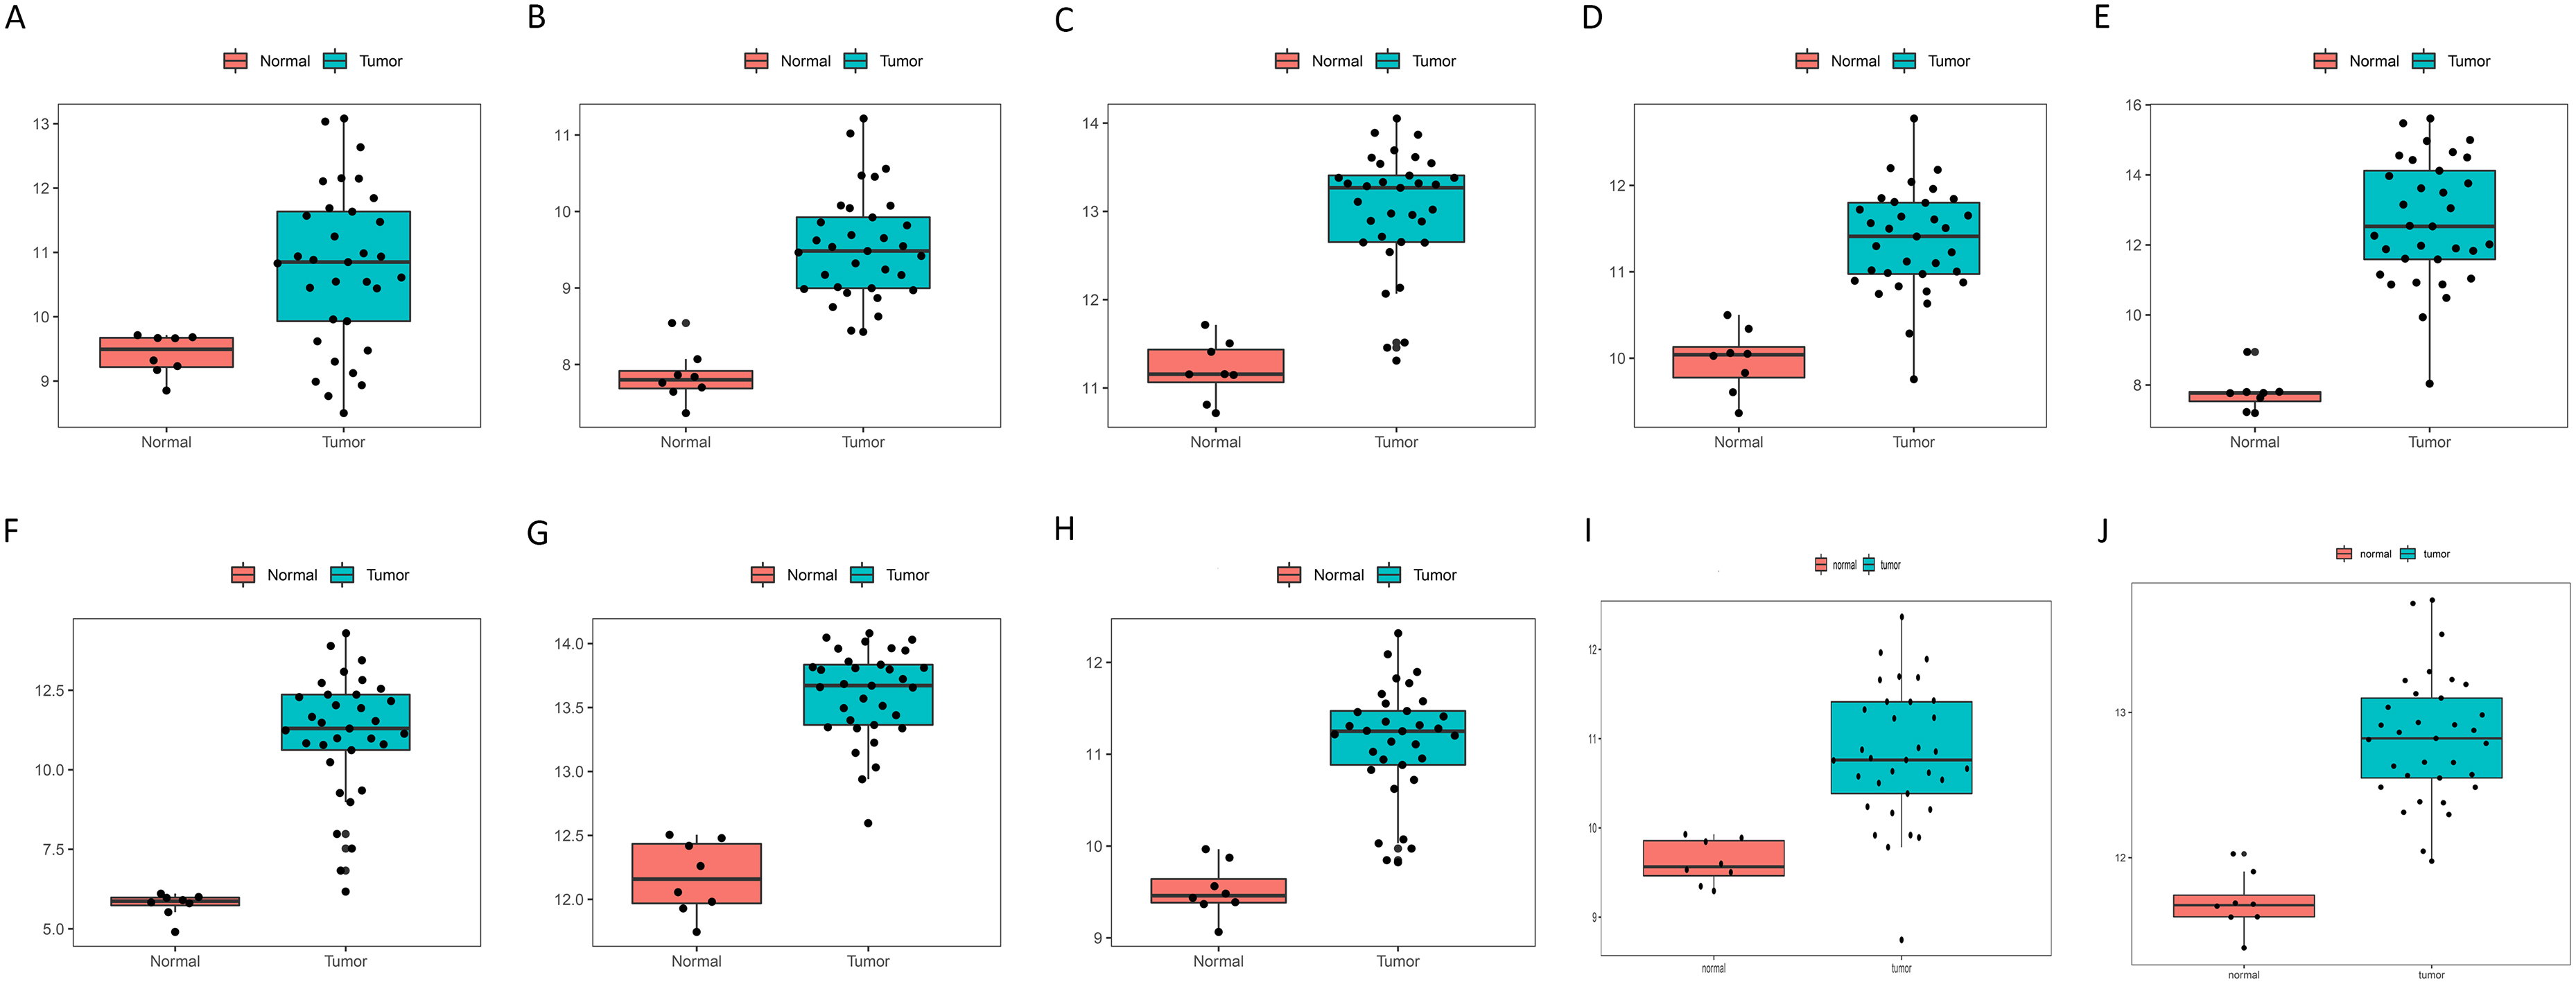
details for the WGCNA and PPI network complex hub genes are displayed in Table S1.
In the survival analysis of the 20 candidate genes, the optimal cut-off values were obtained using X-tile (Fig. S1-2, Table S2), and 13 genes, TSPAN8, LIMA1, HDAC1, ITGA3, ACTR3, GSK3B, KPNA1, ITGA2, THOC2, PTGES3, COPA, HEATR1 and ILF2, were found to be negatively related to the prognosis of CCA (Fig. 7). Moreover, to validate the expression and diagnostic efficacy of the hub genes in external datasets, the TCGA dataset was analysed, and 10 genes were discovered to be significantly dysregulated in tumour samples compared to normal samples, including LIMA1, HDAC1, ITGA3, ACTR3, GSK3B, ITGA2, THOC2, PTGES3, HEATR1 and ILF2 (Fig. 8, Fig. S2). The ROC curves of these genes also showed higher diagnostic efficiency for CCA and non-tumour samples (Fig. S3). In addition, based on the Human Protein Atlas database, all 10 genes exhibited significantly higher protein levels in CCA samples than in normal samples (Fig. 9).
Immunohistochemistry of the ten hub genes based on the Human Protein Altas. (A) LIMA1, (B) HDAC1, (C) ITGA3, (D) ACTR3, (E) GSK3B, (F) ITGA2, (G) THOC2, (H) PTGES3, (I) HEATR1 and (J) ILF2.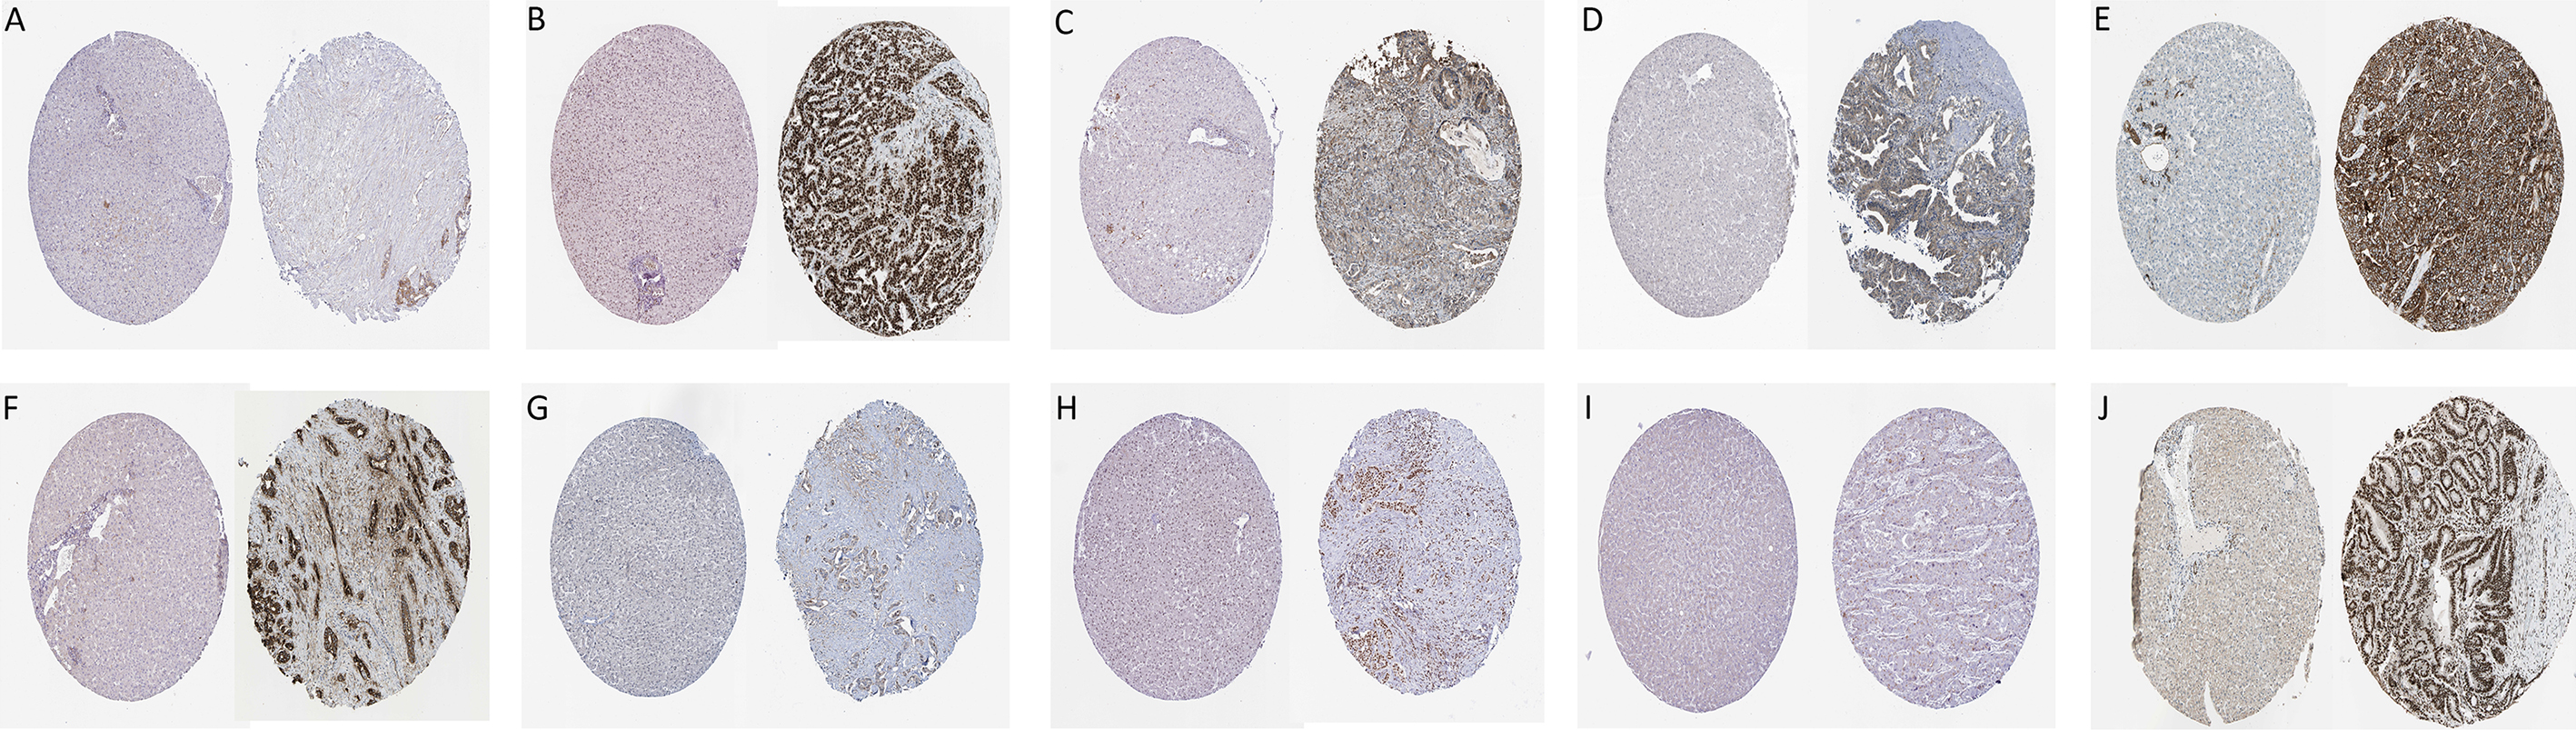
CCA is the most common biliary malignancy arising from the epithelial lining of the bile duct [26]. Due to its silent clinical characteristics, difficulties in early diagnosis and limited therapeutic approaches, the prognosis of CCA is still dismal [6]. The detection of the disease at an early stage is crucial for patients to receive surgical resection, which is regarded as the single curative treatment. Nevertheless, the diagnosis of CCA is still challenging because of the lack of specific biomarkers in serum and/or biopsy samples and imaging methods [27, 28, 29]. Consequently, the identification of novel diagnostic and therapeutic biomarkers of patients with CCA is an important future direction. Recent advances in high-throughput technologies, including gene chips and mass-spectrometric techniques [30, 31], provide novel insight into the molecular understanding of CCA that can increase the identification of potential biomarkers for clinical use.
In the present study, a CCA-related dataset, GSE 89748, encompassing the molecular and clinical data of 72 cholangiocarcinoma samples, was downloaded from the NCBI GEO database. Using WGCNA, a coexpression network complex was constructed using 6274 genes, and 25 modules were screened. Among them, three modules, cyan, light cyan and red, were closely associated with histology and were regarded as modules containing hub genes. Subsequently, 20 candidates were discovered in both the coexpression and PPI networks, 13 of which were found to be related to the prognosis of CCA, and 10 genes, LIMA1, HDAC1, ITGA3, ACTR3, GSK3B, ITGA2, THOC2, PTGES3, HEATR1 and ILF2 were finally identified as real hub genes dysregulated in CCA samples and were associated with CCA prognosis.
HDAC1, also known as histone deacetylase 1, belongs to the class I histone deacetylases, which also contain HDAC2, 3 and 8 [31]. HDAC1 located in the nucleus, as an epigenetic factor, could antagonize the acetylation status of histone and nonhistone proteins [33]. It was reported that HDAC1 was dysregulated in various types of malignancies. In patients with breast cancer, Tang et al. [34]. discovered that the mRNA level of HDAC1 was overexpressed in tumour tissues. In addition, they also found that HDAC1 could activate Snail/IL-8 signalling and promote the proliferation and migration of cancer cells. In lung cancer patients, a recent meta-analysis revealed that the dysregulation of HDAC1 was related to poorer differentiation grade, which is commonly regarded as a reflection of poor prognosis in cancer [33]. Moreover, the relationship between the dysregulation of HDAC1 and dismal prognosis of lung cancer was also proven in this study. In liver cancer, Ser et al. [35] found that HDAC1 was overexpressed in HCC samples, and in addition to a higher number of cancer-specific deaths, its dysregulation was also related to poor differentiation grade, multiple lesions and satellite nodules. Several studies have focused on the role of HDAC1 in CCA prognosis. In a study of thirsty-five patients, Morine et al. [36] found that the overexpression of HDAC1 was associated with various malignant tumour characteristics, including higher tumour stage, vascular invasion and lymph node metastasis. They also proved that the dysregulation of HDAC1 was related to shorter disease-free survival and overall survival. In a recent study, Zhou et al. [37] discovered that the histone deacetylase inhibitor HC toxin could suppress the proliferation and migration of CCA cells in vivo and could thus be a potential candidate for CCA chemotherapeutic drugs. Undoubtedly, HDAC1 seems to be a crucial biomarker in CCA development and progression, and further studies should be conducted to reveal the related mechanisms.
Integrin alpha 2 (ITGA2) and Integrin alpha 3 (ITGA3) are both members of the integrin family of proteins, serving as cell surface adhesion proteins, and they play crucial roles in cell-cell interactions and developmental and pathological processes [38]. Both genes are aberrantly expressed in various cancers and are associated with poor prognosis of cancers [39, 40, 41, 42, 43]. For instance, in pancreatic cancer, the dysregulation of ITGA3 was discovered to be associated with poorer histological grades, later tumour stages, and shorter disease-free survival and overall survival [43]. To reveal the related mechanisms, Gong et al. [44] demonstrated that the overexpression of UCA1-ITGA2 could promote the proliferation, migration and invasion of pancreatic cancer cells. In a recent study, Ren et al. [45] proved that via the activation of the STAT3 signalling pathway, ITGA2 could upregulate PD-L1 expression and thus promote cancer cell proliferation and migration, which might provide a new insight into immune therapy for cancer. In CCA patients, ITGA3 was found to be overexpressed in CCA samples and was related to many malignant clinical traits, including tumour size, stage and lymph node metastasis [46]. In an in vitro experiment, although negatively related to CCA cell migration and invasion, Huang et al. [46] proved that ITGA3 could promote CCA cell proliferation by regulating the G1 phase of cell cycle progression. Considering the crucial roles of ITGA2 and ITGA3 in cancer development and progression, it is clear that they could be potential diagnostic biomarkers and therapeutic targets for CCA, and further explorations should be performed.
The dysregulation of the remaining core genes has also been discovered to be associated with cancer development, progression or poor prognosis. LIMA1, also known as EPLIN, is an actin-related molecule that is dysregulated in various cancers via adherens junction [47] and post-translational modifications [48], LIMA1 can influence cancer cell proliferation and invasion, which increases the metastatic probability of tumours [49]. GSK3B is a serine/threonine kinase that participates in various processes, including metabolism, neurological diseases and oncogenesis [50]. Recent studies proved that GSK3B plays two core roles in cancer development and progression: i) induction of NF-
In the GO analysis, protein binding was the pathway in which the genes in the three modules were mainly enriched. This result was consistent with the related functions of the hub genes, including LIMA1, GSK3B ITGA2 and ITGA3. Furthermore, in the KEGG analysis, the majority of the genes in the three modules were enriched in signal transduction, metabolism-related pathways, post-transduction modification and gene expression, which suggested that the genes were closely related to the mitotic cell cycle process. Cell cycle dysregulation has been demonstrated to be associated with the development and progression of various types of cancers, including CCA [55, 56]. Chen et al. [57] demonstrated that the downregulation of KLHL21 could alter the P21/P27/Cyclin E1 protein, trigger G0/G1 cell cycle arrest and prevent CCA cell migration and invasion by restraining the activation of the Erk signalling pathway, which might be a novel therapeutic target. In addition, several studies have shown that many drugs, such as telmisartan and cryptotanshinone, could induce cell cycle arrest and apoptosis in CCA and are potential therapeutic agents for CCA [58, 59]. Clearly, more attention should be paied to these cell cycle-related pathways and genes to explore the mechanism of CCA development and progression and CCA treatment.
There are still several limitations in this study. First, although a relatively large number of CCA samples were analysed, and an external TCGA dataset was used to validate the expression and diagnostic efficacy of the hub genes, more studies with larger samples sizes are needed to validate the findings of this study. Second, although the immunohistochemistry results of the hub genes were evaluated in this study, they were based only on the information from an online database. Consequently, further experiments should be performed to validate the results in this study and to reveal the mechanisms of these hub genes in CCA progression and prognosis.
In summary, by using coexpression analysis and a series of other bioinformatics approaches, we identified 10 real hub genes, LIMA1, HDAC1, ITGA3, ACTR3, GSK3B, ITGA2, THOC2, PTGES3, HEATR1 and ILF2, involved in the development, progression and prognosis of CCA. Cell cycle-related pathways such as signal transduction, metabolism related pathways, post-transduction modification and gene expression, were enriched in the hub genes. These study results enrich our understanding of CCA development and progression and may help us improve CCA therapy.
Footnotes
Acknowledgments
This study was funded by the National Natural Science Foundation of China (No. 81770566).
Conflict of interest
The authors declare no conflict of interest.
Supplementary data
The supplementary files are available to download from http://dx.doi.org/10.3233/CBM-190038.