
Abstract
BACKGROUD:
Gastric cancer (GC) is one of the leading causes of cancer-related death in East Asia and some South American countries, but its mechanism has not been clarified clearly. Proline-, glutamic acid-, and leucine-rich protein-1 (PELP1), a co-regulatory molecule of estrogen receptor
METHODS:
Immunohistochemical staining and Real-time PCR were used to compare the expression level of PELP1 in GC tissues and adjacent tissues. Western blot was used to detect the expression of PELP1 in cell lines. Kaplan-meier analysis and chi-square test were applied to evaluate the potential of PELP1 to function as a cancer biomarker. RNA interference was used to inhibit PELP1 expression in GC cells, followed by detecting cell proliferation, apoptosis, migration and invasion. Luciferase assay was conducted to validate whether miR-15 family members can directly target PELP1.
RESULTS:
In this study, we validated that PELP1 was significantly up-regulated in GC samples and cell lines. It was also demonstrated that the up-regulation of PELP1 was associated with several clinicopathologic features such as tumor diameter (
CONCLUSION:
In conclusion, we demonstrated that PELP1 was an oncogene of GC associated with patients’ prognosis and miR-15 family members contributed to its aberrant expression in cancers.
Introduction
Gastric cancer (GC) is a major health problem worldwide, especially in East Asia and some South American countries [1]. The mechanism of GC is highly heterogeneous and complicated, accompanied by various genetic abnormalities. Even though many potential therapeutic targets have been discovered, however, for GC patients, only trastuzumab, a monoclonal antibody against human epidermal growth factor receptor 2 (Her2), and ramucirumab, a monoclonal antibody against vascular endothelial growth factor receptor 2 (VEGFR 2) are proved to have certain therapeutic effects and widely applied into the clinic [2, 3]. It is well-believed that the elucidation of molecular mechanisms underlying GC tumorigenesis and progression is important for the development of novel treatments.
Proline-, glutamic acid-, and leucine-rich protein-1 (PELP1), a protein mainly located at the nucleus with a molecular weight of 160 kDa, is named for the reason that more than 40% of the sequences in its amino acid chain are proline, glutamic acid or leucine [4, 5]. It is also known as the modulator of non-genomic activity of the estrogen receptor (MNAR), which is a newly discovered steroid receptor (SR) co-regulatory molecule [4, 5]. It is considered to be a co-regulatory molecule of estrogen receptor
Herein, we investigated the expression of PELP1 in GC tissues and cell lines. The relationship between the expression level of PELP1 and clinical parameters was analyzed. Furthermore, the biological functions of PELP1 were examined in vitro. Our study proved that PELP1 was oncogenic in GC. We also proved that miR-15 family microRNAs (including miR-15a, miR-15b, and miR-195/497 clusters) were posttranscriptional regulators of PELP1, which partly explained the reason of high expression of PELP1 in gastric cancer.
Methods and materials
Cell culture and culture conditions
The gastric cancer cell lines (MGC-803, SGC-7901, MKN45, AGS), normal gastric epithelial cell line (GES-1) and human embryonic kidney cell line (HEK293) were purchased from the Cell Bank of Chinese Academy of Sciences (Shanghai, China). The cells were cultured in Dulbecco’s modified Eagle medium (DMEM) supplemented with 10% FBS, 100 U/mL penicillin, and 100 mg/mL streptomycin. Cells were cultured at 37
Immunohistochemical (IHC) staining
Our study was approved by the Ethics Review Board of Central Hospital of Linyi. Eighty patients who had undergone surgical resection for GC at Central Hospital of Linyi between 2014 and 2016 were randomly selected. The deparaffinized sections were treated with 3% H
Western blot
Protein samples were equally loaded on 10% SDS-PAGE, electrophoresed, and transferred onto nitrocellulose membrane (Millipore, USA). After blocking with 5% non-fat milk in Tris-buffered saline with Tween 20 (TBST), the membranes were incubated with antibodies for PELP1 and
RNA isolation and Real-time PCR (RT-PCR) analysis
Total RNA was isolated from cell lines or tissues with TRIzol reagents (Invitrogen, CA) according to the manufacturer’s instructions. Then, 2
siRNA or miRNA transfection
Small interfering RNA (siRNA), nonspecific control siRNA and microRNAs were purchased (GenePharma, Suzhou, China) and transfected using Lipofectamine 2000. siRNAs and microRNAs were transfected at a final concentration of 100 nM. PELP1 knockdown was validated by western blot 24 hours after the transfection.
PELP1 is up-regulated in GC tissue and cell lines. A. A representative case of GC tissue and corresponding adjacent tissue, and IHC staining showed that PELP1 is strongly positive in GC tissue, while weakly positive in adjacent tissue (Magnification, 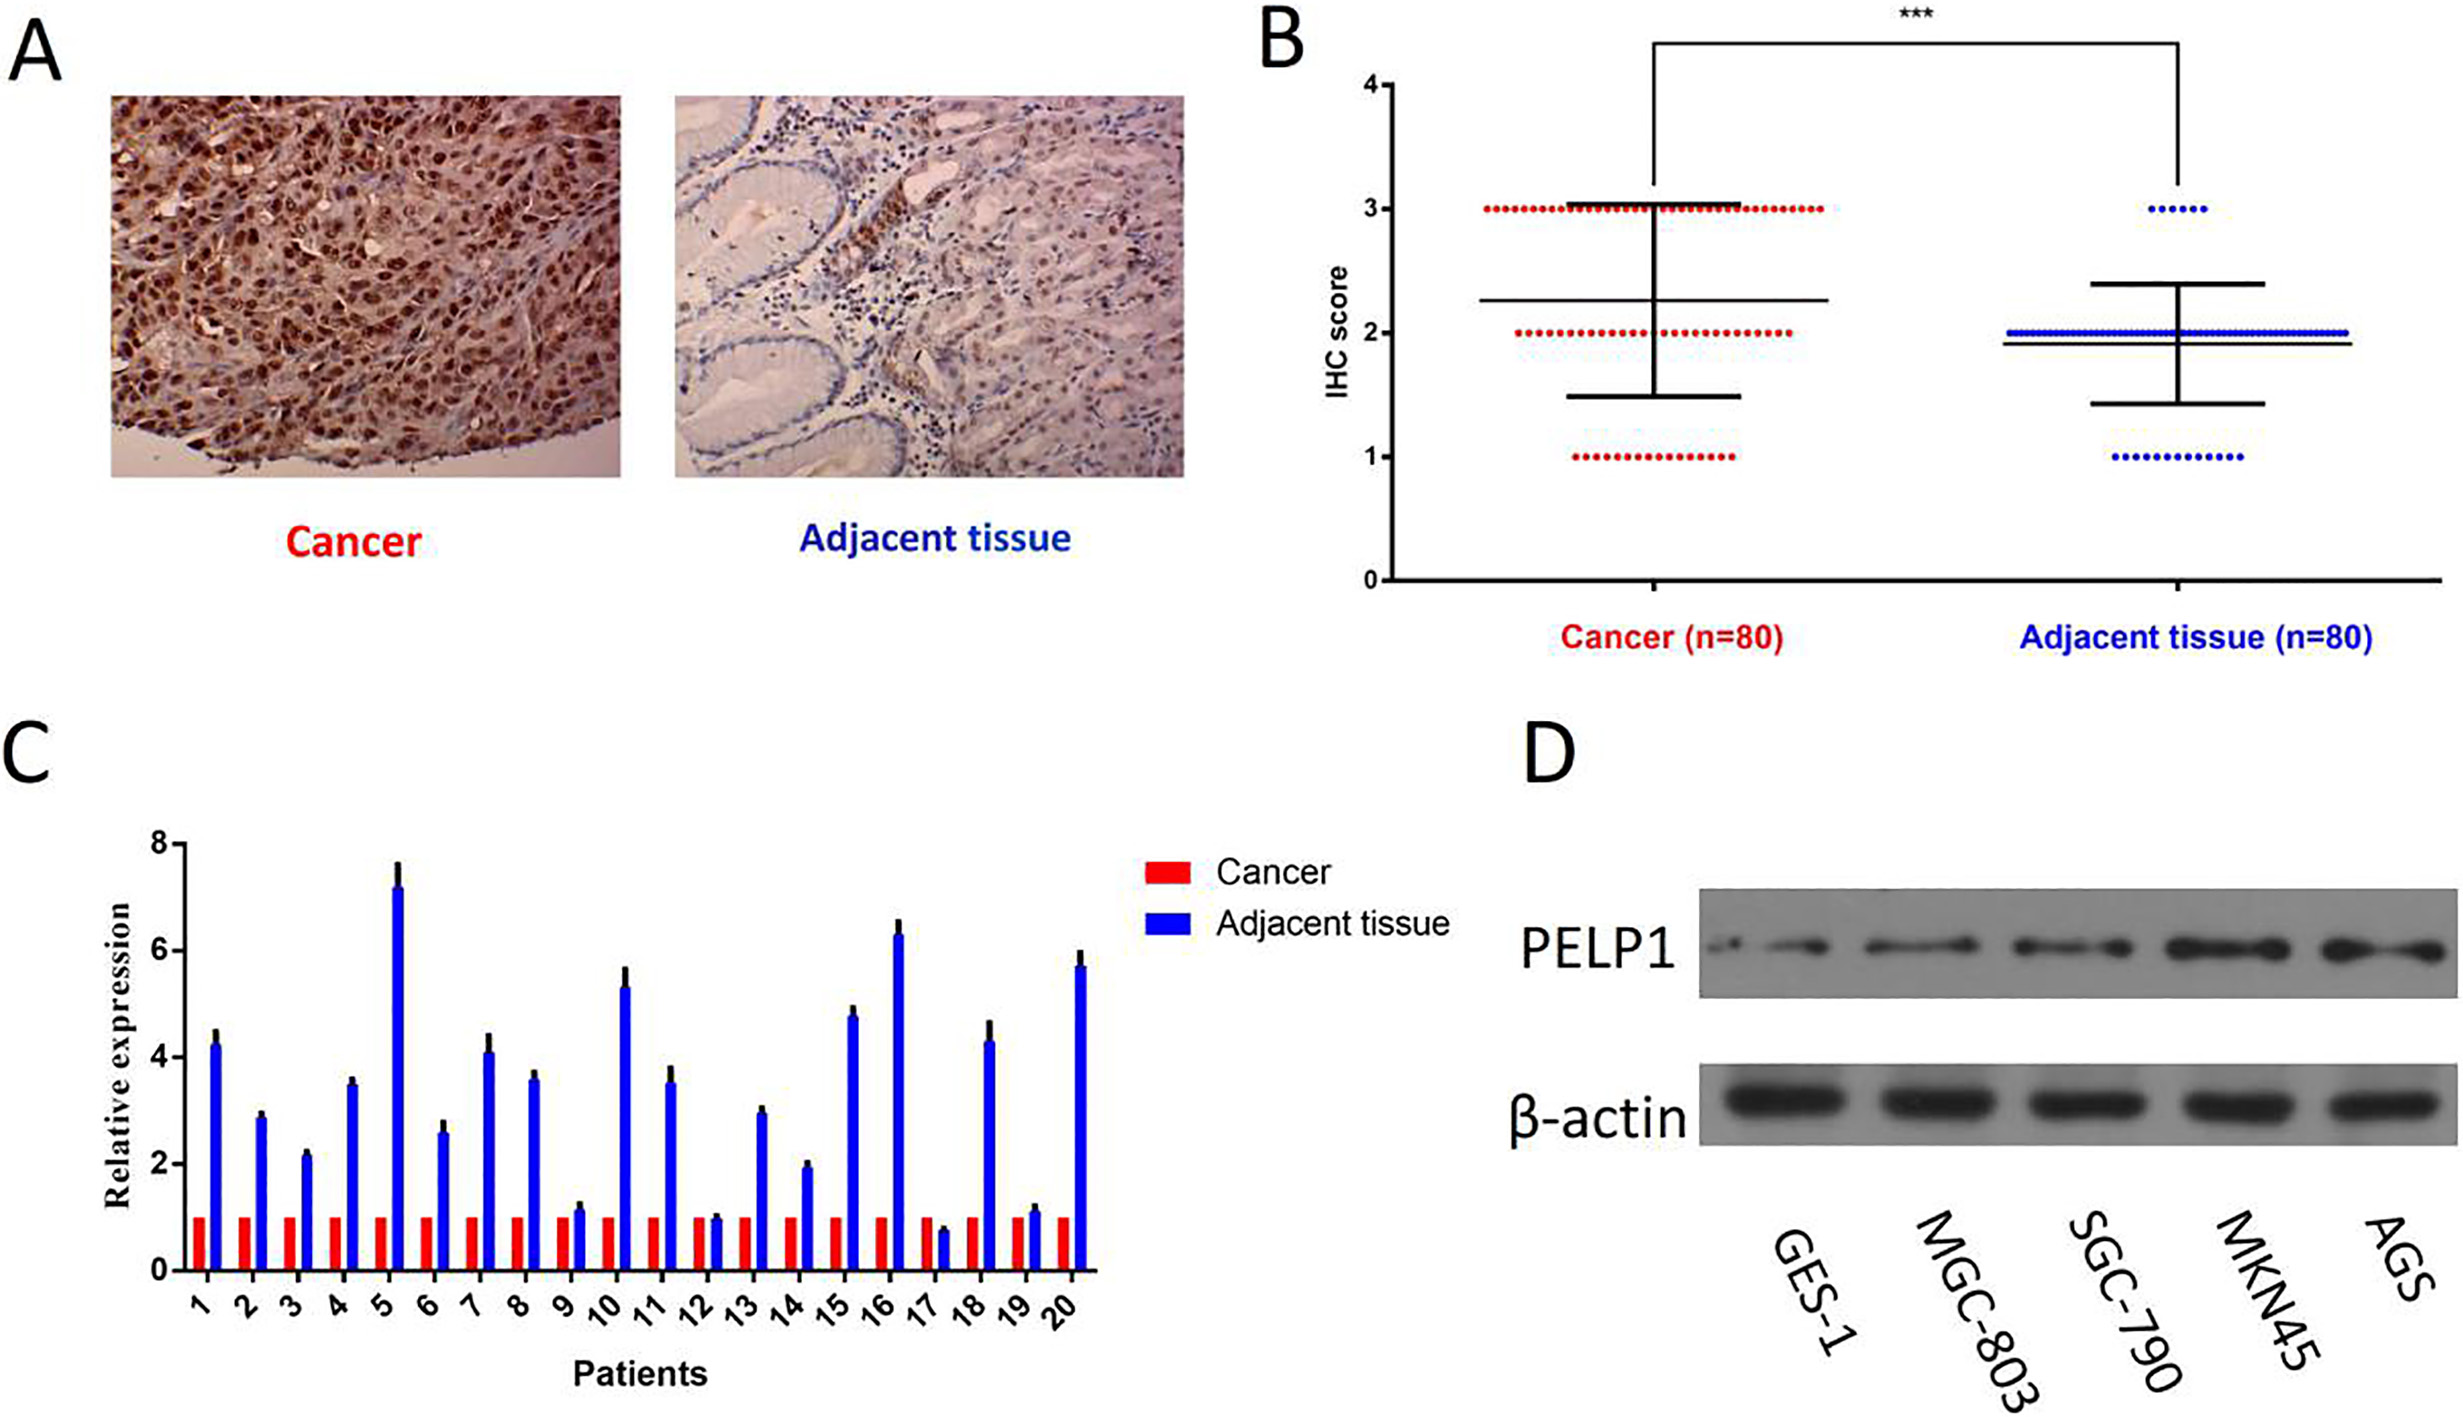
Twenty-four hours after siRNA transfection, 3000 cells per well were seeded into 96-well plates. After 24, 48, 72, 96 and 120 hours of culture, cell viability was measured respectively with Cell Counting Kit-8 (Dojindo, Japan). Three independent experiments were performed for each assay.
Colony formation assay
Cells at a log phase of growth treated by siRNAs and scramble control were routinely trypsinized and added into 6-well plates (1000 cells/well). The cell culture was terminated once visible colonies were formed, during which cells were harvested 14 days later. Afterwards, cells were washed with PBS for twice, then fixed with 4% paraformaldehyde for 15 minutes, and then stained with crystal violet for 30 minutes. Subsequently, the dishes were carefully washed with PBS until the background was clear. Finally, the number of colonies was counted. The colony formation ratio was expressed as “number of colonies/initiative cell*100 (%)”. Three independent experiments were carried out for each assay.
Apoptosis analysis
Cells of different groups were stained with Annexin V-FITC/PI. Then the cells were sorted by a flow cytometry system. In each assay, 10,000 cells were analyzed and annexin V-positive cells were counted as apoptotic cells.
The correlation between PELP1 expression and pathological characteristics of GC patients
The correlation between PELP1 expression and pathological characteristics of GC patients
The transwell migration and invasion assays were performed in the 24-multiwell insert system (Corning). Cells were suspended in serum-free DMEM and plated into the upper chamber. Medium with 10% fetal bovine serum was added to the lower chamber as a chemoattractant. After incubation of 24 hours, the cells in the upper chamber were removed with cotton swabs and the bottom surface of the polycarbonate membranes was counted visually using 0.1% crystal violet dye. The invasion assay was same except that matrigel (Clontech) was used in the transwell chambers (Corning).
Luciferase assay
Cells were seeded into 12-well plates one day before transfection. After 24 hours of culturing, the cells were co-transfected with 200 ng of psiCHECK-2 plasmids and 100 nM of miR-15 family members (or scramble microRNA). After 2 days, luciferase activities were measured with Dual-Luciferase Reporter Assay system (Promega, Madison, WI). Renilla luciferase activity was normalized to firefly luciferase activity.
Statistical analysis
Statistical analysis was performed using GraphPad Prism 8 software. Averaged replicates of three independent experiments were used in cellular studies, and results were statistically analyzed using the two-tailed, unpaired Student’s
Results
PELP1 was up-regulated in GC tissue and cell lines
To evaluate PELP1 expression in GC tissues, firstly, we examined PELP1 expression by immunohistochemistry in 80 pairs of GC tissues and their corresponding adjacent tissues. As shown, PELP1 protein was mainly distributed in both nucleus and cytoplasm (Fig. 1A). The percent of samples of strongly positive, weakly positive and negative in GC tissues is 46.25% (37/80), 33.75% (27/80) and 20% (16/80) respectively. Conversely, the percent of the samples of strongly positive, weakly positive and negative in adjacent tissues was 7.5% (6/80), 76.25% (61/80) and 16.25% (13/80) respectively (Fig. 1B). Furthermore, PELP1 mRNA expression level of 20 randomly selected GC tissues paired with adjacent tissues was examined by RT-PCR. We demonstrated that most of the GC tissues exhibited significantly up-regulation of PELP1 mRNA level (Fig. 1C). In addition, we examined the expression level of PELP1 in different GC cell lines and normal gastric epithelium cell, namely MGC-803, SGC-7901, MKN45, AGS and GES-1. Western-blot showed that PELP1 protein expression was significantly higher in three GC cell lines compared to immortalized gastric epithelium cell GES-1 (Fig. 1D). Collectively, these results indicated that HSF1 was highly expressed in GC tissues and cell lines.
High expression of PELP1 is associated with shorter survival time of GC patients. High PELP1 expression in tumor tissues predicted shorter disease-free survival A and overall survival B.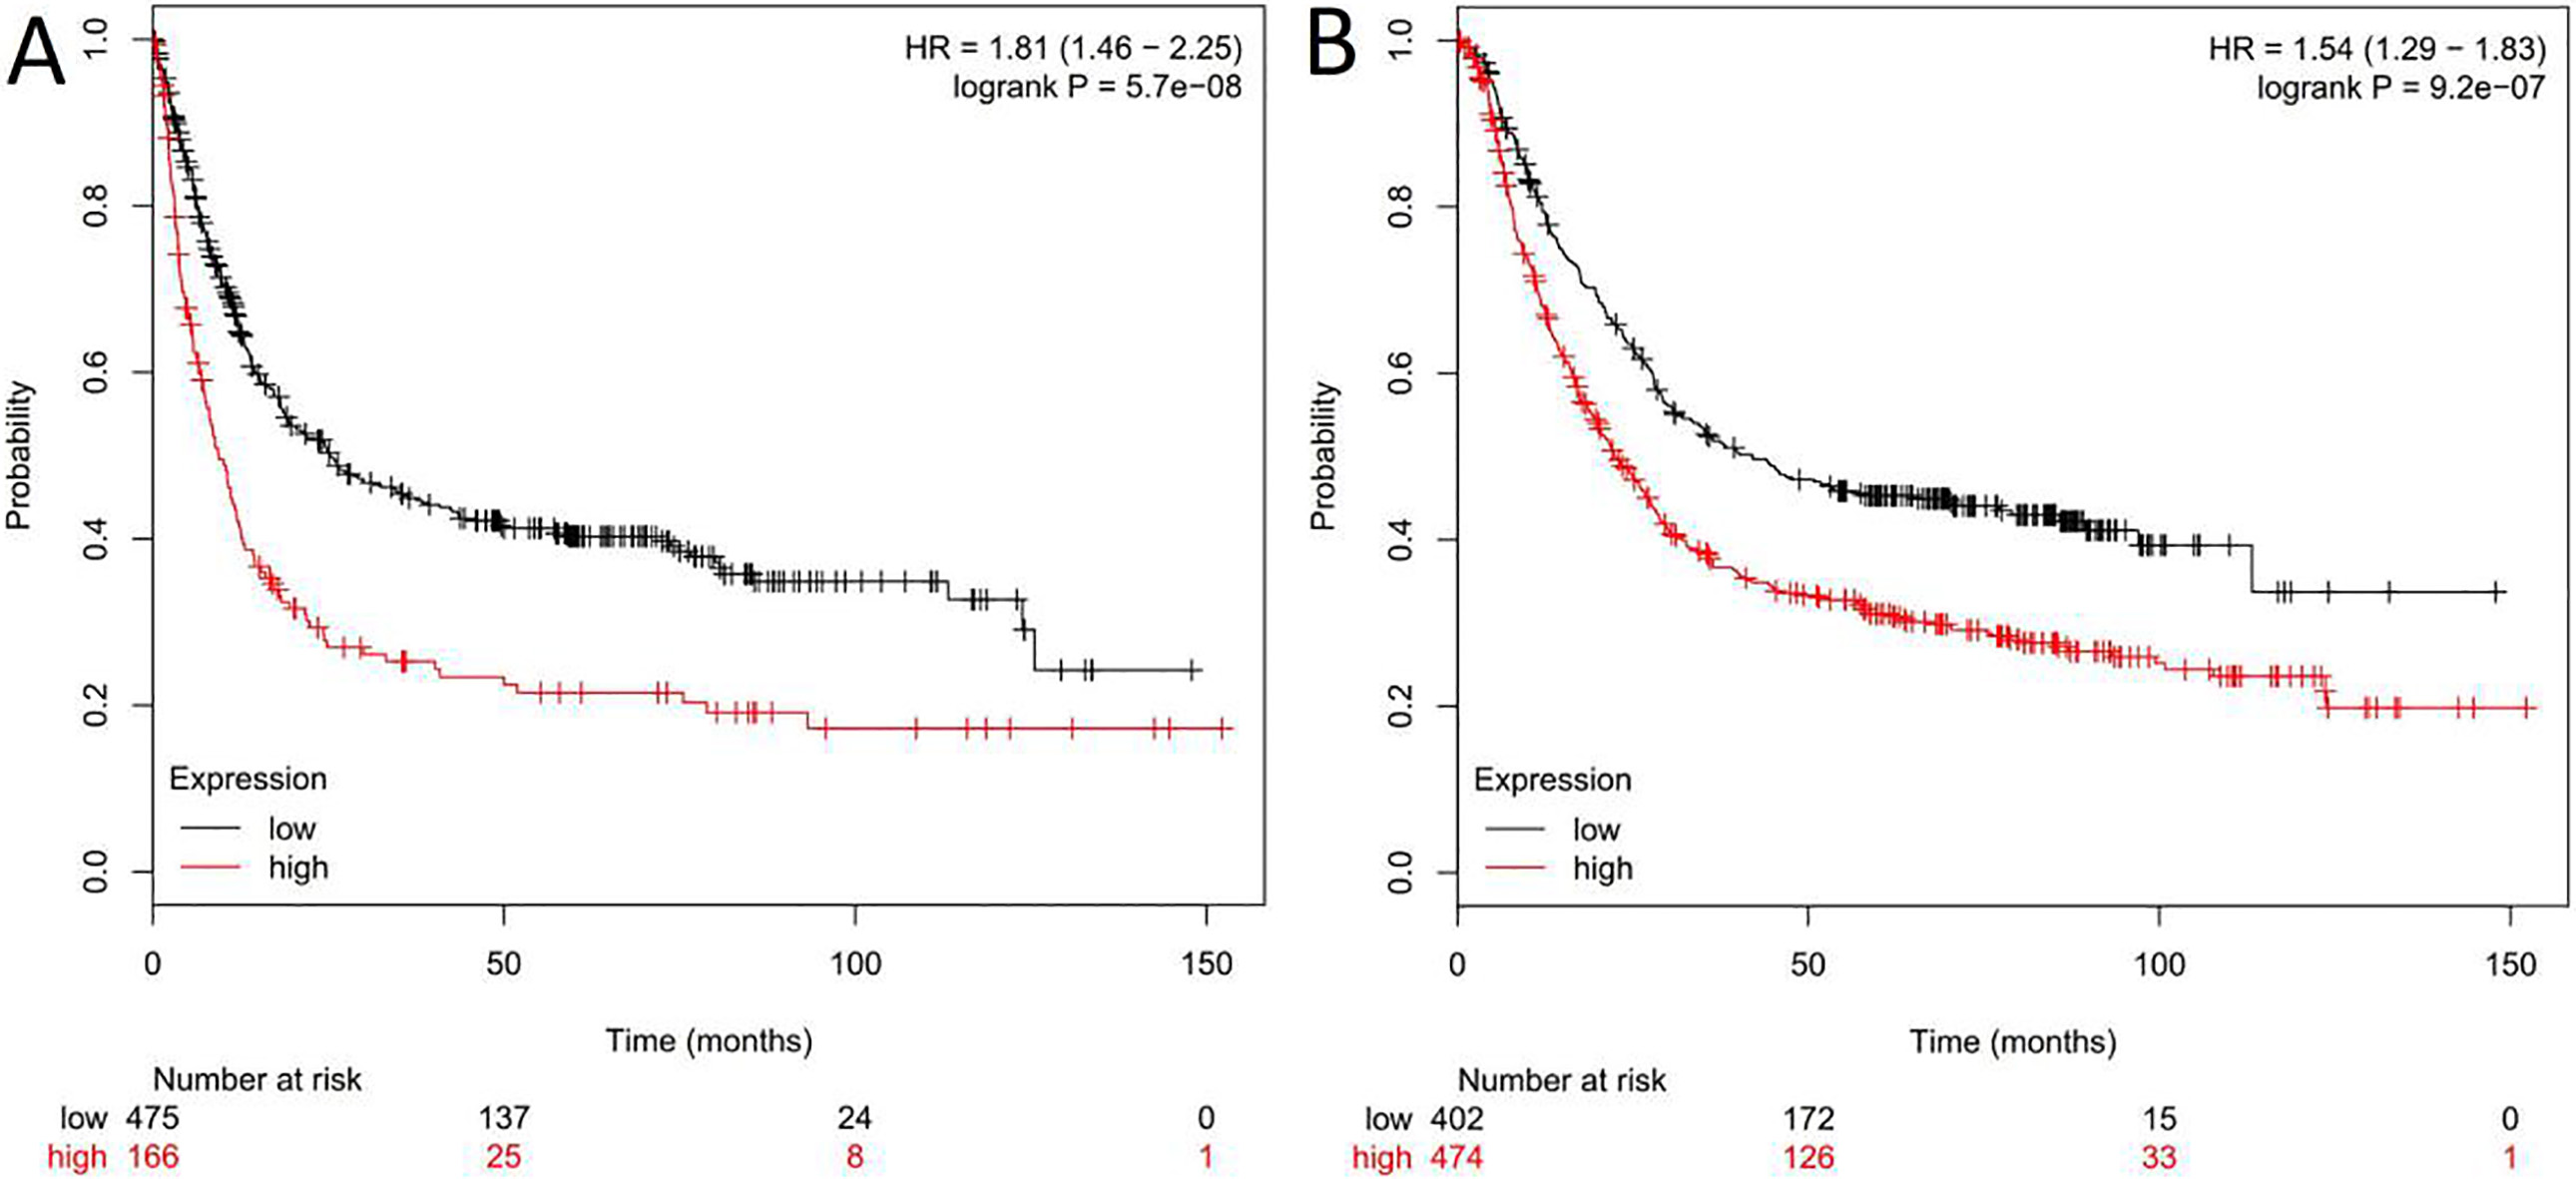
PELP1 modulates proliferation and colony formation ability of GC cells. A. Knockdown of PELP1 in SGC-7901 cells (left) and AGS cells (right) was confirmed by western blotting; 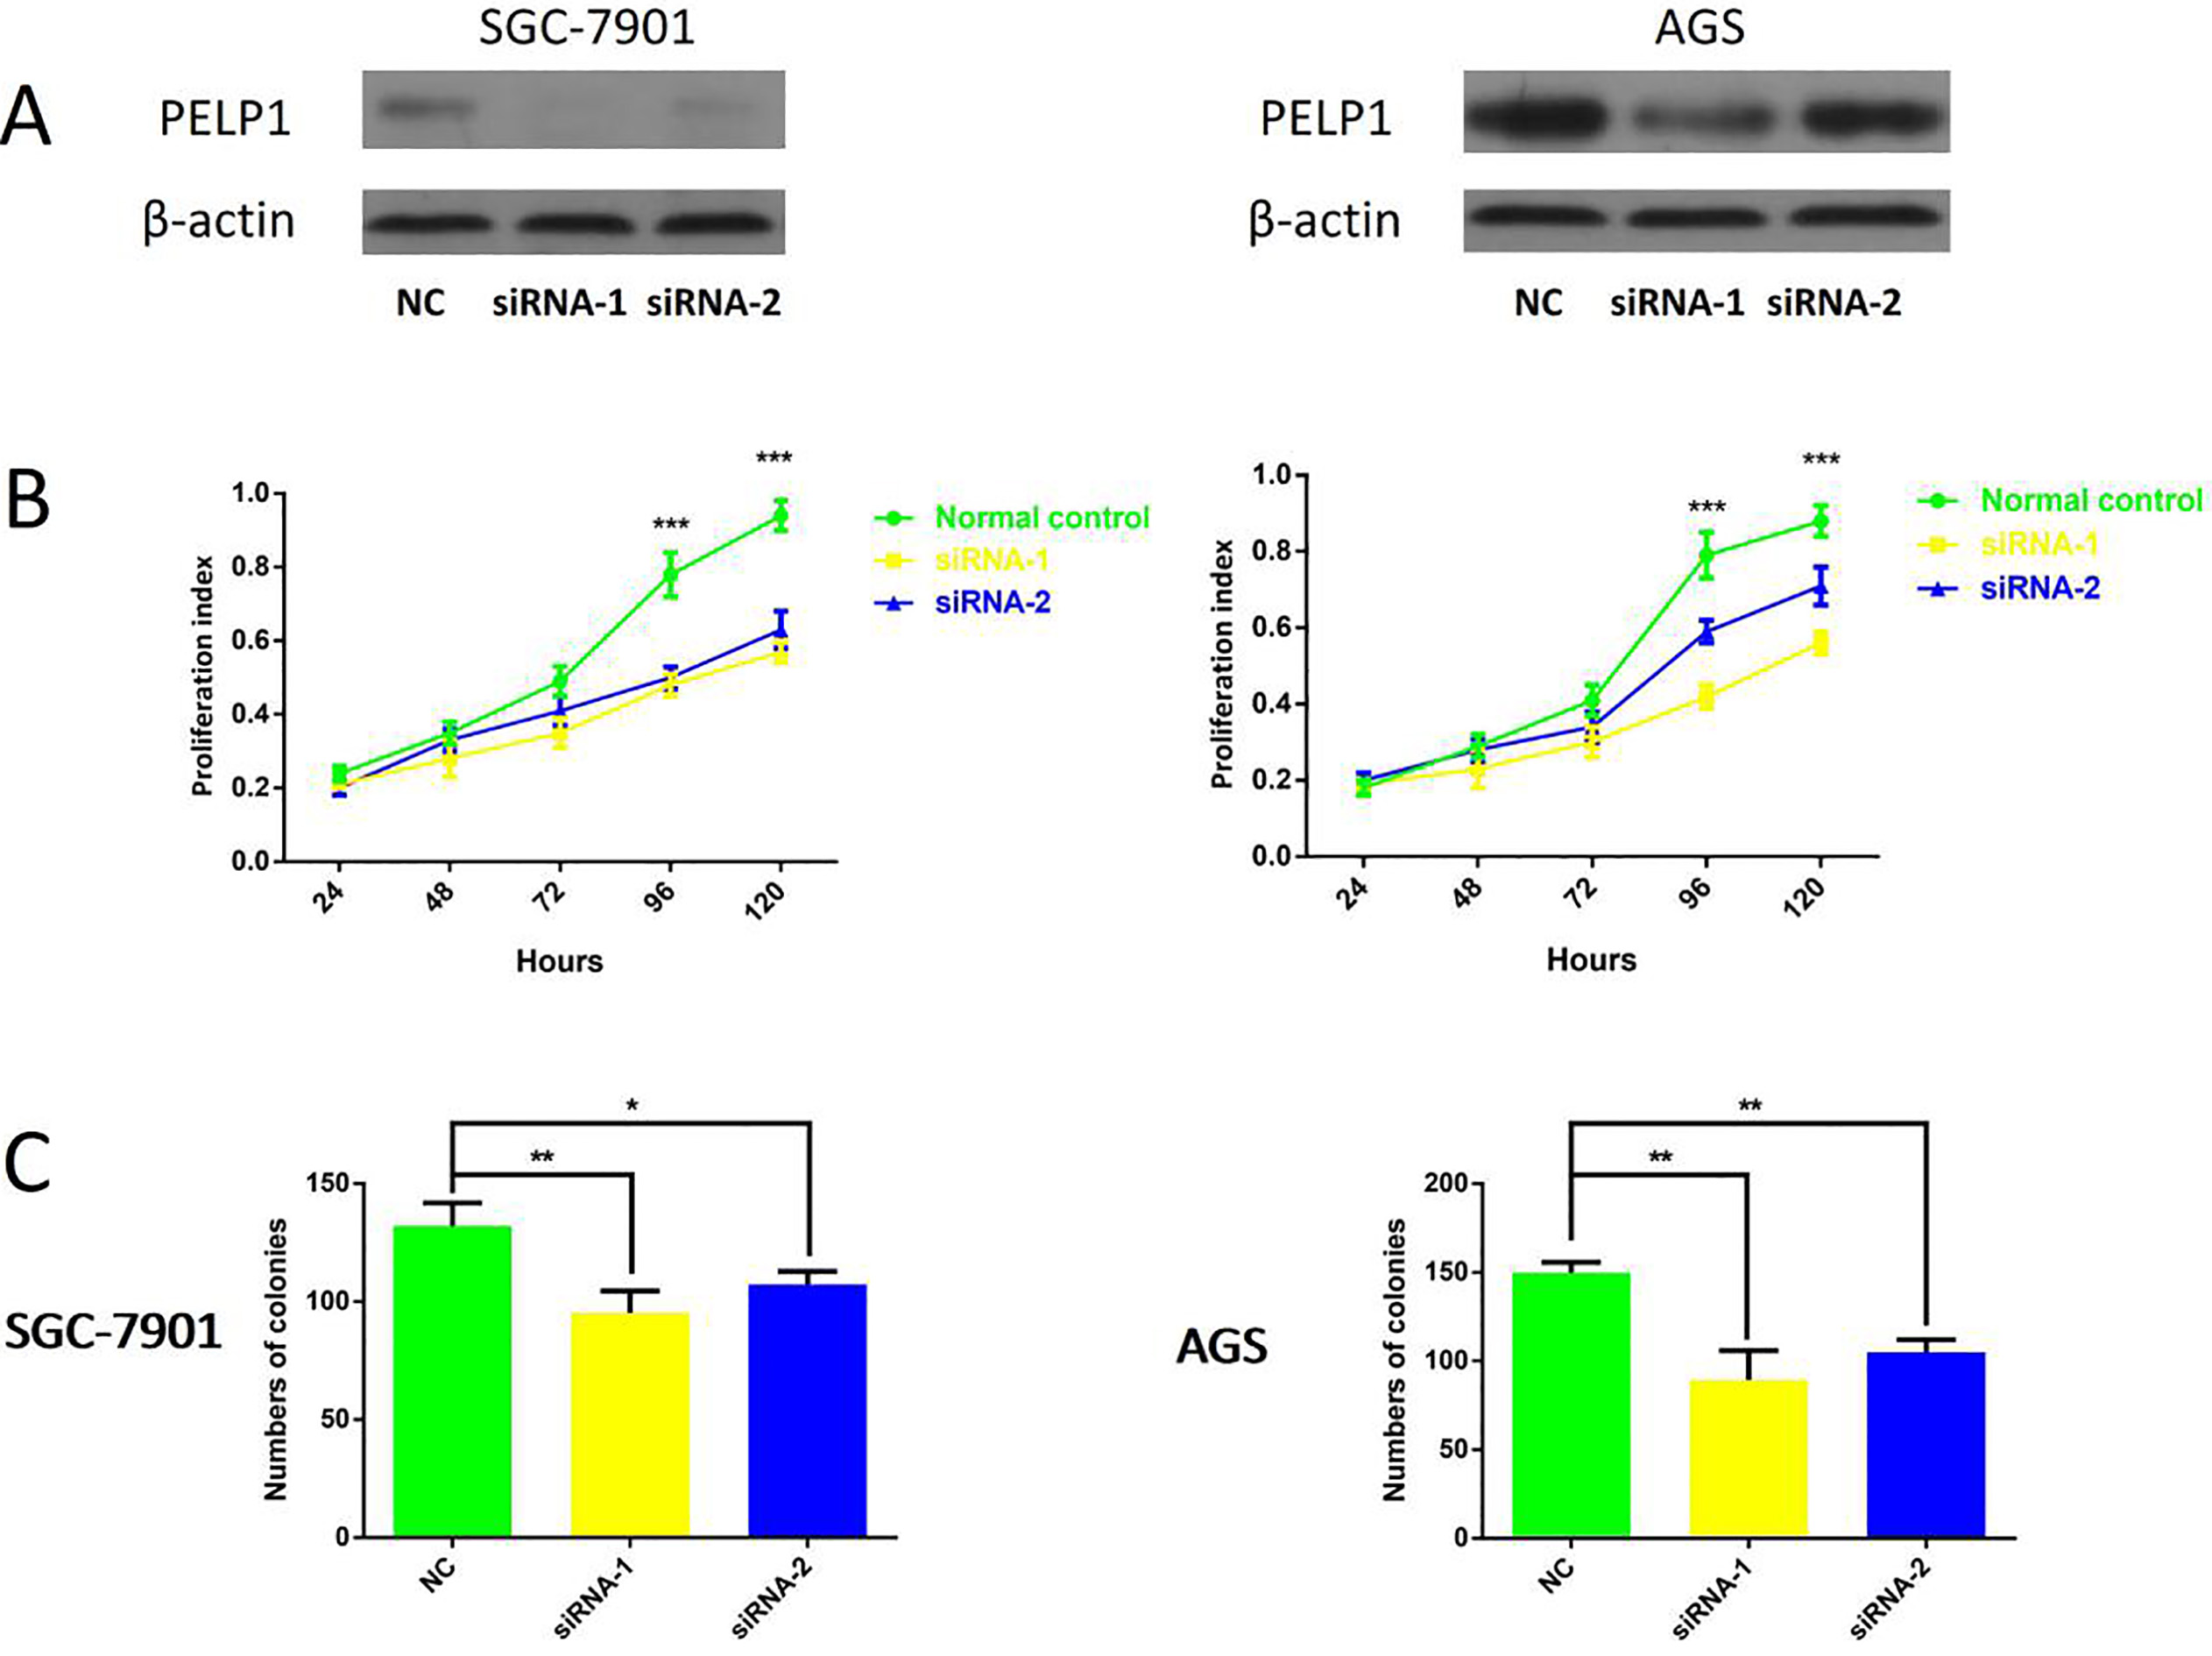
PELP1 modulates apoptosis, migration and invasion of GC cells. A. Effect of PELP1 knockdown on the apoptosis of SGC-7901 cells was determined by flow cytometry. B. Effect of PELP1 knockdown on migration and invasion of SGC7901 cells and AGS cells was determined by transwell assay. The bars represent the mean values of three independent tests (mean 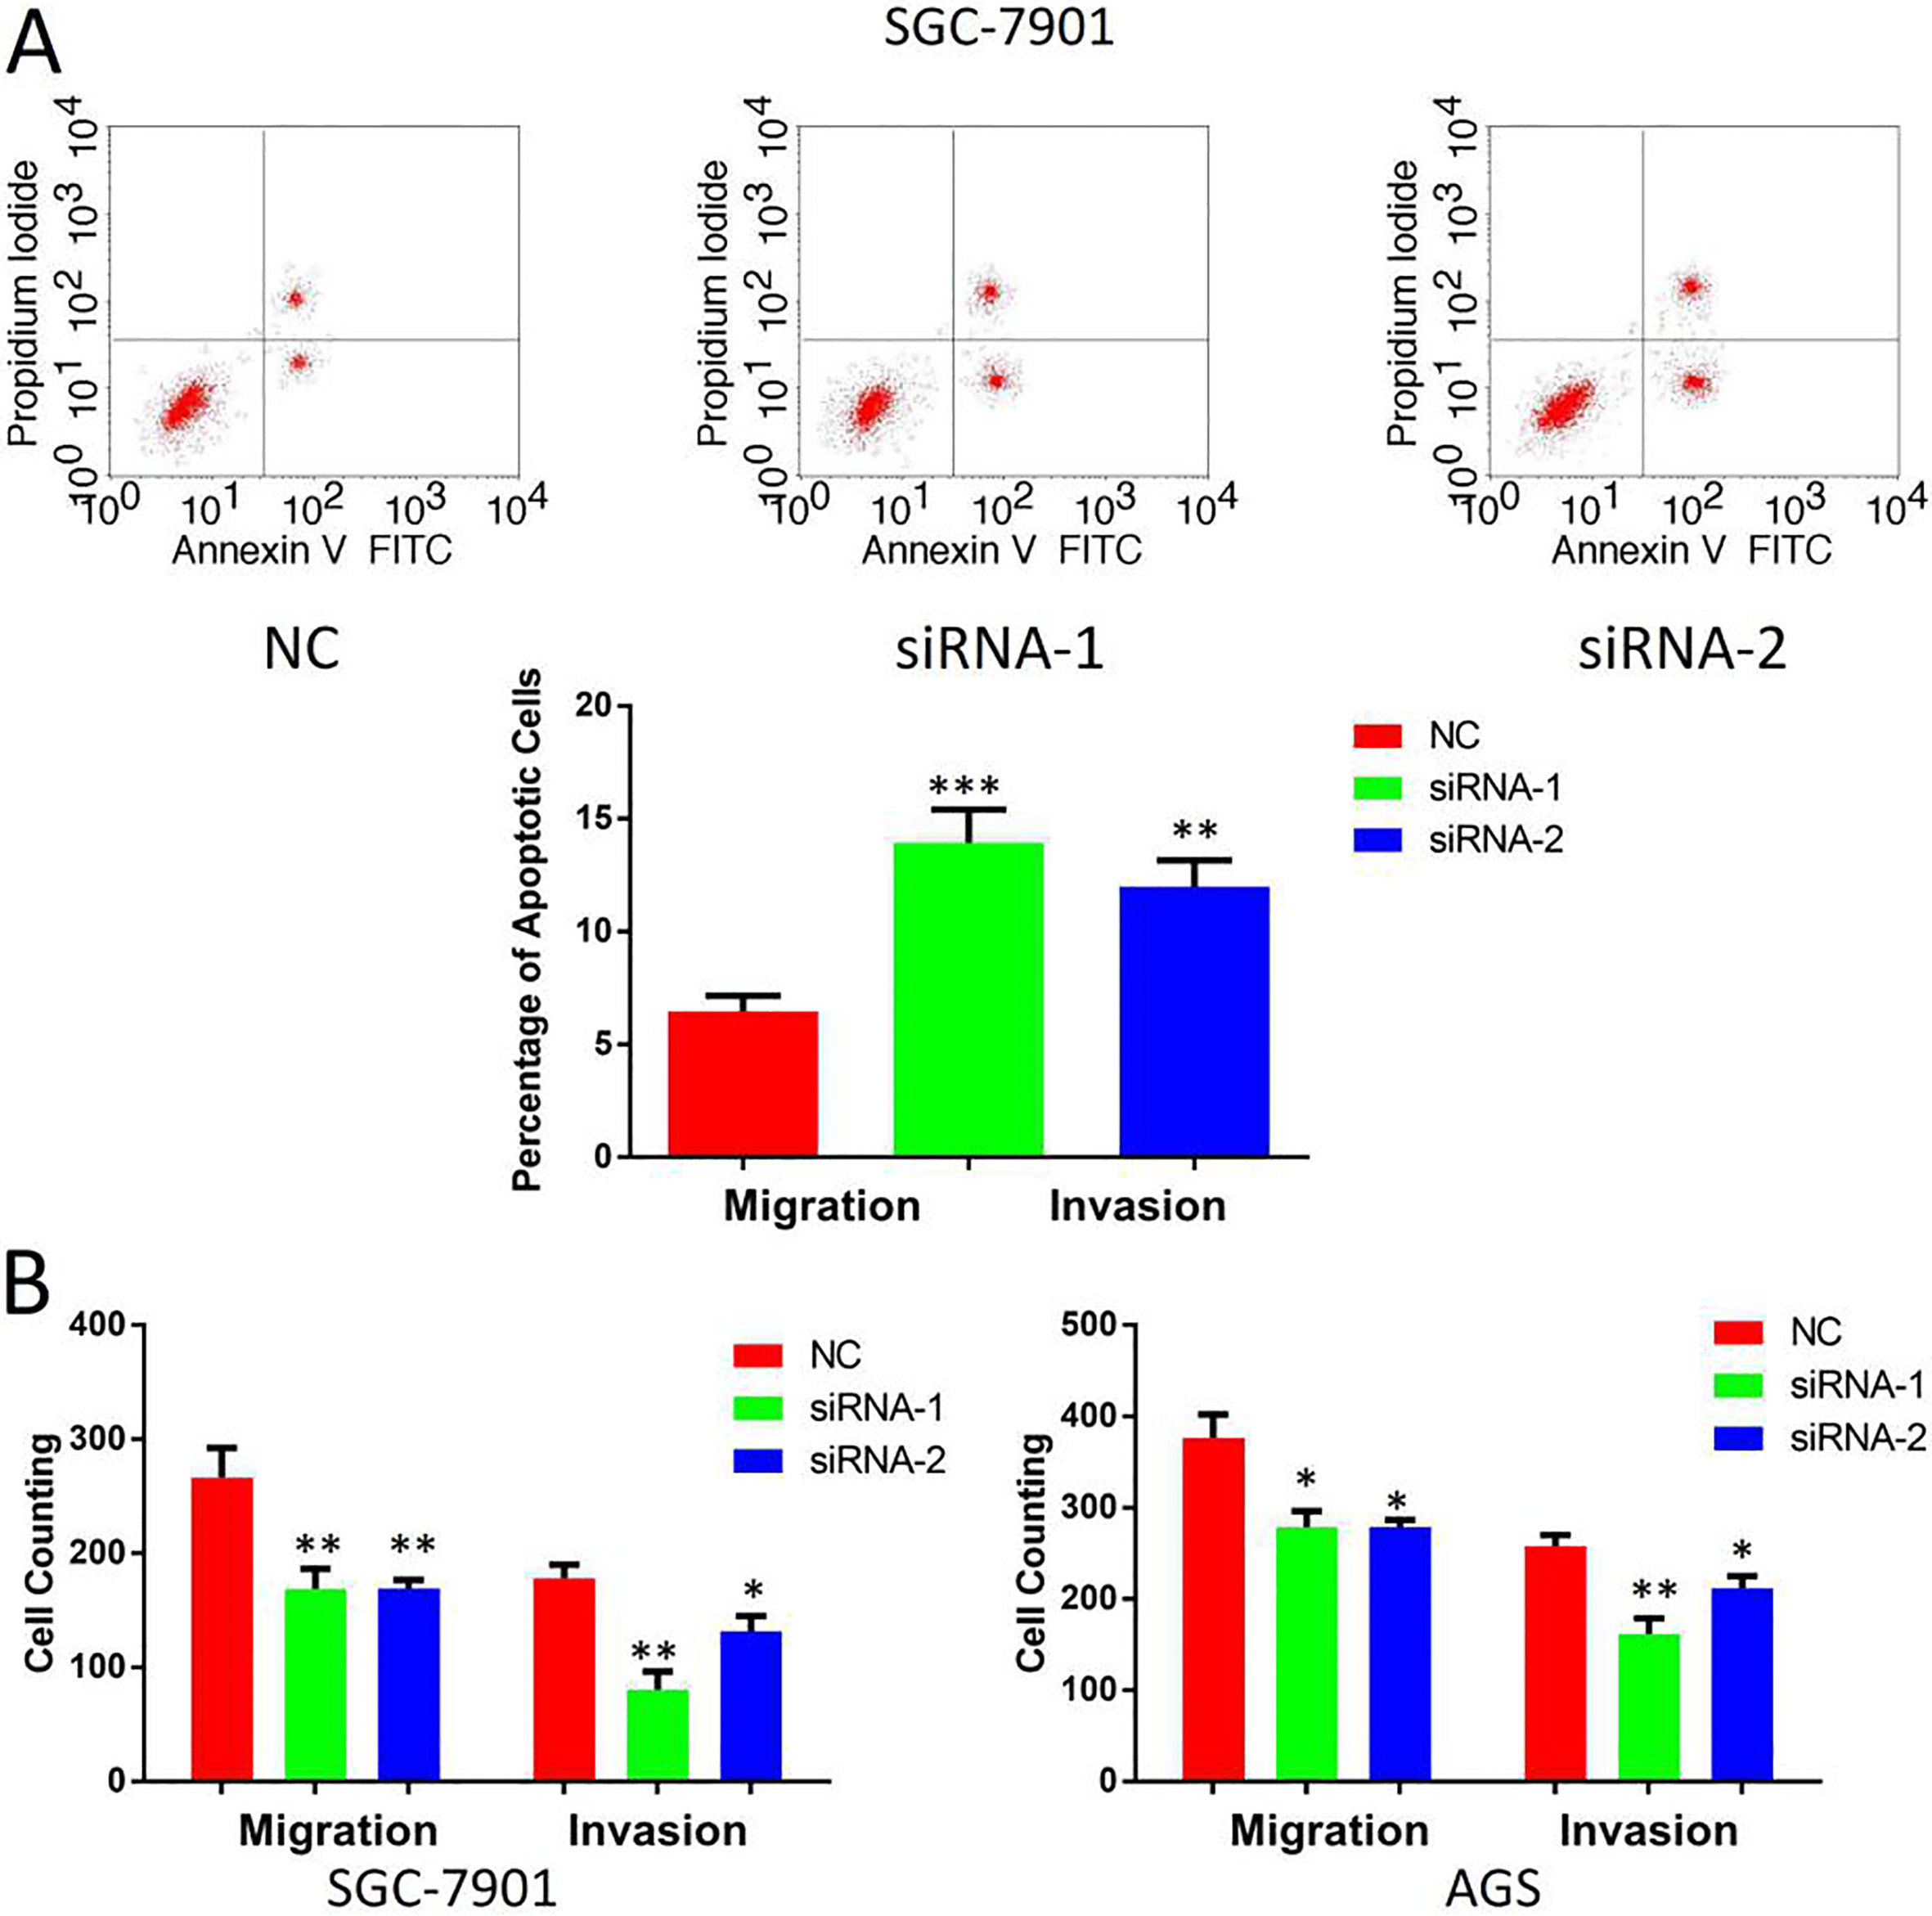
miR-15 family members posttranscriptionally regulated PELP1 expression by directly targeting its 3’UTR. A. The target sites of miR-15 family members in 3’UTR of PELP1 are shown as a schematic representation. B. Western blotting assays showed the expression of PELP1 protein was inhibited after miR-15 family members transfection in SGC-7901 cells. C. RT-PCT showed the expression of PELP1 mRNA was inhibited after miR-15 family members transfection in SGC-7901 cells. D. 3’UTR constructs of PELP1 were cloned into a psi-CHECK2 vector, and respectively co-transfected with miR-15 family members in HEK293 cells. Renilla luciferase activities were normalized to firefly luciferase activities. The bars represent the mean values of three independent tests (mean 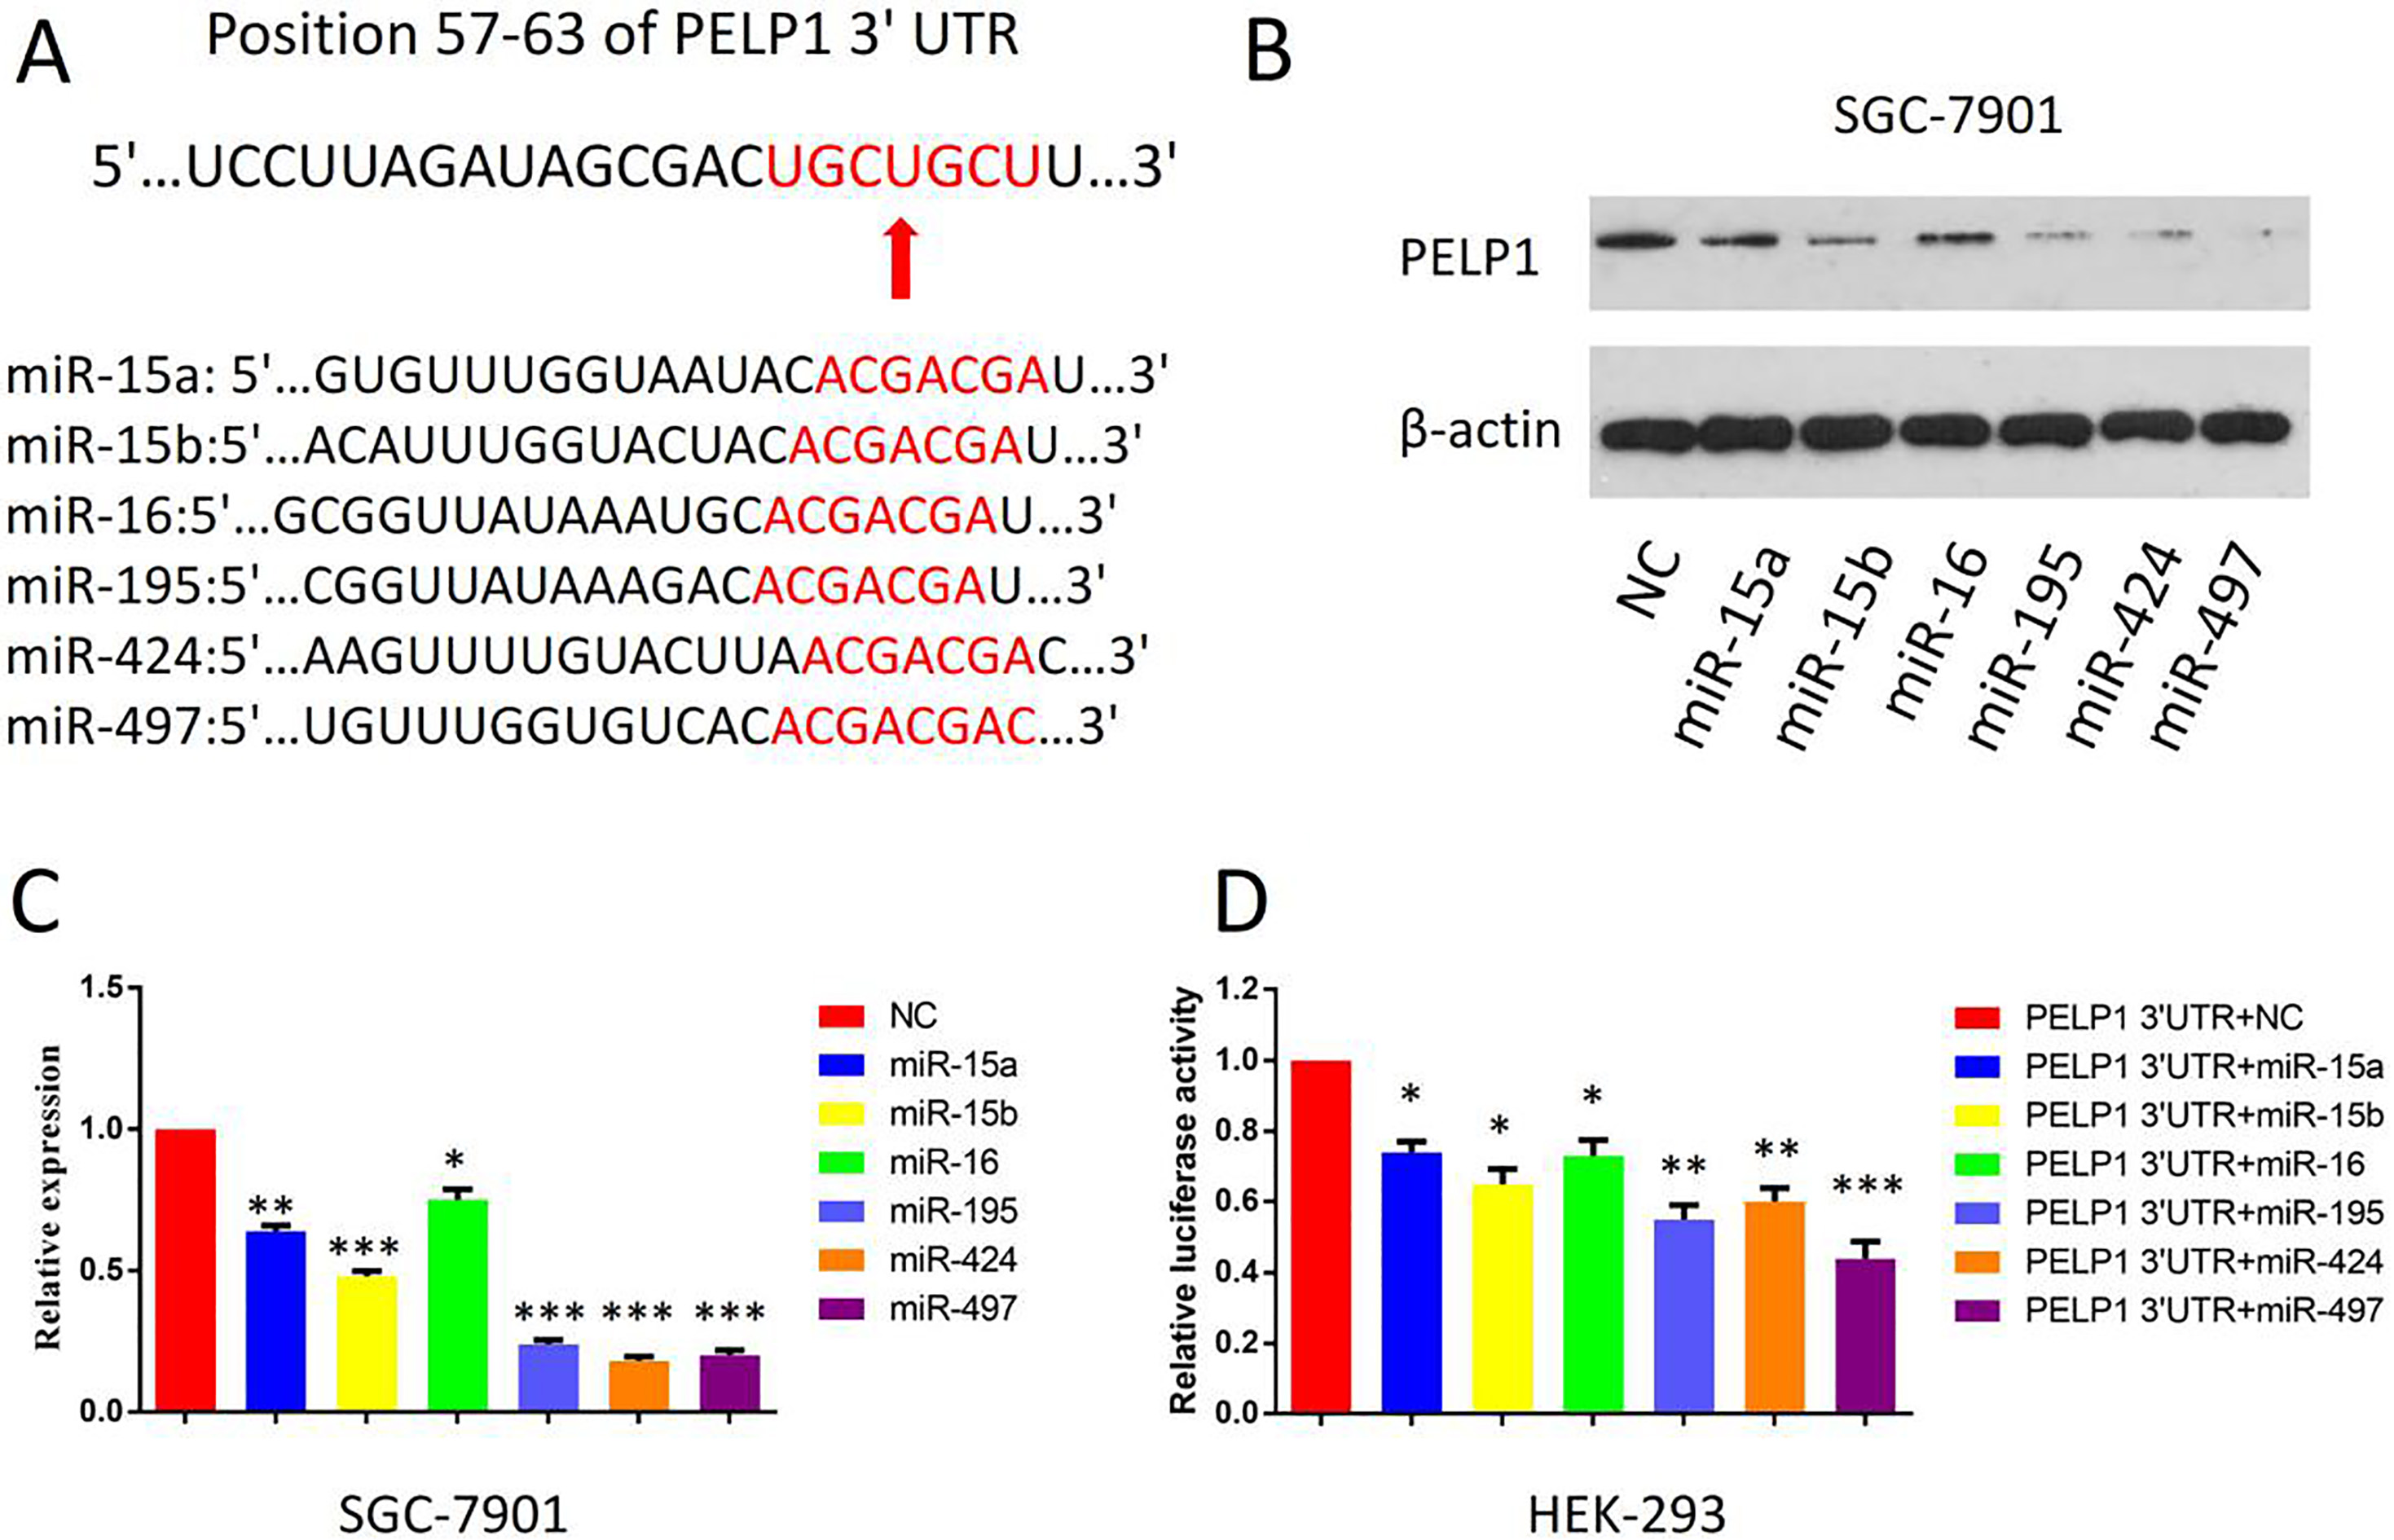
In order to confirm the correlation between the expression level of PELP1 and clinicopathologic factors in GC, the 80 cancerous samples mentioned above were classified into two groups according to the immunohistochemistry results and
Knockdown of PELP1 inhibited the proliferation, colony formation, anti-apopototic ability, migration and invasion of GC cells
Then we detected the cytological effect of PELP1. PELP1 was knocked down in GC cell lines SGC-7901 and AGS. Western-blot was used to verify the knockdown efficiency (Fig. 3A). Firstly, we used CCK-8 assay to compare the cell proliferation rate of PELP1 knockdown cells compared with the control groups. As shown (Fig. 3B), the growth rates of PELP1 knockdown SGC-7901 cell and AGS cell were both decreased versus those of control groups. To confirm the effect of PELP1 on the proliferation of GC cells, colony formation assay was also conducted in the two cell lines mentioned above. The colonies numbers in the PELP1 knockdown group were significantly less than the control groups in both cell lines (Fig. 3C), suggesting that PELP1 overexpression would promote the colony forming ability of single GC cell. We also examined the effects of PELP1 knockdown on GC cell apoptosis. H
PELP1 was a direct target of miR-15 family members.
Another issue remained to be solved, in not only GC but also other cancers, is the high expression mechanism of PELP1 in cancer tissues. MicroRNAs contribute importantly to gene expression regulation. It would be interesting to determine whether or not PELP1 expression could be regulated by miRNAs in GC. TargetScan database was searched for potential microRNAs that are complementary to the 3’-UTR of PELP1 (Fig. 5A). As shown, the potential miRs includes miR-15a, miR-15b, miR-16, miR-195, miR-424 and miR-497, which are all members of miR-15 family. After transfection with these miRs (100 nM) respectively, we observed that the PELP1 was significantly reduced on both protein level and mRNA level in SGC-7901 cells (Fig. 5B and C). We also found that these miRs can suppress reporter gene activity of PELP1 in HEK293 cells (Fig. 5D). These data suggested that PELP1 was a direct target of miR-15 family members. Our results supported the idea that PELP1 expression was negatively regulated by miR-15 family members in GC, which partly explained the high expression mechanism of PELP1 in cancer tissues.
Discussion
PELP1 was originally found to be abundant in the estrogen receptor-positive mammary epithelium and was subsequently confirmed to be a regulatory molecule in the transduction of SR downstream signaling pathways [12]. It can promote or inhibit signal transduction downstream of SR depending on the type of cell and the amount of ligand expression [12, 13]. For example, the endogenous glucocorticoid receptor is highly expressed in the non-small cell lung cancer cell line A549, and PELP1 inhibits glucocorticoid receptor-mediated signal transduction [13]; on the contrary, in HEK293 cells with low receptor expression of endogenous glucocorticoid, PELP1 enhances signal transduction of the ligand-activated glucocorticoid receptor signaling pathway [13]. PELP1 can bind to a variety of SR transcriptional co-activator molecules, such as CREB binding protein (CBP) [14]. It can also act as an “intermediate”, allowing co-regulatory factors that cannot directly bind to SR to form complexes with SR. Examples are that: PELP1 can help androgen receptor (AR) and four and half lens intrinsic membrane protein 2 (FHL2) to form a transcriptional complex that regulates the expression of downstream genes [15]. Although PELP1 is mainly located at the nucleus, it also exerts important physiological functions in cytoplasmic localization. In the cytosol, for example, PELP1 can promote the binding of ER to Src kinase [16]. Mutation of PELP1 will disrupt the binding of ER to Src, leading to disorder of MAPK signaling pathway [16]. Overexpression of PELP1 in the cytosol results in non-hormone-dependent activation of the MAPK and AKT signaling pathways [16]. PELP1 also regulates chromatin modification. It can recruit proteins with histone modifications to alter the nature and structure of chromatin. For example, PELP1 may bind to lysine (K)-specific demethylase 1A (KDM1) or coactivator-associated arginine methyltransferase 1 (CARM1), which can mediate the epigenetic modification of KDM1 and CARM1 to the histone H3 in gene promoter region [17, 18].
The key role of PELP1 in signal transduction and epigenetic modification confers its ability to participate in the regulation of cell proliferation, apoptosis, migration and other functions, making it a key tumor-related molecule. For instance, PELP1 induces aromatase synthesis and facilitates estrogen production to promote ER-dependent proliferation of breast cancer cell lines [19]; PELP1 mediates phosphorylation of Ser807 and Ser811 in retinoblastoma protein (Rb), which activates the latter, advances cell cycle progression and promotes cell proliferation [20]; PELP1 regulates phosphorylation of p53, and its deletion will result in abnormal response of p53 signaling pathway to stress, leading to apoptosis [21]; and PELP1 can also regulate microRNA expression, including microRNAs such as miR-200 and miR-141 related to tumor cell metastasis [22]. In this study, we found that PELP1 was highly expressed in gastric cancer tissues. Our results also showed that all kinds of malignant phenotypes of cells were significantly inhibited. Our data suggested that PELP1 played an important role in the progression of gastric cancer, but its specific mechanism remains to be further explored.
MiR-15 family of miRNAs play an important role in tumor biology [23]. The miR-15 family includes miR-15a, miR-15b, miR-16, miR-195, miR-424 and miR-497 [23, 24]. In gastric cancer, miR-15b and miR-16 modulate multidrug resistance of GC cells by targeting BCL2 [25]; miR-195 inhibits tumorigenesis of GC through suppressing basic fibroblast growth factor [26]. All the members of miR-15 family are reported to be down-regulated in GC tissue [25, 26, 27, 28]. In this study, we validated that miR-15 family members can directly target the 3’UTR region of PELP1. Collectively. these results implied that there may be a negative relationship between miR-15 family members and PELP1, and the down-regulation of the miRs may lead to the aberrant high expression of PELP1 in GC. Intriguingly, miR-15 family members are also significantly down-regulated in other cancers [29, 30, 31], which also hints a similar explanation that why PELP1 is highly expressed in these cancers.
In conclusion, we demonstrated that PELP1, negatively modulated by miR-15 family members, is an oncogene of GC associated with patients’ prognosis. It may function as a potential biomarker and therapeutic target for this deadly disease.
Footnotes
Acknowledgments
This work was supported by a grant from Natural Science Foundation of Central Hospital of Linyi (No.16038).
Conflict of interest
The authors declare that they have no competing interest.