
Abstract
S100 family is made up of at least 20 calcium-binding proteins which are involved in many cellular processes. The prognostic values of individual S100 member in ovarian cancer patients are still unknown. In this study, we performed a detailed prognostic values of S100 in ovarian cancer. The mRNA expression levels of S100 family in various cancers were analyzed via the Oncomine, and the protein-protein interaction network of S100 family was analyzed via String. The prognostic values of individual S100 member were evaluated via Kaplan-Meier Plotter. The S100 family genes expression and mutation were analyzed via cBioProtal. We observed that the mRNA expression of most S100 family were overexpressed in ovarian cancer compared with normal tissues. In survival analysis in Kaplan-Meier Plotter, 10 members of S100 family showed significant correlation with overall survival in ovarian cancer patients. The trends of high expression of individual S100 members were nearly the same in different subtype and pathological grades. However, the S100 family genes expression and mutation showed no significant prognostic values in overall survival and disease free survival in ovarian cancer patients. Although, the results need more verification both in clinical trials and fundamental experiments, our study provide new insights for the prognostic function of S100 family in ovarian cancer and might promote development of S100 targeted inhibitors for the new treatment of ovarian cancer.
Introduction
Ovarian cancer is a high mortality disease in females, which leads to 5% death of female cancer worldwide [1]. The average lifetime risk of occurring ovarian cancer reaches 1.3%, the quivalent of 1 in 78 women [2]. Now, with the development of the diagnostic techniques, we have more method to diagnosis the early stage of ovarian cancer. It would greatly prolong the patients’ life span and quality of life with the appropriate treatment.
In the 1965, Moore reported the S100 calcium binding protein family. As far, S100 family have been identified more than 25 members which involved in many biological processes [3]. Many studies indicated that some of S100 family members play an important role in the occurrence and development of cancer. Recently, some studies indicated that S100B, S100A11, S100A7, S100A4, S100A1 were related to metastasis in ovarian cancer [4, 5, 6, 7, 8]. The expression of S100 family may predict the stage and grade of ovarian cancer, although it has not been reported.
The Kaplan-Meier (KM) plotter database was generated using gene expression data and survival information downloaded from Gene Expression Omnibus (GEO) (
Materials and methods
Oncomine analysis
We used Oncomine gene expression array data- base (
Integration of protein-protein interaction (PPI) network, significant candidate genes and pathway identification
We used STRING database (
Kaplan-meier plotter database analysis
We used the KM Plotter (
TCGA data and cBioPortal
We used The Cancer Genome Atlas (TCGA) which had both sequencing and pathological data on 30 different cancers [12]. The ovarian Serous Cystadenocarcinoma (TCGA, PanCancer Atlas) dataset including data from 1766 cases with pathology reports was selected for further analyses of S100 family using cBioPortal (
The significant changes of S100 members expression in transcription level between different types of ovarian cancer and ovarian tissues (ONCOMINE database)
The significant changes of S100 members expression in transcription level between different types of ovarian cancer and ovarian tissues (ONCOMINE database)
The transcription levels of S100 members in different types of cancer. This graphic was generated from ONCOMINE, indicating the numbers of datasets with statistically significant (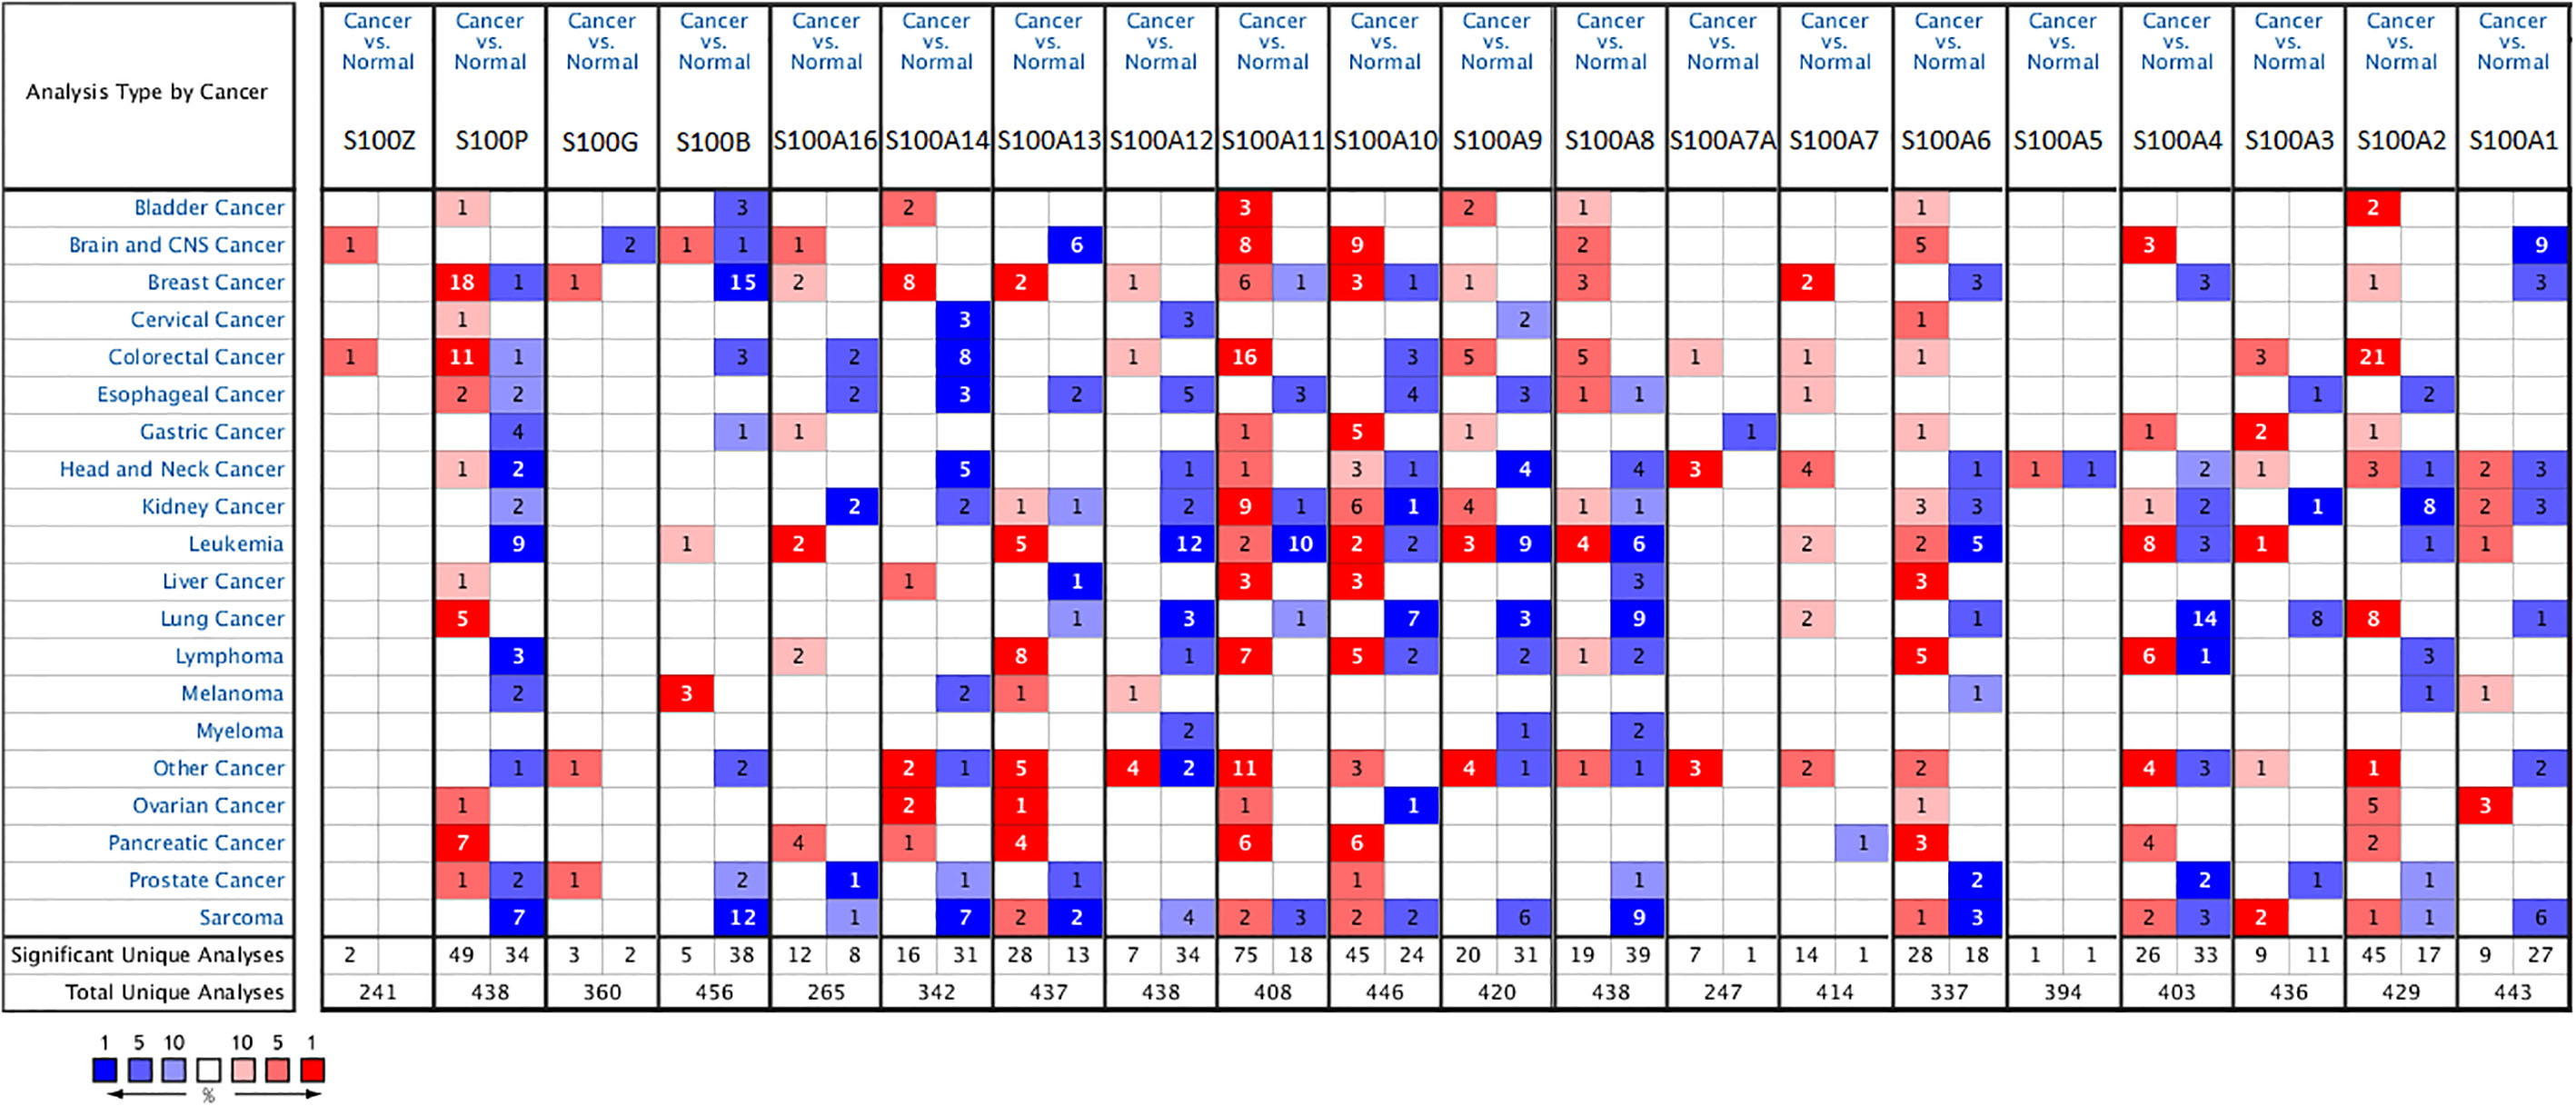
We used the Human Protein Atlas (
Results
The mRNA expression levels of S100 family in human cancers
To compare the mRNA expression differences of S100 family between tumor and normal tissues in multiple cancers, we used the online database Oncomine. As it shown in Fig. 1, the database contained a total of 241, 438, 360, 456, 265, 342, 437, 438, 408, 446, 420, 438, 247, 414, 337, 394, 403, 436, 429 and 443 analyses for S100Z, S100P, S100G, S100B, S100A16, S100A14, S100A13, S100A12, S100A11, S100A10, S100A9, S100A8, S100A7A, S100A7, S100A6, S100 A5, S100A4, S100A3, S100A2 and S100A1, respectively. The mRNA expression of S100P, S100A14, S100A11, S100A6, S100A2, S100A1 were found over-expression in patients with ovarian cancer, but it shown down-expression of S100A10 mRNA expression.
Then we used Oncomine to explore the genes expression of S100 family which had expression differences in ovarian carcinoma, as it shown in Table 1. In Hendrix’s dataset, we found that the mRNA expression of S100P increased in ovarian mucinous adenocarcinoma and ovarian clear cell adenocarcinoma, and S100A14 expression elevated in ovarian serous adenocarcinoma of Yoshihara’s dataset [15, 16]. The same trend was observed in ovarian mucinous adenocarcinoma of Hendrix’s dataset. According to Bonome’s dataset [17], the mRNA expression of S100A14, S100A13, S100A11, S100A6 and S100A1 in tumor tissue was up-regulated compared with normal tissues. Only expression of S100A10 in tumor tissue was decreased. Other S100 family members were indicated no significant differences between tumor and normal tissues.
Key candidate genes and pathways identification with S100 family protein-protein interaction network
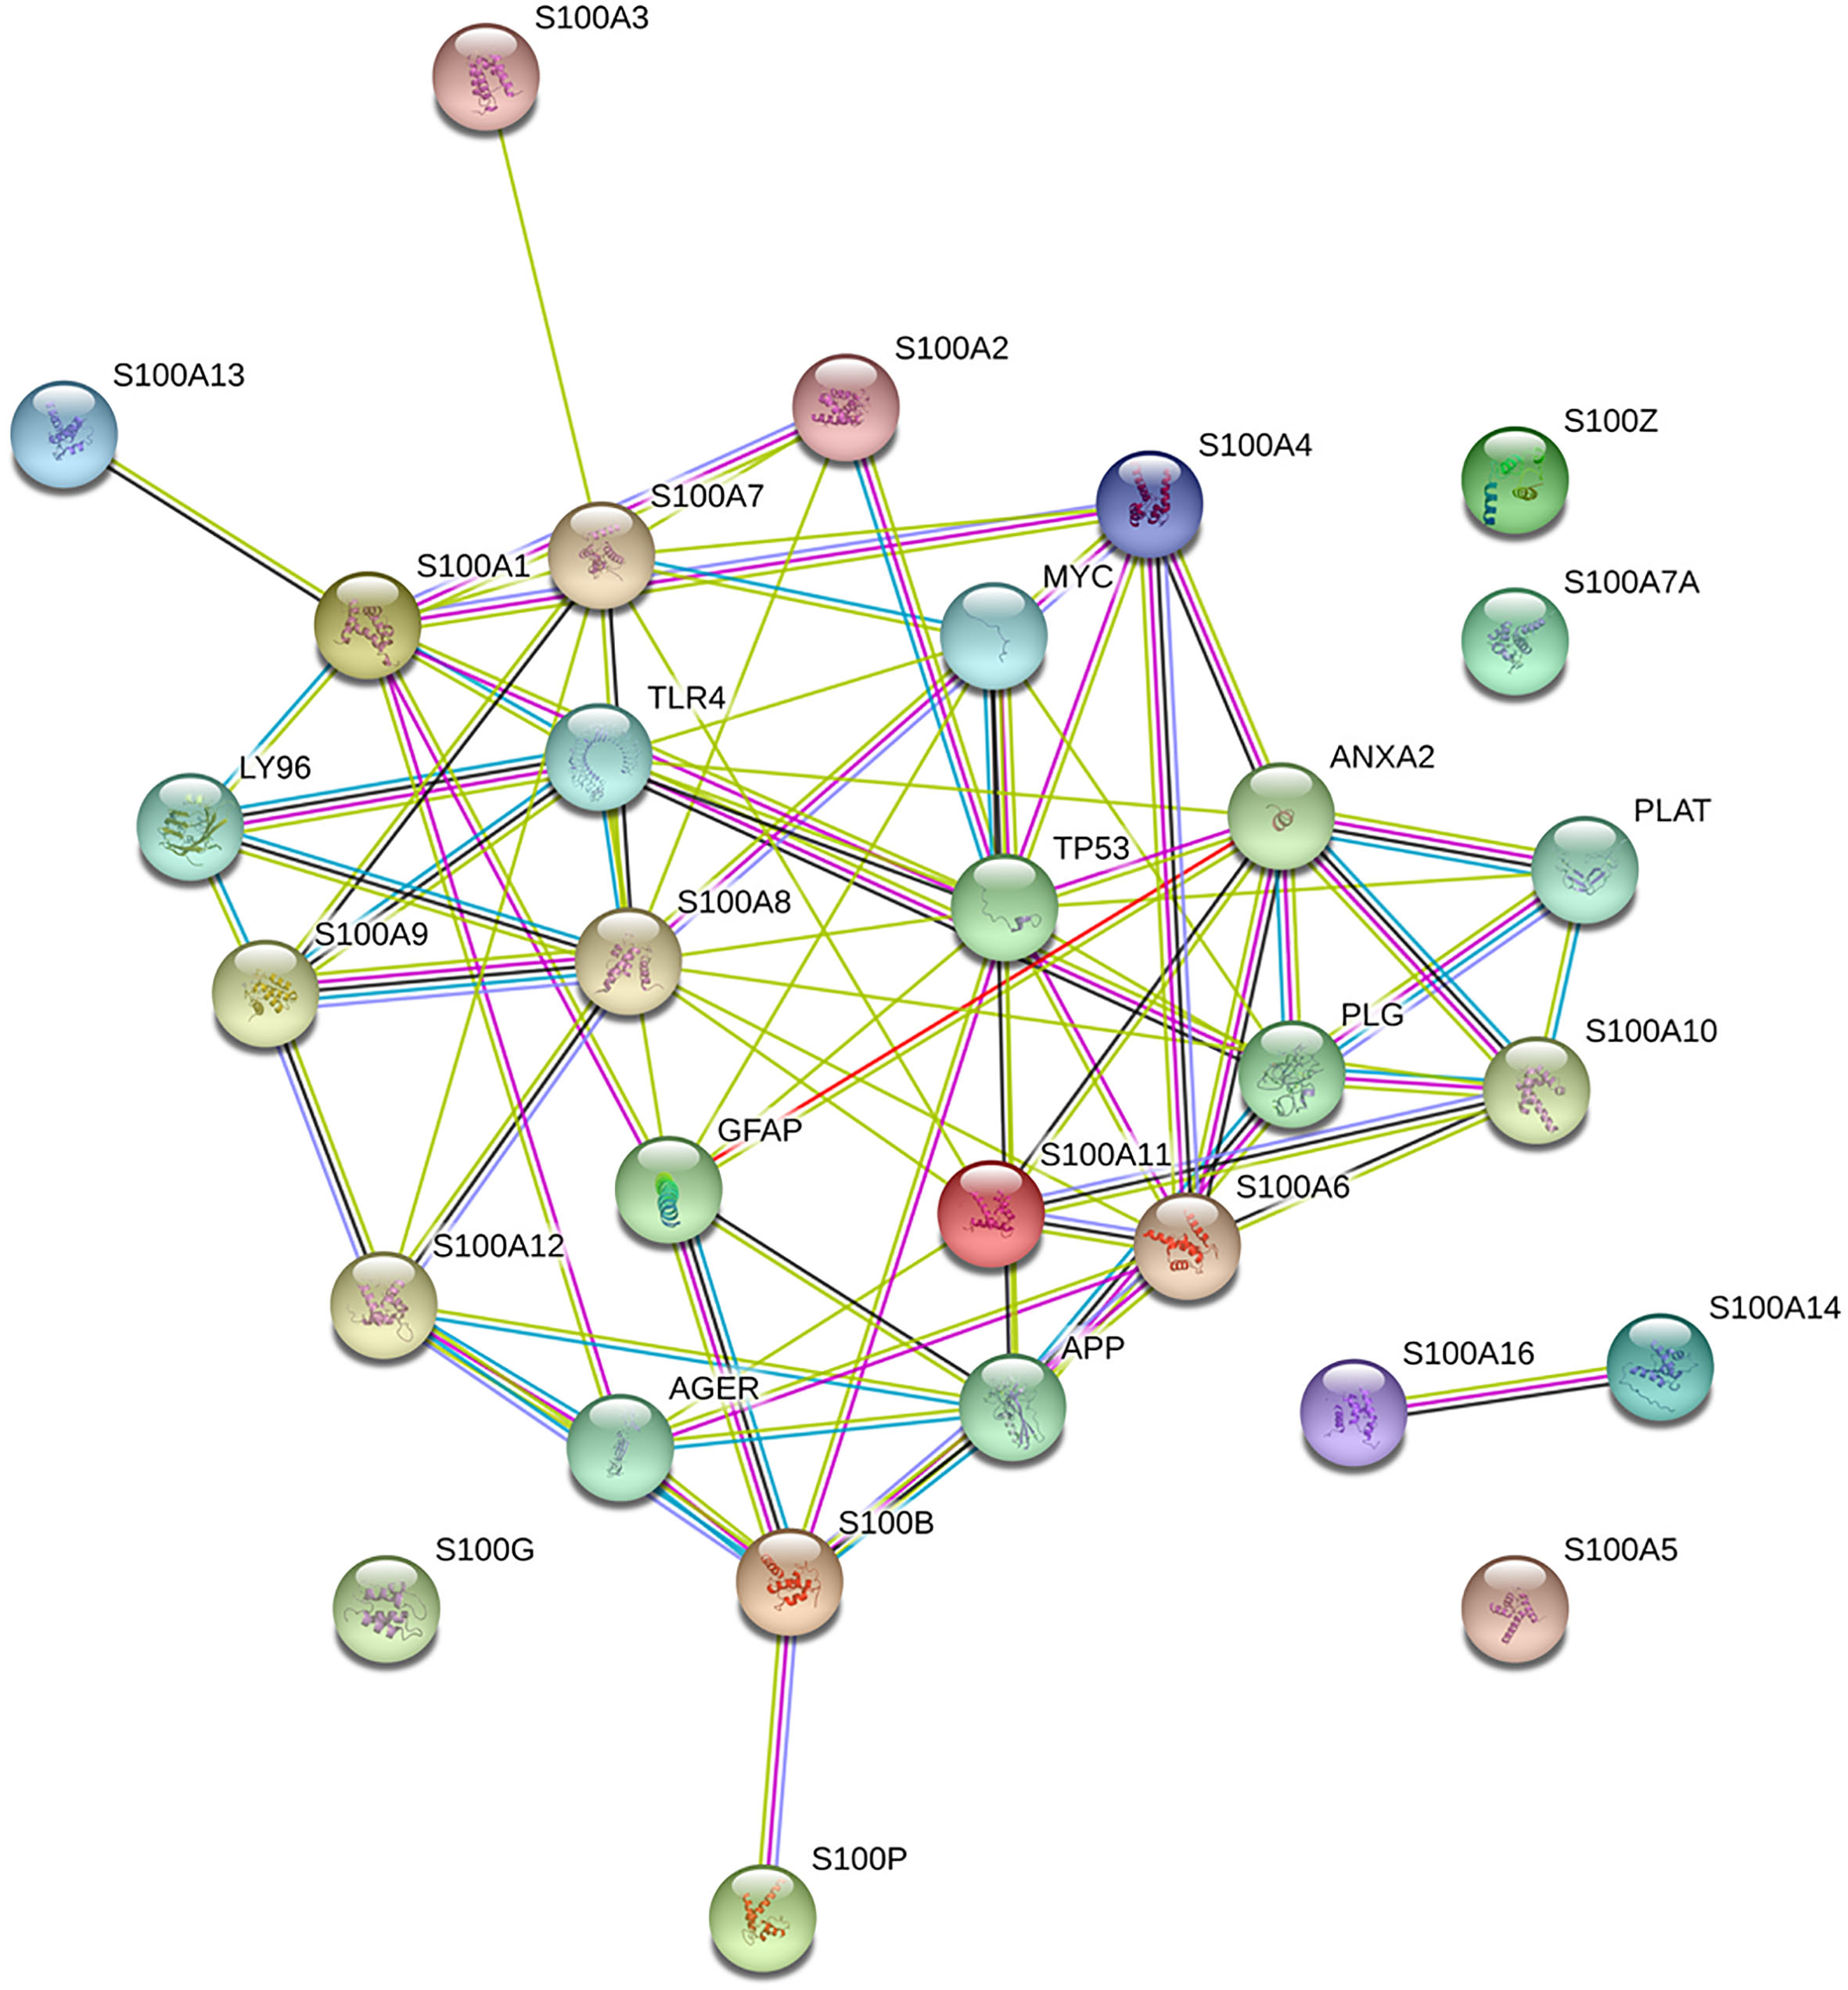
Using the STRING online database, total of 20 proteins of S100 family were filtered into the PPI network complex, containing 30 nodes and 77 edges, as it shown in Fig. 3.3. And the edges represent the protein-protein associations which has been known and predicted. Among 30 nodes, the most significant 10 node degree genes were ANXA2, GFAP, TP53, PLG, APP, AGER, PLAT, LY96, TLR4 and MYC. Pathway enrichment analysis showed that the PPI mainly associated with regulation of response to external stimulus, positive regulation of response to external stimulus and regulation of fibroblast proliferation, as it shown in Supplement Table 1.
Prognostic values of S100 members in all ovarian patients
We used KM Plotter to determine whether S100 family is associated with the prognosis of ovarian cancer patients. OS, PFS and PPS were studied for each gene respectively. Higher S100G, S100A13, S100A6, S100A5, S100A3 and S100A1 were related to better OS, as it shown in Fig. 3B, C, G–K. On the contrary, higher S100A11, S100A10, S100A7A and S100A2 implied worse OS, as it shown in Fig. 3D–J. All the
Correlation of S100 family with different pathological grade status of ovarian cancer
Correlation of S100 family with different pathological grade status of ovarian cancer
S100 family protein-protein interaction (PPI) network complex and modular analysis. Using the STRING online database, total of 30 proteins were filtered into the PPI network complex. The module consists of 30 nodes and 77 edges, which are mainly associated with regulation of response to external stimulus, positive regulation of response to external stimulus, regulation of fibroblast proliferation. The blue and purple connections are known interactions, the blue one means the interactions were from curated databases and the purple one means the interactions were determined experimentally. Besides, the green, red and deep blue connections are predicted interactions, the green one means the interactions were from gene neighborhood, the red one were from gene fusions and the deep blue one were from the gene co-occurrence.
The prognostic value of mRNA level of S100 members in ovarian cancer patients (OS in Kaplan-Meier plotter). (A)Prognostic HRs of individual S100 members in all ovarian cancer. (B-K) Survival curves of S100G (Affymetrix ID: 207885_at), S100A13 (Affymetrix ID: 202598_at), S100A11 (Affymetrix ID: 208540_at), S100A10 (Affymetrix ID: 200872_at), S100A7A (Affymetrix ID: 232170_at), S100A6 (Affymetrix ID: 217728_at), S100A5 (Affymetrix ID: 207763_at), S100A3 (Affymetrix ID: 206027_at), S100A2 (Affymetrix ID: 204268_at), S100A1 (Affymetrix ID: 205334_at). 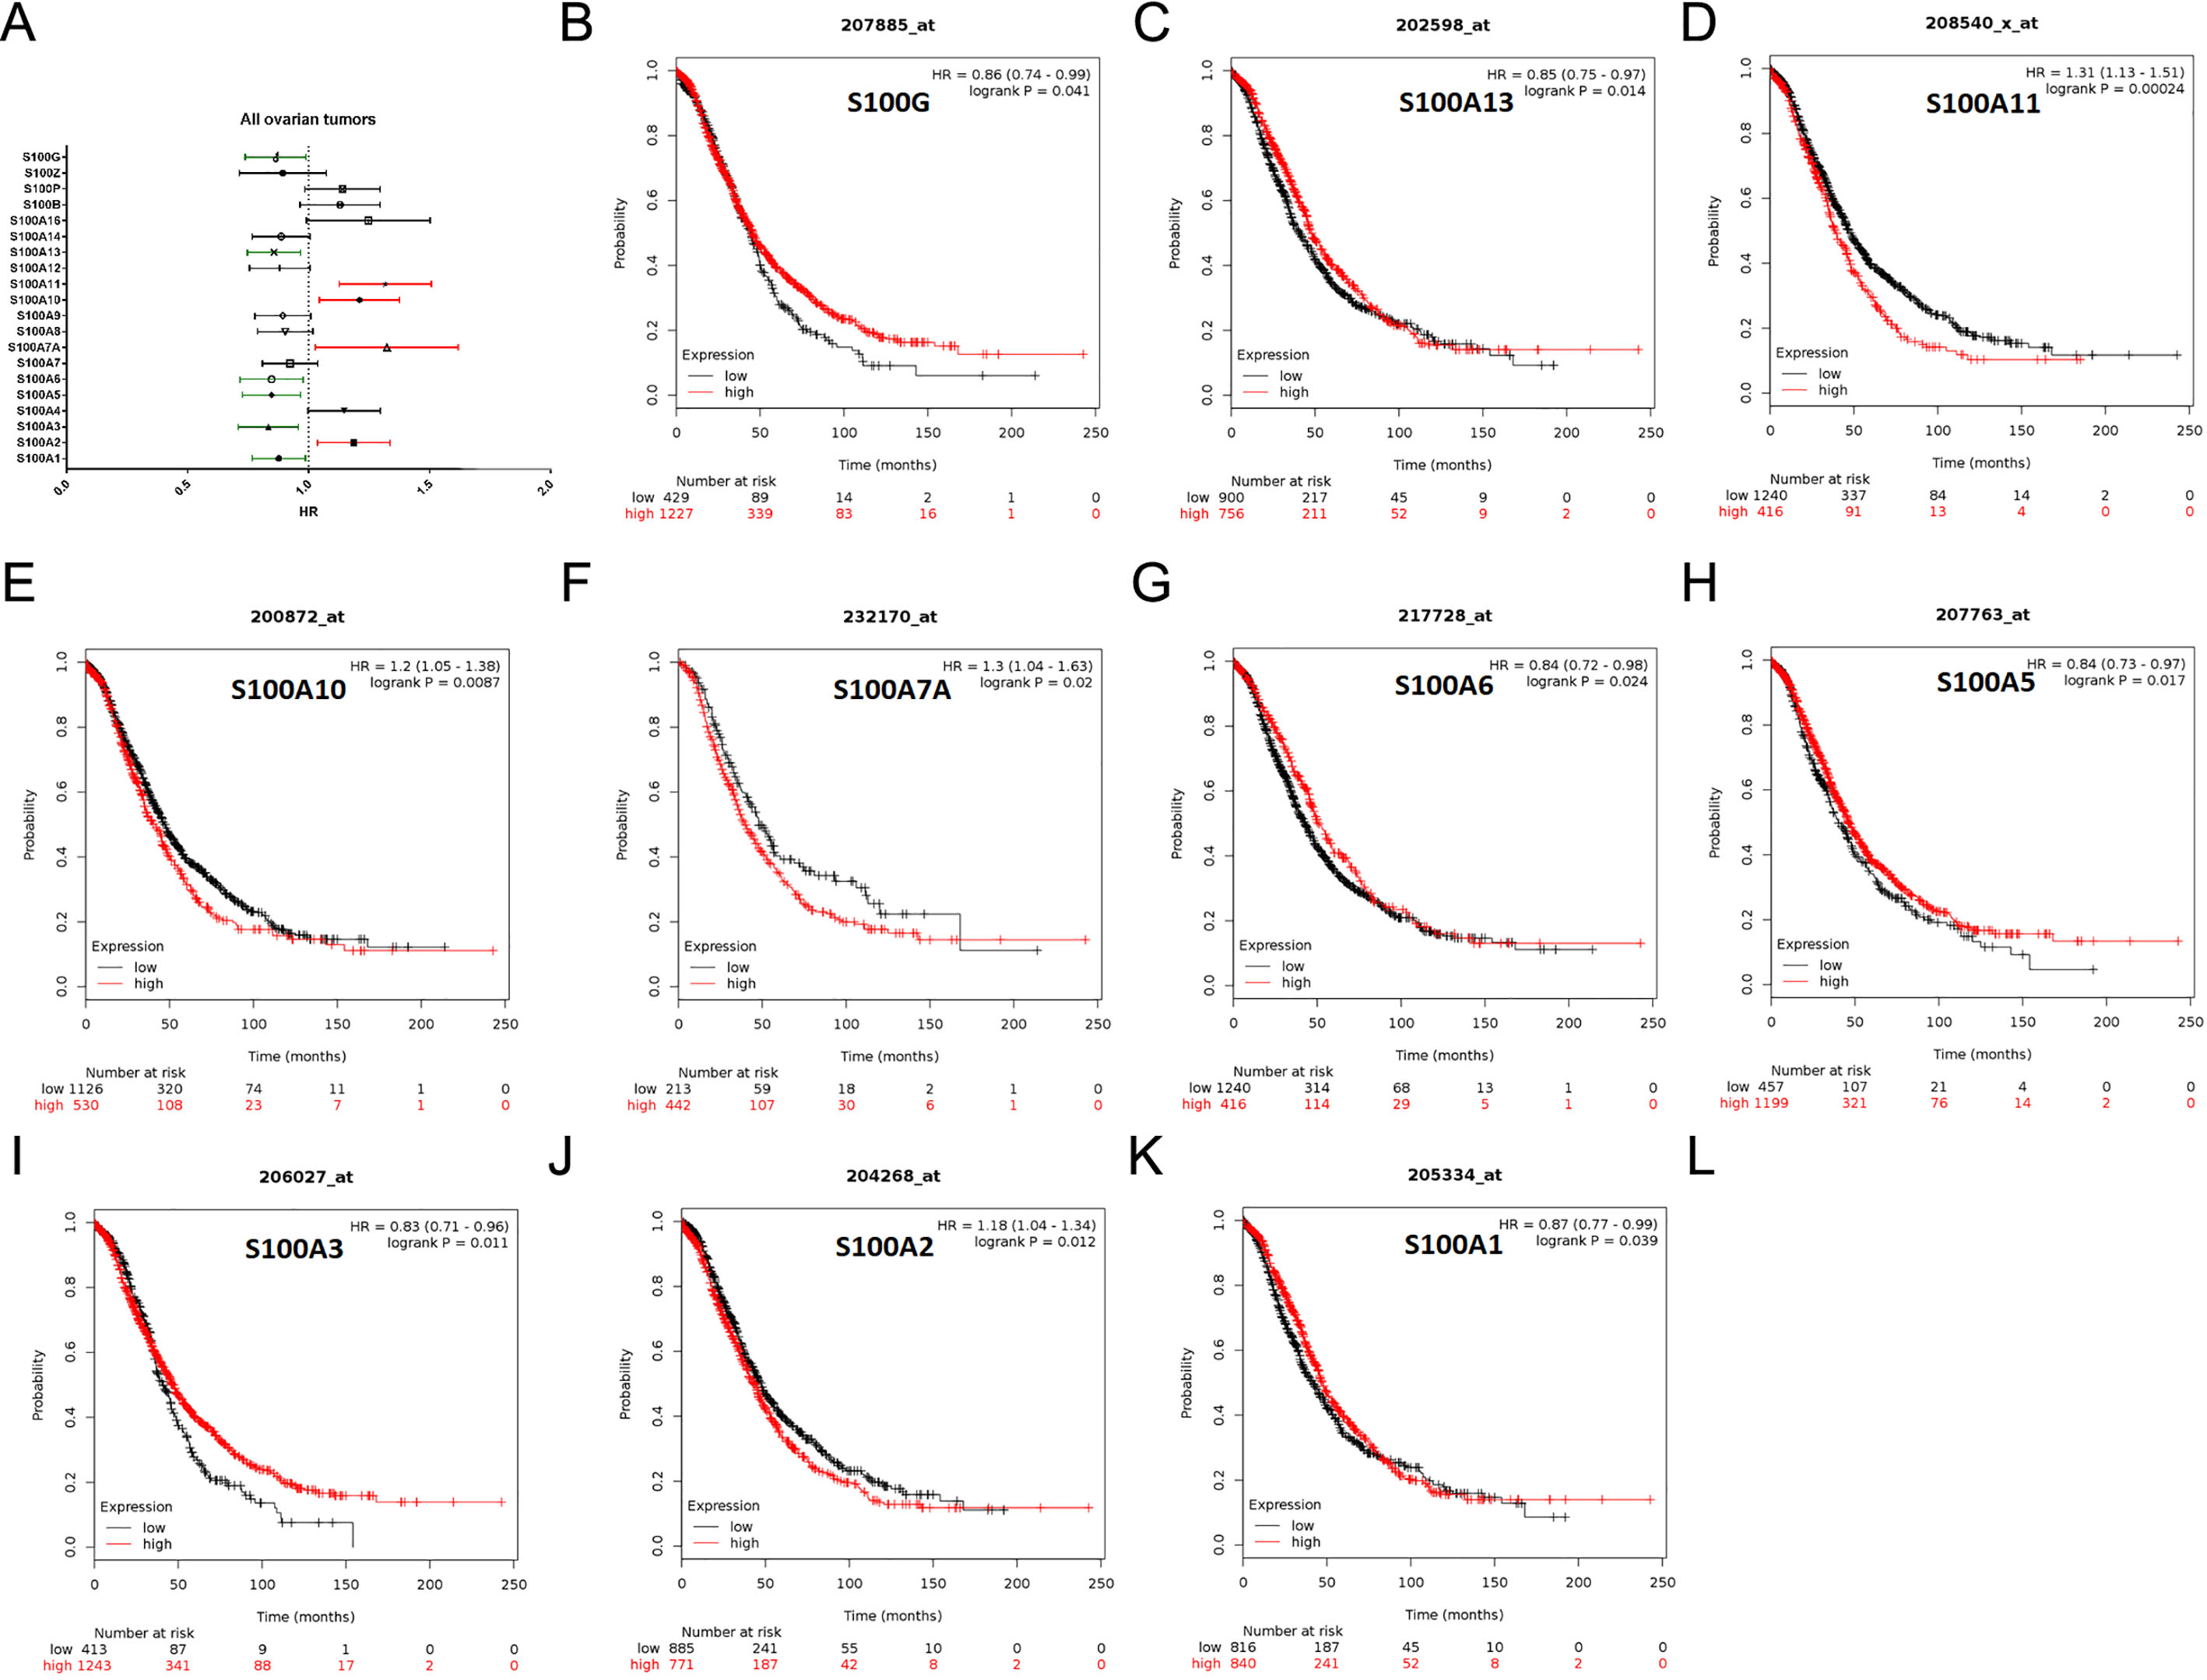
The prognostic value of mRNA level of S100 members in different subtype of ovarian cancer patients (OS in Kaplan-Meier plotter). (A-C) Survival curves of S100G (Affymetrix ID: 207885_at), S100A13 (Affymetrix ID: 202598_at), S100A12 (Affymetrix ID: 205863_at) are plotted for endometrioid type ovarian cancer (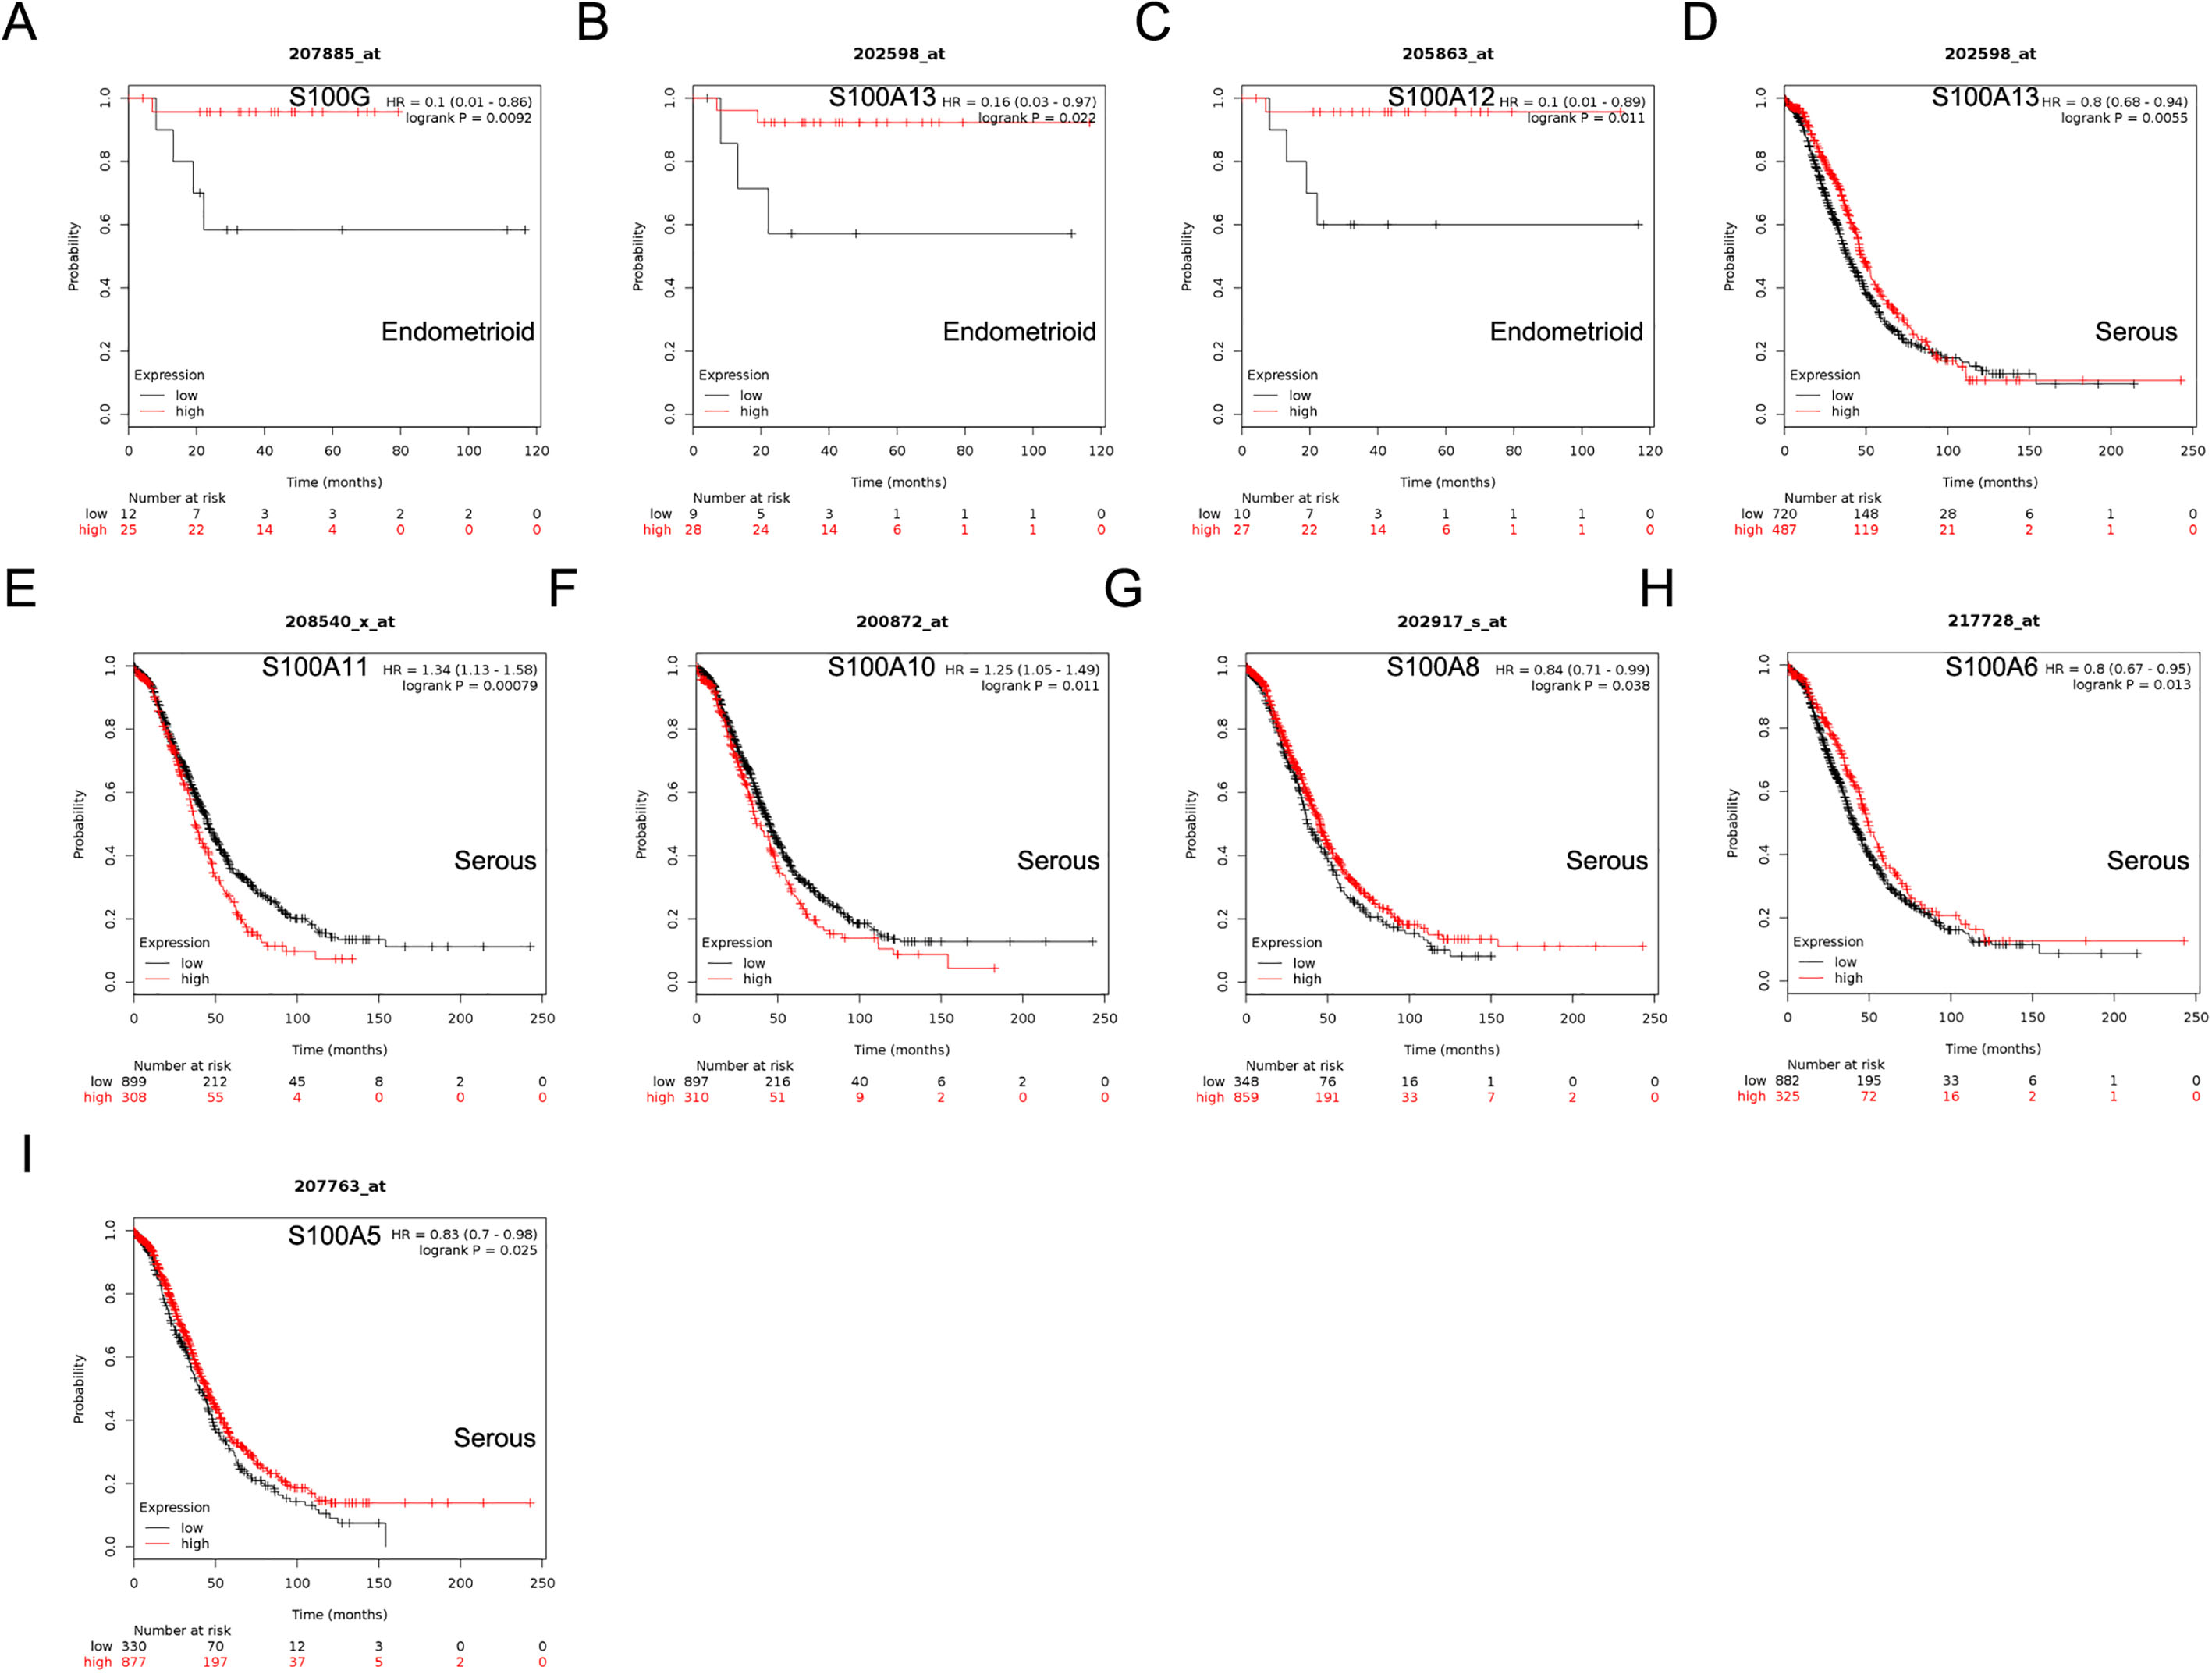
Correlation of S100 members with different P53 status of ovarian cancer patients. (A-I) Survival curves of S100P (Affymetrix ID: 204351_at), S100G (Affymetrix ID: 207885_at), S100B (Affymetrix ID: 209686_at), S100A14 (Affymetrix ID: 218677_at), S100A12 (Affymetrix ID: 205863_at), S100A11 (Affymetrix ID: 208540_x_at), S100A8 (Affymetrix ID: 214370_at), S100A7A (Affymetrix ID: 232170_at), S100A4 (Affymetrix ID: 203186_s_at) are plotted for P53 mutated ovarian cancer (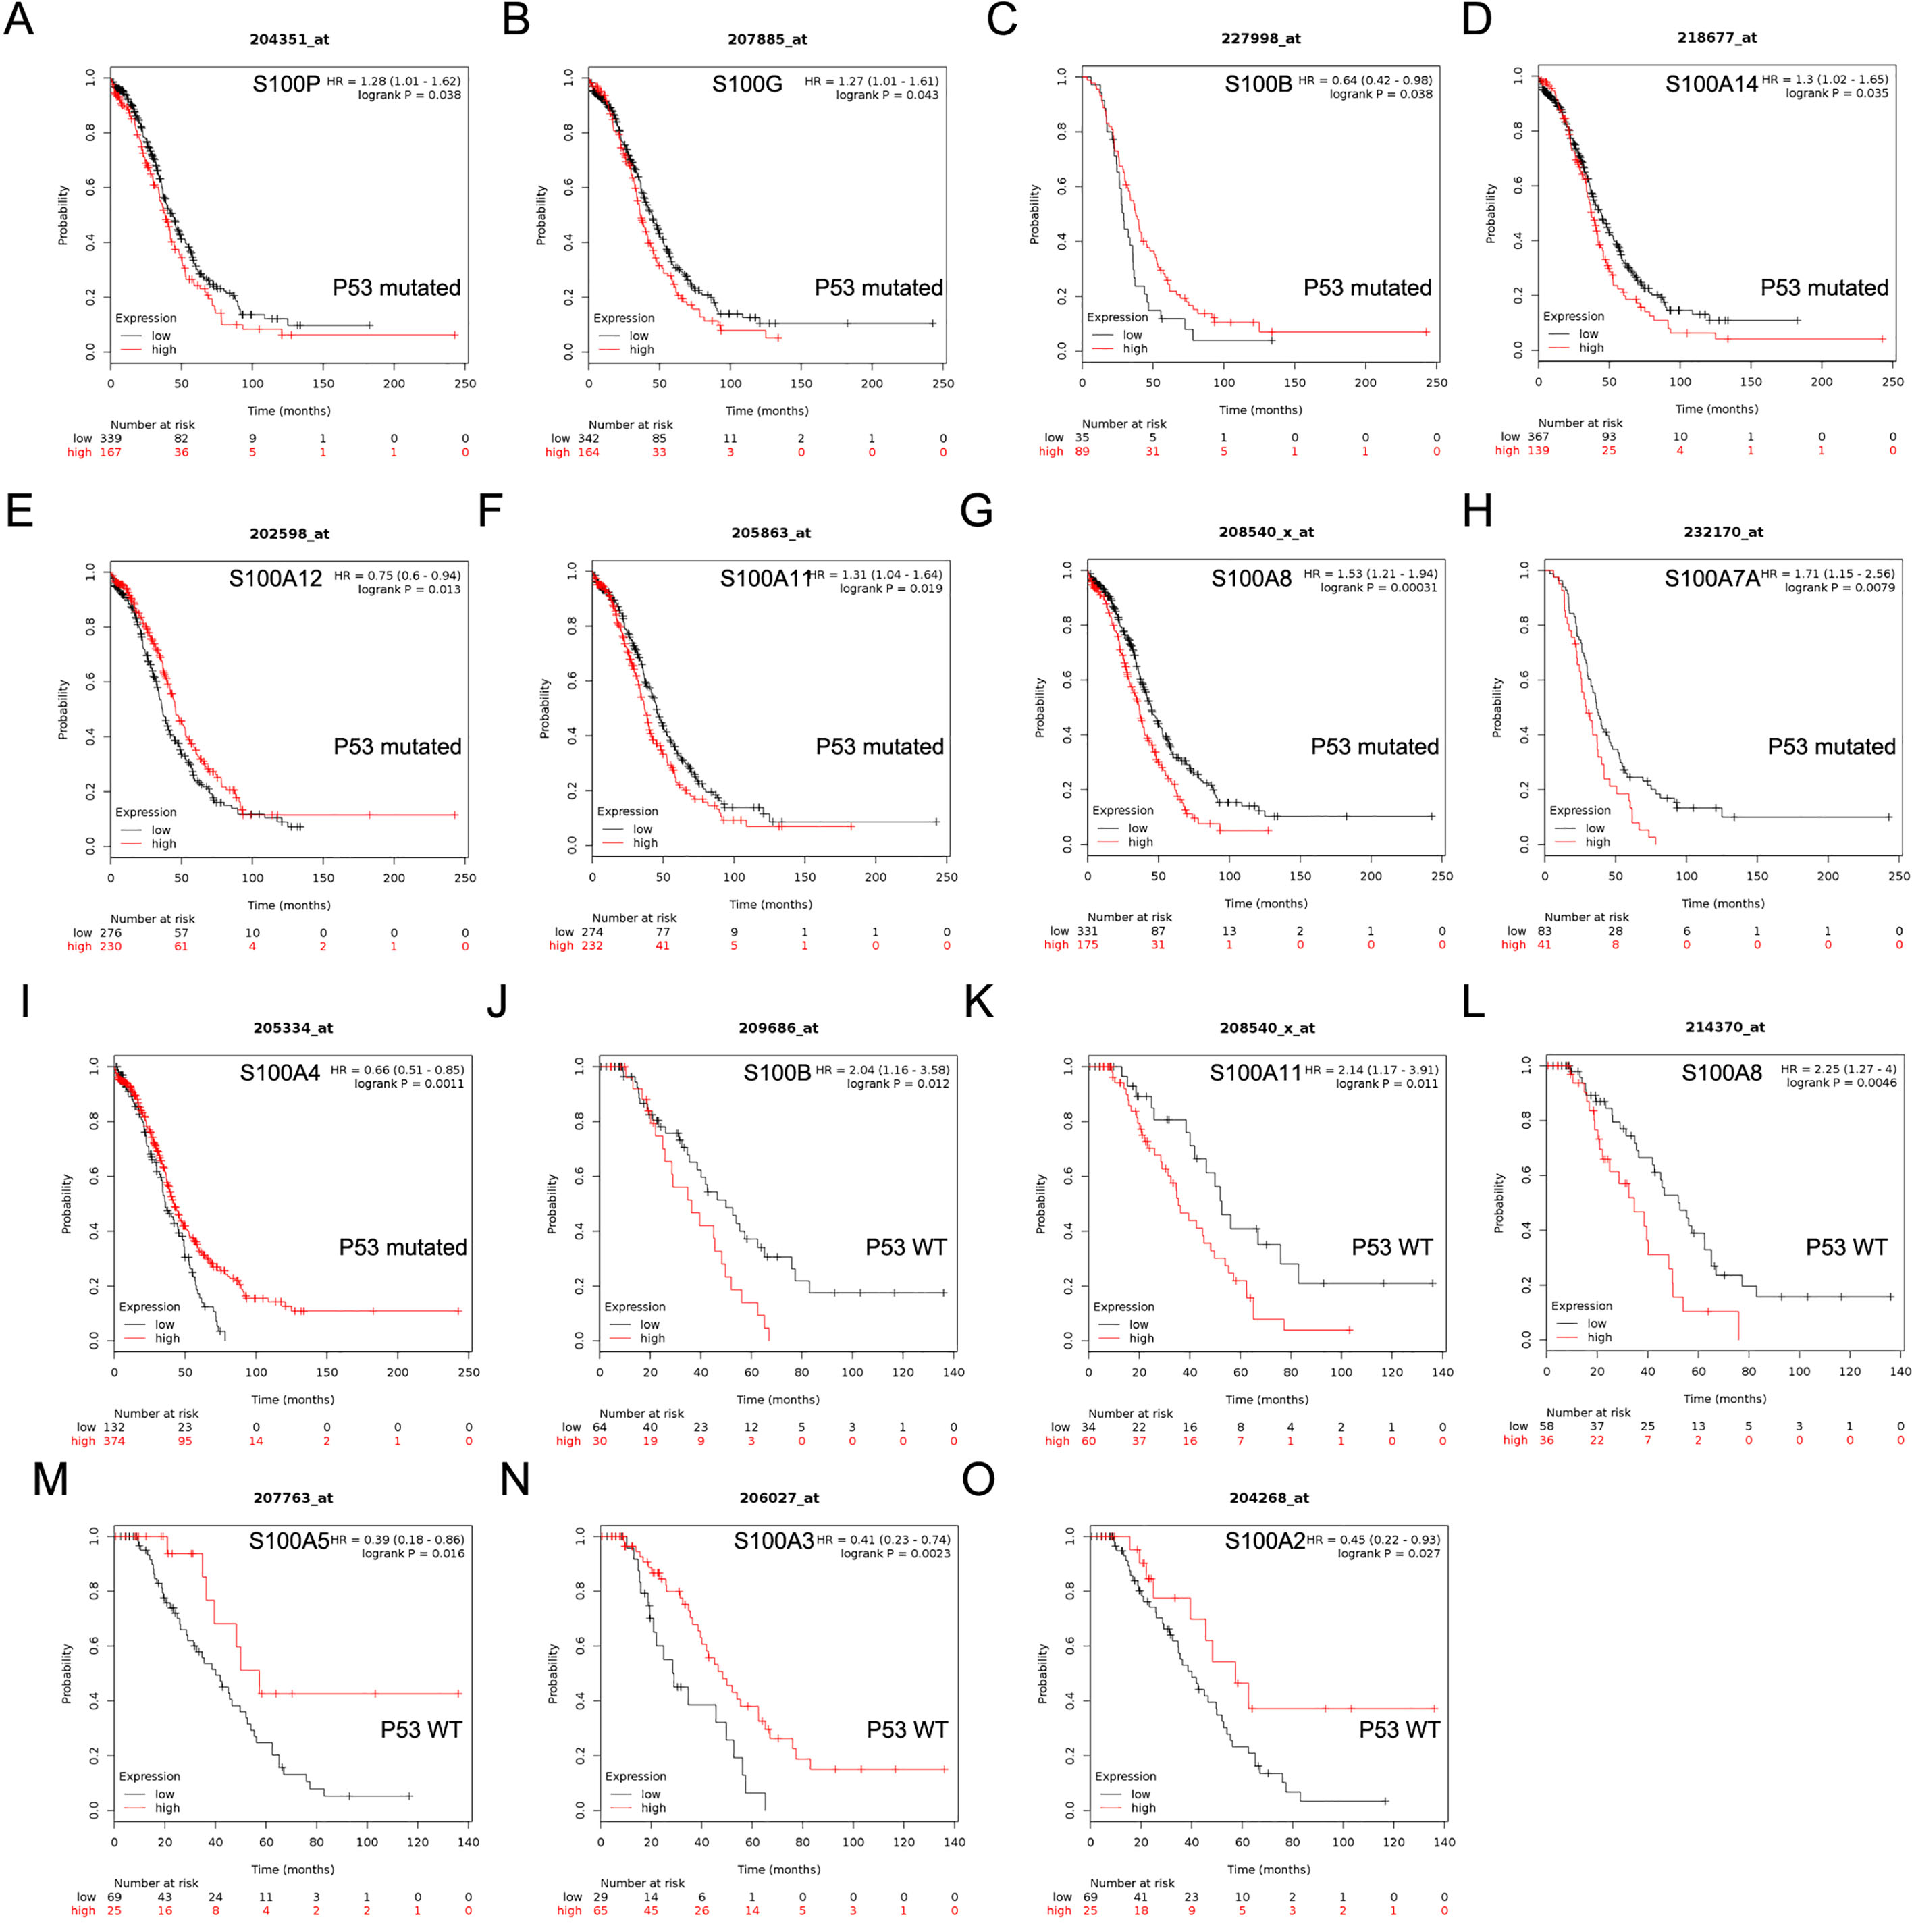
S100 family genes expression and mutation analysis in ovarian serous cystadenocarcinoma (cBioPortal). (A) Kaplan-Meier plots comparing OS in cases with/without S100 alterations. (B) Kaplan-Meier plots comparing DFS in cases with/without S100 alterations. (C) Oncoprint in cBioPortal represented the proportion and distribution of samples with alterations in S100 factors. The figure was cropped on the right to exclude samples without alterations.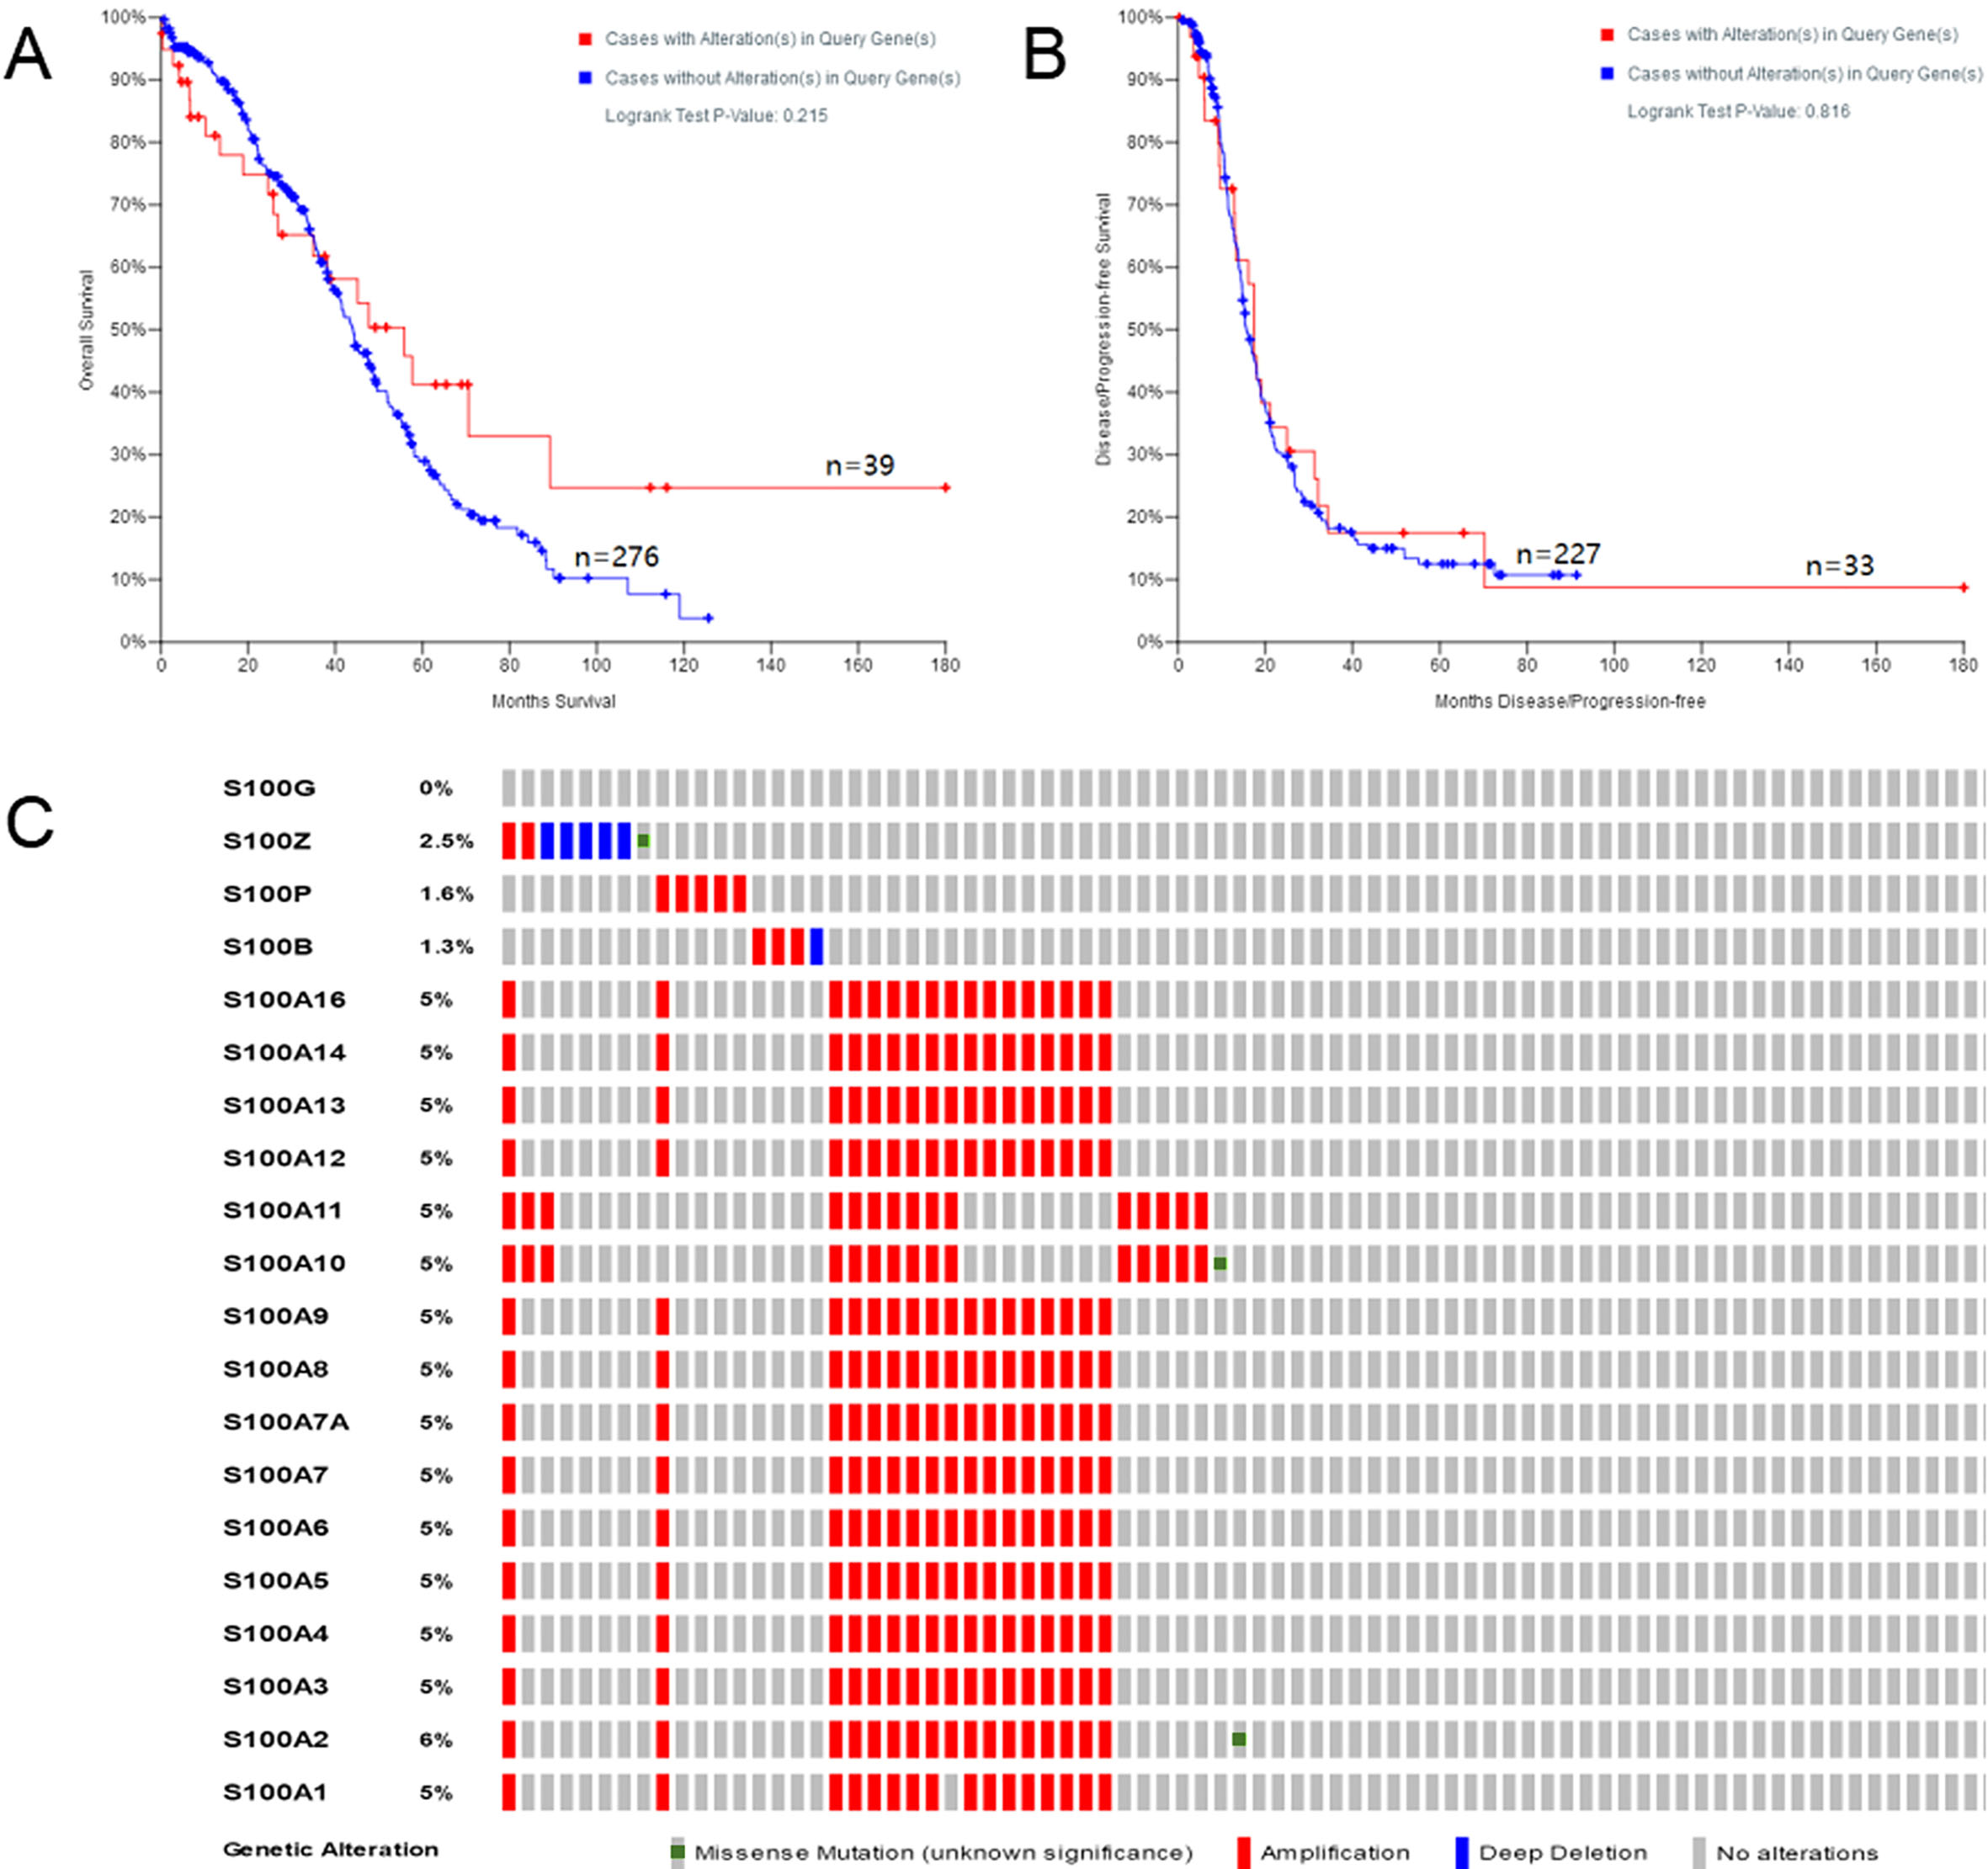
Representative IHC staining in ovarian cancer tissue. (A) IHC staining of S100P. (B) IHC staining of S100A13. (C-D) IHC staining of S100A10. (E) IHC staining of S100A6. Original magnification 50 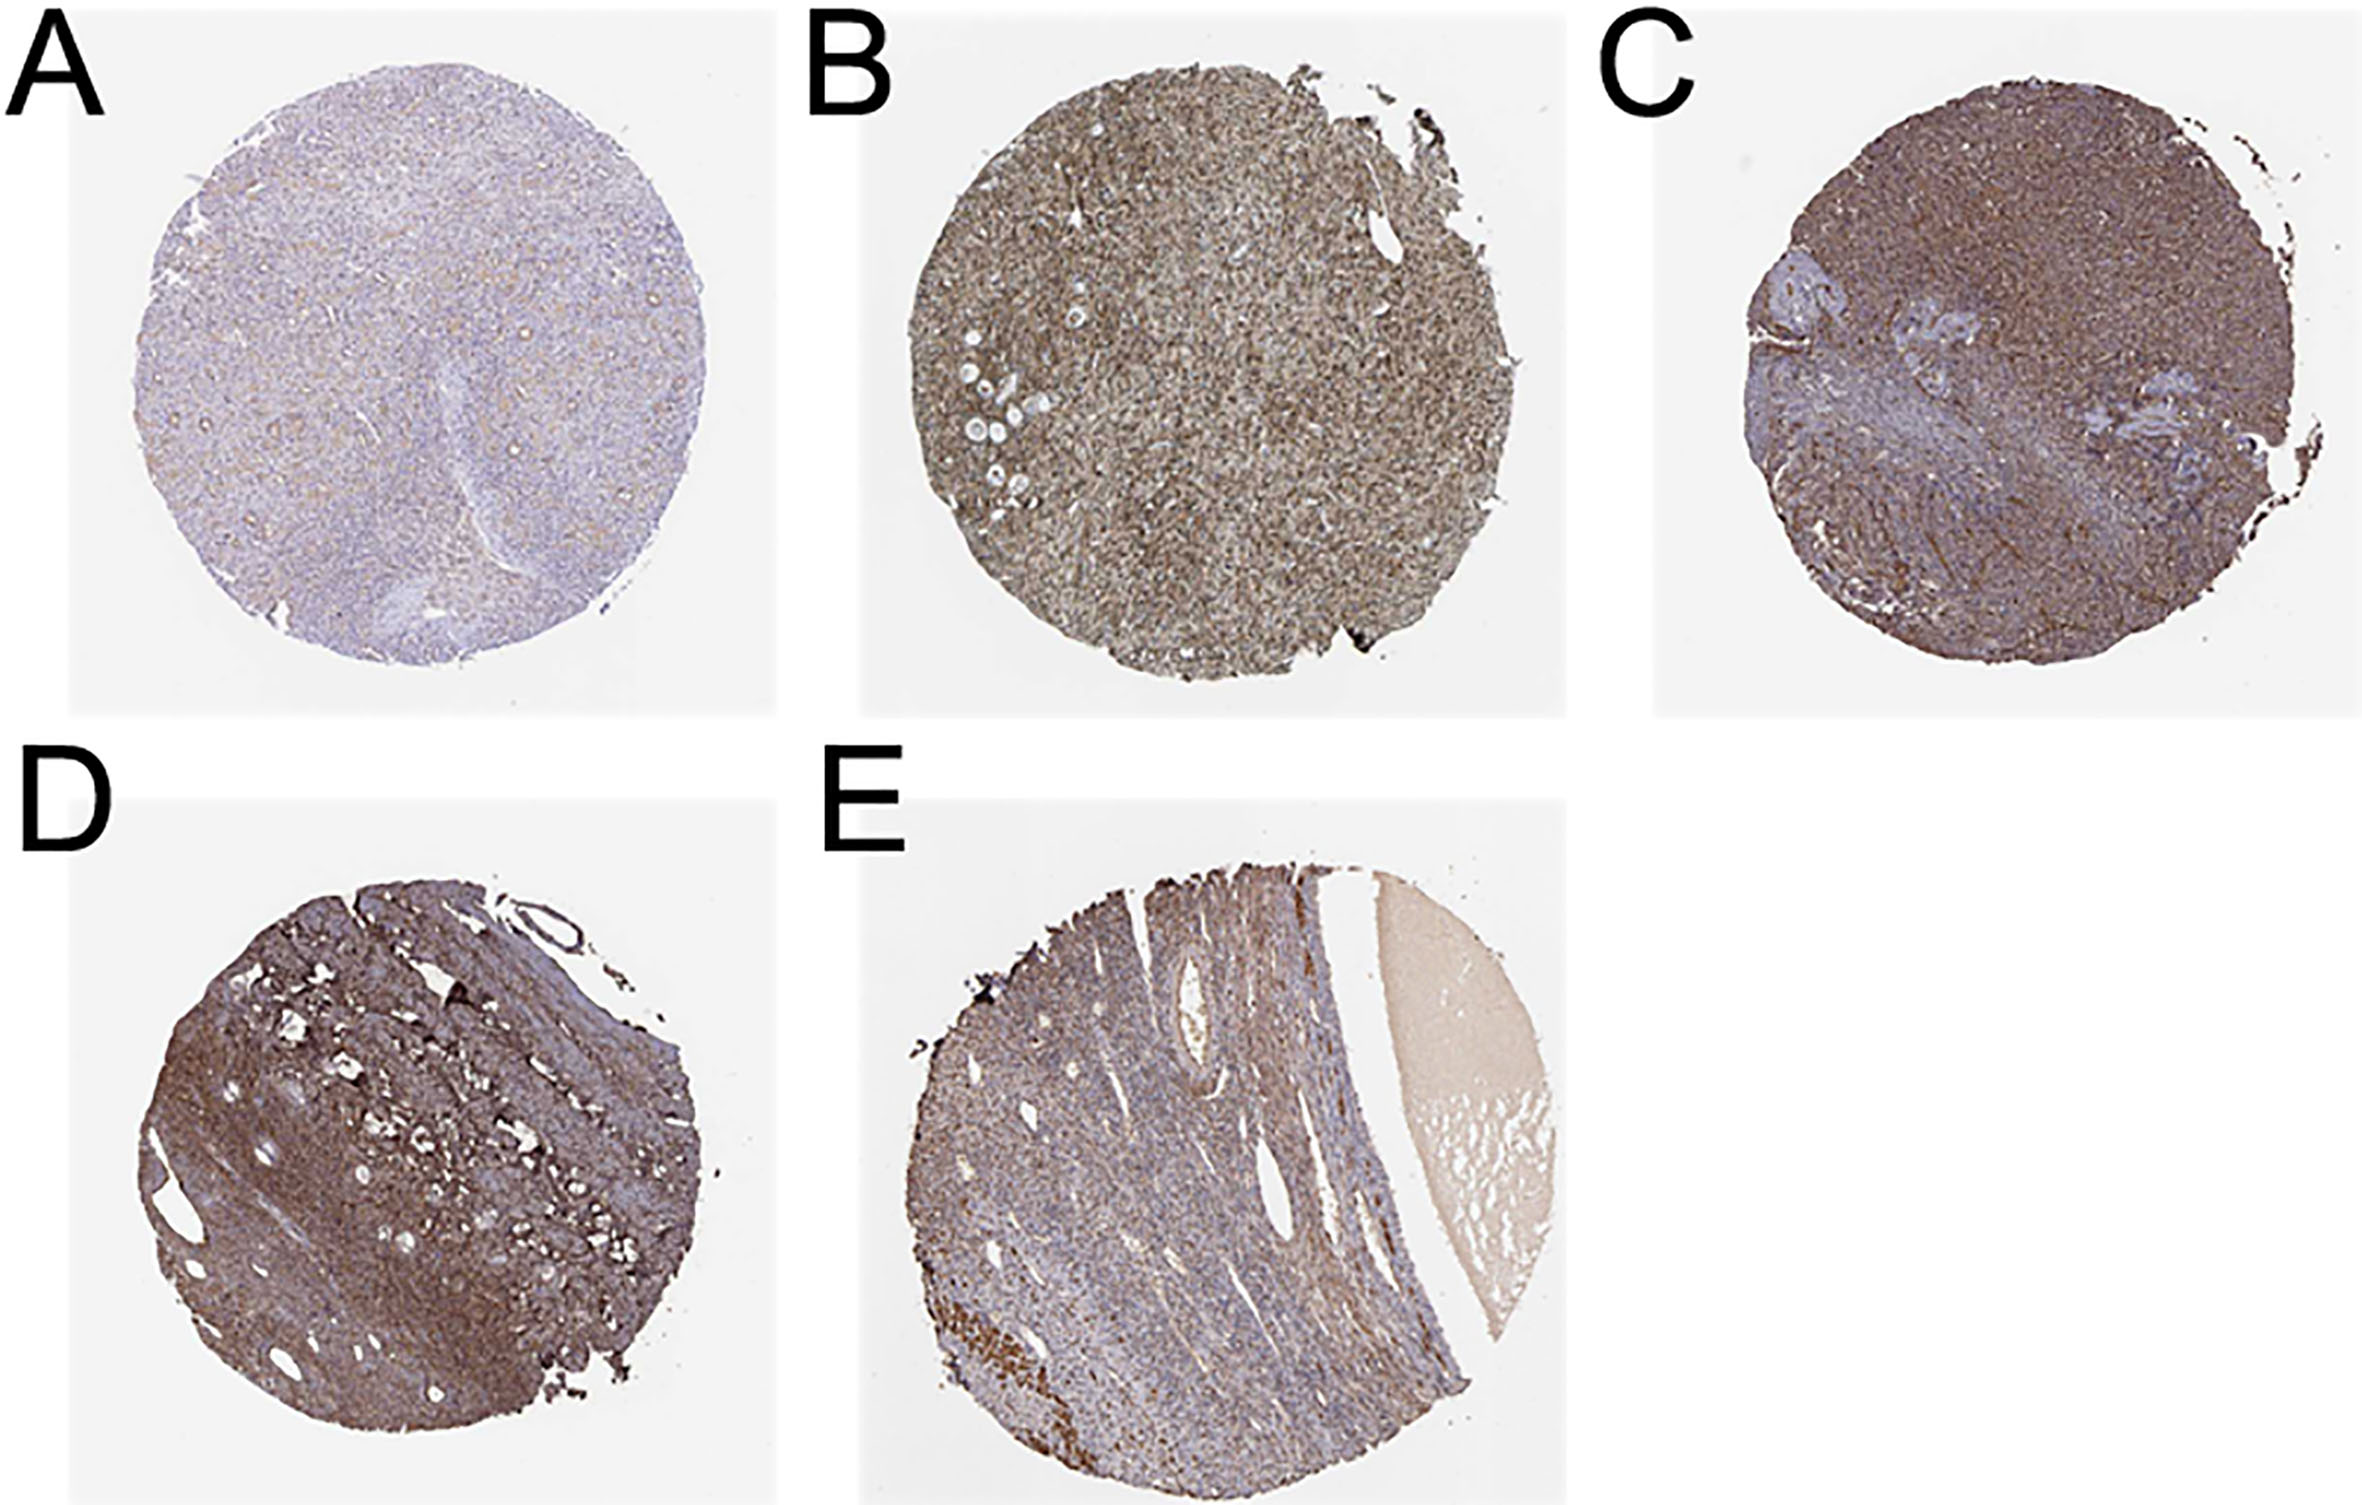
detailed prognostic analyses are shown in Supplement Table 2.
Then, we explored the prognostic values of S100 family members in ovarian cancer with different histology subtypes, including endometrioid and serous. As shown in Fig. 4, for S100G, S100A13 and S100A12 (Fig. 4A–C), high mRNA expression was related to better OS. In serous ovarian cancer, high mRNA expression of S100A13, S100A8, S100A6 and S100A5 (Fig. 4D, G, H and I) were associated with better OS, and high mRNA expression of S100A11 and S100A10 (Fig. 4E and F) were associated with worse OS. All the detailed prognostic analyses are shown in Supplement Table 3.
Prognostic values of S100 members in ovarian patients according to clinicopathological features and TP53 expression status
Next, we explored the prognostic values of S100 family members in ovarian cancer with different pathological grades and TP53 status. As it shown in Table 2, high mRNA expression of S100G, S100Z, S100A7A and S100A2 were associated with better OS in grade I ovarian cancer patients. High mRNA expression of S100Z, S100B, S100A16, S100A12, S100A6 and S100A4 were associated with better OS in grade II ovarian cancer patients. High mRNA expression of S100P, S100B, S100A11, S100A10, S100A8, S100A5, S100A3 and S100A2 were associated with better OS in grade III ovarian cancer patients. High mRNA expression of S100P, S100A14, S100A13, S100A6, S100A4, S100A3 and S100A1 were associated with better OS in grade IV ovarian cancer patients.
In TP53 mutated ovarian cancer patients, high mRNA expression of S100P, S100G, S100A14, S100 A12, S100A11 and S100A7A were related to worse OS (Fig. 5A, B, D–F and H). On the contrary, high mRNA expression of S100B, S100A8 and S100A4 were related to better OS. In TP53 wild-type ovarian cancer patients, high mRNA expression of S100B, S100A11 and S100A8 were related to worse OS (Fig. 5J–L). But high mRNA expression of S100A5, S100A3 and S100A2 were related to better OS (Fig. 5M–O). All the detailed prognostic analyses are shown in Supplement Table 4.
The alteration in S100 factors can not affected the OS and DFS in ovarian patients
The alteration of S100 family occurred in 39 samples out of 316 patients with ovarian serous cystadenocarcinoma (12%). Most of S100 family genes have amplification alterations (Fig. 6C). After analyzed by Kaplan-Meier plot and log-rank test, the alterations of S100 family were no significant differences between OS and DFS in ovarian cancer patients with or without S100 family alterations (Fig. 6A and B).
The representative IHC staining in S100 factors in ovarian patients
We explored the IHC staining of S100 family in ovary tissues and ovarian cancer tissues. Some of S100 family protein have medium or high expression level (Fig. 7). As it shown in Fig. 7A, S100P was medium expression in ovarian cancer patients. And in Fig. 7B–E, S100A13, S100A10 and S100A6 showed high expression level in ovarian cancer patients.
Discussions
In this study, we systematically analyzed the correlation of expression level of S100 family members and ovarian cancer prognostic values. Among them, 10 members were significantly associated with prognosis in ovarian cancer. However, the prognostic values could not be in same direction. In ovarian cancer, high expression of S100G, S100A13, S100A6, S100A5, S100A3 and S100A1 usually means better OS. But high expression of S100A11, S100A10, S100A7A and S100A2 means worse OS. Among the oncoprint of S100 family members, the most of mutations is amplification which has not significantly differences in OS and DFS. The molecular mechanisms by which S100 family members contribute to cancer occurrences and aggression are not understood yet.
S100G protein is a cytosolic calcium-binding protein that is expressed in a variety of tissues. Role of S100G is unclarified at present. S100G expression is regulated by the sex steroid hormones oestrogen (E2) and progesterone [18]. In our study, the high mRNA expression of S100G was associated with better OS in endometrioid ovarian cancer, and with better survival for all ovarian cancer patients.
S100A13 protein is characterized by its specificity for diverse forms of cancer which was found by screening EST database. High expression of S100A13 was associated with tumor growth, metastasis and worse OS in thyroid tumors and melanoma [19, 20]. The expression of S100A13 is involved in co-expressing with fibroblast growth factor 1 (FGF-1) depending on the classic Golgi-endoplasmic reticulum pathway [21]. In this study, high expression of S100A13 was associated with better OS in both endometrioid and serous ovarian cancer.
S100A11 seems to be a novel marker depending on the cancer involved. High expression of S100A11 has been reported in colon, pancreatic and breast cancer [22, 23, 24]. It is correlated with the metastasis and poor OS in these tumor. YouQing Liu found that knockdown of S100A11 expression could suppress ovarian cancer cell growth and invasion by regulating EMT process [25]. According to our study, overexpression of S100A11 was associated with worse OS in serous ovarian cancer, but not endometrioid ovarian cancer.
S100A6 regulated many cellular and molecular functions in previous research [26]. High expression of S100A6 is related to enhance the invasiveness of tumor cell and poor OS in lung, breast, gastric cancer and leukemia [27, 28, 29, 30]. Regulation of S100A6 through p38 MAPK pathway was first reported by Duan L in 2014 [31]. However, the prognostic value of S100A6 is unknown. Consistent with our result, high expression of S100A6 indicated better OS in serous ovarian cancer, but in worse OS in grade II ovarian cancer.
S100A5 plays an important role in the recurrence of grade I meningioma [32]. High expression of S100A5 is in accordance with tumor aggressiveness [33]. However, there is little research about the prognostic value of S100A5 in ovarian cancer. Our results confirmed that high expression of S100A5 was related to better OS in serous and low grade ovarian cancer.
P53 protein is a famous multi-function protein which had been regarded as a tumor suppressor [34, 35]. It is involved in the regulation of almost every aspect of cell behavior, including proliferation, cell death, differentiation and motility. In our study, we found that p53 protein interacted with S100A8 and S100A11 directly. This interaction could inhibit p53 expression and phosphorylation of p53 [36]. In wild type p53, high expression of S100A11 indicated worse OS, but high expression of S100A8 indicated better OS. In mutant p53, high expression of S100A11 and S100A8 were both related to worse OS. In ovarian cancer, the regulation mechanism of interaction of S100 family and p53 is not clear now. Further studies on the regulation approach need to carry out to demonstrate the relevance of S100 family and p53.
Conclusions
In summary, we analyzed the prognostic value of mRNA expression of 20 S100 family members in ovarian cancer patients by using Oncomine database, String, Kaplan-Meier Plotter, cBioportal and the Human Protein Atlas. Among all the S100 family, 10 S100 members were significantly associated with prognosis in all ovarian cancer patients. And 4 members might show their functions with the regulation of p53 protein. Moreover, the prognostic value of S100 family should be evaluated in clinical trials and fundamental experiments. These results will be helpful for explore the interaction of S100 family members and ovarian cancer development and the regulation in different signaling pathways.
Our study might provide a novel biomarker for the prognostic ovarian cancer and might promote development of new target treatment of ovarian cancer in the future.
Footnotes
Conflict of interest
None.
Supplementary data
The supplementary files are available to download from http://dx.doi.org/10.3233/CBM-182276.