
Abstract
BACKGROUND:
Bladder cancer is one of the most common genitourinary malignancies, with a high rate of recurrence and progression. The prognosis for patients with bladder cancer, especially muscle-invasive bladder cancer, remains poor despite systemic therapy.
OBJECTIVE:
To explore the underlying disease mechanisms and identify more effective biomarkers for bladder cancer.
METHODS:
Weighted gene co-expression network analysis (WGCNA) and protein-protein interaction (PPI) network analysis were applied to identify hub genes correlated with the bladder cancer progression. Survival analyses were then conducted to identify potential biomarkers correlated with the prognosis of bladder cancer. Finally, validation and analysis of these potential biomarkers were conducted by a series of bioinformatics analyses.
RESULTS:
Based on the results of weighted gene co-expression network analysis and protein-protein interaction network analysis, ten hub genes closely correlated with bladder cancer progression were identified in the relevant module. Survival analyses of these genes indicated that elevated expressions of six potential biomarkers (COL3A1, FN1, COL5A1, FBN1, COL6A1 and THBS2) were significantly associated with a worse overall survival. Furthermore, these 6 potential biomarkers were validated in association with the progression of bladder cancer. Bladder cancer samples with higher expression of these genes were most significantly enriched in gene set associated with ECM-receptor interaction.
CONCLUSIONS:
This study identified several biomarkers associated with bladder cancer progression and prognosis. As novel findings, these may have important clinical implications for diagnosis, treatment and prognosis prediction.
Keywords
Introduction
Bladder cancer is the 7th most commonly diagnosed cancer in the male population worldwide [1, 2]. In China, there were approximately 80,500 new cases and 32,900 deaths from this malignancy in 2015 [3]. Approximately 75% of newly diagnosed cases are non-muscle-invasive bladder cancer (NMIBC) with the remaining being muscle-invasive bladder cancer (MIBC) [4]. For patients with NMIBC, the treatment with a relatively low mortality is complete resection of the tumor followed by Bacillus Calmette-Guérin (BCG) intravesical immunotherapy or chemo- therapy [5, 6]. However, patients with noninvasive disease suffer from a high rate of recurrence and progression. Reported 5 year rates of NMIBC recurrence range from 50% to 70%, and 5 year rates of progression to MIBC range from 10% to 30% [7]. For patients with MIBC, radical cystectomy with neoadjuvant chemotherapy is usually recommended [8]. However, MIBC is frequently associated with metastatic disease and has a high rate of mortality. The prognosis of patients with MIBC remains poor despite systemic therapy [8, 9]. Early diagnosis with individualized treatment and follow-up is the key to successful outcomes. Therefore, it is urgent to explore the potential mechanisms involved in cancer progression and find more effective biomarkers for early diagnosis, treatment and prognosis.
With the rapid development of genome-wide sequencing, more tumor-related genes are quickly being detected, leading to breakthroughs in cancer research [10]. Gene expression profiles such as microarray and RNA sequencing have been widely used to identify biomarkers associated with bladder cancer progression. However, the high degree of interconnection between genes has been often ignored in many studies, although genes with similar expression patterns may be functionally related. Weighted gene co-expression network analysis (WGCNA), a systems biology algorithm, is proposed to describe correlation patterns among genes across microarray samples, and correlation relationship between clusters of highly co-expressed genes or modules and external sample traits [11]. Briefly, WGCNA can identify clusters (modules) of highly co-expressed genes as well as screening of hub genes and modules related to clinical traits. Correlation networks facilitate network based gene screening methods that can be used to identify candidate biomarkers or therapeutic targets. WGCNA has been widely applied to screen hub genes and modules related to clinical traits in cancers, including bladder cancer [12, 13, 14, 15].
Protein-protein interactions (PPIs), commonly understood as physical contacts with molecular docking between proteins that occur in a cell or in a living organism in vivo [16], are emerging as an attractive class of molecular targets for treatment [17]. STRING (Search Tool for the Retrieval of Interacting Genes), a biological database of known and predicted protein-protein interactions, can construct a protein-protein interaction (PPI) network, in which the proteins are the nodes and the interactions are the edges [18]. Hubs that are “highly connected” in a PPI network are more likely to be essential proteins [19].
Thus, in the present study, we attempted to construct the weighted co-expression network as well as the PPI network in order to identify biomarkers significantly associated with the progression and prognosis of bladder cancer and to distinguish NMIBC and MIBC.
Materials and methods
Data collection
A flow diagram of this study protocol is shown in Fig. 1. Gene expression profiles and related clinical data were downloaded from Gene Expression Omnibus (GEO) database (
The flow diagram of this study. Data preparing, processing, analysis and validation were shown in the flow diagram.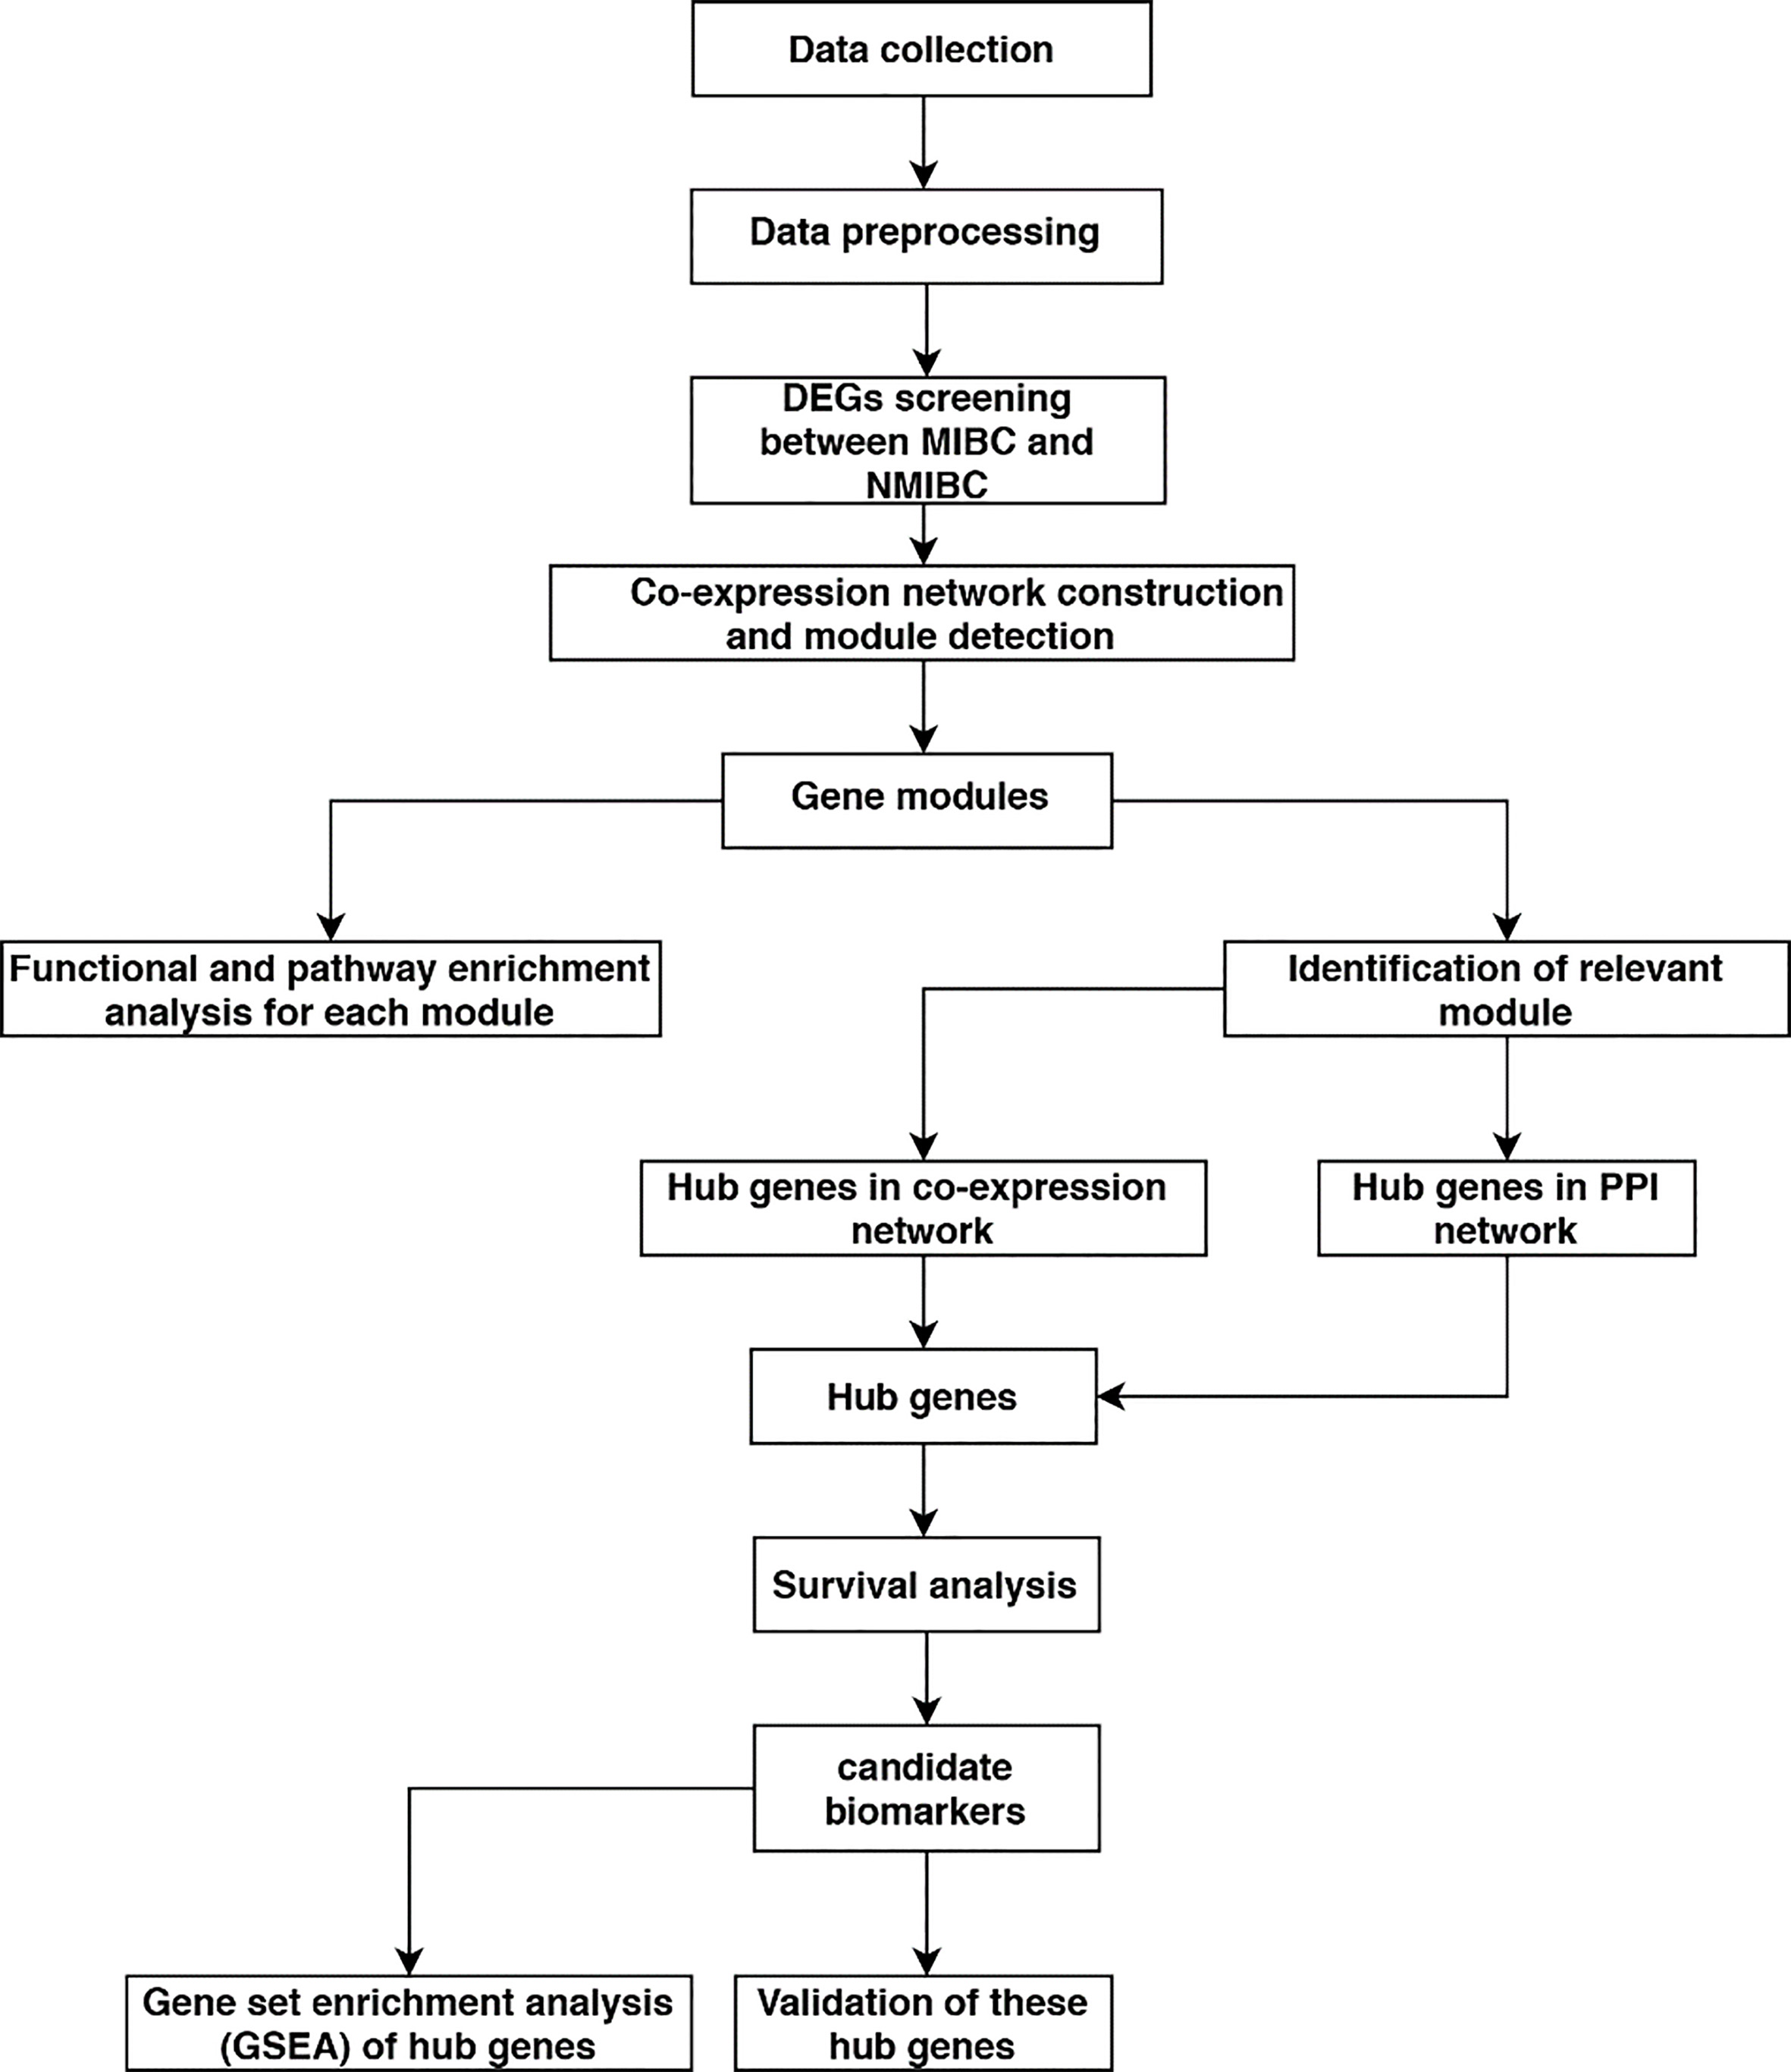
Normalized data were downloaded from the GEO database. Cluster analysis was conducted according to the distance between different samples in Pearson’s correlation matrices and average linkage to assess microarray quality.
Differentially expressed genes (DEGs) screening
The “limma” [20] package in R software was used to screen for DEGs between NMIBC samples and MIBC samples. FDR (false discovery rate)
Weighted co-expression network construction and module detection
The “WGCNA” package in R was used to construct a DEGs co-expression network. A Pearson’s correlation coefficient matrix was then computed for all pair-wise genes. Next, a weighted adjacency matrix was constructed using the power function
Functional and pathway enrichment analysis
The “clusterProfiler” [21] package in R was used to conduct gene ontology (GO) and Kyoto Encyclopedia of Genes and Genomes (KEGG) pathway enrichment analysis of genes in each module. False discovery rate (FDR)
Identification of relevant module by module significance
After relating modules to clinical traits, Module Significance (the correlation between the module eigengene and the trait) was calculated. In general, the module with the absolute Module Significance ranked first or second among all the selected modules was considered as the one related to clinical trait. Thus, by comparing the Module Significance, we could identify which module was highly related to a certain clinical trait.
Identification of hub genes in relevant module
In this study, hub genes in weighted co-expression network were defined by Module Membership (the correlation between the gene expression profile and the module eigengene)
Determination of soft-thresholding power in the weighted gene co-expression network analysis (WGCNA) and identification of modules associated with clinical traits. (A) The left panel shows the scale-free fit index for various soft-thresholding powers (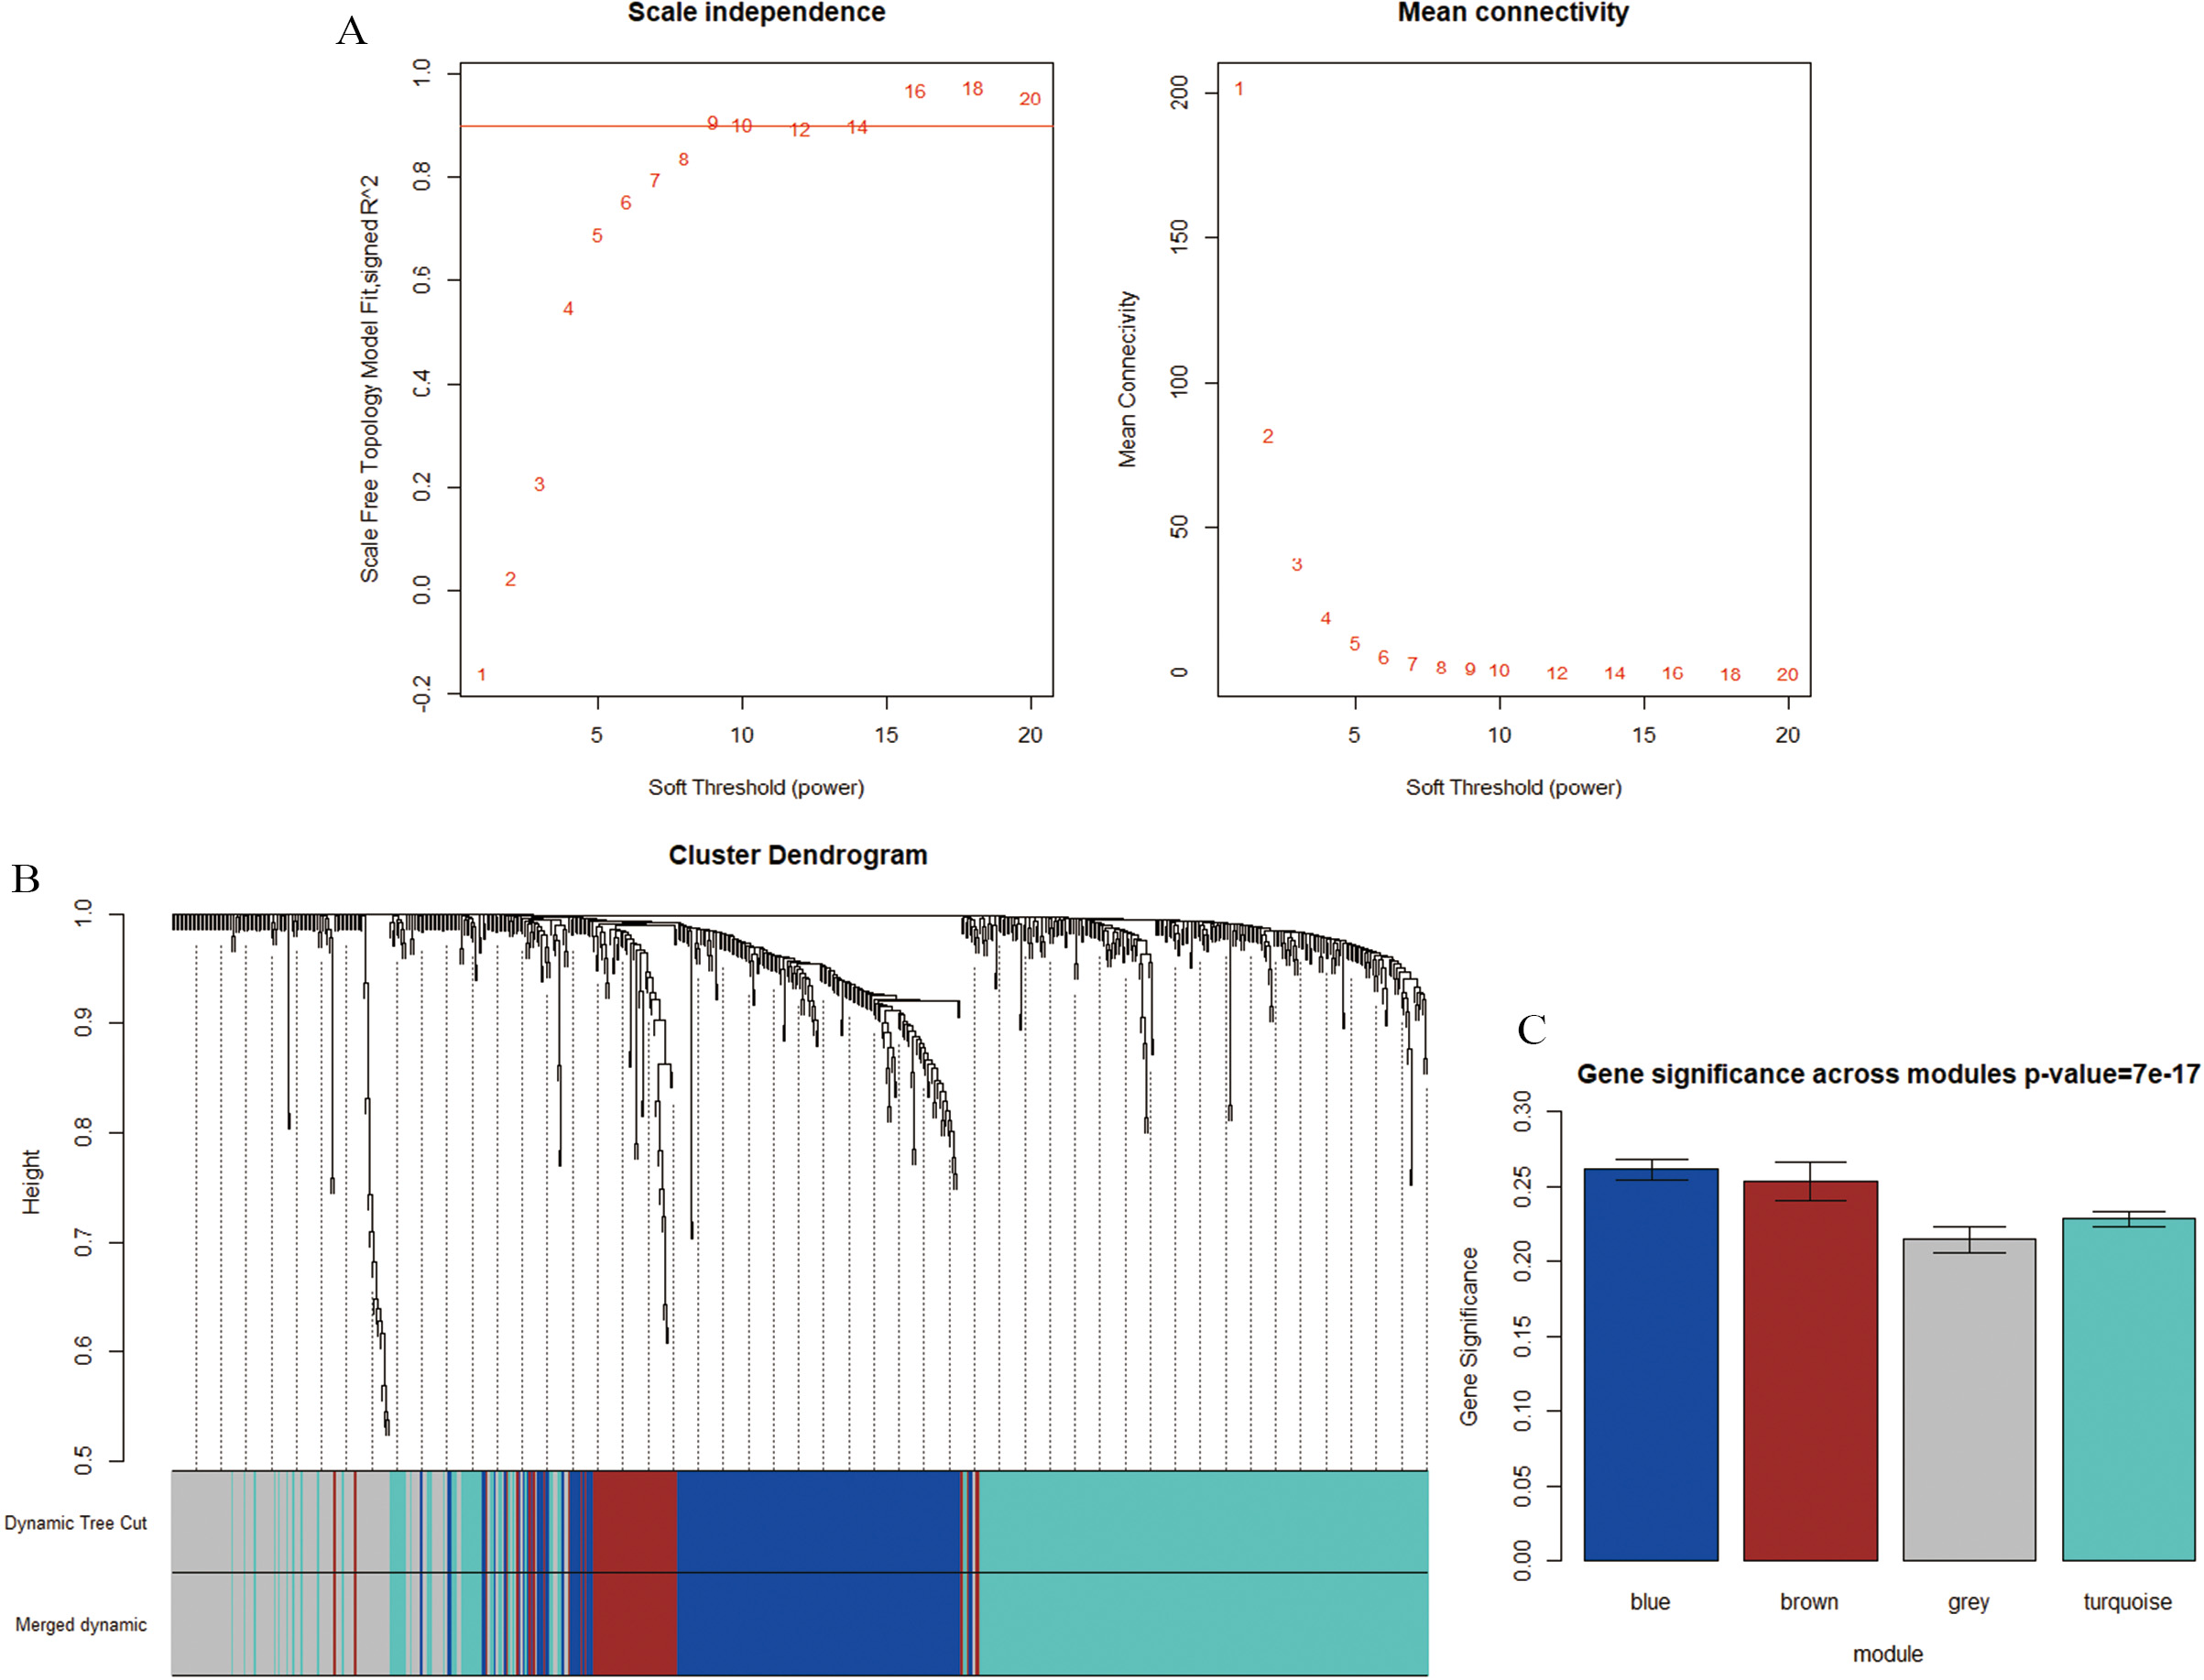
Potential candidate biomarkers for bladder cancer were identified using overall survival analyses of the hub genes based on TCGA data in the GEPIA database [23] (
Gene set enrichment analysis (GSEA)
The test set GSE13507 was also used to conduct GSEA [24] (
Overall survival analyses of the hub genes in bladder cancer (based on TCGA data in GEPIA). (A) COL3A1, (B) FN1, (C) COL5A1, (D) FBN1, (E) COL6A1, and (F) THBS2.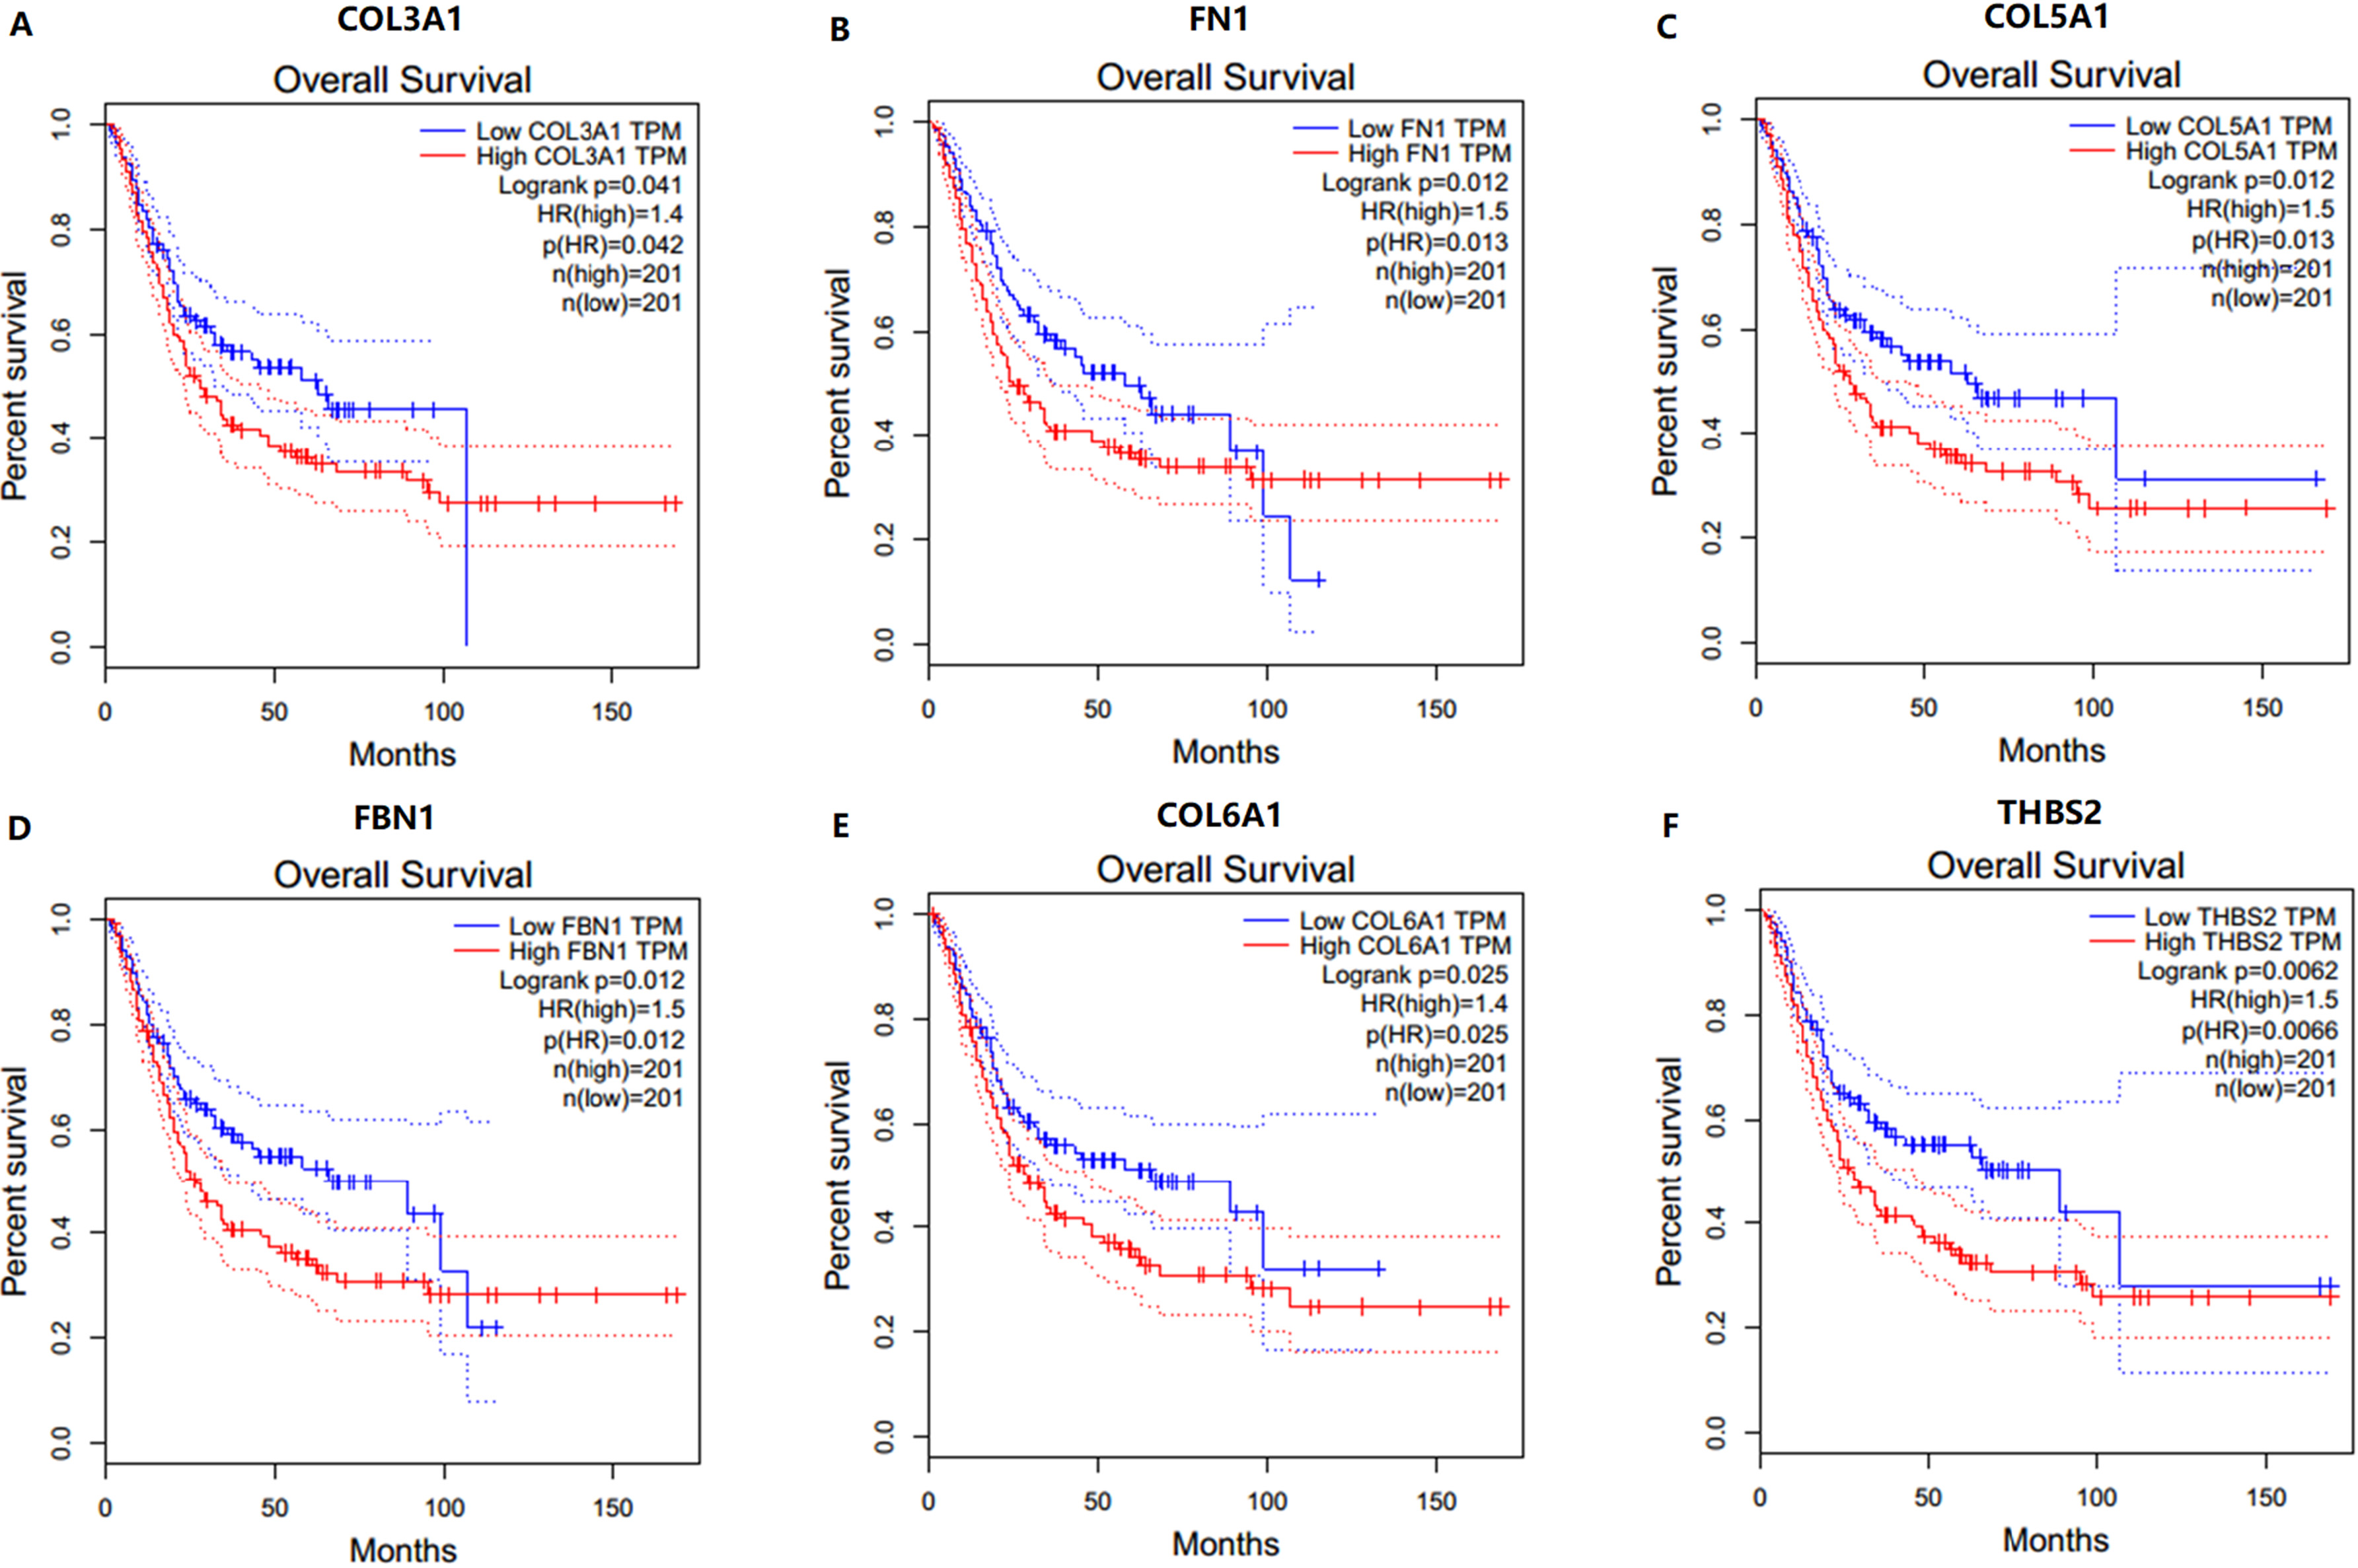
DEGs screening, co-expression network construction and relevant module identification
After data preprocessing and quality assessment, expression matrices were obtained from the training set GSE83586. Under the threshold of FDR
Functional and pathway enrichment analysis
Mechanisms correlated with the progression of bladder cancer were explored with GO and KEGG pathway enrichment analysis. GO and KEGG pathway enrichment analysis results showed that DEGs in the blue module were enriched in GO terms and pathways associated with the ECM (Supplementary Tables 2 and 3); DEGs in the brown module were enriched in GO terms and pathways associated with immunity (Supplementary Tables 4 and 5); DEGs in the turquoise module were enriched in GO terms and pathways associated with fatty acid metabolism (Supplementary Tables 6 and 7).
Identification of hub genes in relevant module
Based on Gene Significance
Ten hub genes that were closely correlated with bladder cancer progression
Ten hub genes that were closely correlated with bladder cancer progression
Boxplots of candidate biomarkers across different pathological stages in the test set GSE13507. The boxplots show the medians and dispersions of the samples of different pathological stages for each candidate biomarker. (A) COL3A1, (B) FN1, (C) COL5A1, (D) FBN1, (E) COL6A1, and (F) THBS2. 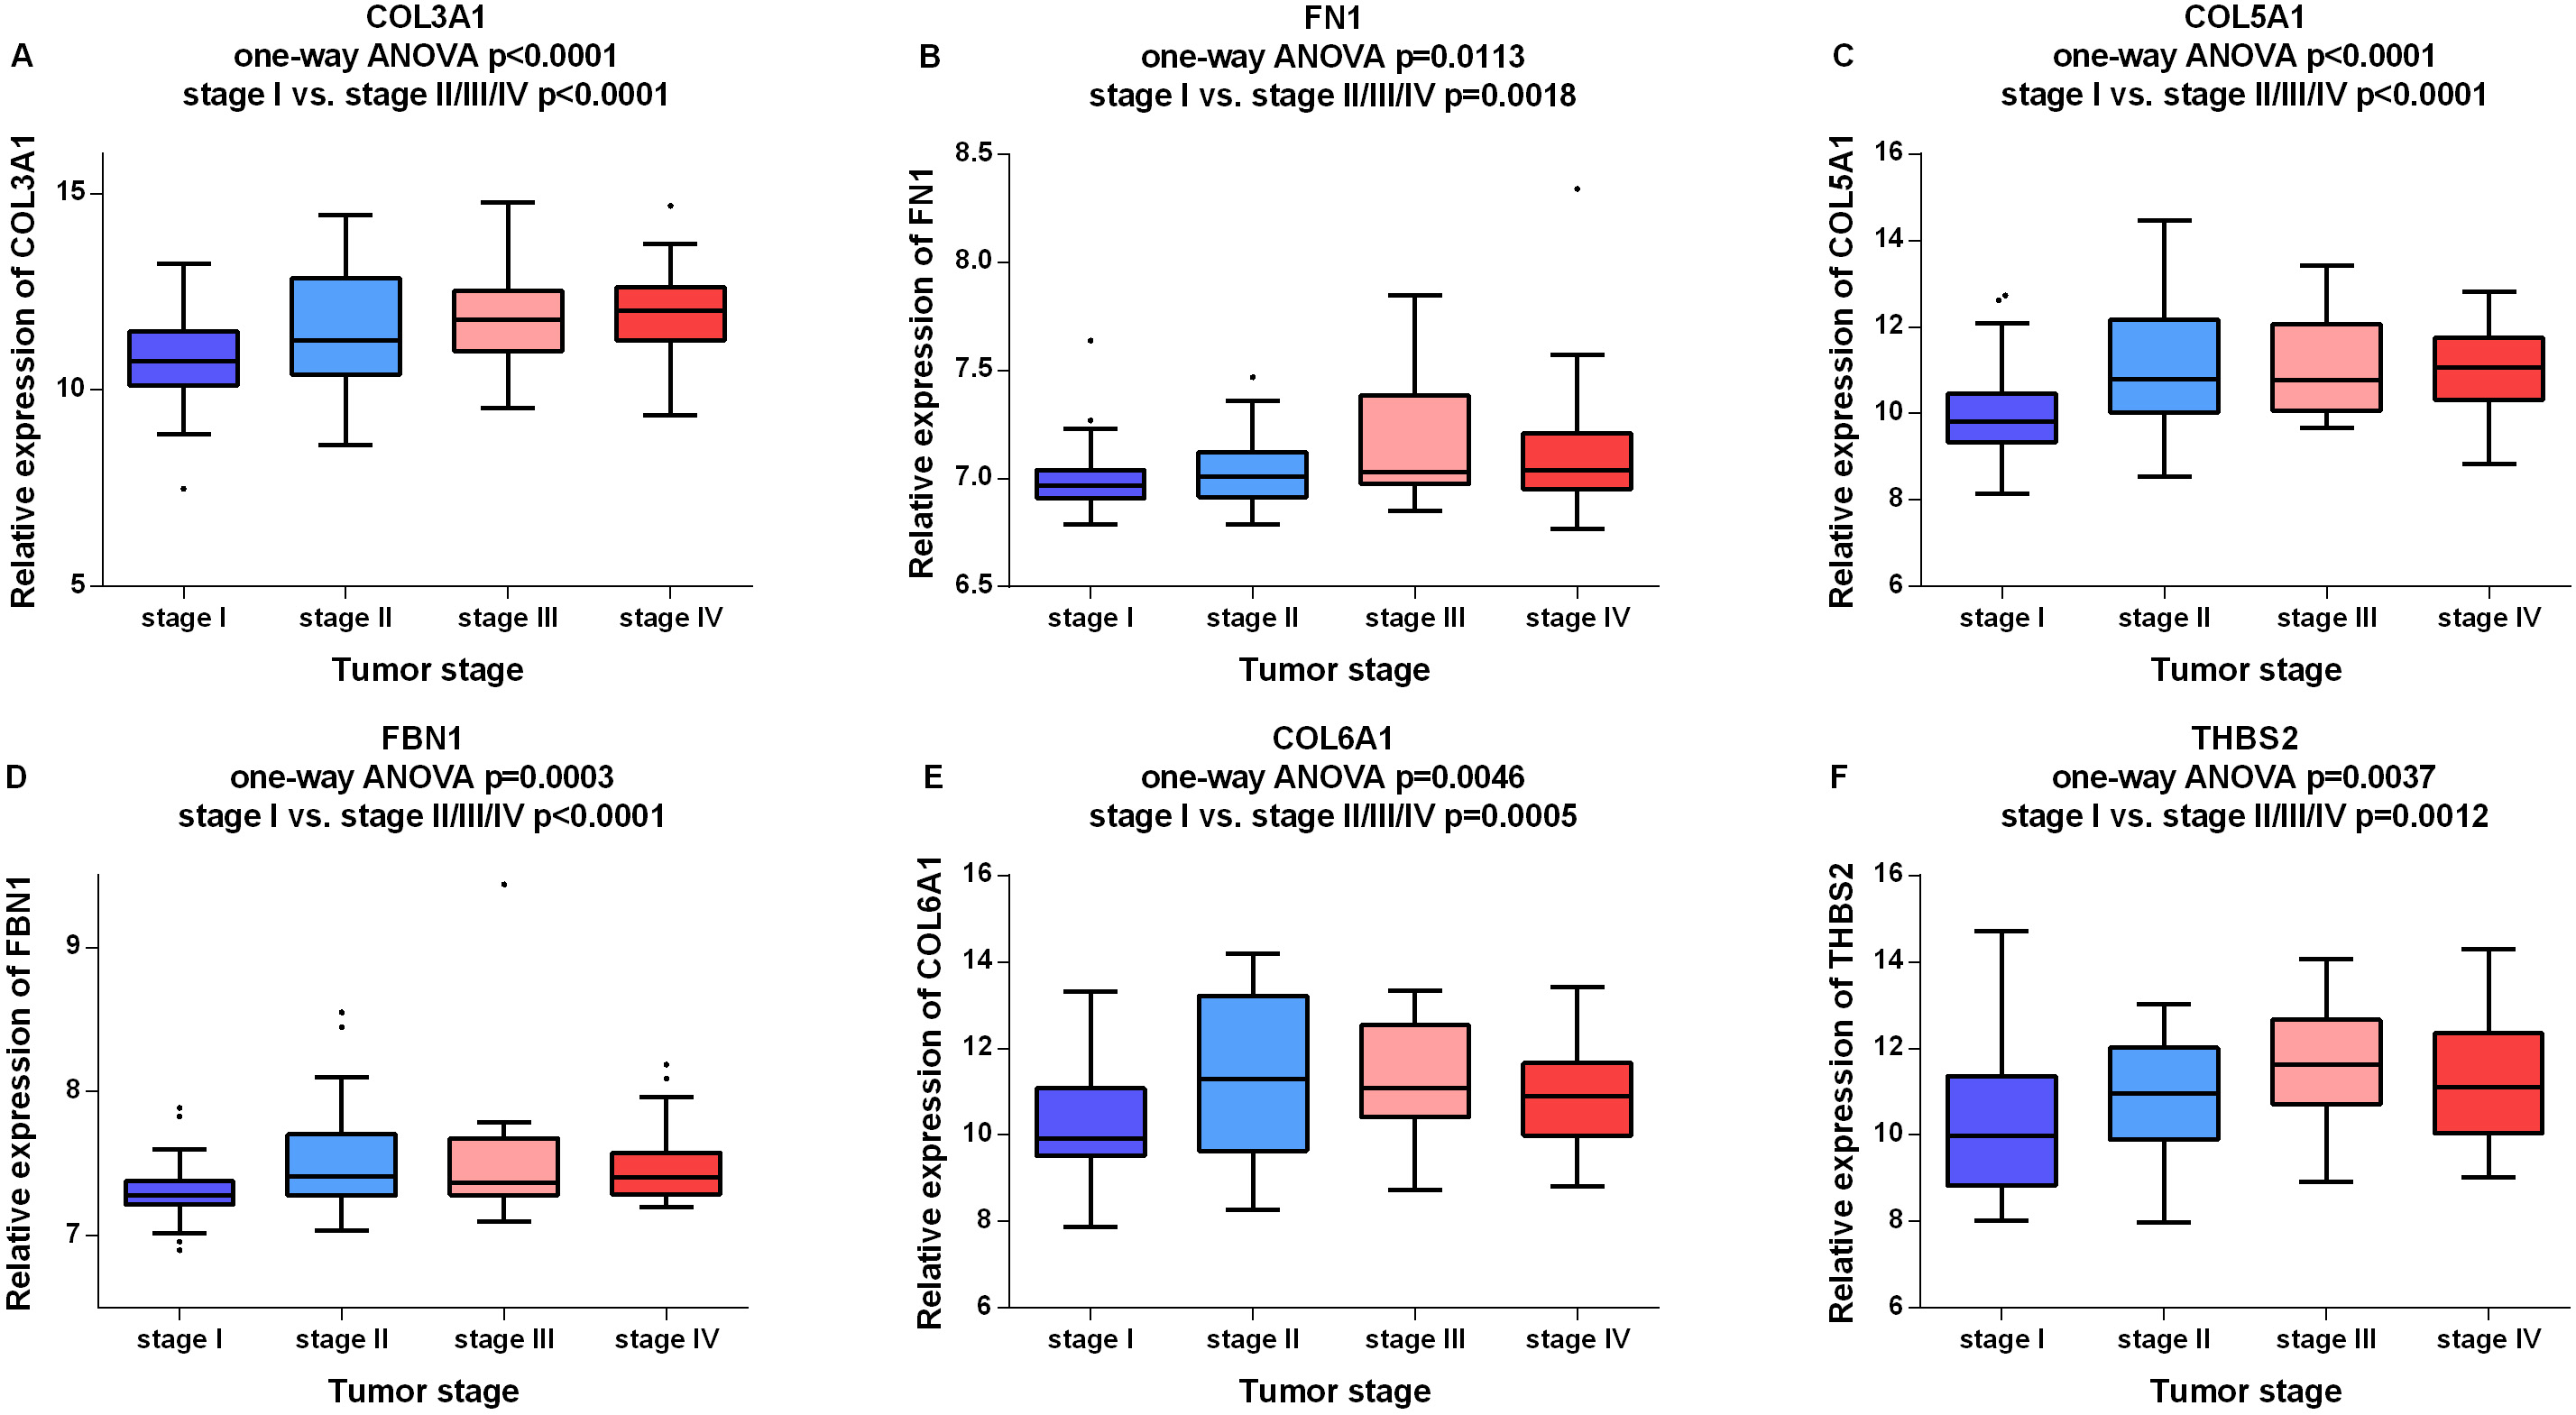
In order to identify potential candidate biomarkers for bladder cancer, overall survival analyses were performed based on TCGA data. As shown in Fig. 3, higher expressions of six hub genes (COL3A1, FN1, COL5A1, FBN1, COL6A1 and THBS2) were significantly associated with a worse overall survival, and these six hub genes were chosen as candidate biomarkers for further validation. In the test set, GSE13507, significant differences were detected for each candidate biomarker expression across the pathological stages of bladder cancer and all these genes were effective for distinguishing NMIBC and MIBC (Fig. 4). Moreover, ROC curves also indicated that all candidate biomarkers were effective for distinguishing NMIBC and MIBC (Fig. 5). In addition, based on TCGA data, we also identified significant differences for all candidate biomarkers among different pathological stages of bladder cancer (Fig. 6).
The receiver operating characteristic (ROC) curves of candidate biomarkers based on the test set GSE13507. (A) COL3A1, (B) FN1, (C) COL5A1, (D) FBN1, (E) COL6A1, and (F) THBS2. Areas under the curve (AUC) statistics are used to evaluate the diagnostic efficiency of the hub genes to distinguish between NMIBC and MIBC.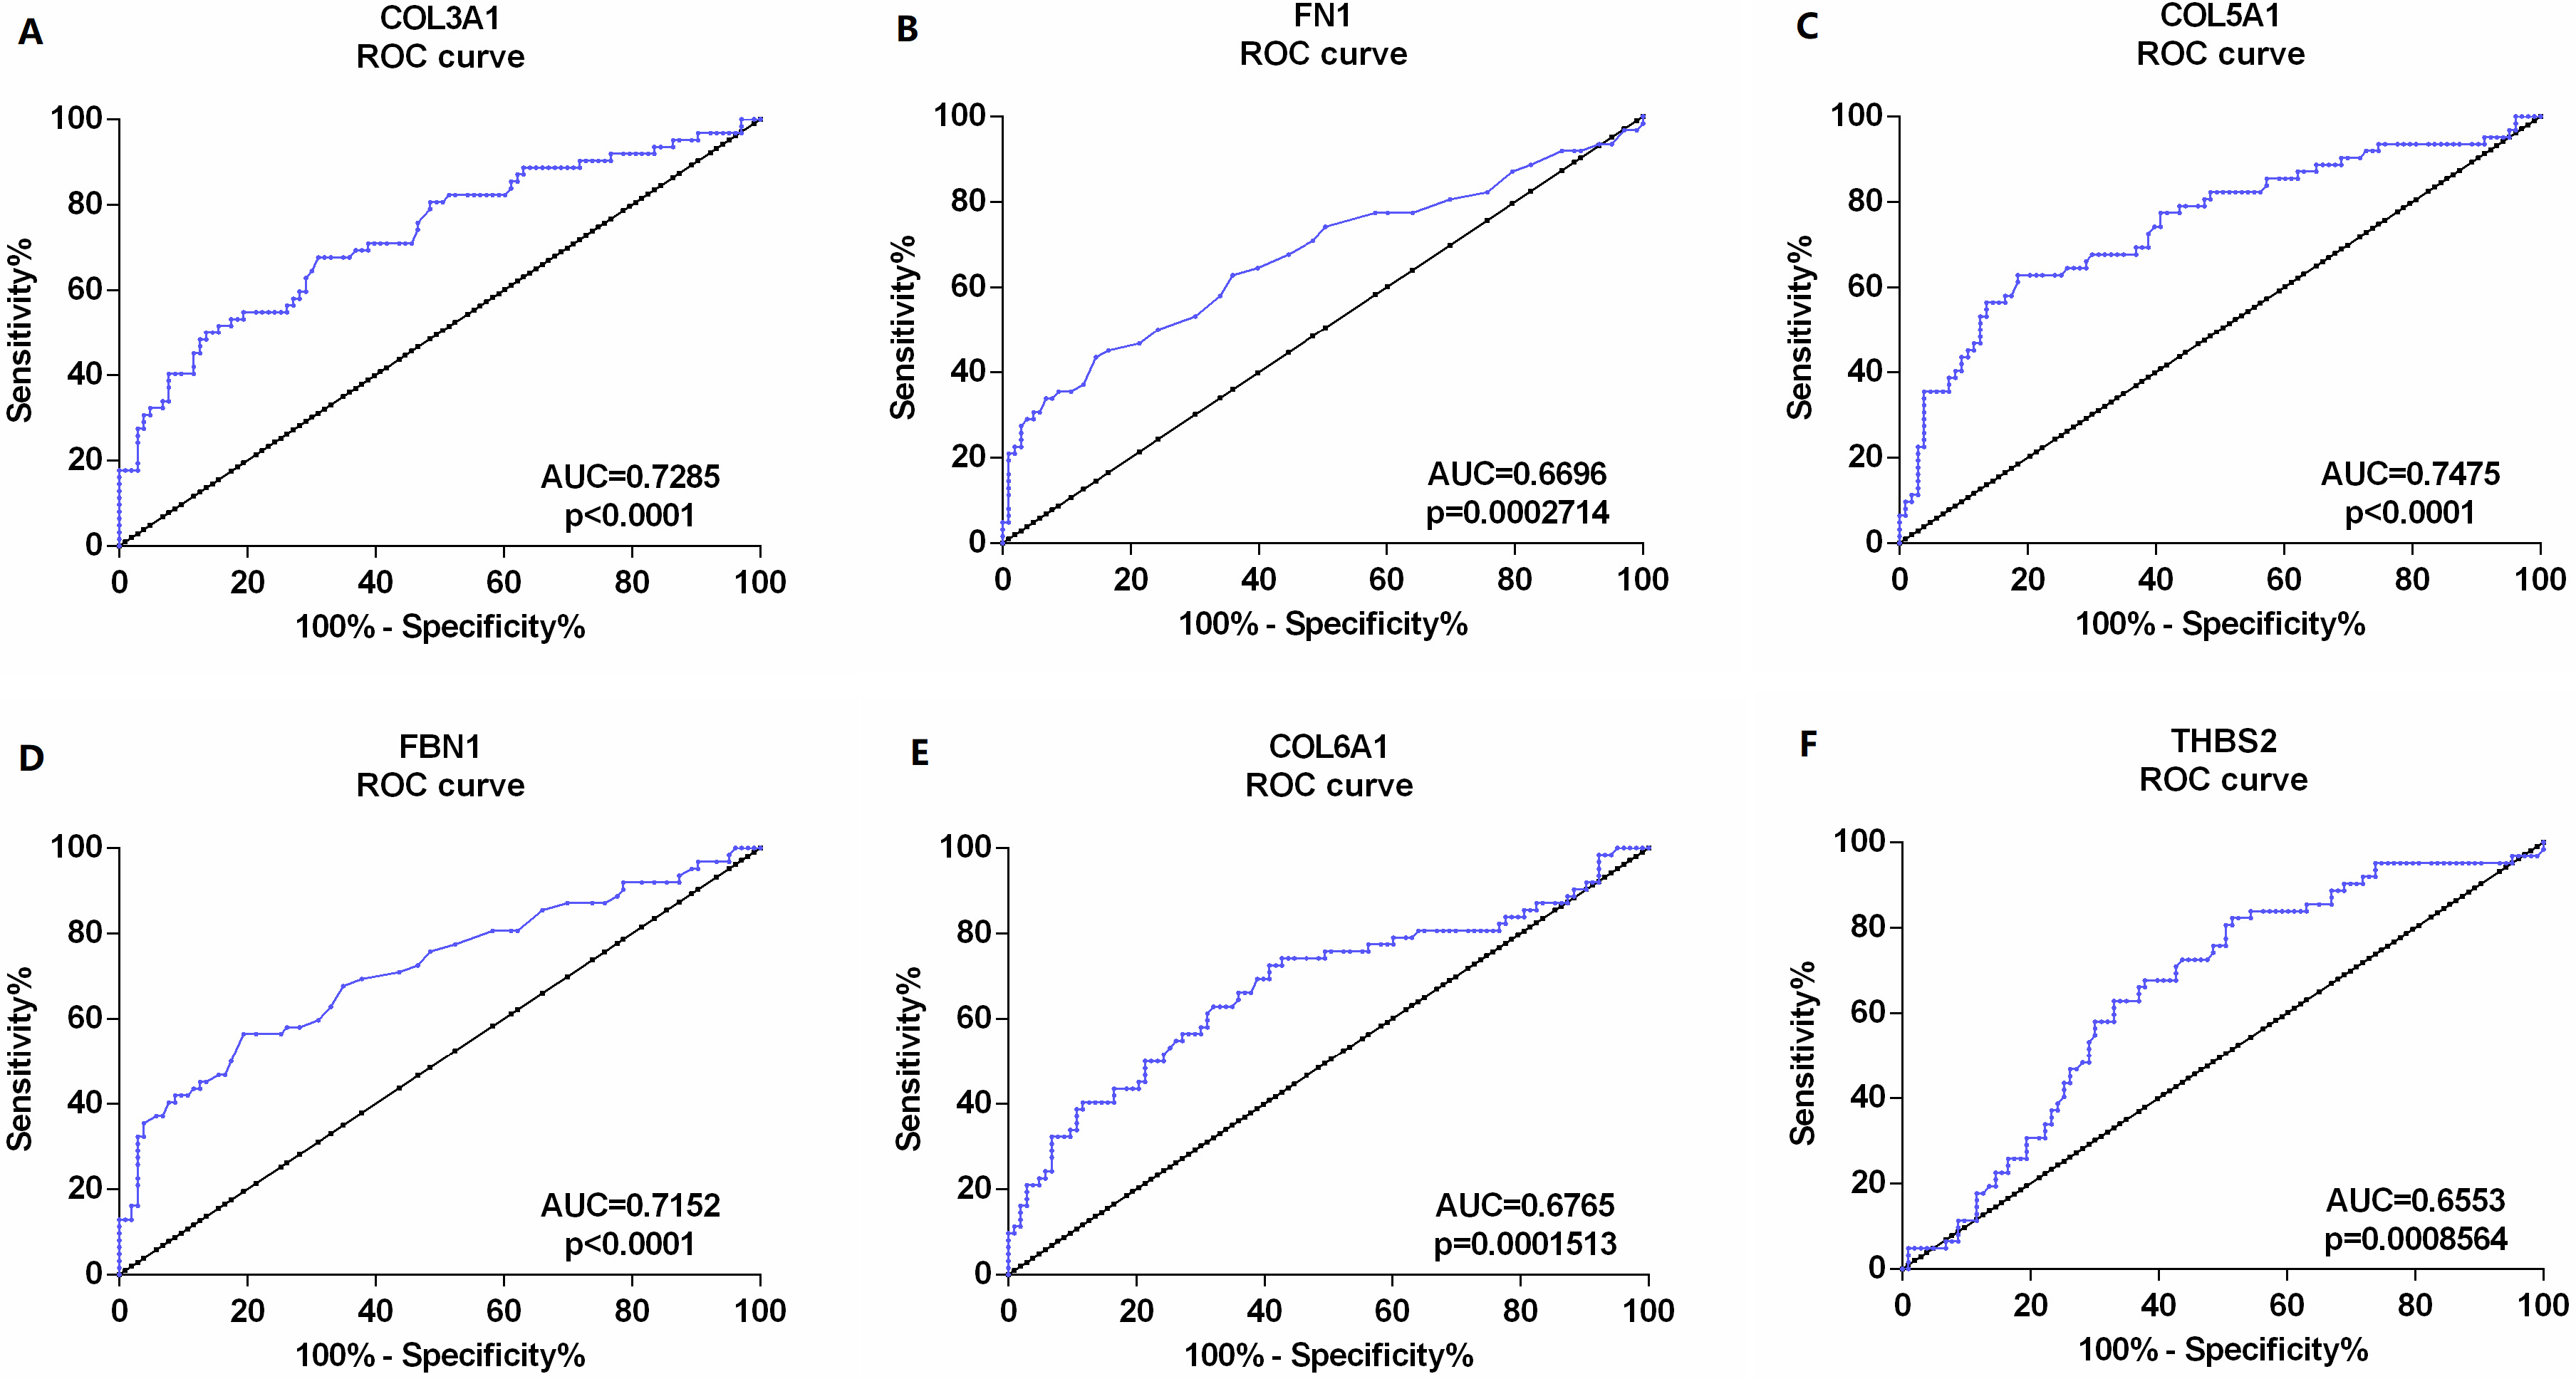
Validation of the correlation between the expression levels of candidate biomarkers and the pathologic stage of bladder cancer (based on TCGA data in GEPIA). (A) COL3A1, (B) FN1, (C) COL5A1, (D) FBN1, (E) COL6A1, and (F) THBS2.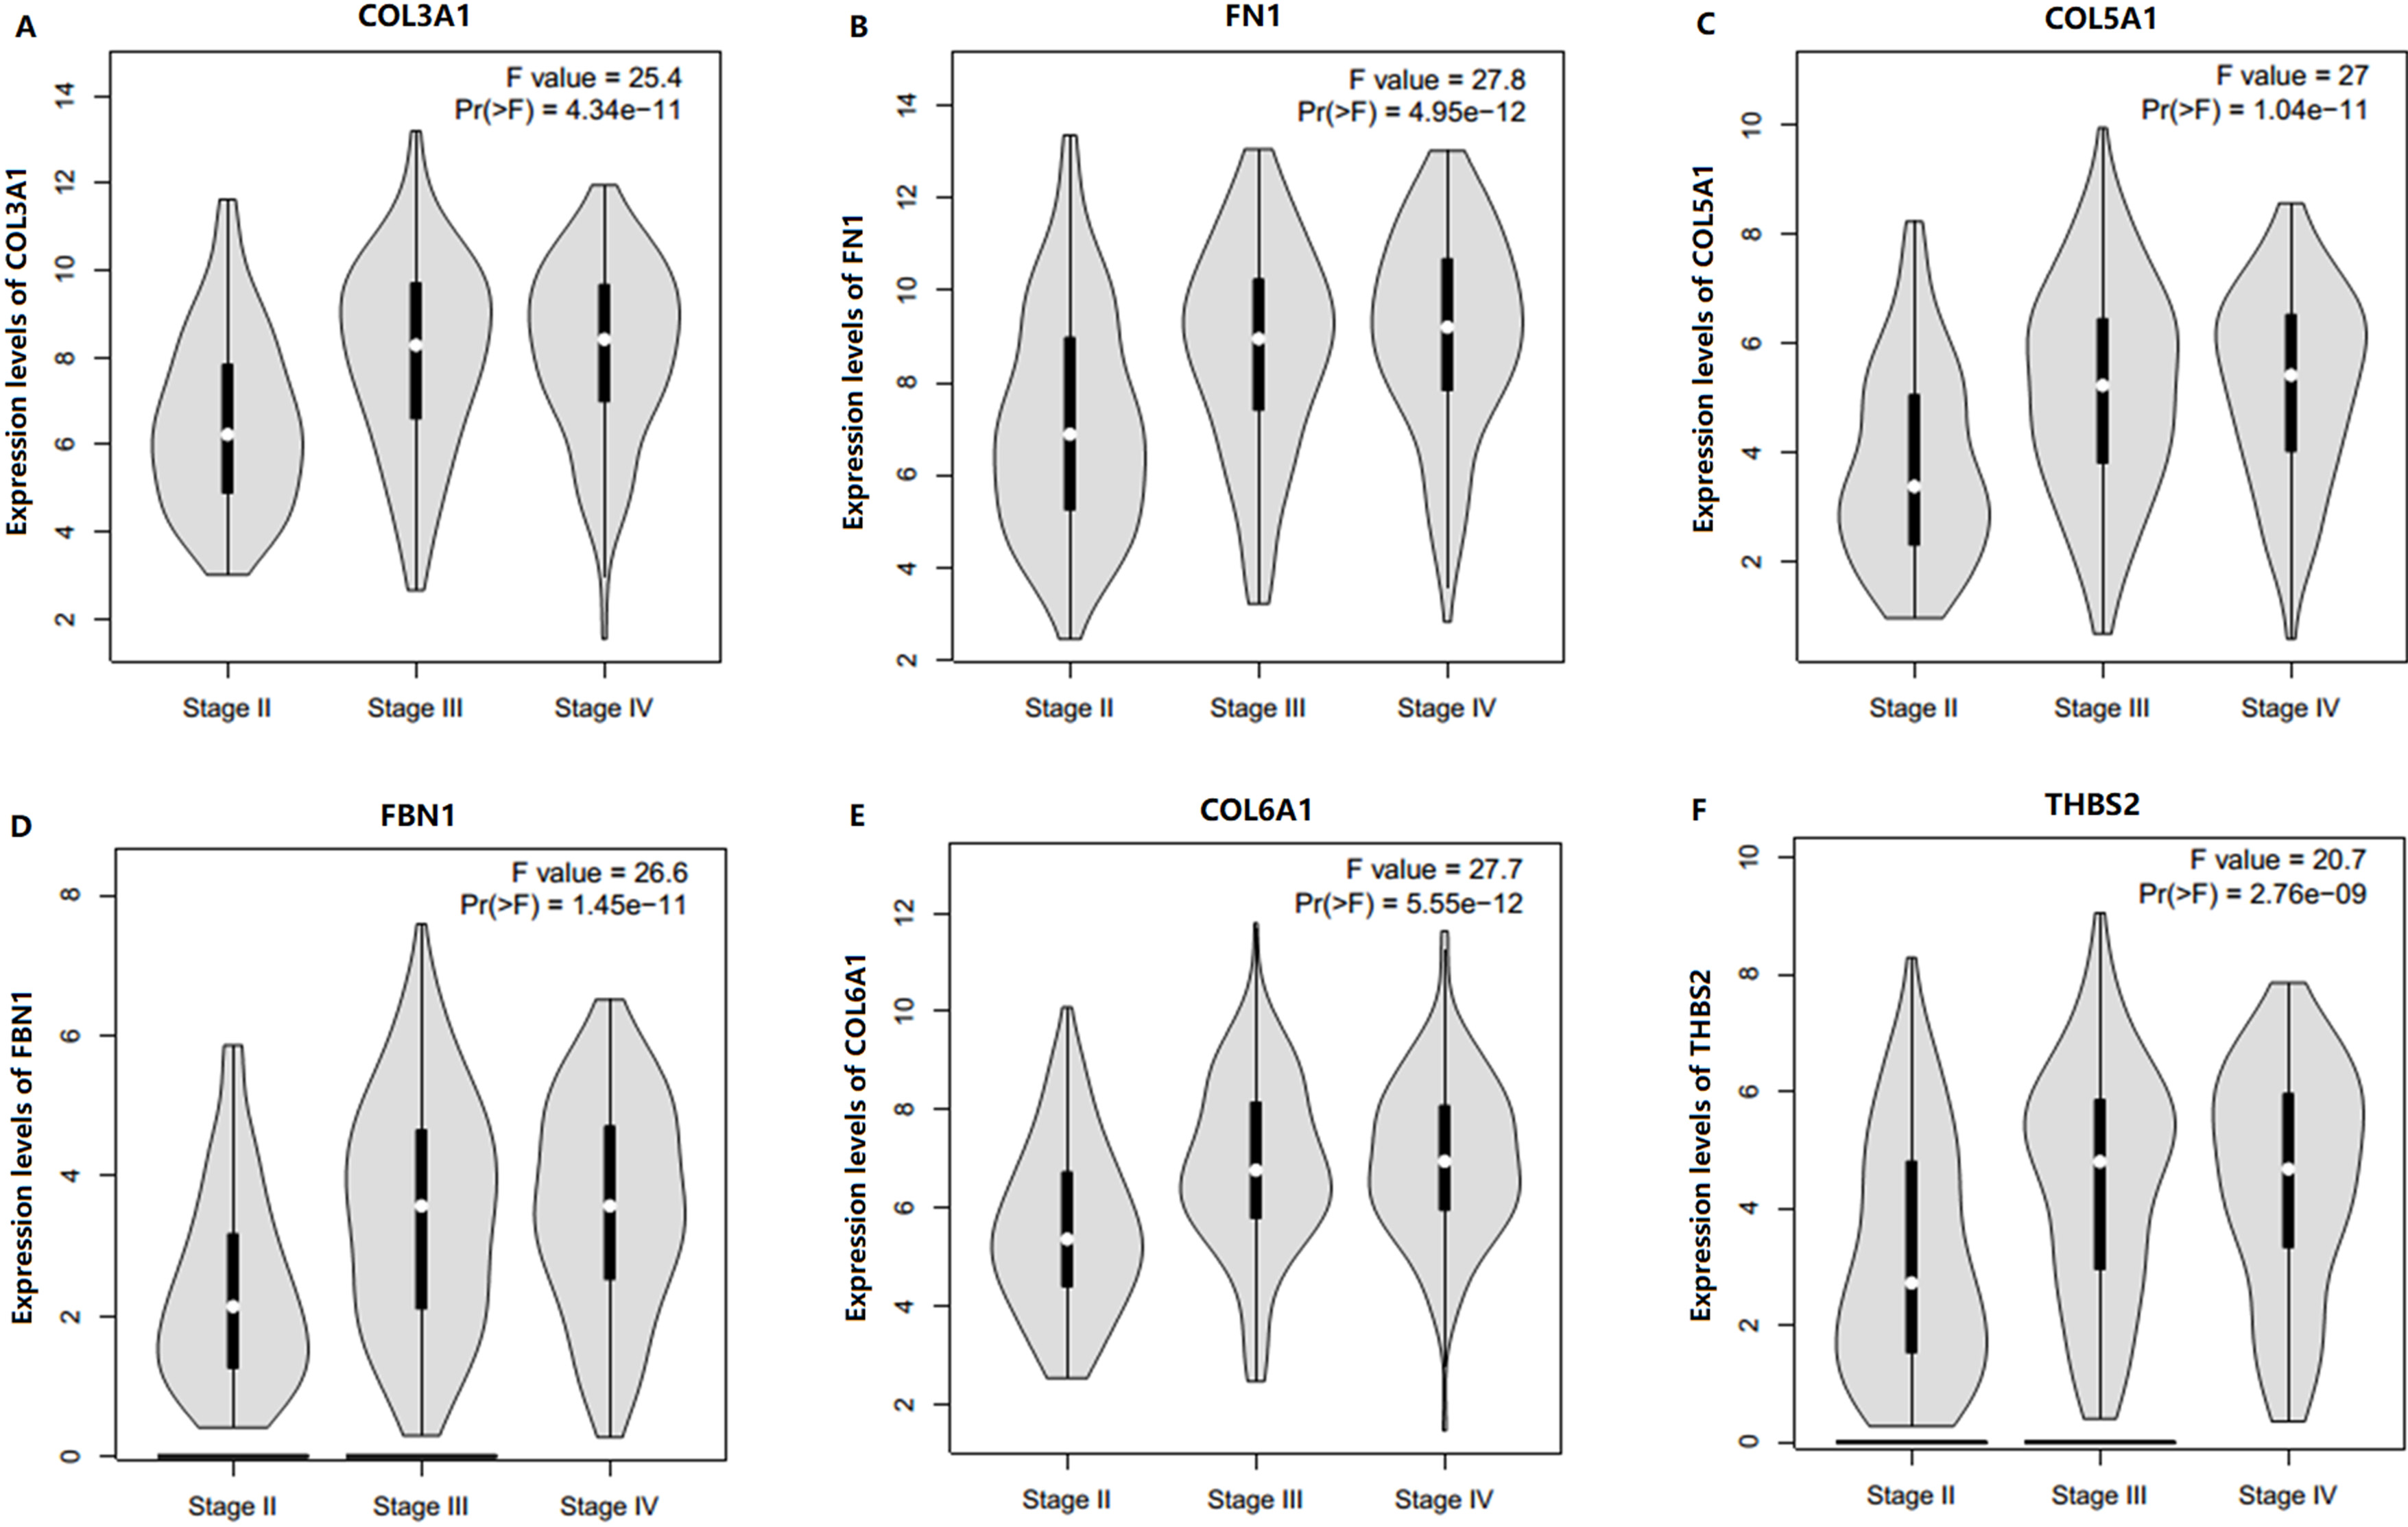
To characterize the potential mechanisms of influence on overall survival of the above six candidate biomarkers, GSEA was conducted. Using the cut-off criterion FDR
Discussion
Bladder cancer is one of the most common cancers with a high rate of recurrence and progression. The prognosis for patients with bladder cancer, especially muscle-invasive bladder cancer, remains poor. Therefore, it is essential to understand the potential mechanisms correlated with the progression of bladder cancer and identify more effective biomarkers for this malignancy.
WGCNA is a recently developed method for the analysis of gene expression data able to identify candidate biomarkers or therapeutic targets. As for bladder cancer, WGCNA has been successfully applied to screen hub genes in studies [25]. Yuan et al. found that over-expression of COL3A1 referred a poor prognosis in bladder cancer via co-expression analysis [14]. Li et al. identified several candidate biomarkers correlated with the TNM staging and overall survival of BC patients using WGCNA [15]. Similarly, Gaballah revealed several gene modules and hub genes associated with the tumor stage of bladder cancer [26]. In addition, Zhang et al. performed single-cell RNA-seq on human squamous cell carcinoma of the bladder and uncovered some hub genes by the WGCNA method [27]. Deng et al. also detected hub genes associated with bladder cancer by constructing differential co-expression networks [28]. In this study, we attempted to perform weighted co-expression network analysis as well as PPI network analysis in order to identify biomarkers significantly associated with the progression and prognosis of bladder cancer and to distinguish NMIBC and MIBC. Eventually, 10 common genes identified in both the weighted co-expression network and PPI network were considered hub genes for further analysis. Our survival analyses of the hub genes indicated that enhanced expressions of six hub genes (COL3A1, FN1, COL5A1, FBN1, COL6A1 and THBS2) were significantly associated with worse overall survival. Furthermore, these survival-associated hub genes were validated in association with the progression of bladder cancer and could distinguish NMIBC and MIBC.
COL3A1, COL5A1 and COL6A1 are members of the collagen family. Collagens are the most abundant components of extracellular matrix (ECM); they provide the structural integrity and tensile strength of human tissues and organs [29]. In the context of cancer biology, collagens regulate the physical and the biochemical properties of the tumor microenvironment, which modulate cancer cell polarity, migration and signaling [30]. COL3A1 encodes the pro-alpha1 chain of type III collagen, a fibrillar collagen that is found in extensible connective tissues. Some studies have reported that COL3A1 could be targeted to regulate cell migration and invasion as well as influence cancer progression [31, 32]. Similarly, COL5A1 encodes an alpha chain of type V collagen, which is found in tissues containing type I collagen and appears to regulate the assembly of heterotypic fibers composed of both type I and type V collagen. Cheon et al. found that COL5A1 was regulated by TGF-beta 1 signaling which could promote metastasis and contribute to poor overall survival for patients with serous ovarian cancer [31, 32]. COL6A2 encodes the alpha 1 subunit of type VI collagen as major structural component of microfibrils. COL6A1 over-expression has been found to be a metastasis-associated gene in cancers [34, 35]. FN1 encodes fibronectin, which is involved in cell adhesion and migration processes, including embryogenesis, wound healing, blood coagulation, host defense, and metastasis. Xu et al. reported that over-expression of FENDER, a long non-coding RNAs that could bind to polycomb repressive complexe 2 and/or Trithorax group/MLL protein complexes, suppressed invasion and migration of gastric cancer cells in vitro by down-regulating FN1 and MMP2/MMP9 expression [36]. FBN1 also encodes a member of the fibrillin protein family. Wang et al. demonstrated that FBN1 could promote ovarian cancer metastasis through the p53 and SLUG-associated signaling [37]. Furthermore, several studies have demonstrated that FBN1 could serve as a cancer biomarker [38, 39]. The protein encoded by THBS2 belongs to the thrombospondin family and may modulate cell surface properties of mesenchymal cells and be involved in cell adhesion and migration. Cheon et al. reported that THBS2 could promote metastasis in patients with serous ovarian cancer contribute to poor OS in patients with serous ovarian cancer [33]. Finally, Hsu et al. also revealed that THBS2 could be a potentially useful salivary marker for the detection of oral cavity squamous cell carcinoma [40].
GSEA was employed to explore the potential mechanisms influencing overall survival of the above 6 candidate biomarkers. Our results indicated that bladder cancer samples with relatively increased expression of these genes were most significantly enriched in gene set associated with “ECM-receptor interaction”. In summary, we can assume that these six hub genes influence the progression and prognosis of bladder cancer probably by regulating the tumor microenvironment.
Finally, highly co-expressed genes were connected and grouped into modules by WGCNA, thus, different modules included different functionally related genes. In order to better define the potential mechanisms correlated with the progression of bladder cancer, we performed functional and pathway enrichment analysis of genes in each module. Functional and pathway enrichment analysis indicated that DEGs between NMIBC and MIBC were enriched in GO terms and pathways associated with the ECM, immunity and fatty acid metabolism. The ECM is a complex meshwork composed of approximately 300 proteins that are important regulators of cell proliferation, survival, differentiation, and migration [41, 42]. However, ECM is commonly deregulated and becomes disorganized in cancers, which leads to generation of a tumorigenic microenvironment and affects cancer progression [43, 44, 45, 46]. Furthermore, cancer development and its response to therapy are strongly influenced by innate and adaptive immunity, which either promote or attenuate tumorigenesis and can have opposing effects on the therapeutic outcome. Interestingly, antitumor immune responses activated by tumor-specific antigens and tumor-associated antigens could fight tumors, while chronic inflammation can promote tumor development, progression, and metastatic dissemination, as well as treatment resistance [47]. Immune checkpoint therapy, which could enhance antitumor immune responses, has led to important clinical advances and provided a new weapon against cancer [48]. As to the fatty acid metabolism, epidemiologic studies reported that the high level of dietary fatty acids intake had been implicated in the development of several human malignancies [49]. There is increasing evidence that cancer cells show specific alterations of fatty-acid metabolism, which can affect numerous cellular processes, including cell growth, proliferation, differentiation and motility [50]. In addition, fatty-acid metabolism is now associated with clinically aggressive tumor behavior and tumor-cell growth and survival, which may offer novel therapeutic strategies for cancer treatment [51]. Thus, we can assume that the ECM, immunity and fatty acid metabolism play important roles in bladder cancer progression.
Conclusion
This study used weighted gene co-expression analysis to construct a gene co-expression network, identify and validate network hub genes associated with the progression and poor prognosis of bladder cancer. Eventually, six potential biomarkers, including COL3A1, FN1, COL5A1, FBN1, COL6A1 and THBS2, were identified and validated in association with the progression and poor prognosis of bladder cancer probably by regulating the tumor microenvironment. However, further studies are still needed to confirm these observations.
Footnotes
Acknowledgments
The free use of GEO, GEPIA and TCGA databases were acknowledged.
Supplementary data
The supplementary files are available to download from http://dx.doi.org/10.3233/CBM-181940.