
Abstract
BACKGROUND:
Hepatocellular carcinoma (HCC) is one of the most common liver malignancies in the world. With highly invasive biological characteristics and a lack of obvious clinical manifestations, hepatocellular carcinoma usually has a poor prognosis and ranks fourth in cancer mortality. The etiology and exact molecular mechanism of primary hepatocellular carcinoma are still unclear.
OBJECTIVE:
This work aims to help identify biomarkers of early HCC diagnosis or prognosis based on weighted gene co-expression network analysis (WGCNA).
METHODS:
Expression data and clinical information of HTSeq-Counts were downloaded from The Cancer Genome Atlas (TCGA) database, and gene expression map GSE121248 was downloaded from Gene Expression Omnibus (GEO). By differentially expressed genes (DEGs) and weighted gene co-expression network analysis (WGCNA) searched for modules in the two databases that had the same effect on the biological characteristics of HCC, and extracted the module genes with the highest positive correlation with HCC from two databases, and finally obtained overlapping genes. Then, we performed functional enrichment analysis on the overlapping genes to understand their potential biological functions. The top ten hub genes were screened according to MCC through the string database and Cytoscape software and then subjected to survival analysis.
RESULTS:
High expression of CDK1, CCNA2, CDC20, KIF11, DLGAP5, KIF20A, ASPM, CEP55, and TPX2 was associated with poorer overall survival (OS) of HCC patients. The DFS curve was plotted using the online website GEPIA2. Finally, based on the enrichment of these genes in the KEGG pathway, real hub genes were screened out, which were CDK1, CCNA2, and CDC20 respectively.
CONCLUSIONS:
High expression of these three genes was negatively correlated with survival time in HCC, and the expression of CDK1, CCNA2, and CDC20 were significantly higher in tumor tissues of HCC patients than in normal liver tissues as verified again by the HPA database. All in all, this provides a new feasible target for early and accurate diagnosis of HCC, clinical diagnosis, treatment, and prognosis.
Keywords
Introduction
Hepatocellular carcinoma (HCC) is currently the fifth most prevalent and fourth most deadly disease in the world [1]. It increases year by year, and the incidence of males is much higher than that of females, and the incidence of males and females is 2.8:1 [2]. Globally, East Asia and Africa have the highest incidence of HCC, but the incidence and mortality of HCC are also increasing in Europe and the United States. Hepatitis B virus (HBV) infection accounts for 60% in Asia, and cirrhosis is the strongest risk factor [3]. Among the new cancer cases in China in 2020, liver cancer added about 302,598 among men, ranking fourth and accounting for 47.86% of the global incidence. Liver cancer added 107,440 among women, ranking 7th and accounting for 39.30% of the global incidence rate. In China, the death toll of liver cancer ranked second among men and fifth among women in 2020, accounting for 49.89% and 40.78% of the global death toll of liver cancer, respectively [4]. According to the SEER database of The National Cancer Institute, the average five-year survival rate of HCC patients in the United States is 19.6%, but for advanced and metastatic diseases, the survival rate may be as low as 2.5% [1]. Currently, there are surgical and non-surgical treatments for HCC. Among them, surgical treatment includes partial liver resection and liver transplantation, which are suitable for early patients. Non-surgical treatment includes tumor radiotherapy, chemotherapy, biotherapy, immunotherapy, etc., both surgical and non-surgical treatment have a significant effect on early patients, but the treatment effect on advanced patients is not good. Therefore, how to improve the early diagnosis rate of HCC patients is the focus of our attention. The current outlook for HCC has mentioned that screening with novel serum biomarkers may help in early patient diagnosis and more effective selection of appropriate treatments for the disease, thus effectively improving patient survival cycles, survival rates, etc. [3].
In recent years, with the rapid development of high-throughput measurement technologies, bioinformatics analysis of expression profiles has been widely used to find potential targets for cancer and biomarkers for patient prognostic analysis [5]. Differential gene expression analysis between different clinical phenotypes is a common method to search for potential biomarkers of diseases. Weighted gene co-expression network analysis allows the construction of co-expressed gene modules by finding coordinately expressed gene modules and analyzing the relationship between different modules and specific features [6].
In our study, overlapping genes were obtained by using a combination of differential gene analysis and WGCNA on HCC samples from the TCGA and GEO databases. The real hub genes were obtained by further analysis of biological functions and clinical characteristics of overlapping genes. The final results are helpful for us to further understand the mechanism of occurrence and development of HCC and provide new molecular targets for early detection and treatment of HCC.
Methods
The flow chart of this research is shown in Fig. 1.
The flow chart of present study.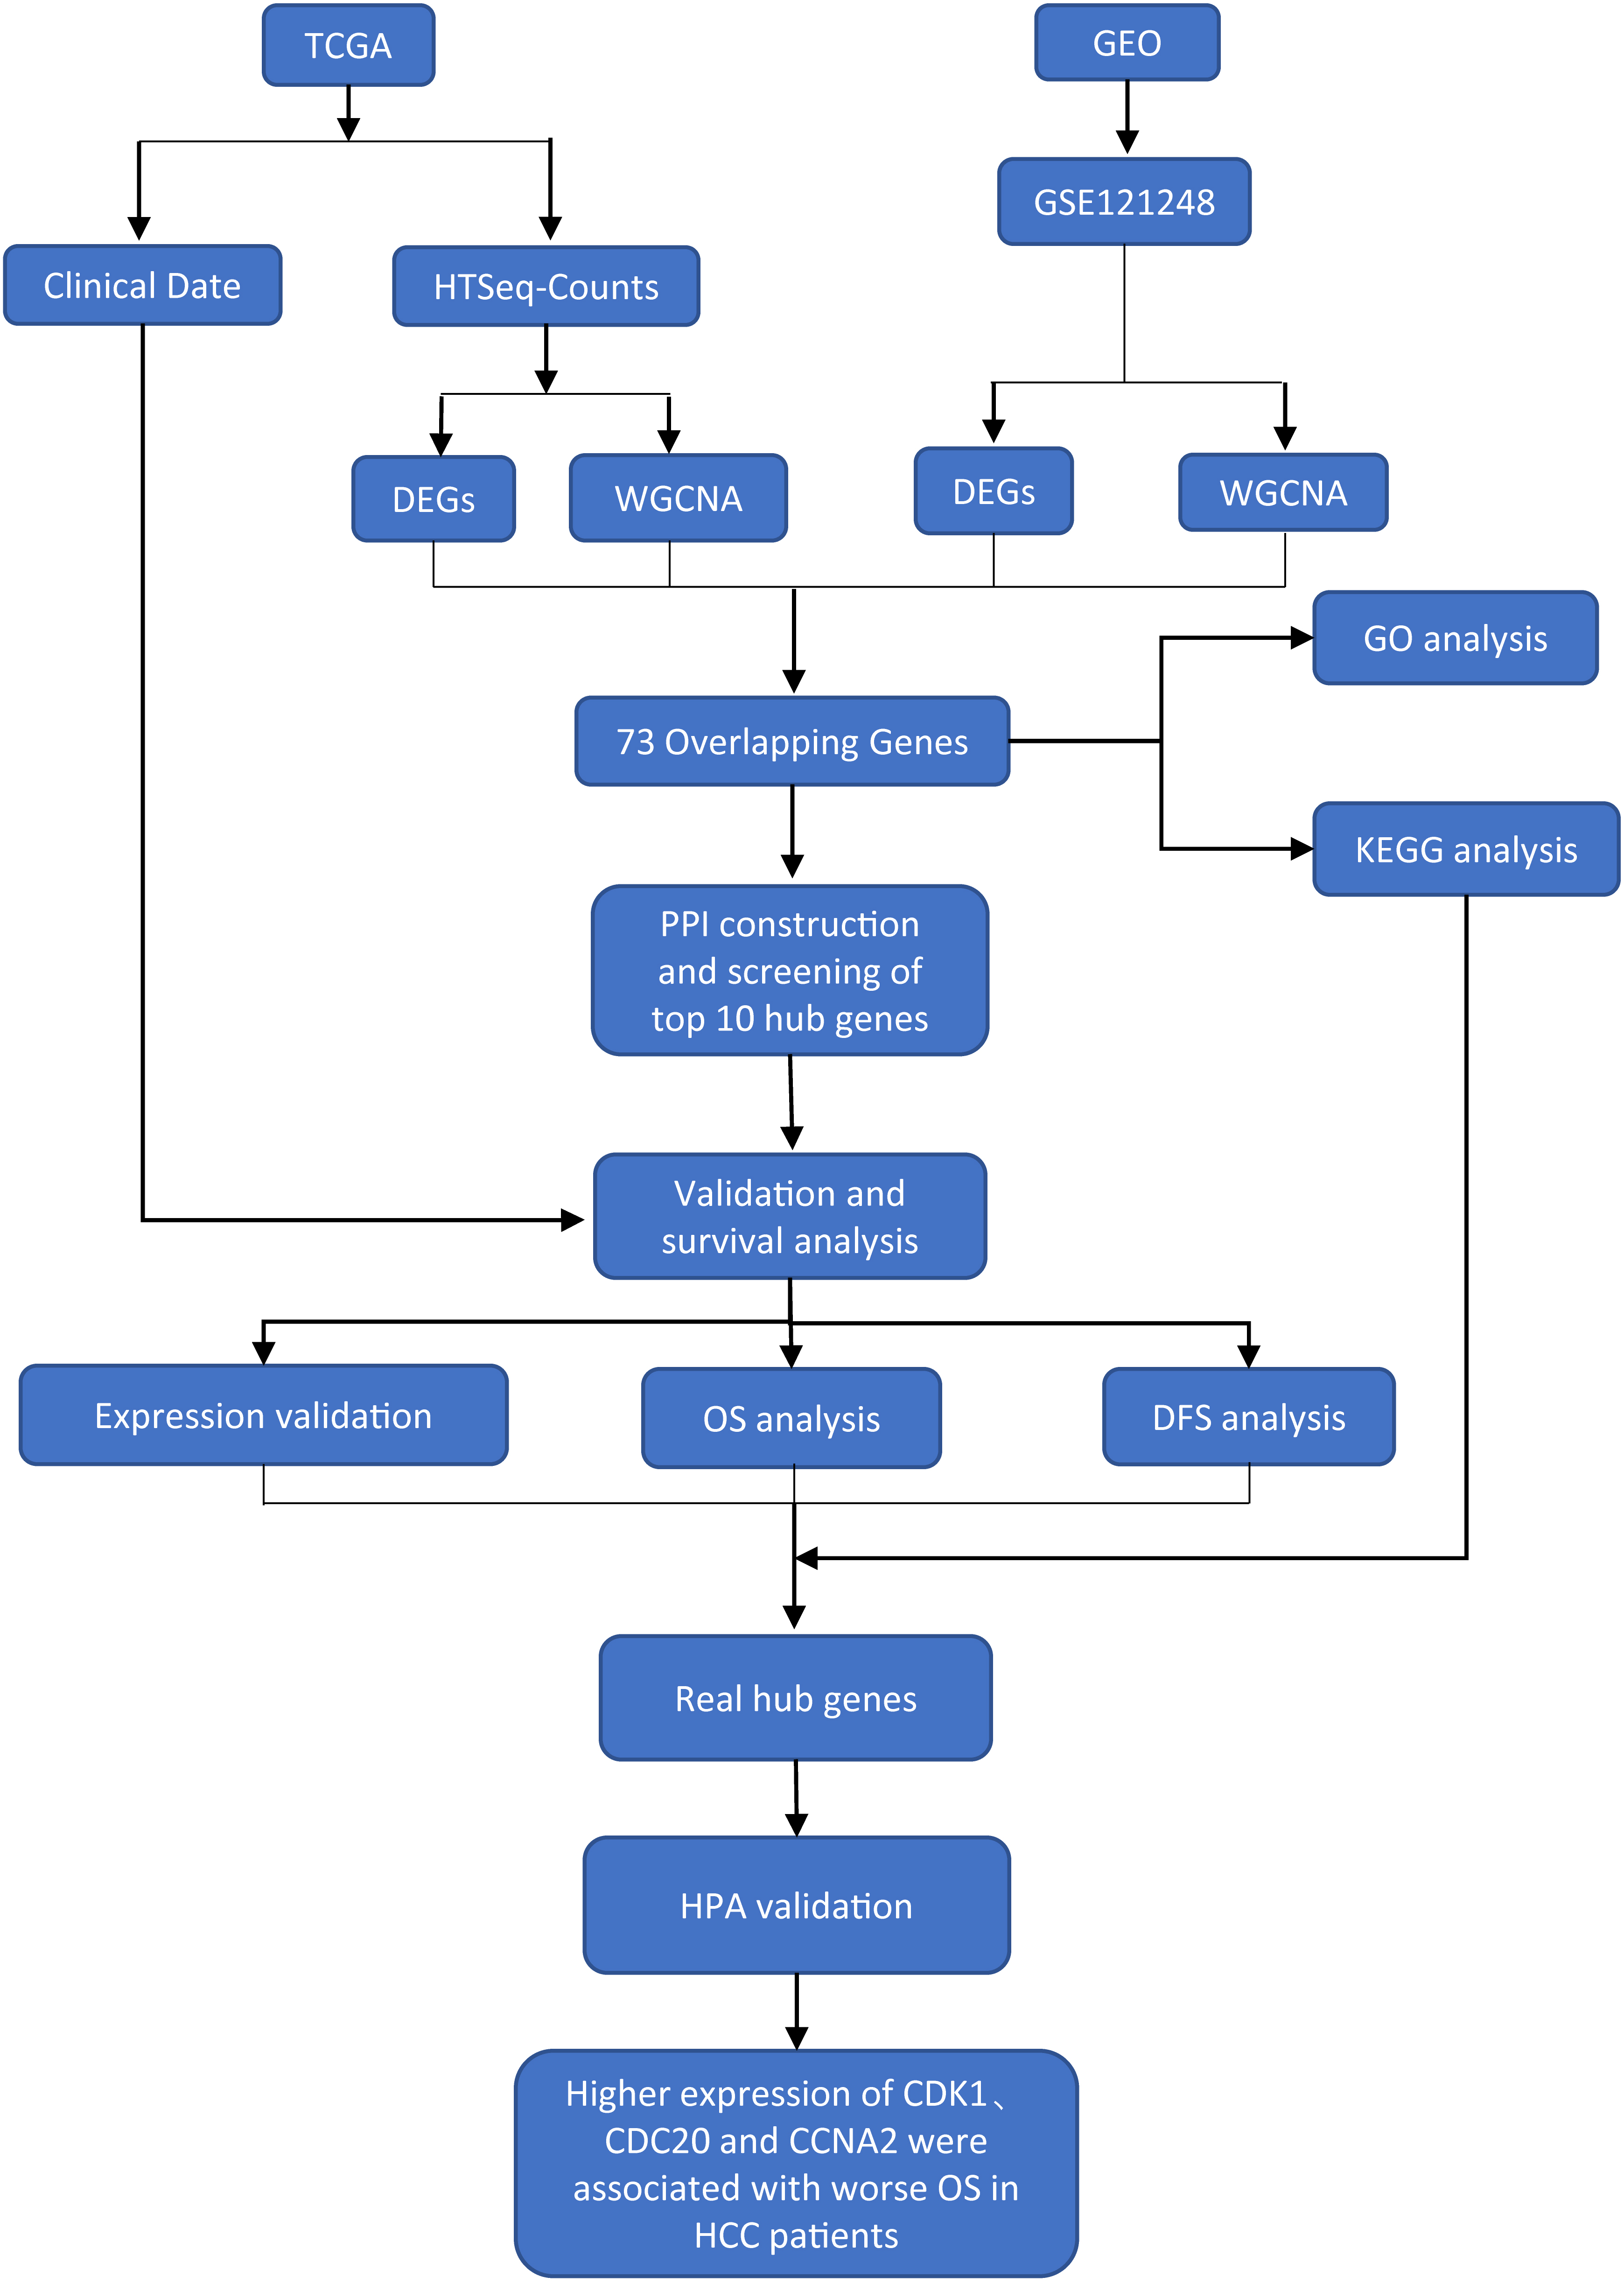
The Cancer Genome Atlas (TCGA) [7] database downloaded 424 HTSeq-Counts expression data on HCC and clinical information (
Differentially expressed genes identification
Significance analysis of differential gene expressions (DEGs) between tumor tissue and normal tissue samples was performed using the Limma package (
Weighted gene co-expression network analysis and overlapping genes construction
WGCNA is an analytical method for analyzing the gene expression profiles of multiple samples. It allows clustering of genes with similar expression patterns and analysis of the relationship between modules and specific traits or phenotypes. Distances between different transcripts were calculated using Pearson correlation coefficients. In our study, the “WGCNA” [6] software package of R language was used to implement weighted gene co-expression network analysis (WGCNA) and construct a weighted co-expression network for gene expression data of HCC. The weighted adjacency matrix is transformed into a topological overlap matrix (TOM) to detect network interactions and a hierarchical clustering approach is used to build a clustering tree structure for the TOM matrix. Eventually, genes with similar expression patterns are combined into the same module. The “VennDiagram” R language package [10] was used to draw the Venn diagram of TCGA and modules in GSE121248 that are positively correlated with tumor tissues.
The volcano plot of DEGs between HCC and normal tissue. (A) Volcano plot of DEGs in the TCGA-LIHC dataset. (B) Volcano plot of DEGs in the GSE121248 dataset.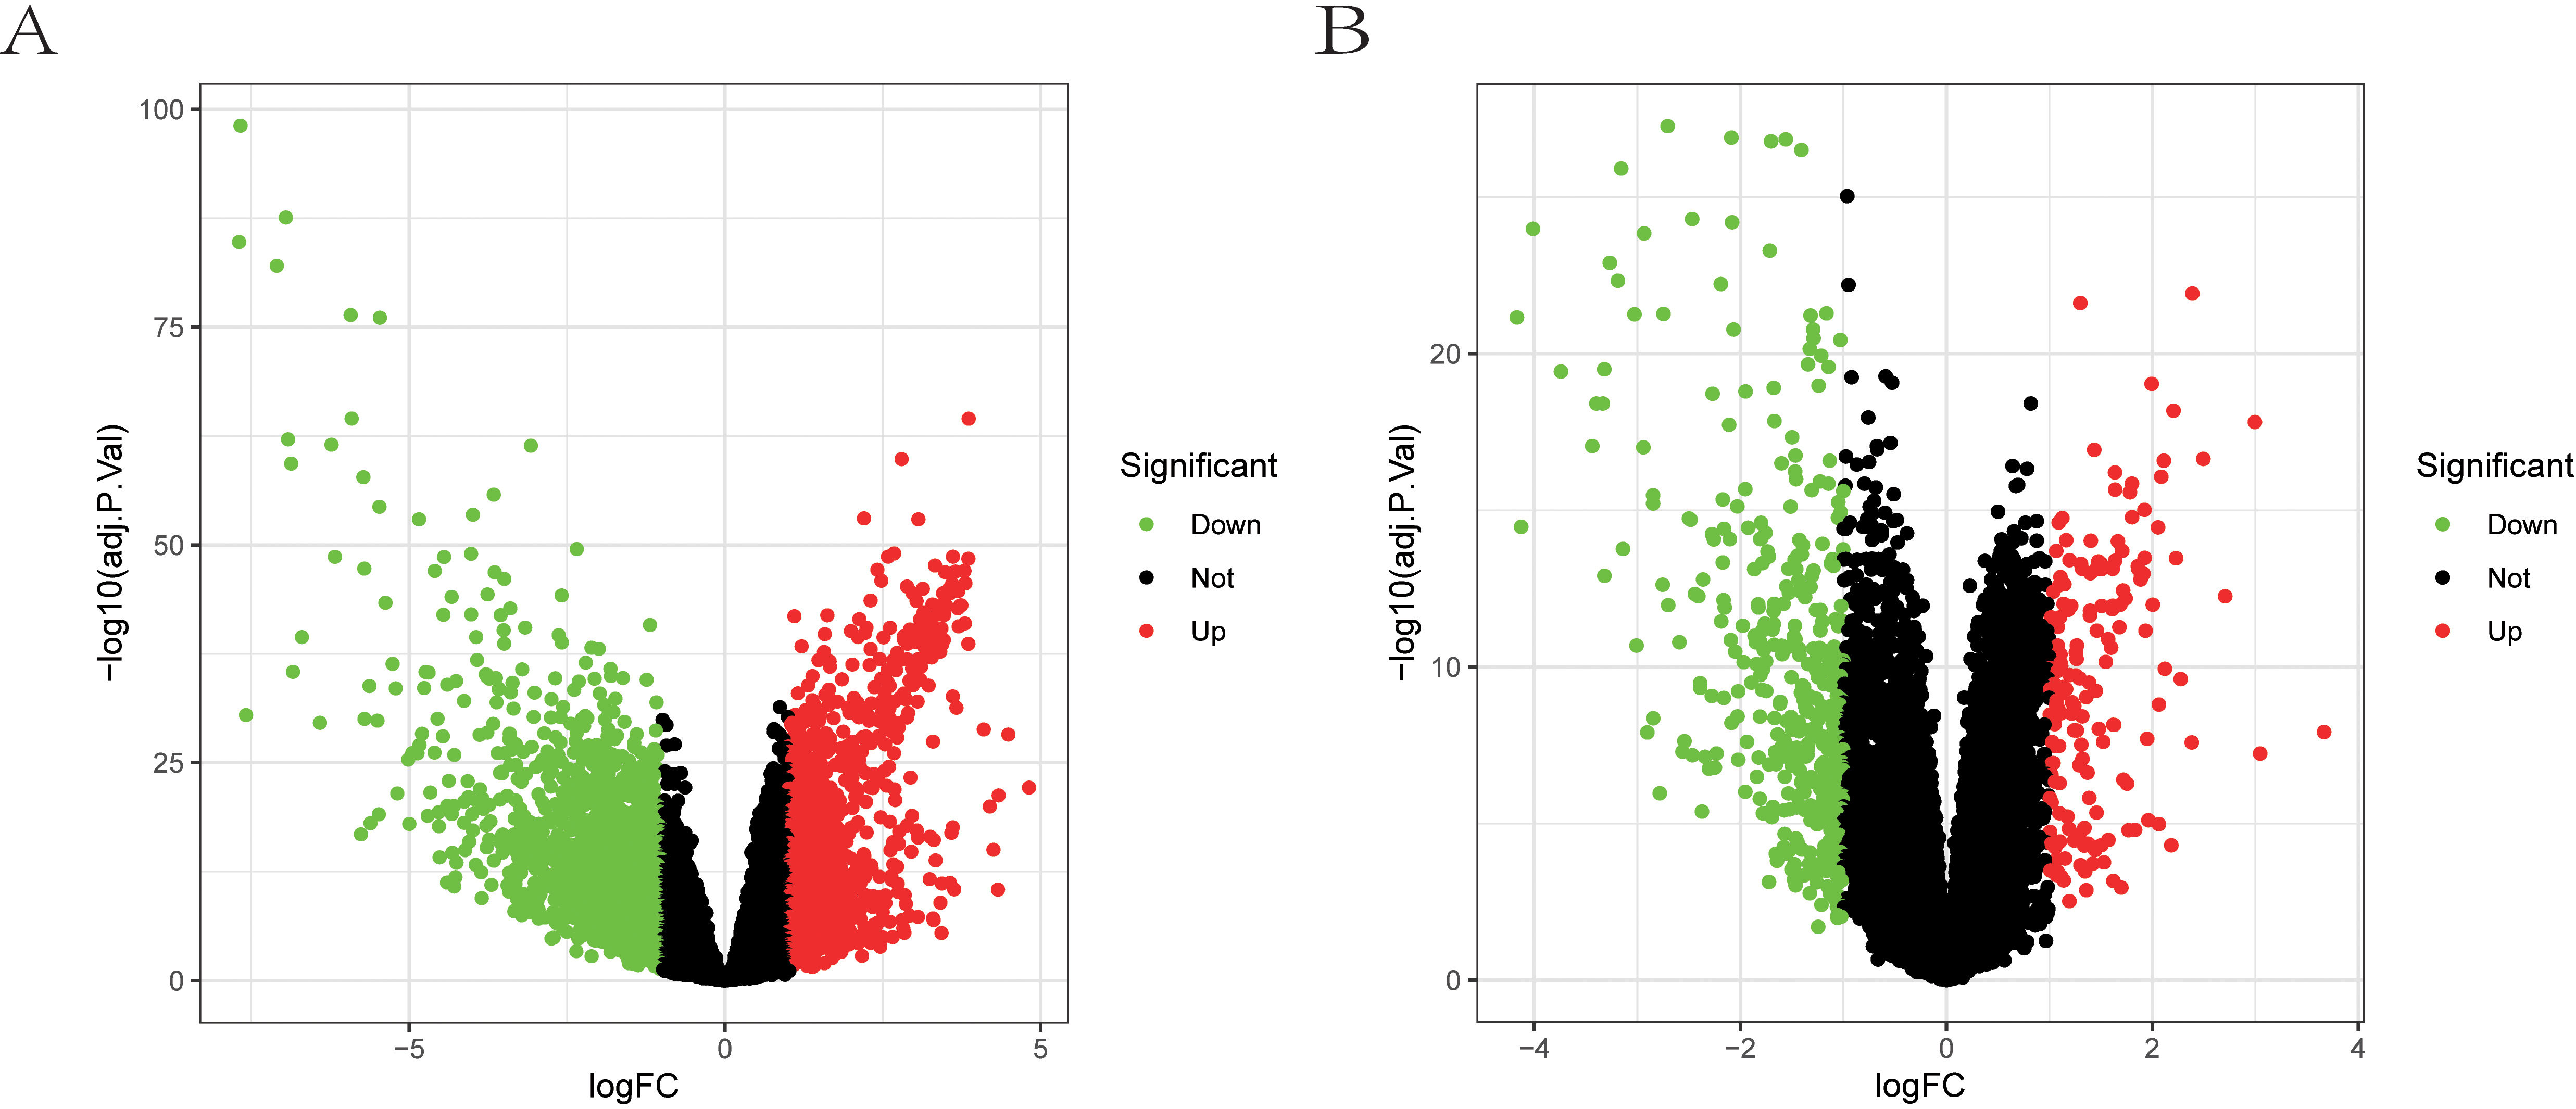
GO enrichment analysis can effectively predict the biological characteristics of overlapping genes, and KEGG can effectively analyze the pathways of gene function. Functional annotation of Gene Ontology (GO) and Kyoto Encyclopedia of Genes and Genomes (KEGG) based on R language package clusterProfiler [11] pathway enrichment analysis. Adjusted
Identification of hub genes in functional modules
The intersection of TCGA-LIHC and tumor tissue positively related modules in GSE121248 is obtained to obtain overlapping genes, which are imported into STRING 11.5 (
Hub genes clinical trait validation and survival analysis
To better verify the relationship between hub genes and HCC patients, the Transcripts Per Million (TPM) was used as the standardized value for sample difference analysis, and the expression point map of hub genes in normal tissues, as well as tumor tissues, were plotted. To obtain the relationship between hub genes and clinical characteristics, a survival R language package was used to analyze the clinical information of HCC patients downloaded from TCGA with hub genes. The R package “Survival” and “SurvMiner” used in survival analysis need to perform the log-rank test and set
Validation of hub genes protein expression by the human protein atlas database
The Human Protein Atlas database (HPA) (
The heatmaps of DEGs between HCC and normal tissues. (A) The heatmap of DEGs obtained from TCGA-LIHC dataset. (B) The heatmap of DEGs obtained from GSE121248 dataset.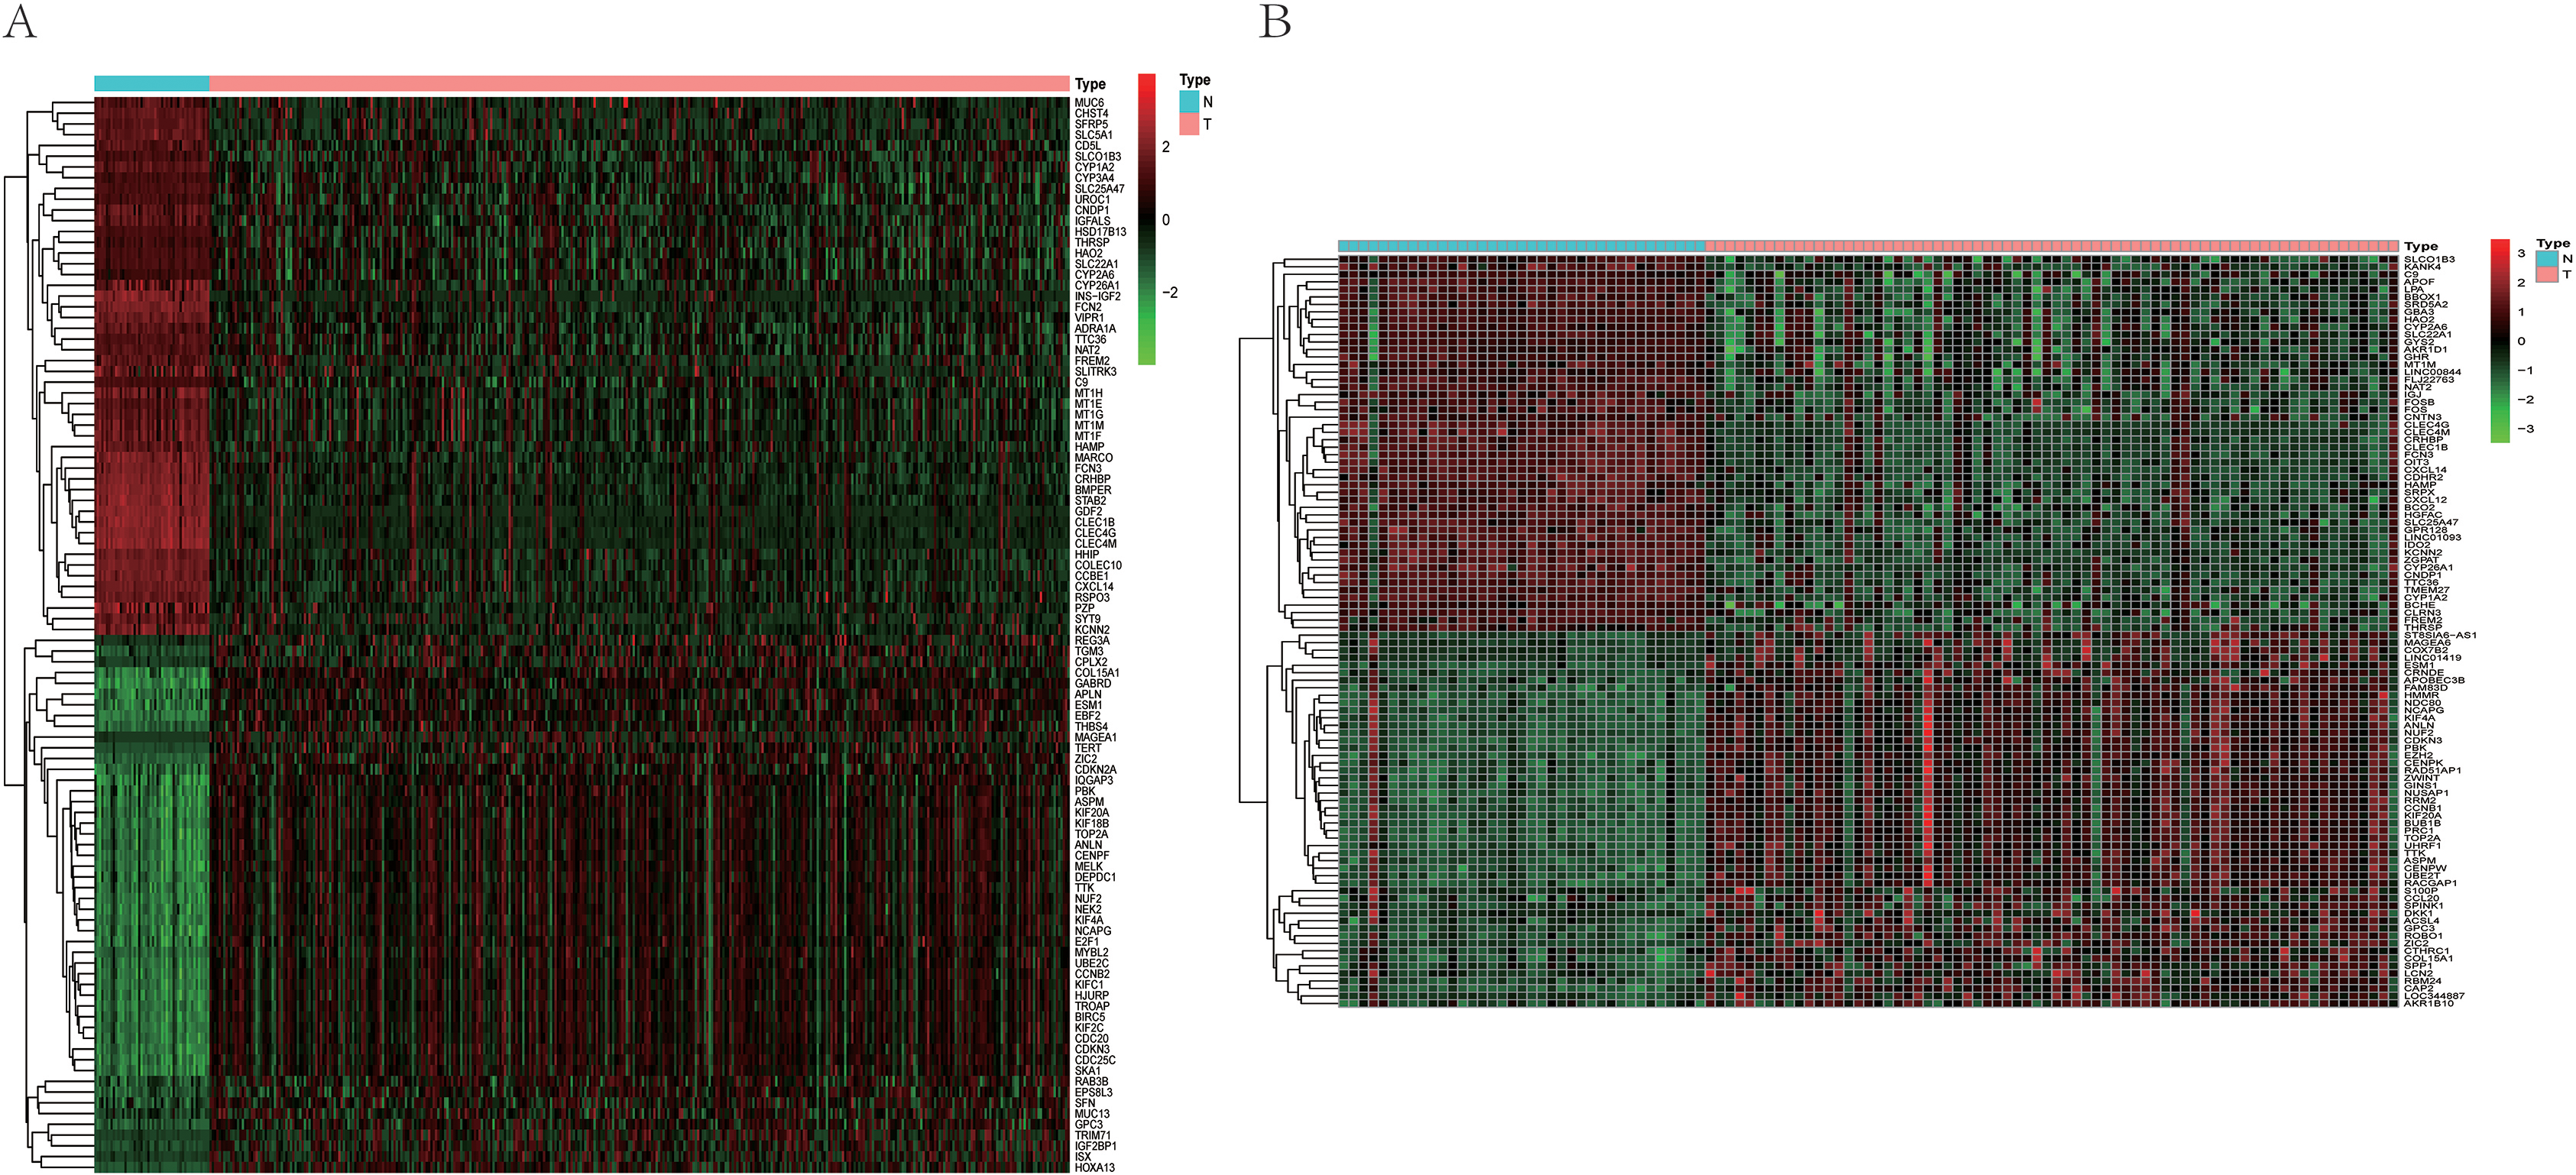
Weighted gene co-expression modules construction and selection from TCGA-LIHC. (A) The left graph shows the scale free fit index for soft-threshold powers. The right graph displays the mean connectivity for soft-threshold powers. (B) Hierarchical clustering analyses in TCGA-LIHC. (C) Dendrogram of all co-expression genes modules were clustered based on a dissimilarity measure (1-TOM).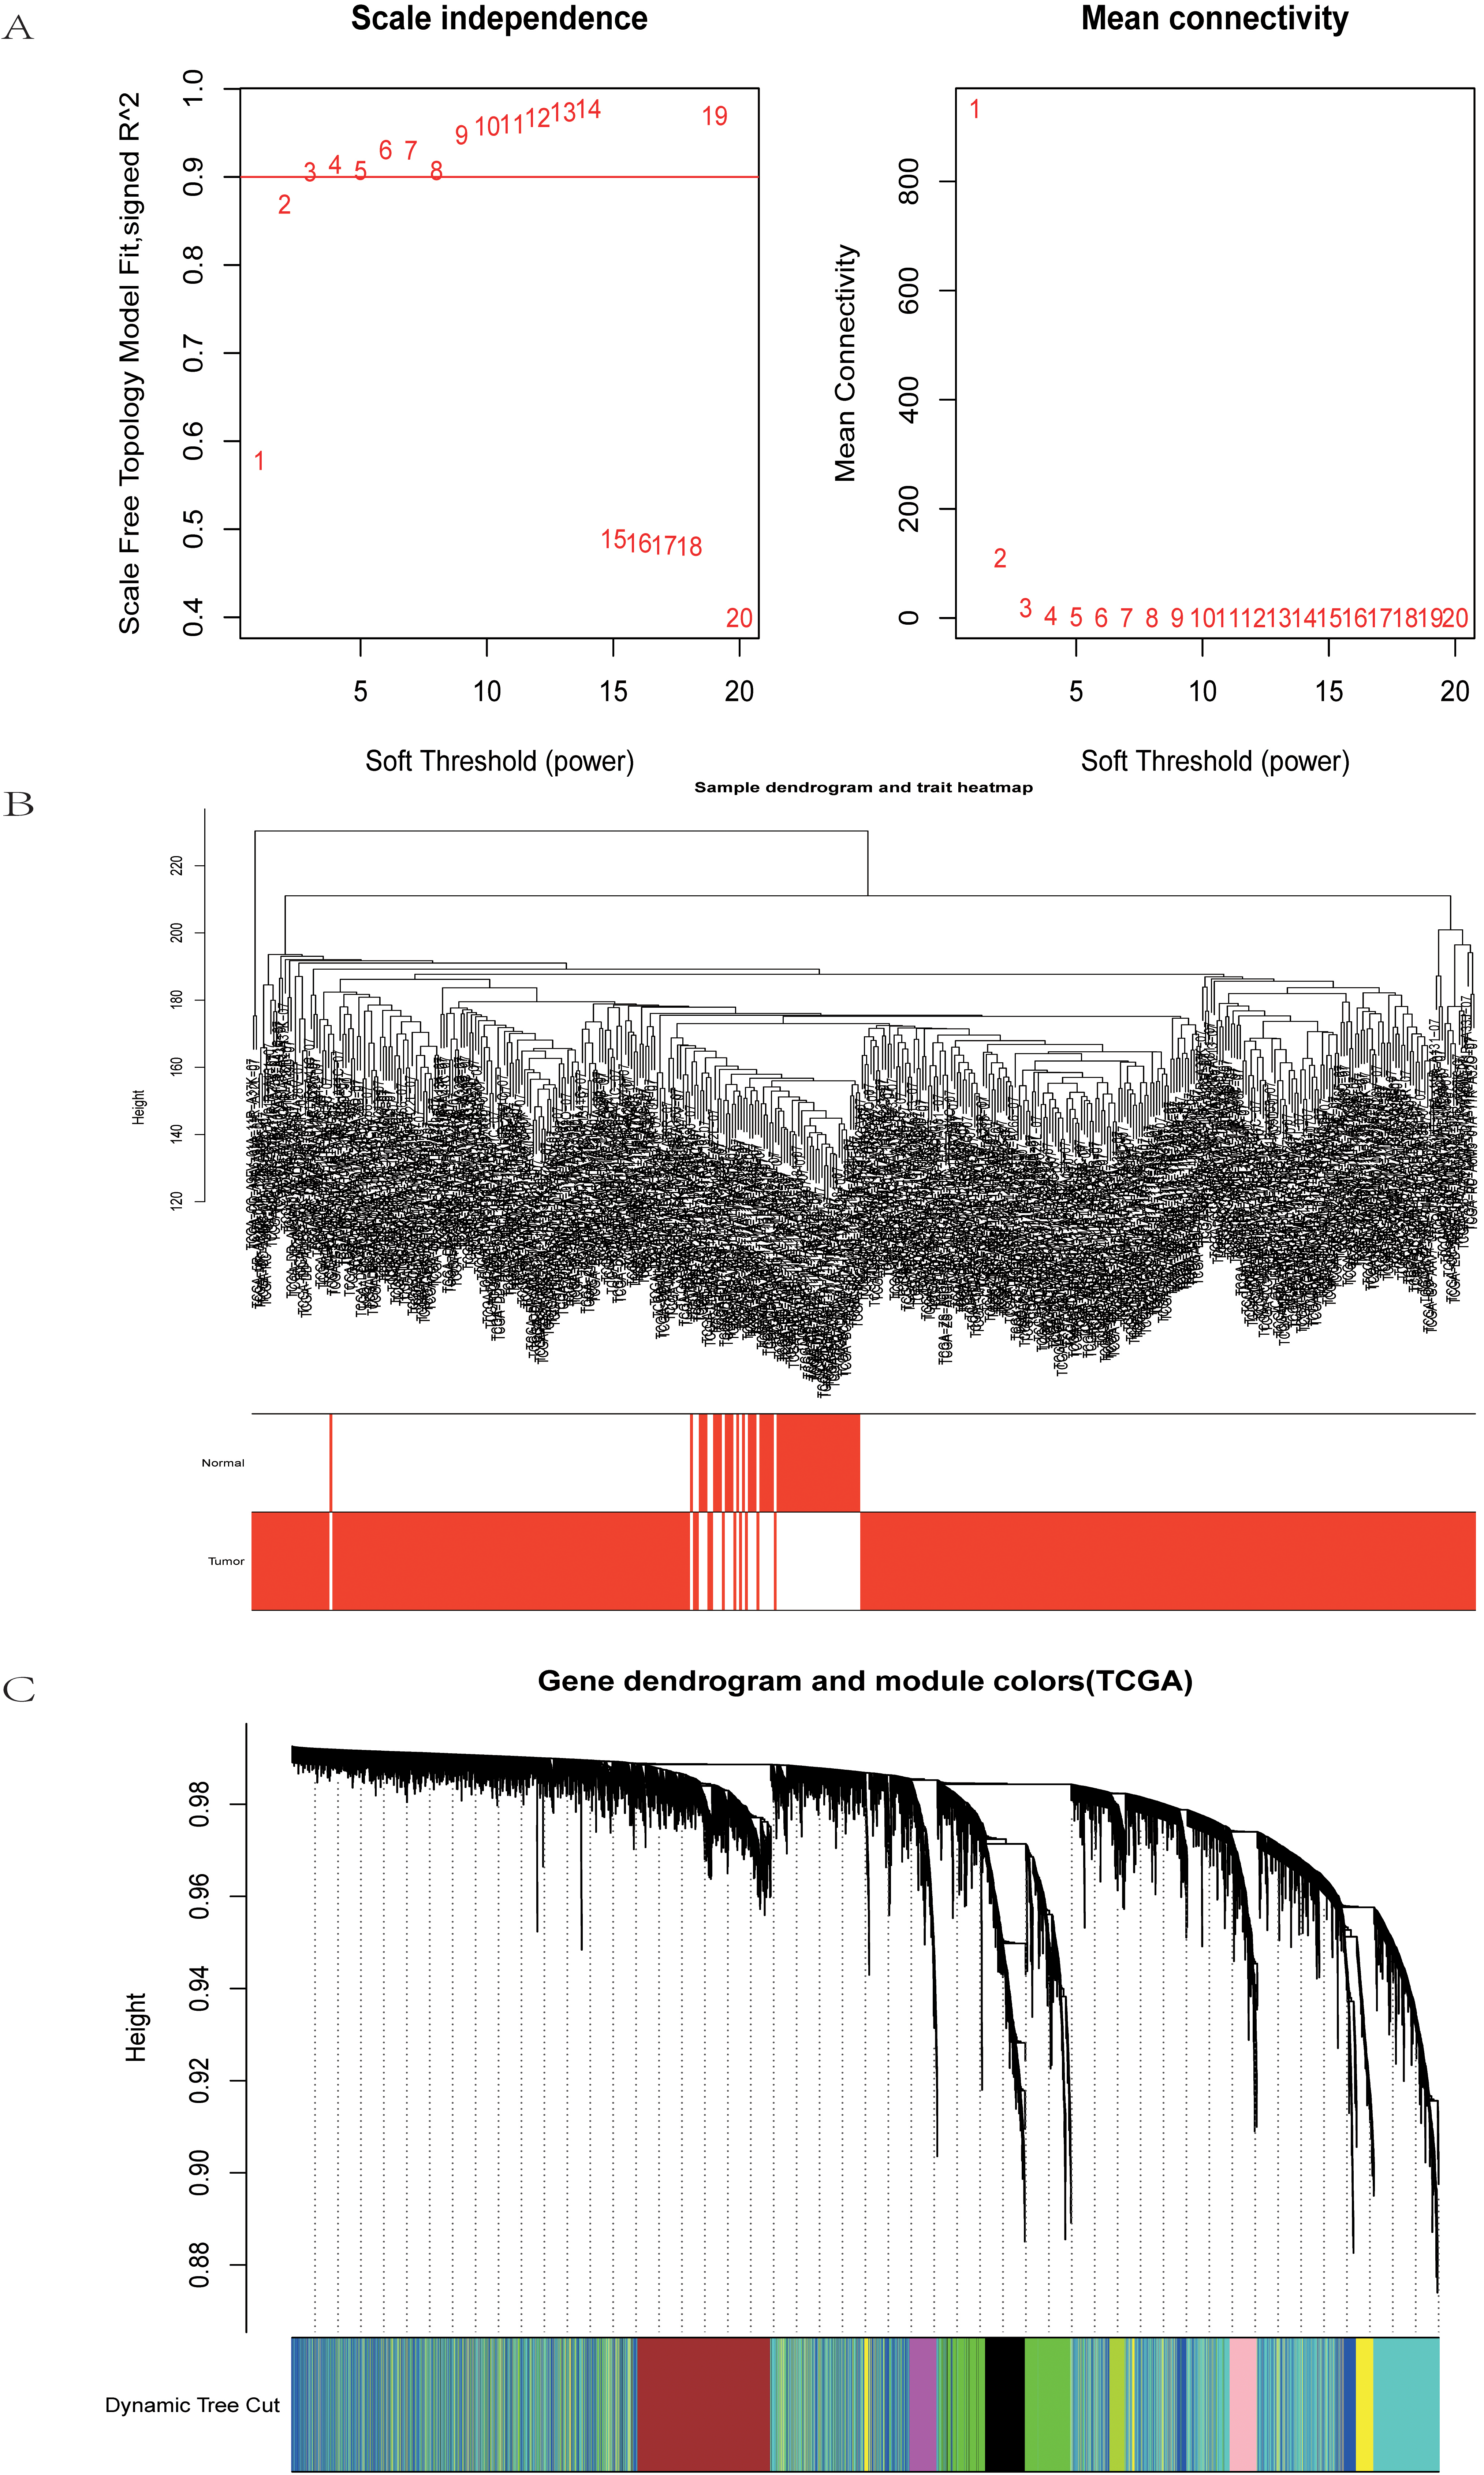
Weighted gene co-expression modules construction and selection from GES121248. (A) The left graph shows the scale free fit index for soft-threshold powers. The right graph displays the mean connectivity for soft-threshold powers. (B) Hierarchical clustering analyses in GES121248. (C) Dendrogram of all co-expression genes modules were clustered based on a dissimilarity measure (1-TOM).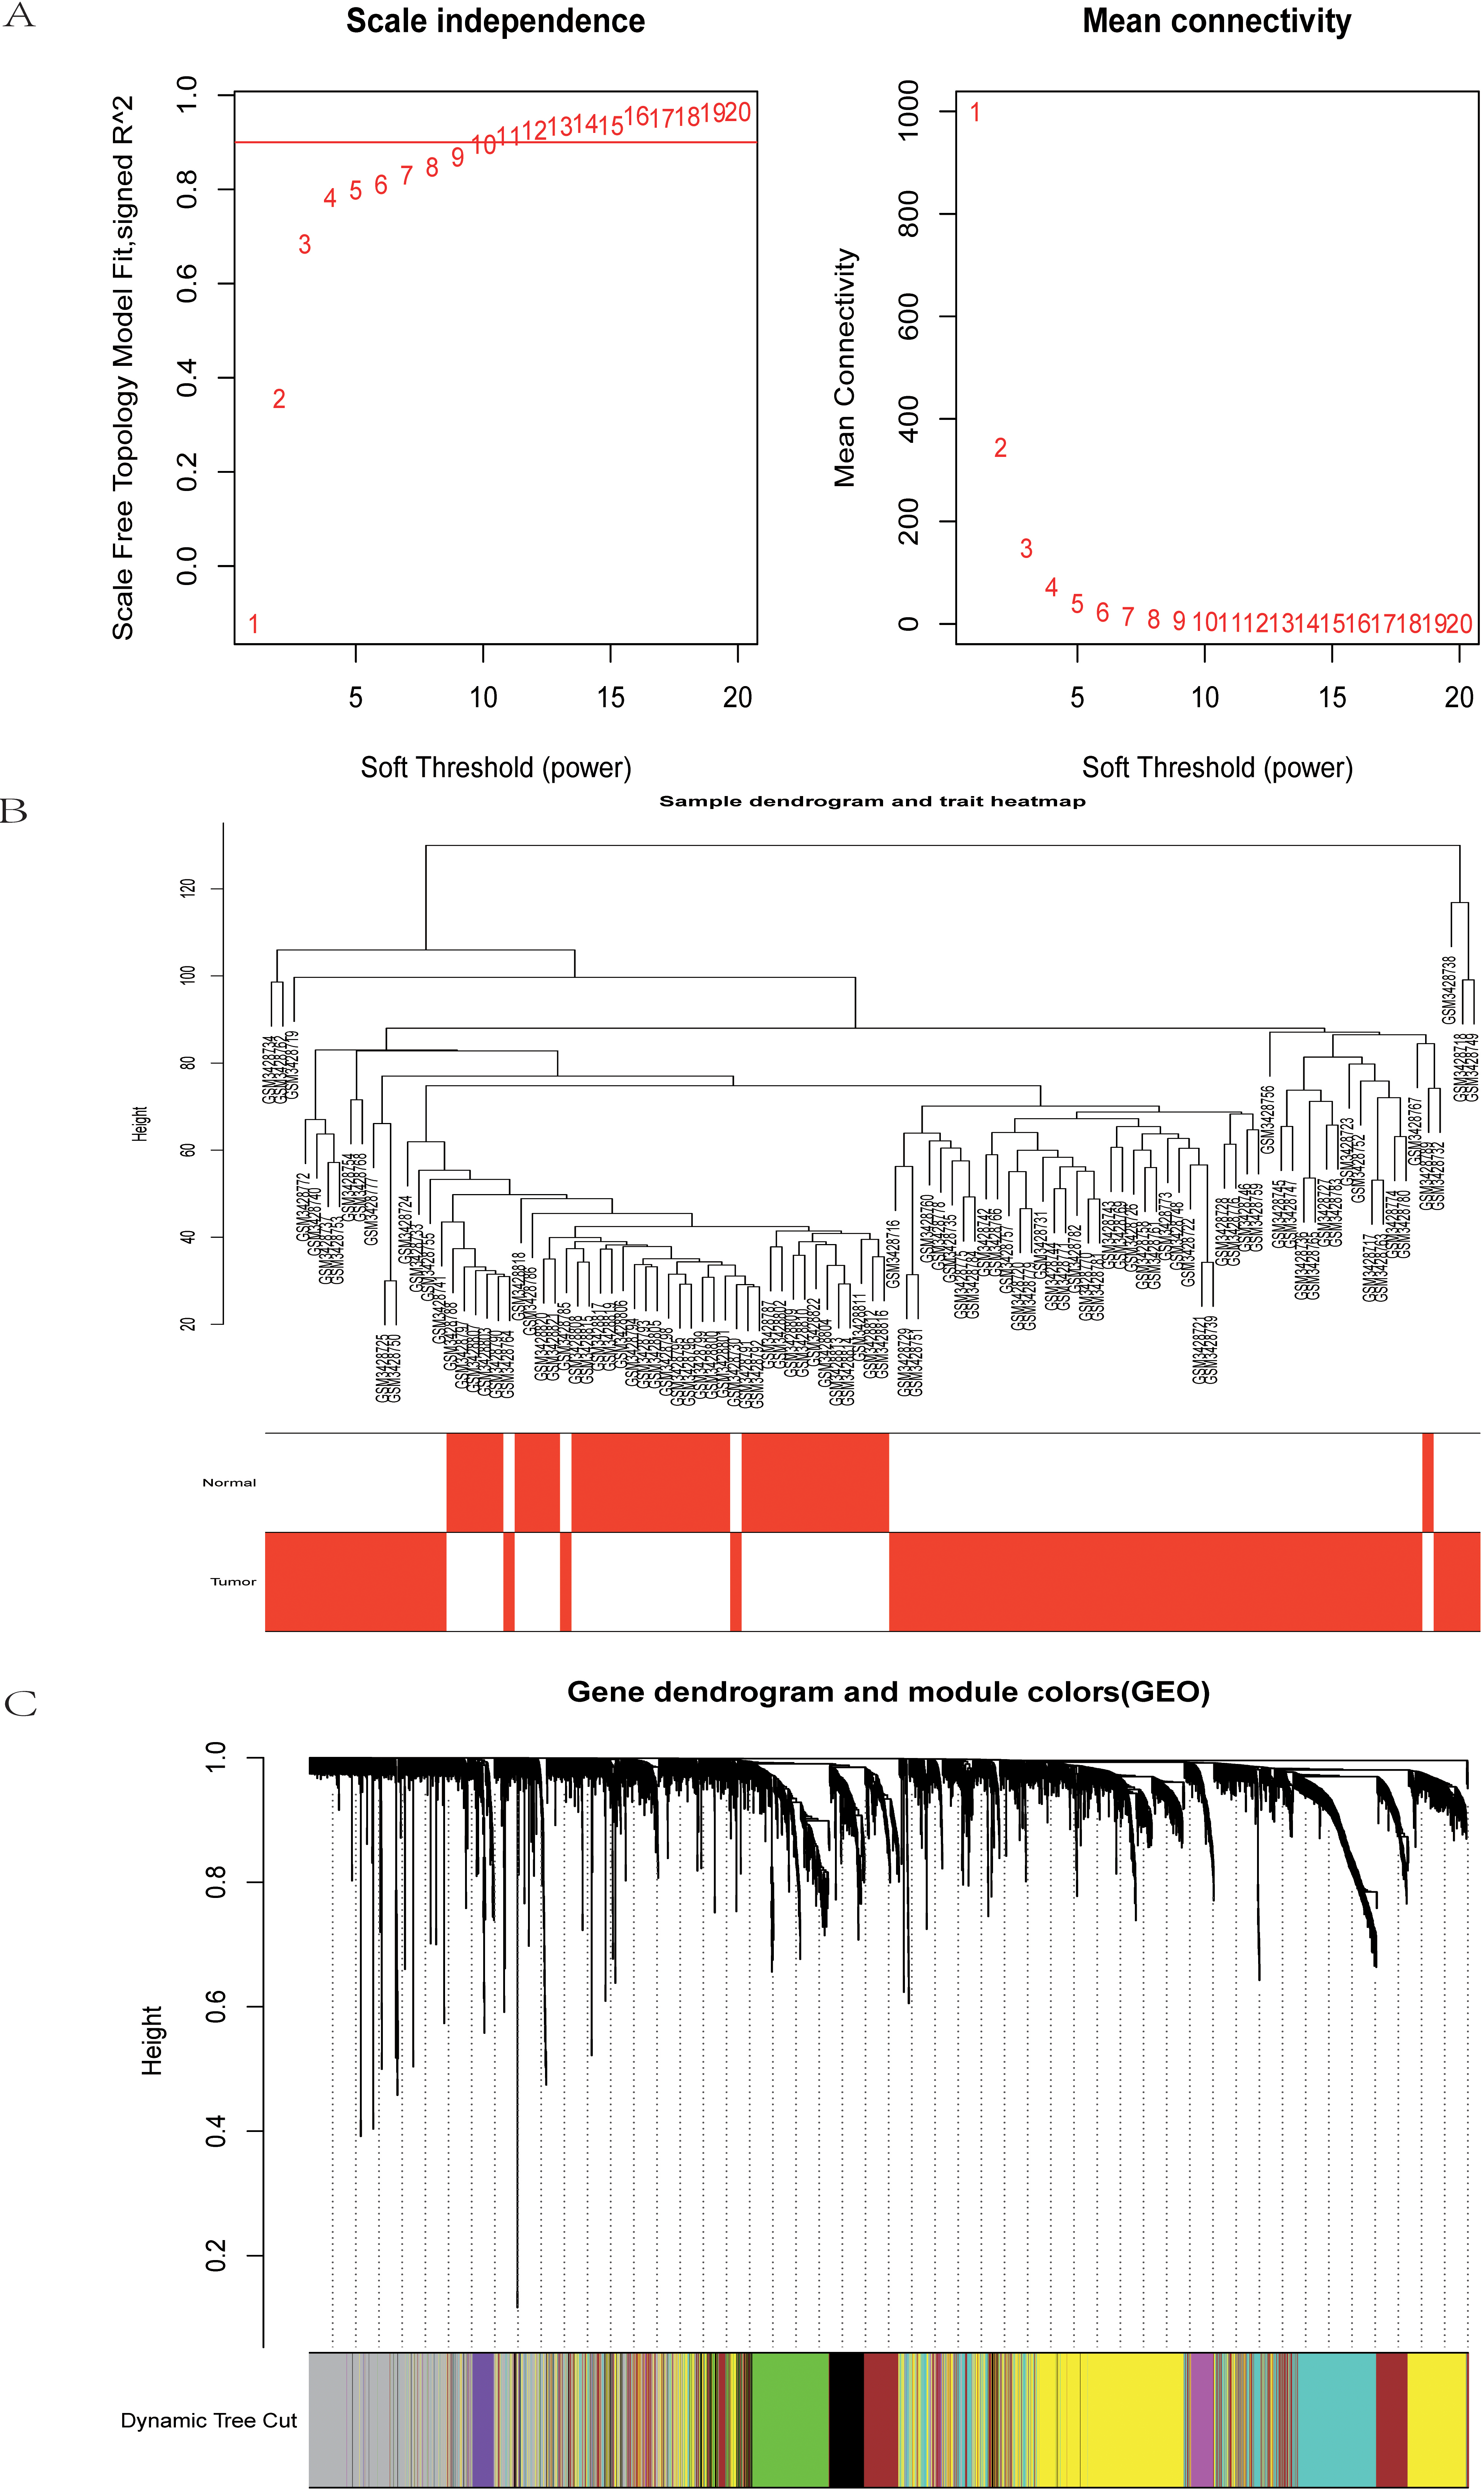
The heatmaps of correlation between clinical traits and the modular genes. (A) The heatmap of traits and modular genes constructed from TCGA-LIHC. (B) The heatmap of traits and modular genes constructed from GSE121248.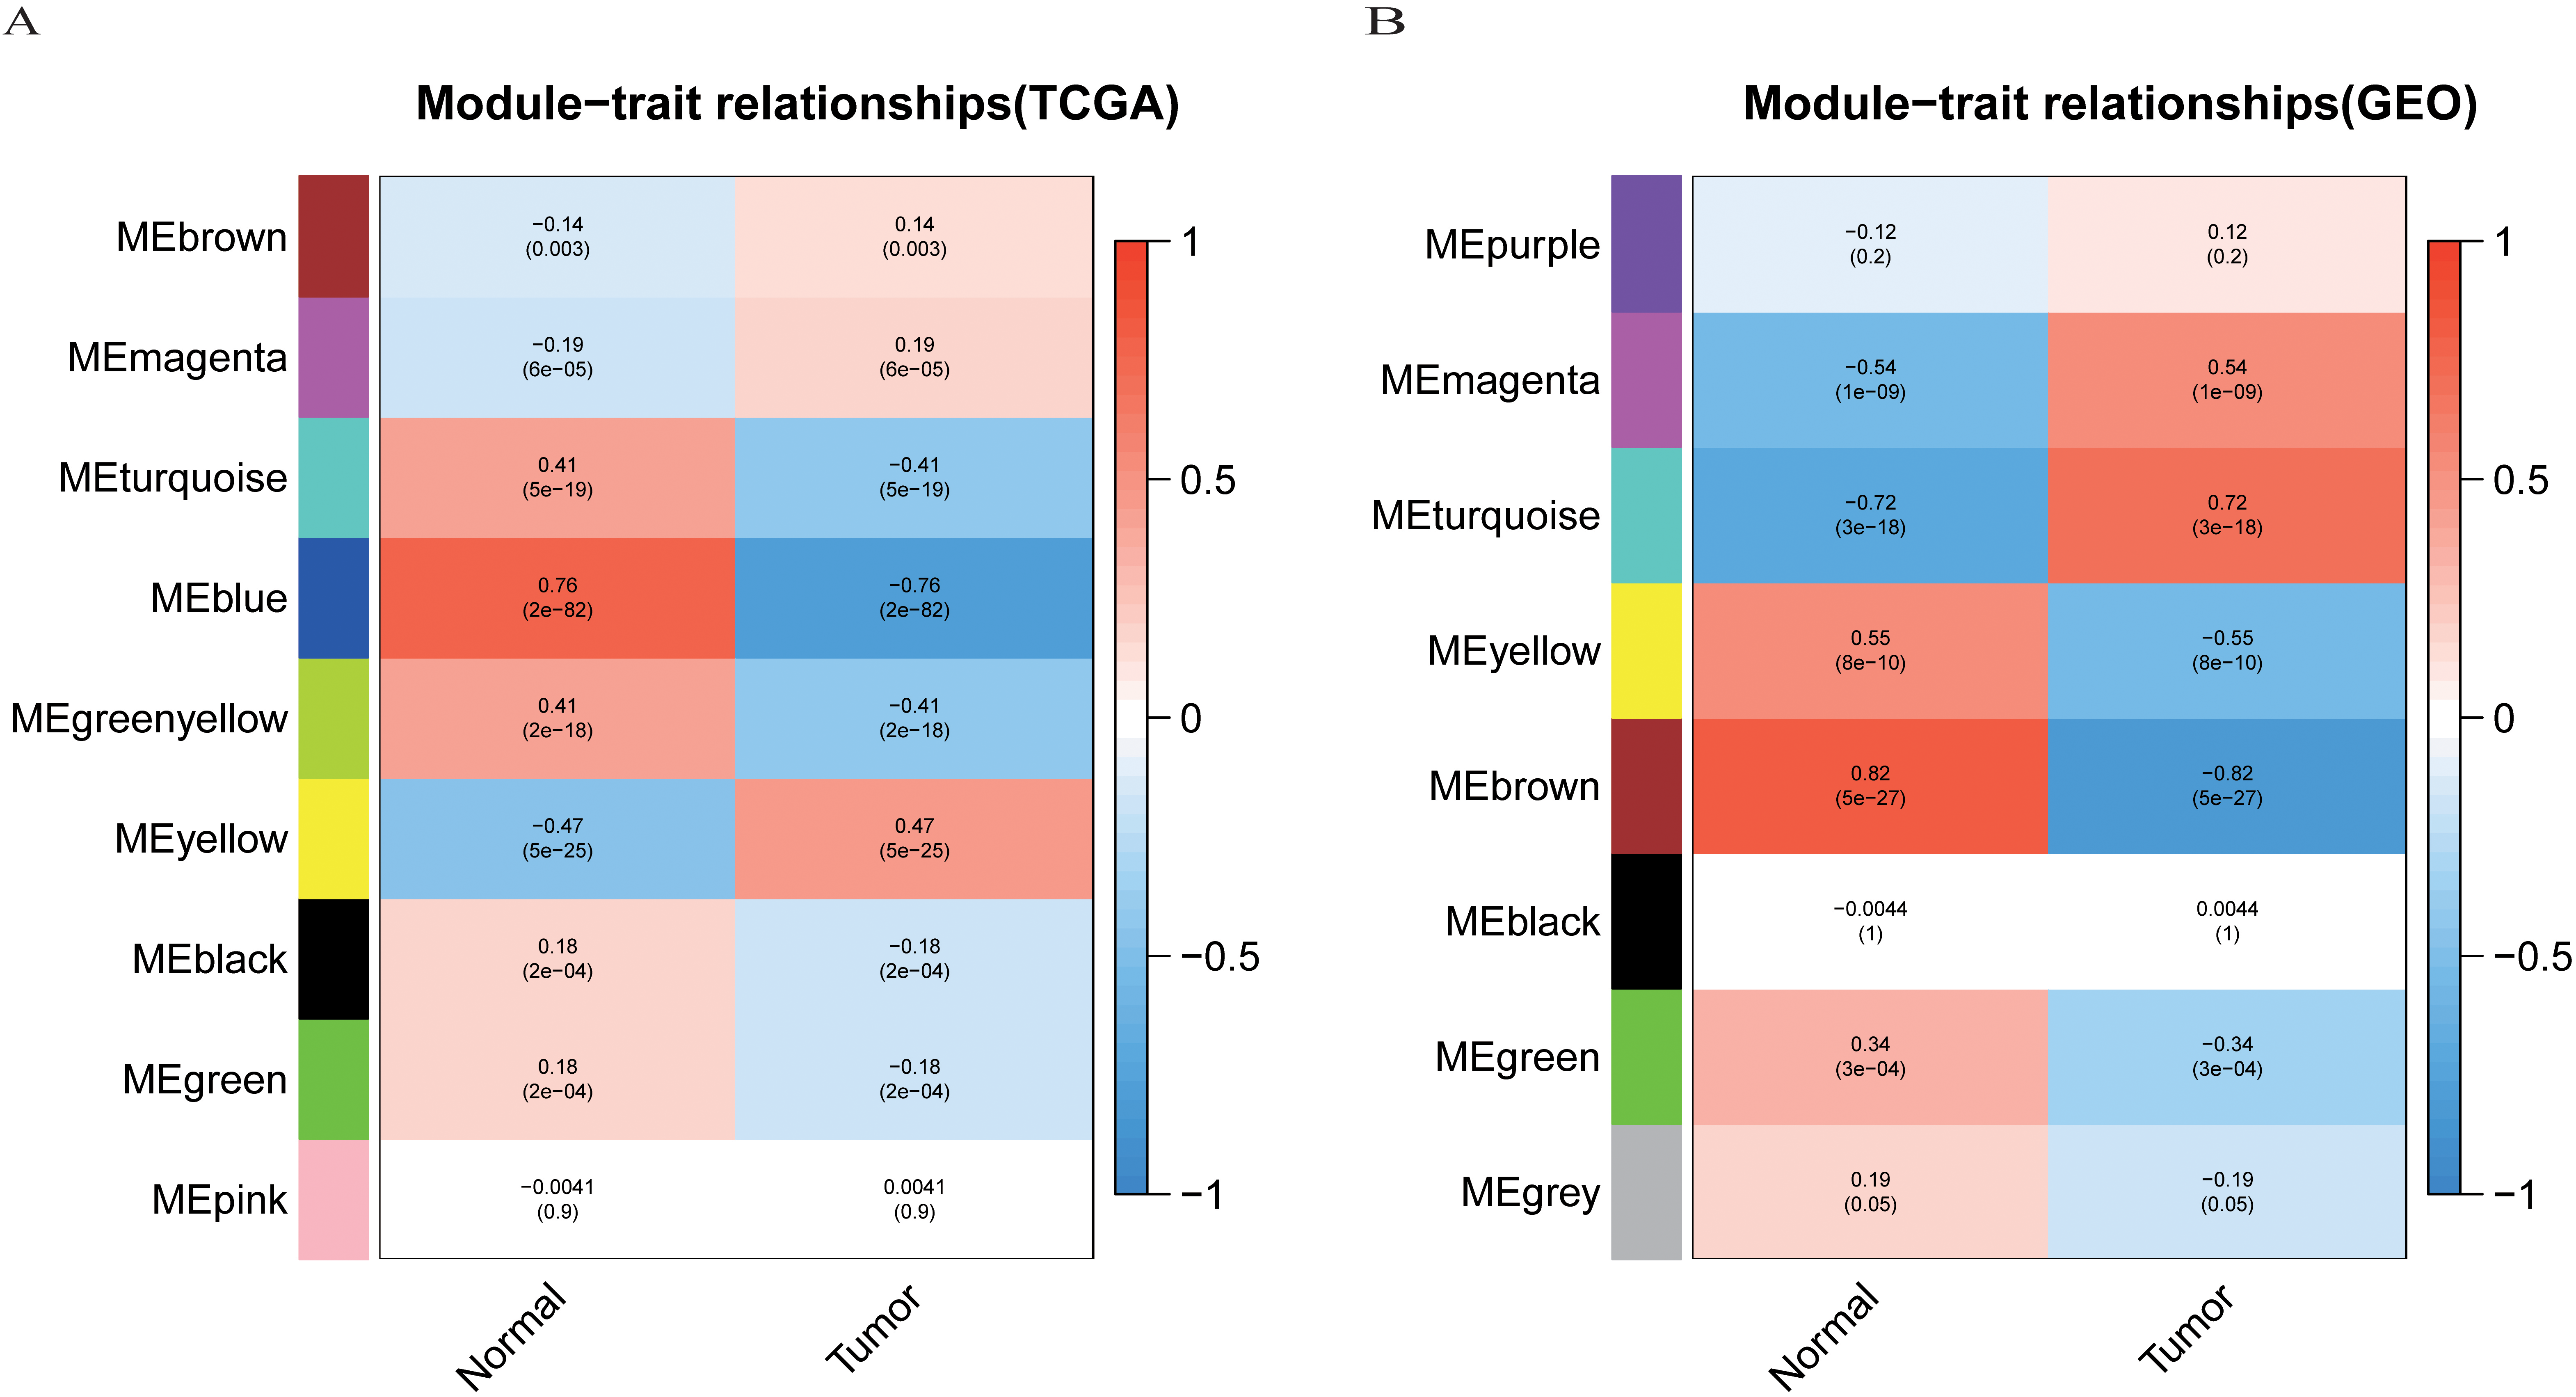
MM and GS correlation analysis scatterplots. (A) Scatterplot of MM and GS correlation analysis of yellow module gene in TCGA-LIHC. (B) Scatterplot of MM and GS correlation analysis of turquoise module gene in GSE121248.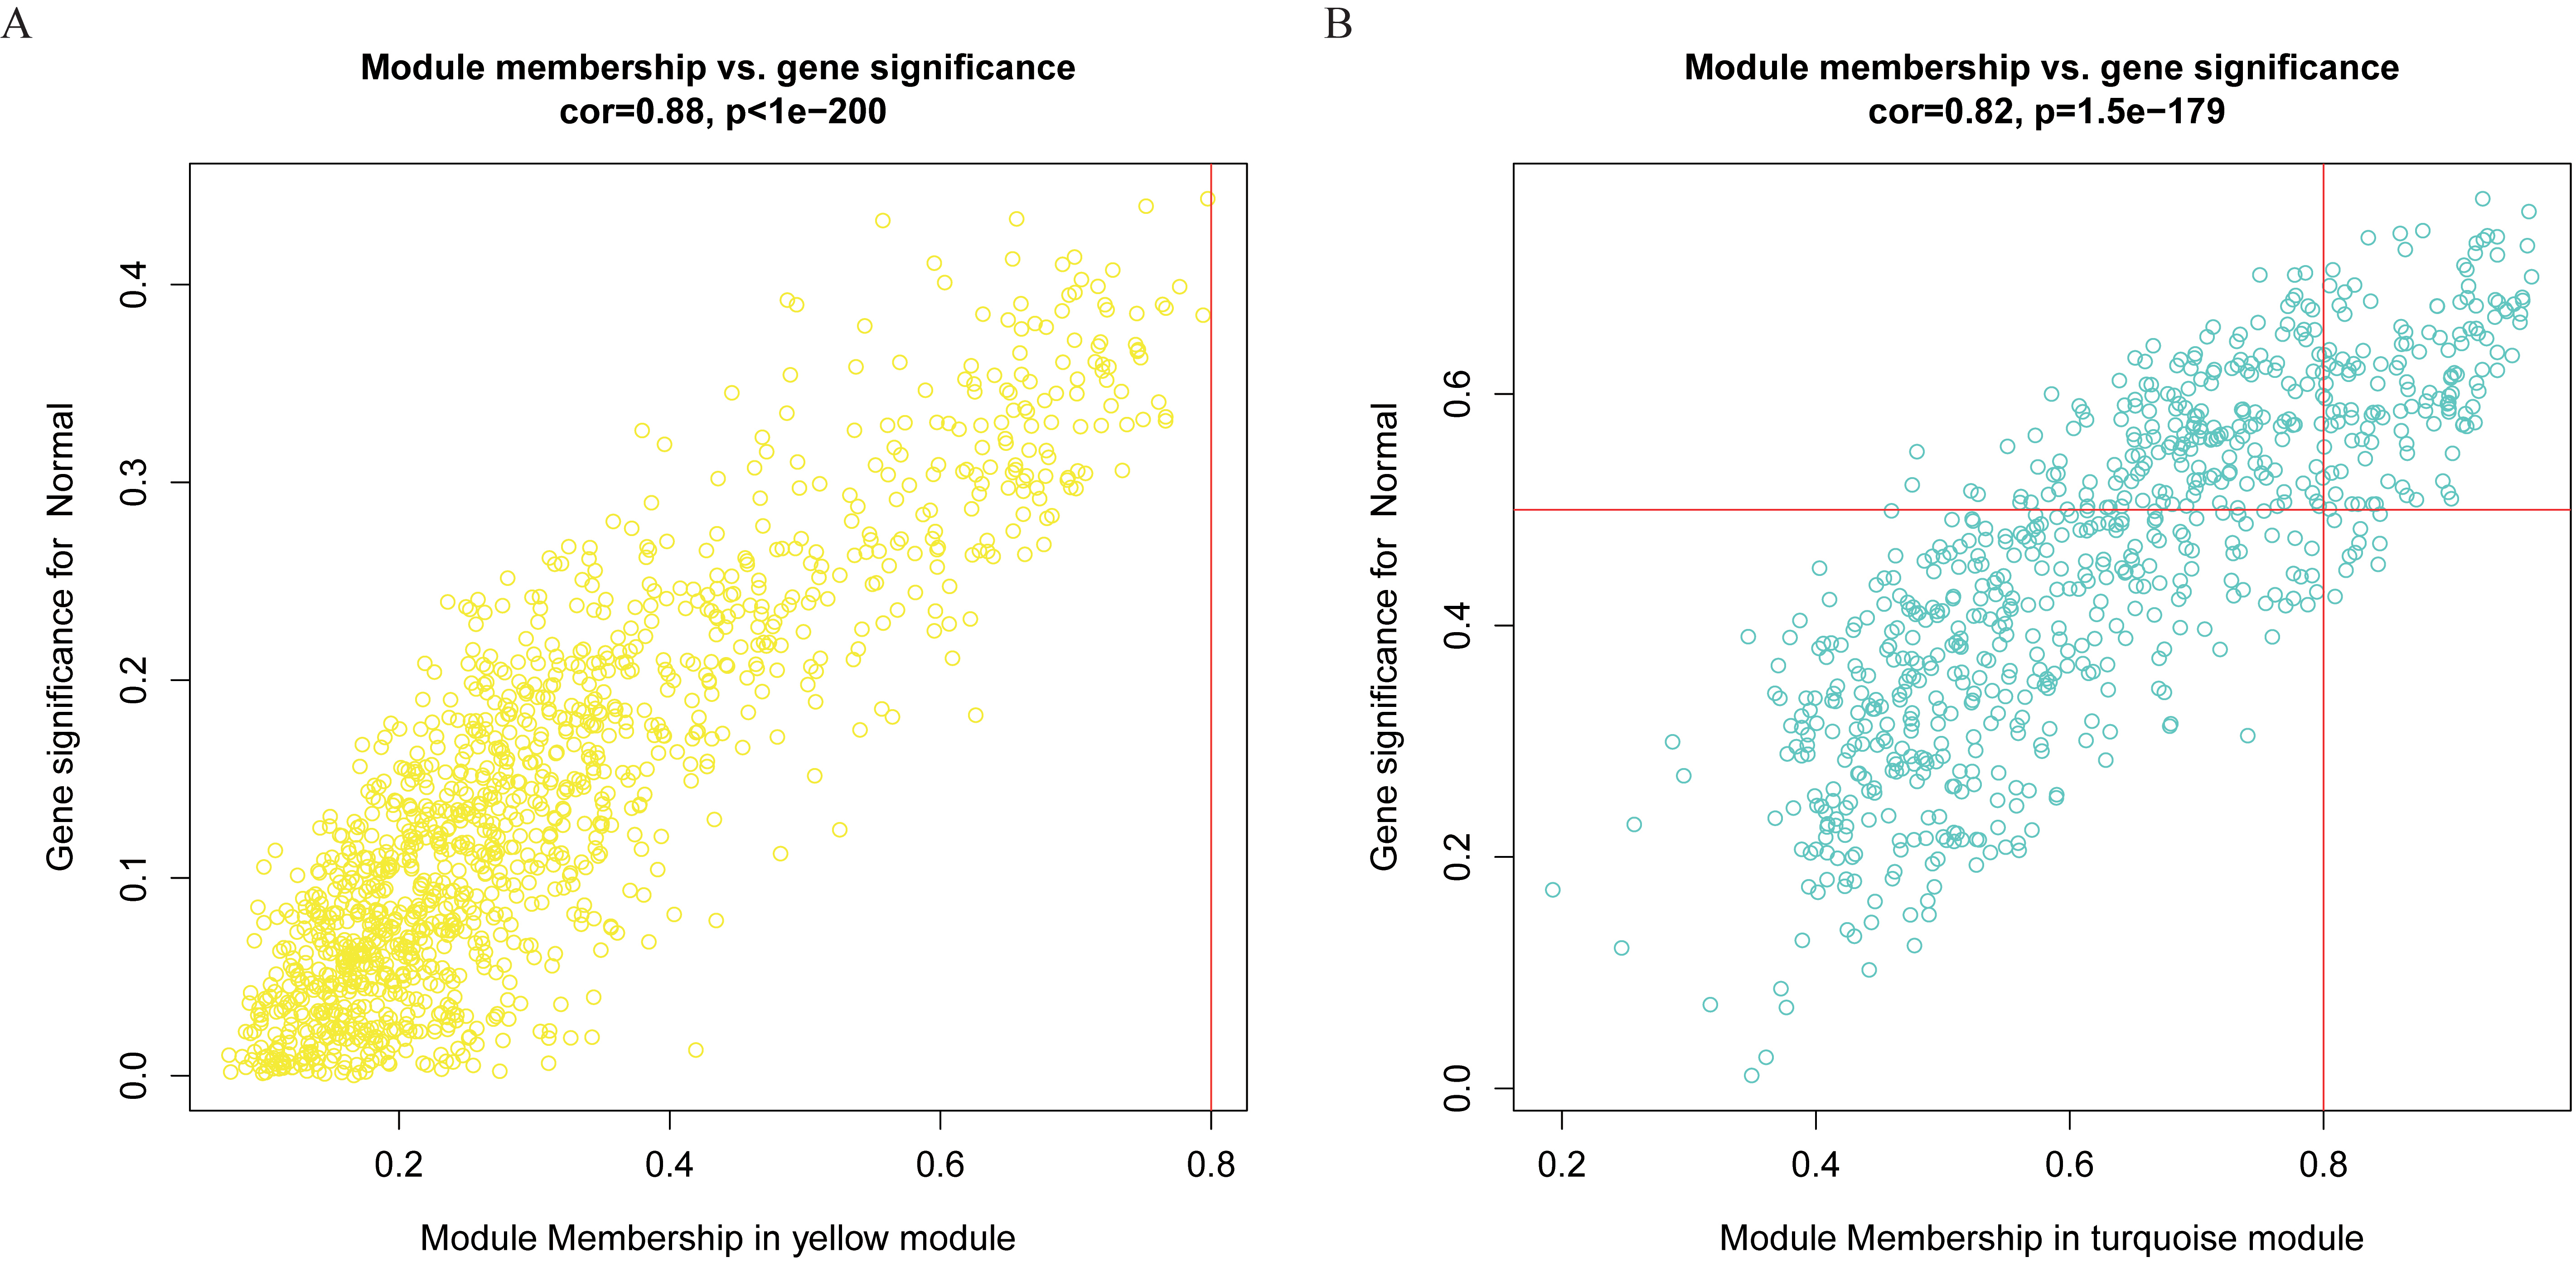
The Venn diagram of DEGs and co-expression genes. As a result, 73 overlapping genes were obtained from the intersection of DEGs and co-expression.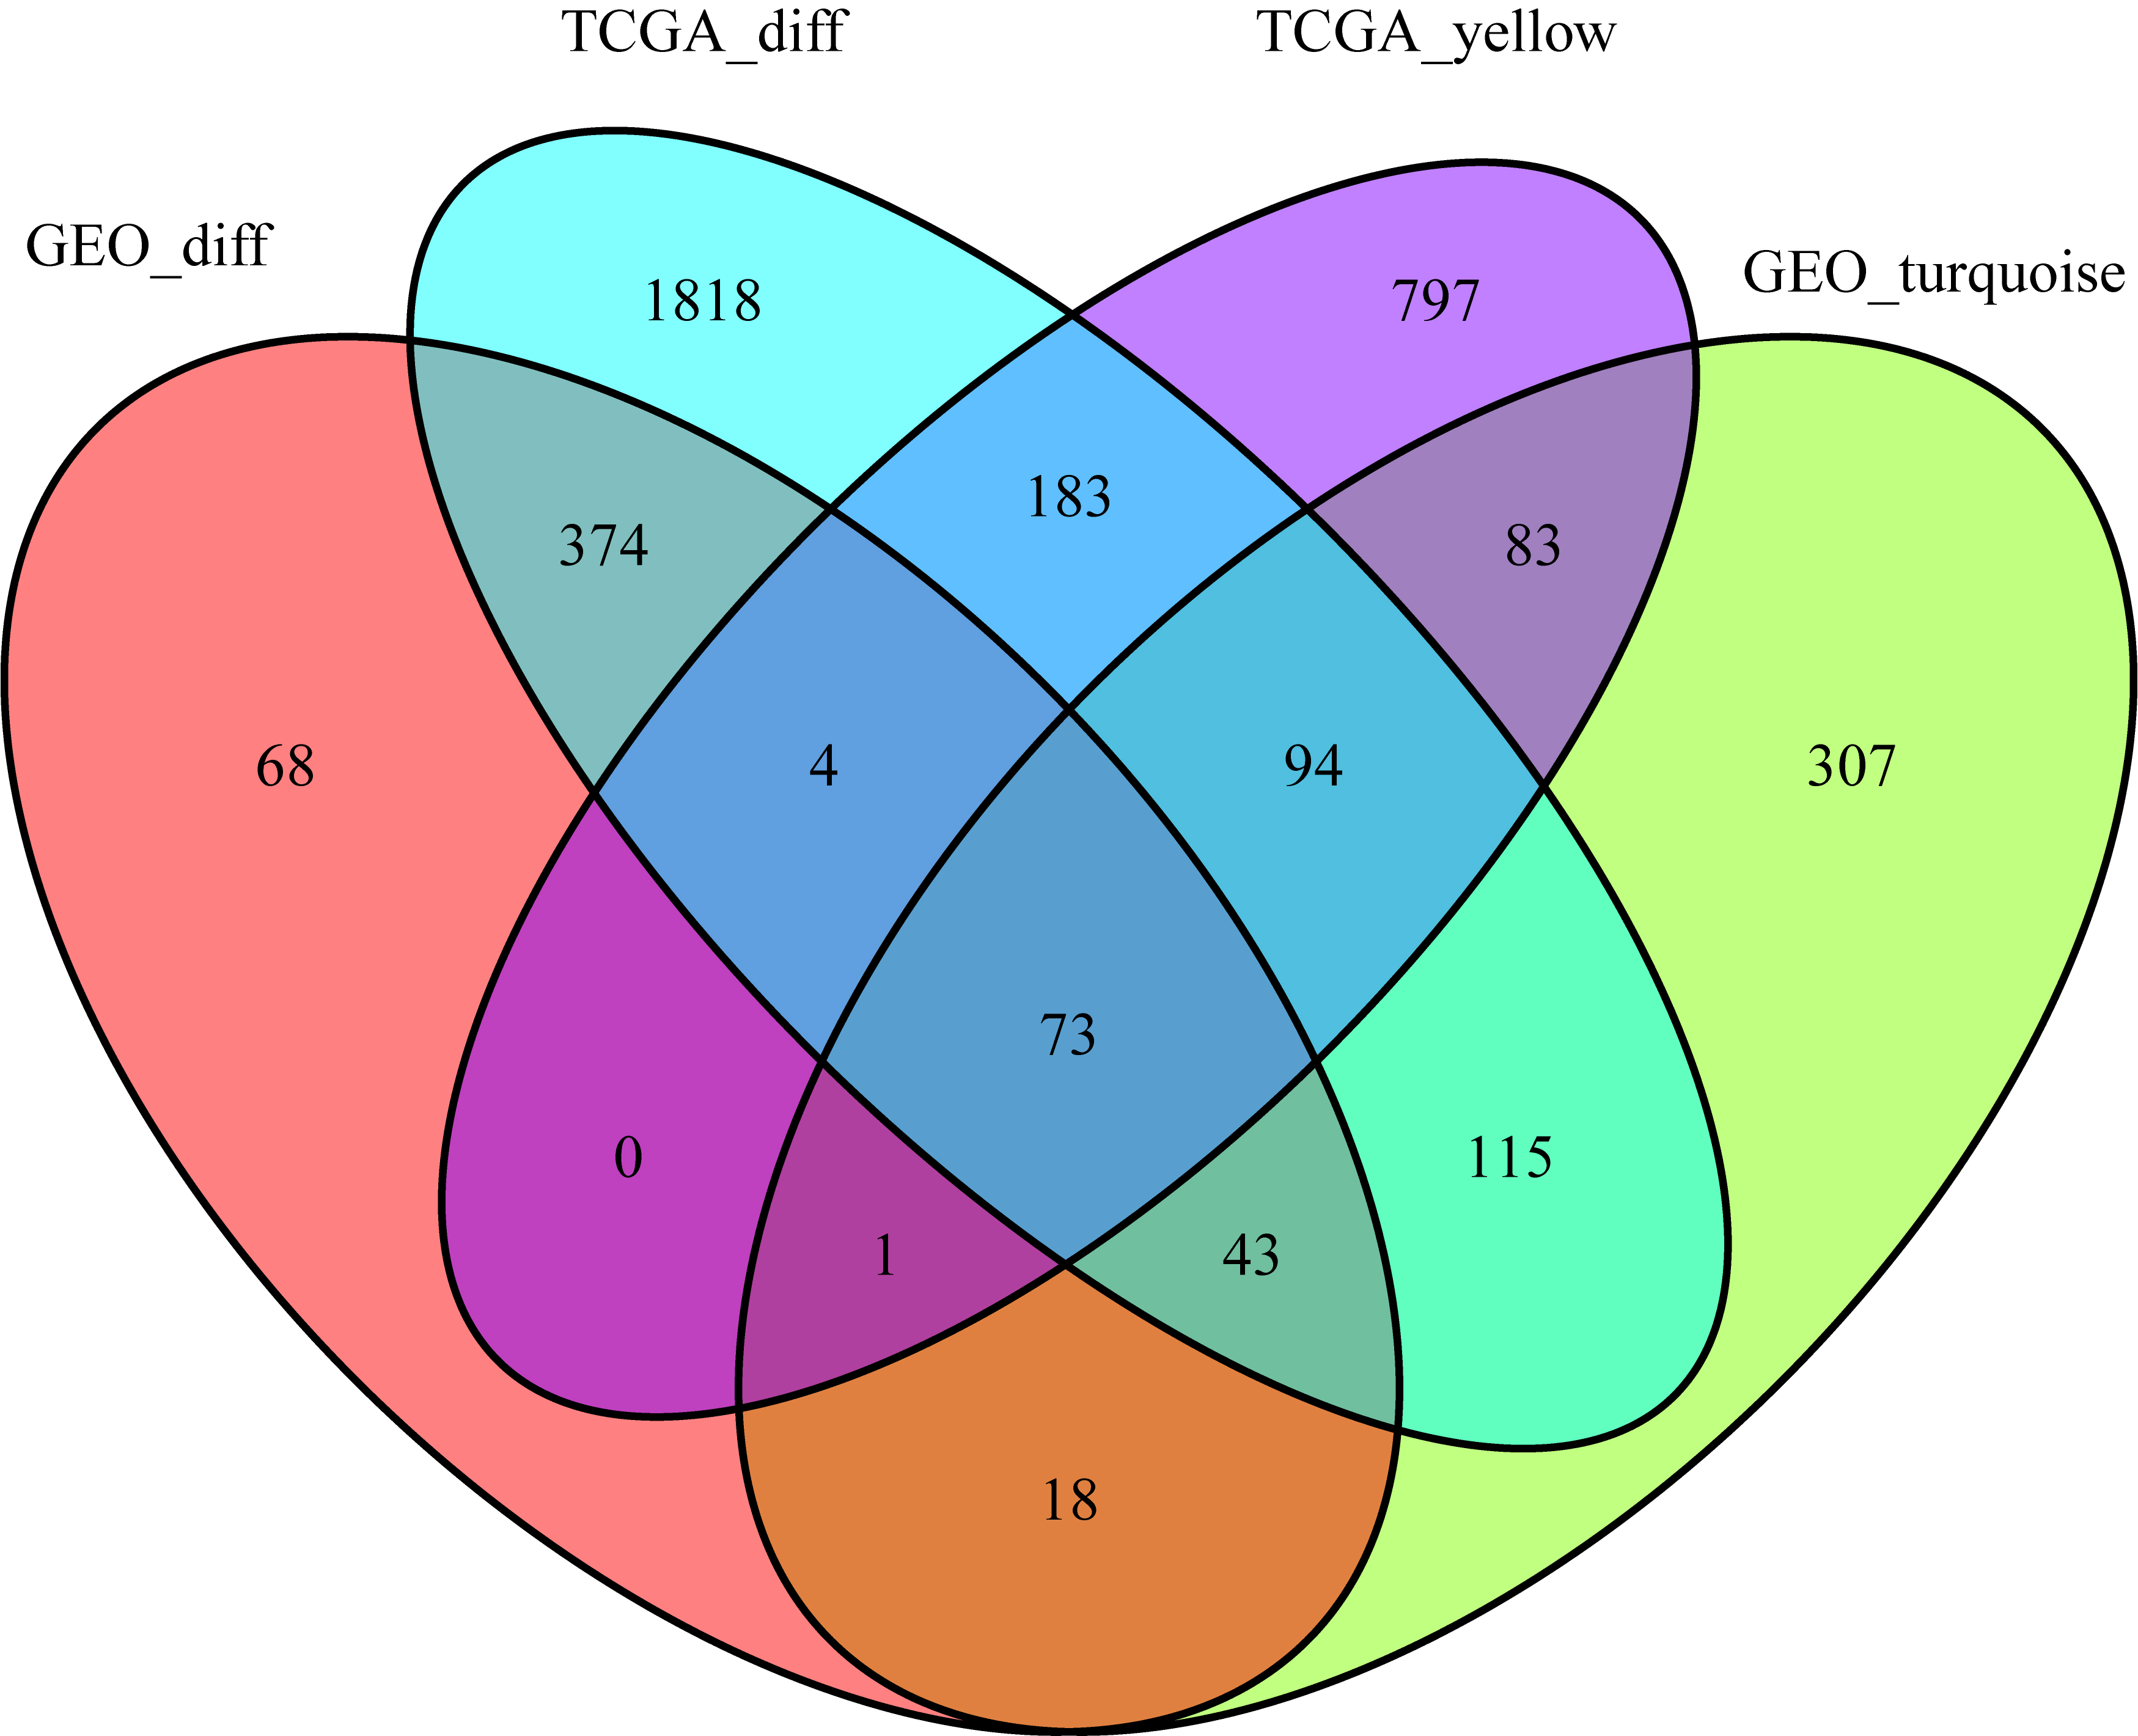
Functional enrichment analysis of the 73 overlapping genes. (A) GO enrichment analysis. (B) KEGG pathway enrichment analysis. The size of the bubble represents the number of enriched genes and the color of the bubble represents the 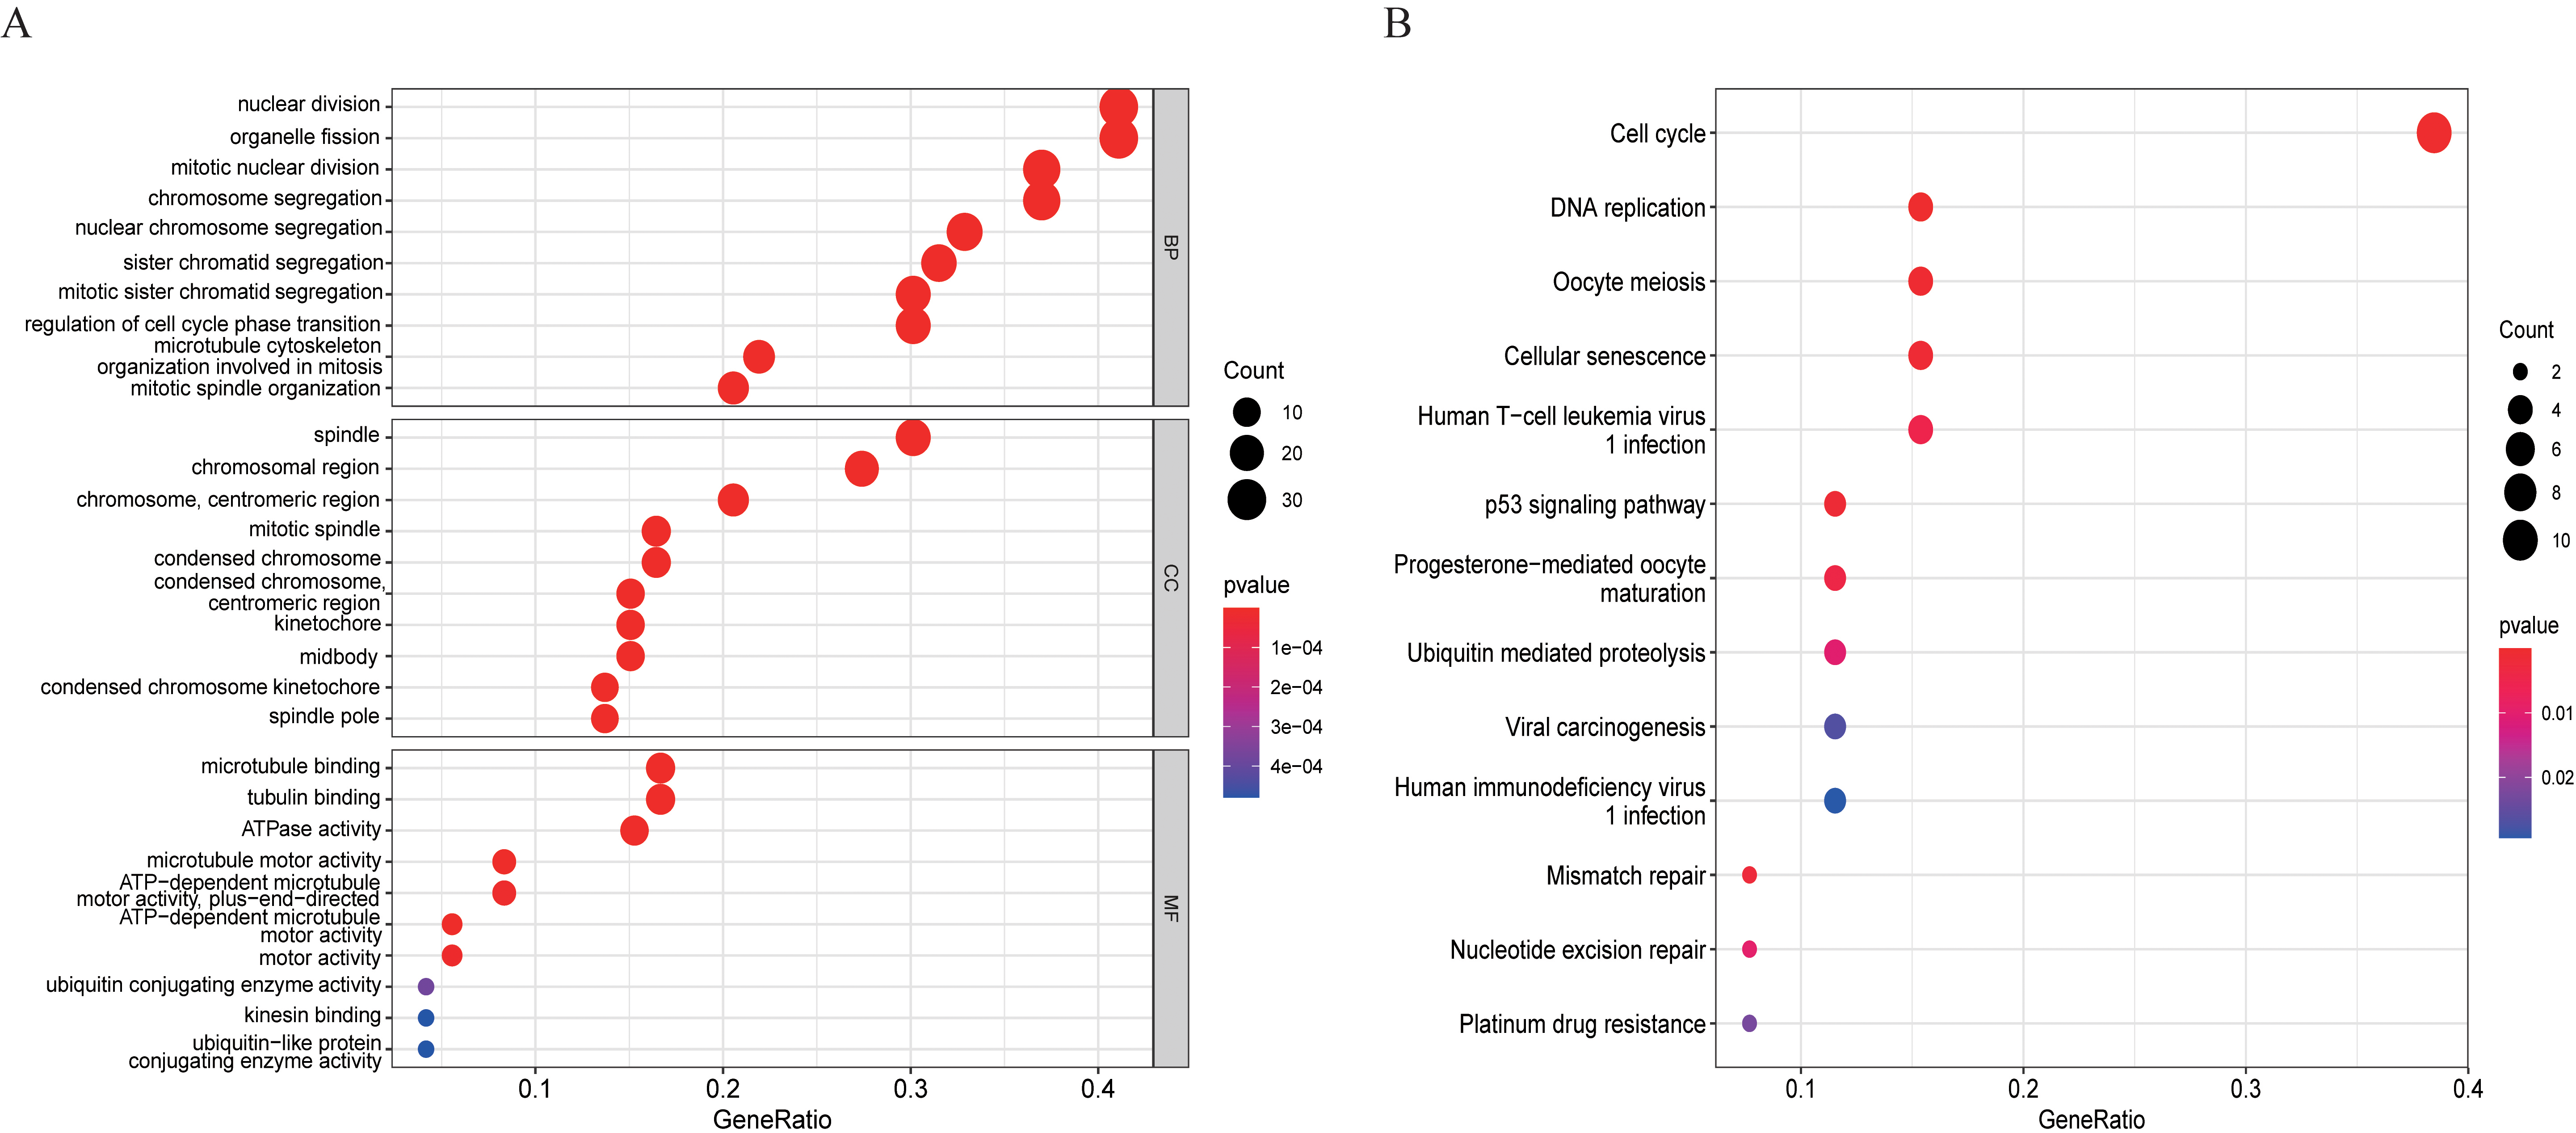
Construction of PPI network and screening of hub genes based on CytoHubba. (A) Construct overlapping genes PPI network based on STRING. (B) PPI network of overlapping genes was constructed based on Cytoscape. (C) The top 10 genes with the highest MCC score were screened from PPI.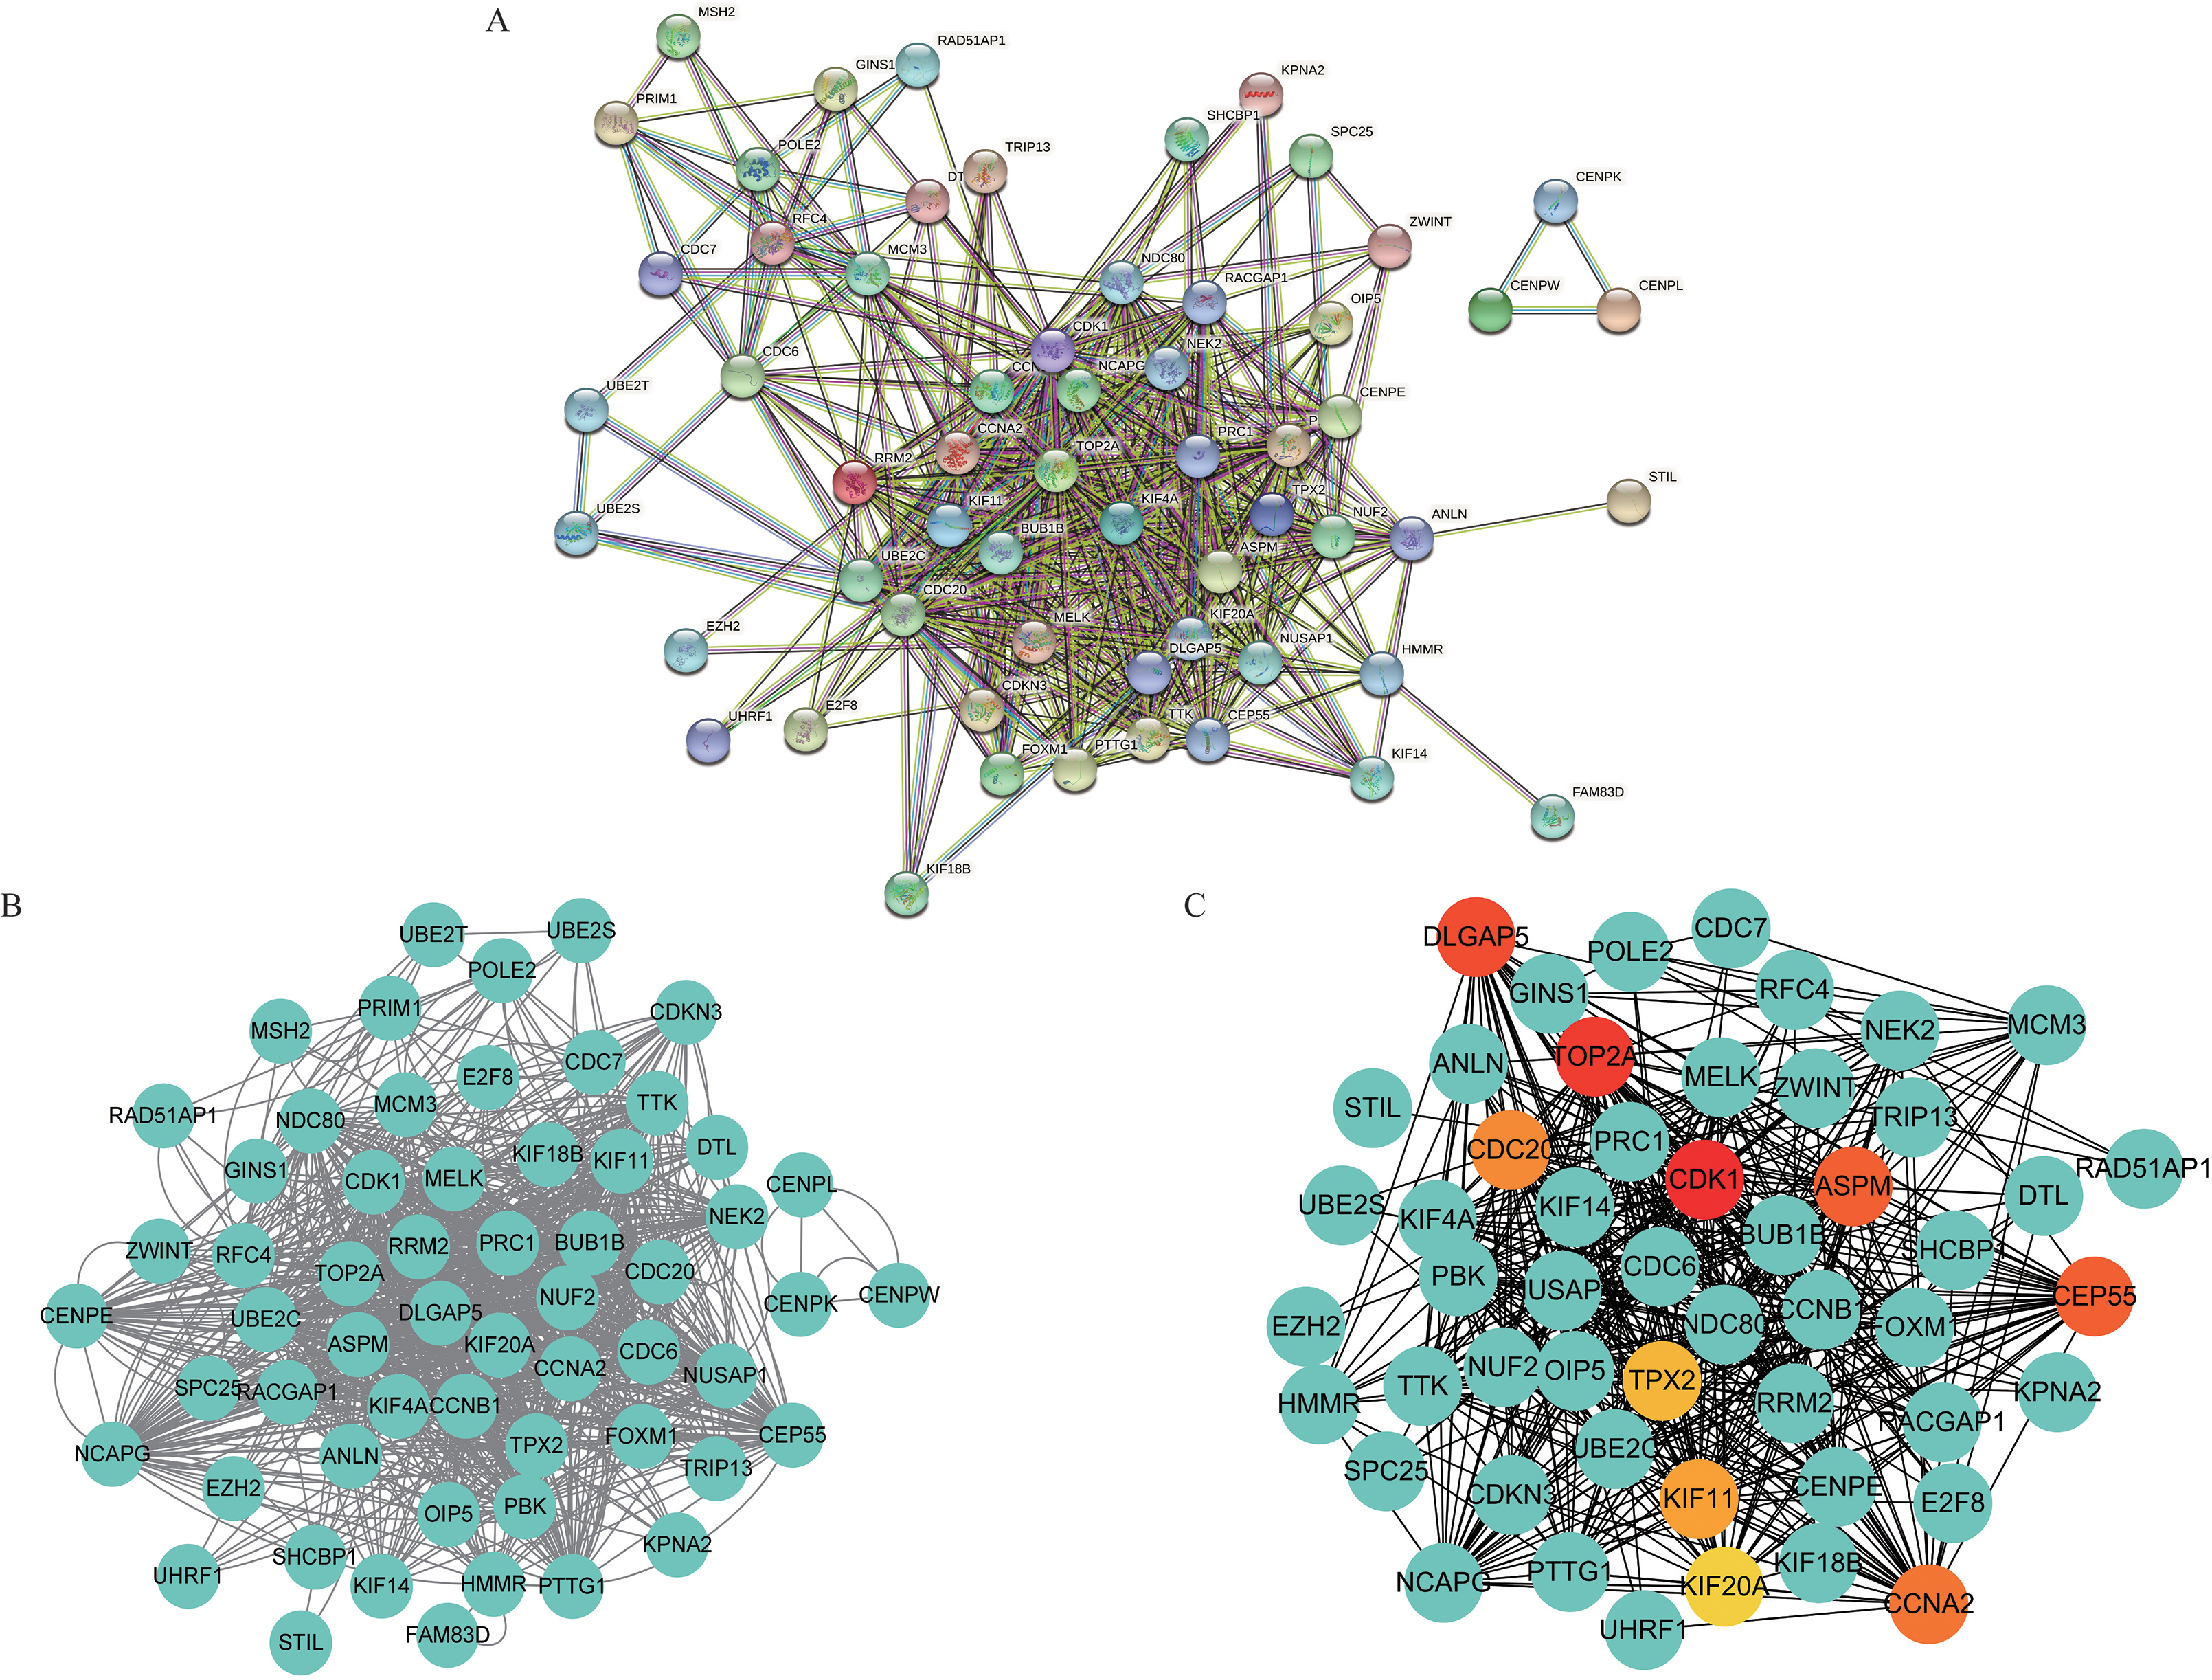
Identification of differentially expressed genes
Data information of HCC patients from different platforms was analyzed using the Limma software package and set to
Weighted gene co-expression network construction
The data sets of TCGA-LIHC and GSE121248 were used to construct the sample clustering tree of HCC and normal samples through WGCNA data packets, and the soft power threshold
Identification of DEGs overlapping genes in TCGA-LIHC and GSE121248 dataset
Subsequently, hierarchical cluster analysis was further evaluated to construct the correlation heat maps between different modules and clinical features. The results showed that the yellow color in TCGA-LIHC and the turquoise color in GSE121248 had the highest correlation with tumor tissues (Fig. 6A and B) (yellow module:
GO and KEGG functional enrichment analysis of the 73 overlapping genes
The “clusterProfiler” R language package was used to enrich the functions of 73 overlapping genes, map their GO and KEGG pathway bubbles diagram (Fig. 9A and B), to predict the potential biological functions and related pathways of these 73 genes. GO enrichment analysis showed that these genes were significantly enriched in the nuclear division, organelle fission, spindle, chromosomal region, microtubule-binding, and tubulin binding (
Identification of hub genes from overlapping genes
To further select hub genes in the overlapping genes obtained by WGCNA analysis, 73 genes were imported into the STRING 11.5 database in this study to construct a PPI network (Fig. 10A). The results were then imported into the visualization software Cytoscape (Fig. 10B), and the MCC algorithm of the CytoHubba plug-in was used to screen out the top 10 nodes (Fig. 10C). These 10 genes are hub genes, namely CDK1, TOP2A, DLGAP5, CDC20, ASPM, CEP55, TPX2, KIF11, KIF20A, and CCNA2.
Correlation analysis of hub genes expression and survival
To verify the authenticity of the 10 screened hub genes, we standardized the target genes based on TCGA-LIHC data set through the TPM method, and finally drew the expression point map of hub genes in normal tissues and liver cancer tissues (Fig. 11). Overall survival (OS) of these 10 genes was analyzed and Kaplan-Meier curves were drawn by the “Survival” and “SurvMiner” R language package (Fig. 12). Disease-free survival (DFS) curves of 10 genes were plotted using the online website GEPIA2 (Fig. 13), and their log-rank
Validation of the real hub genes based on HPA
By analyzing the difference in expression of hub genes in normal and hepatocellular carcinoma tissues, combined with the OS curve and DFS curve of hub genes. We found that the expression levels of CDK1, DLGAP5, CDC20, ASPM, CEP55, TPX2, KIF11, KIF20A, and CCNA2 were significantly correlated with OS and DFS in HCC patients (
The KEGG pathway of the hub genes
The KEGG pathway of the hub genes
The expression level of hub genes in HCC and normal tissues was verified based on TCGA-LICH. (A) ASPM, (B) CCNA2, (C) CDC20, (D) CDK1, (E) CEP55, (F) DLGAP5, (G) KIF11, (H) KIF20A, (I) TOP2A, (J) TPX2.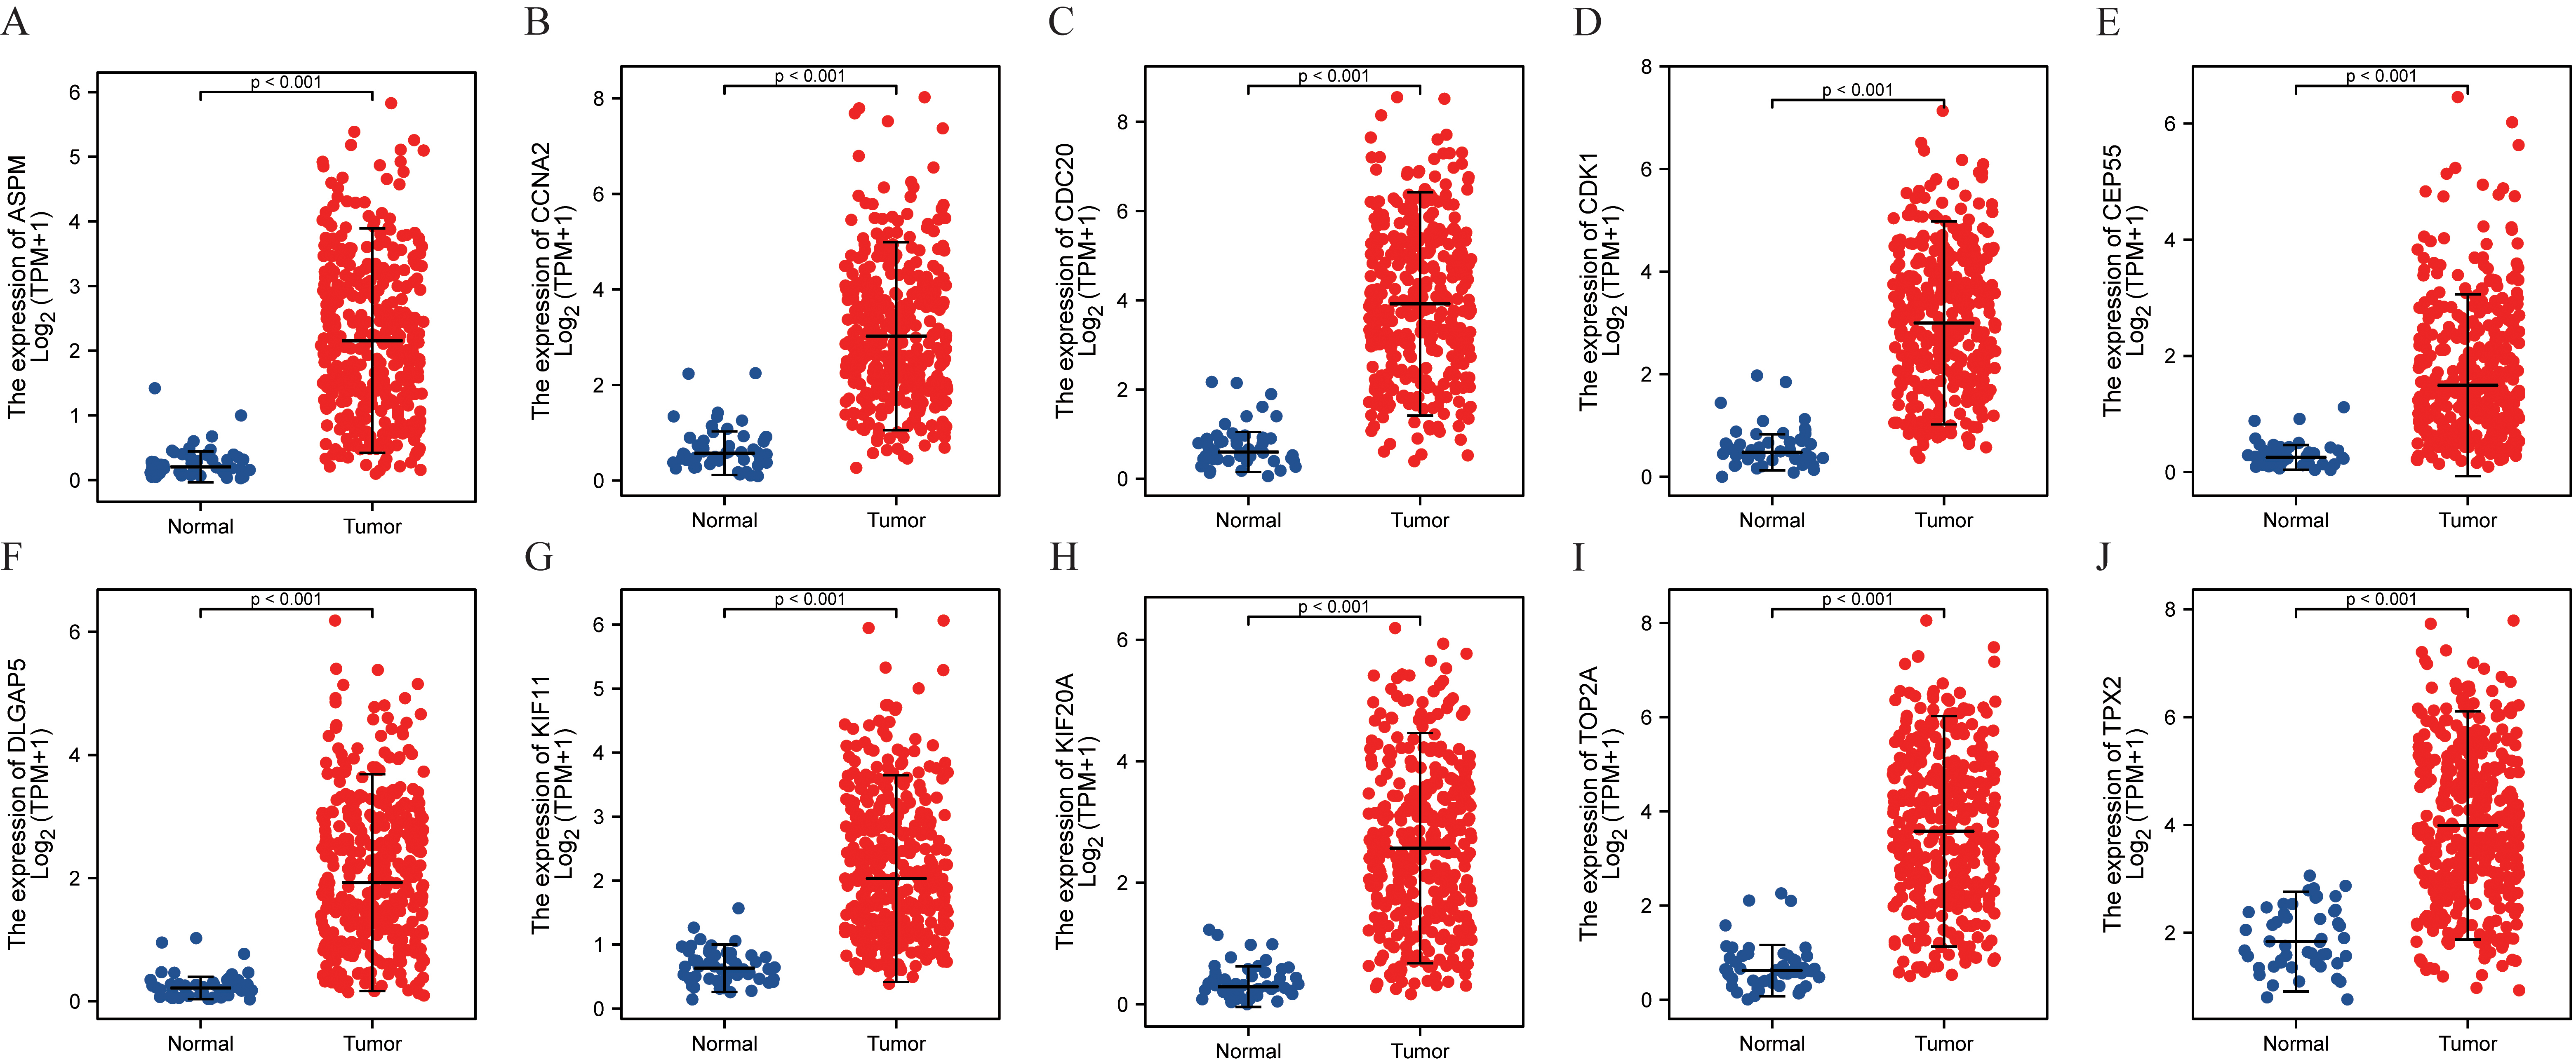
Validation of overall survival (OS) curve of hub genes. (A) ASPM, (B) CCNA2, (C) CDC20, (D) CDK1, (E) CEP55, (F) DLGAP5, (G) KIF11, (H) KIF20A, (I) TOP2A, (J) TPX2.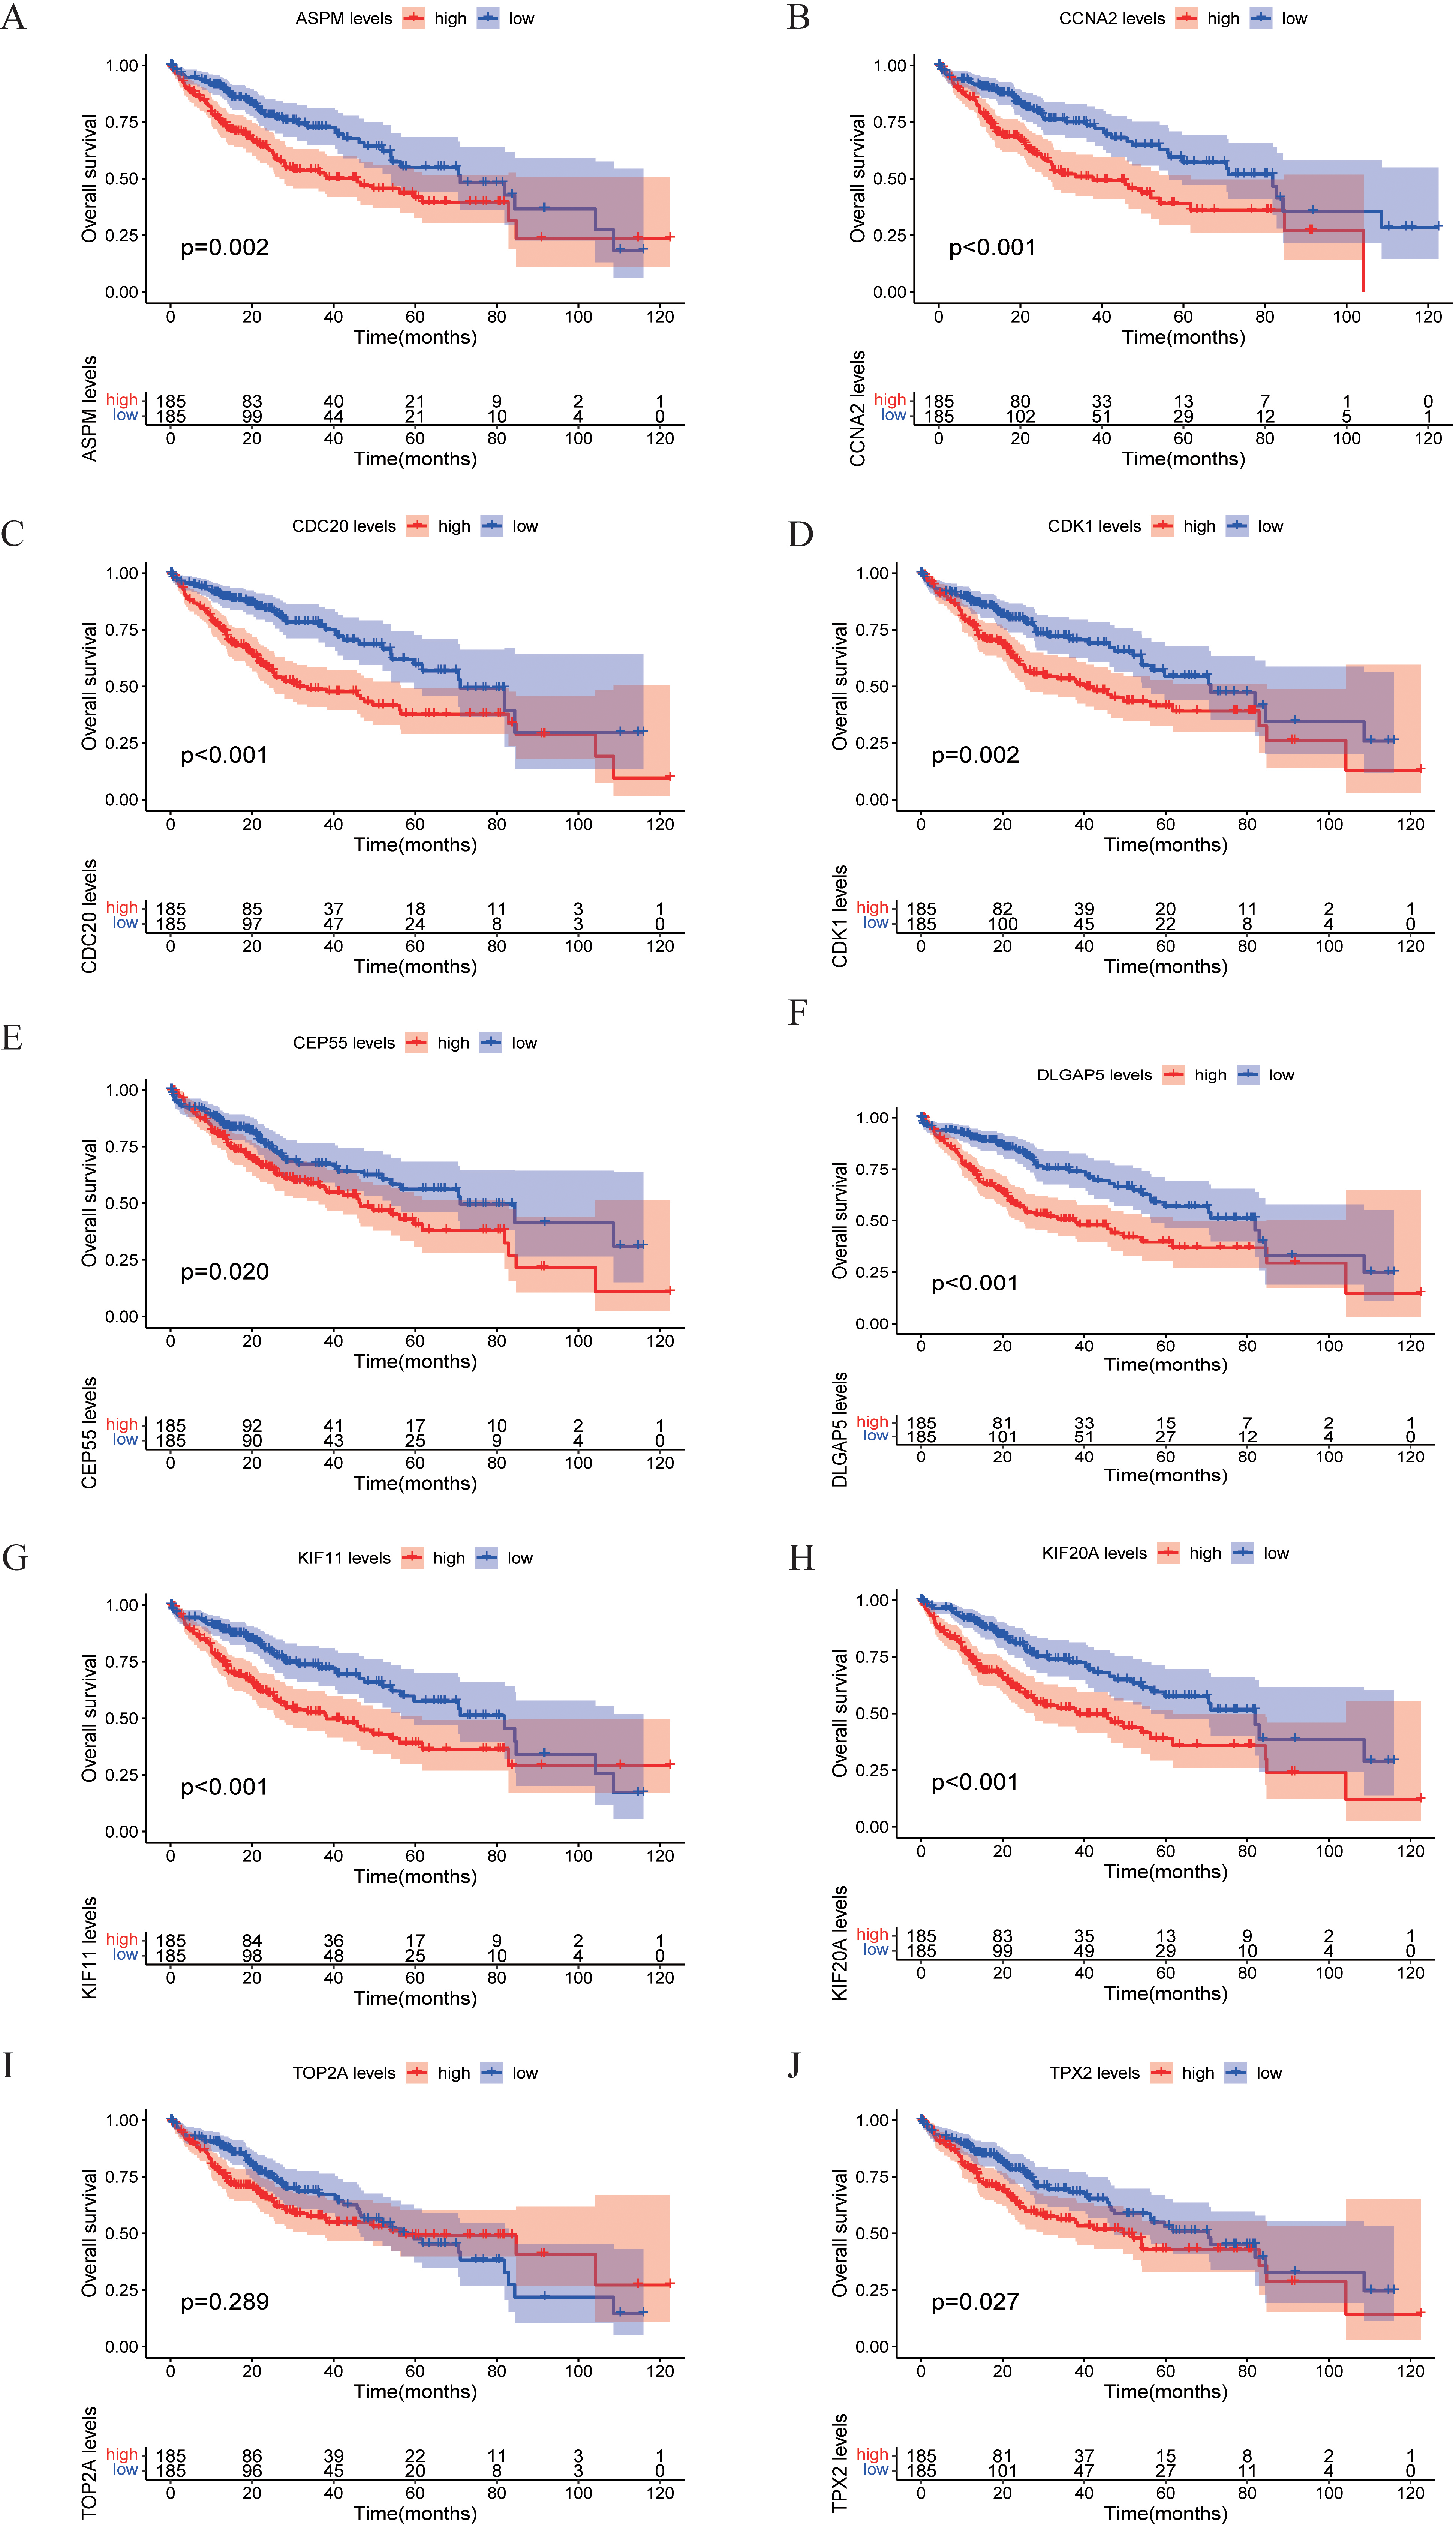
Disease-free survival analysis of hub genes. (A) ASPM, (B) CCNA2, (C) CDC20, (D) CDK1, (E) CEP55, (F) DLGAP5, (G) KIF11, (H) KIF20A, (I) TOP2A, (J) TPX2.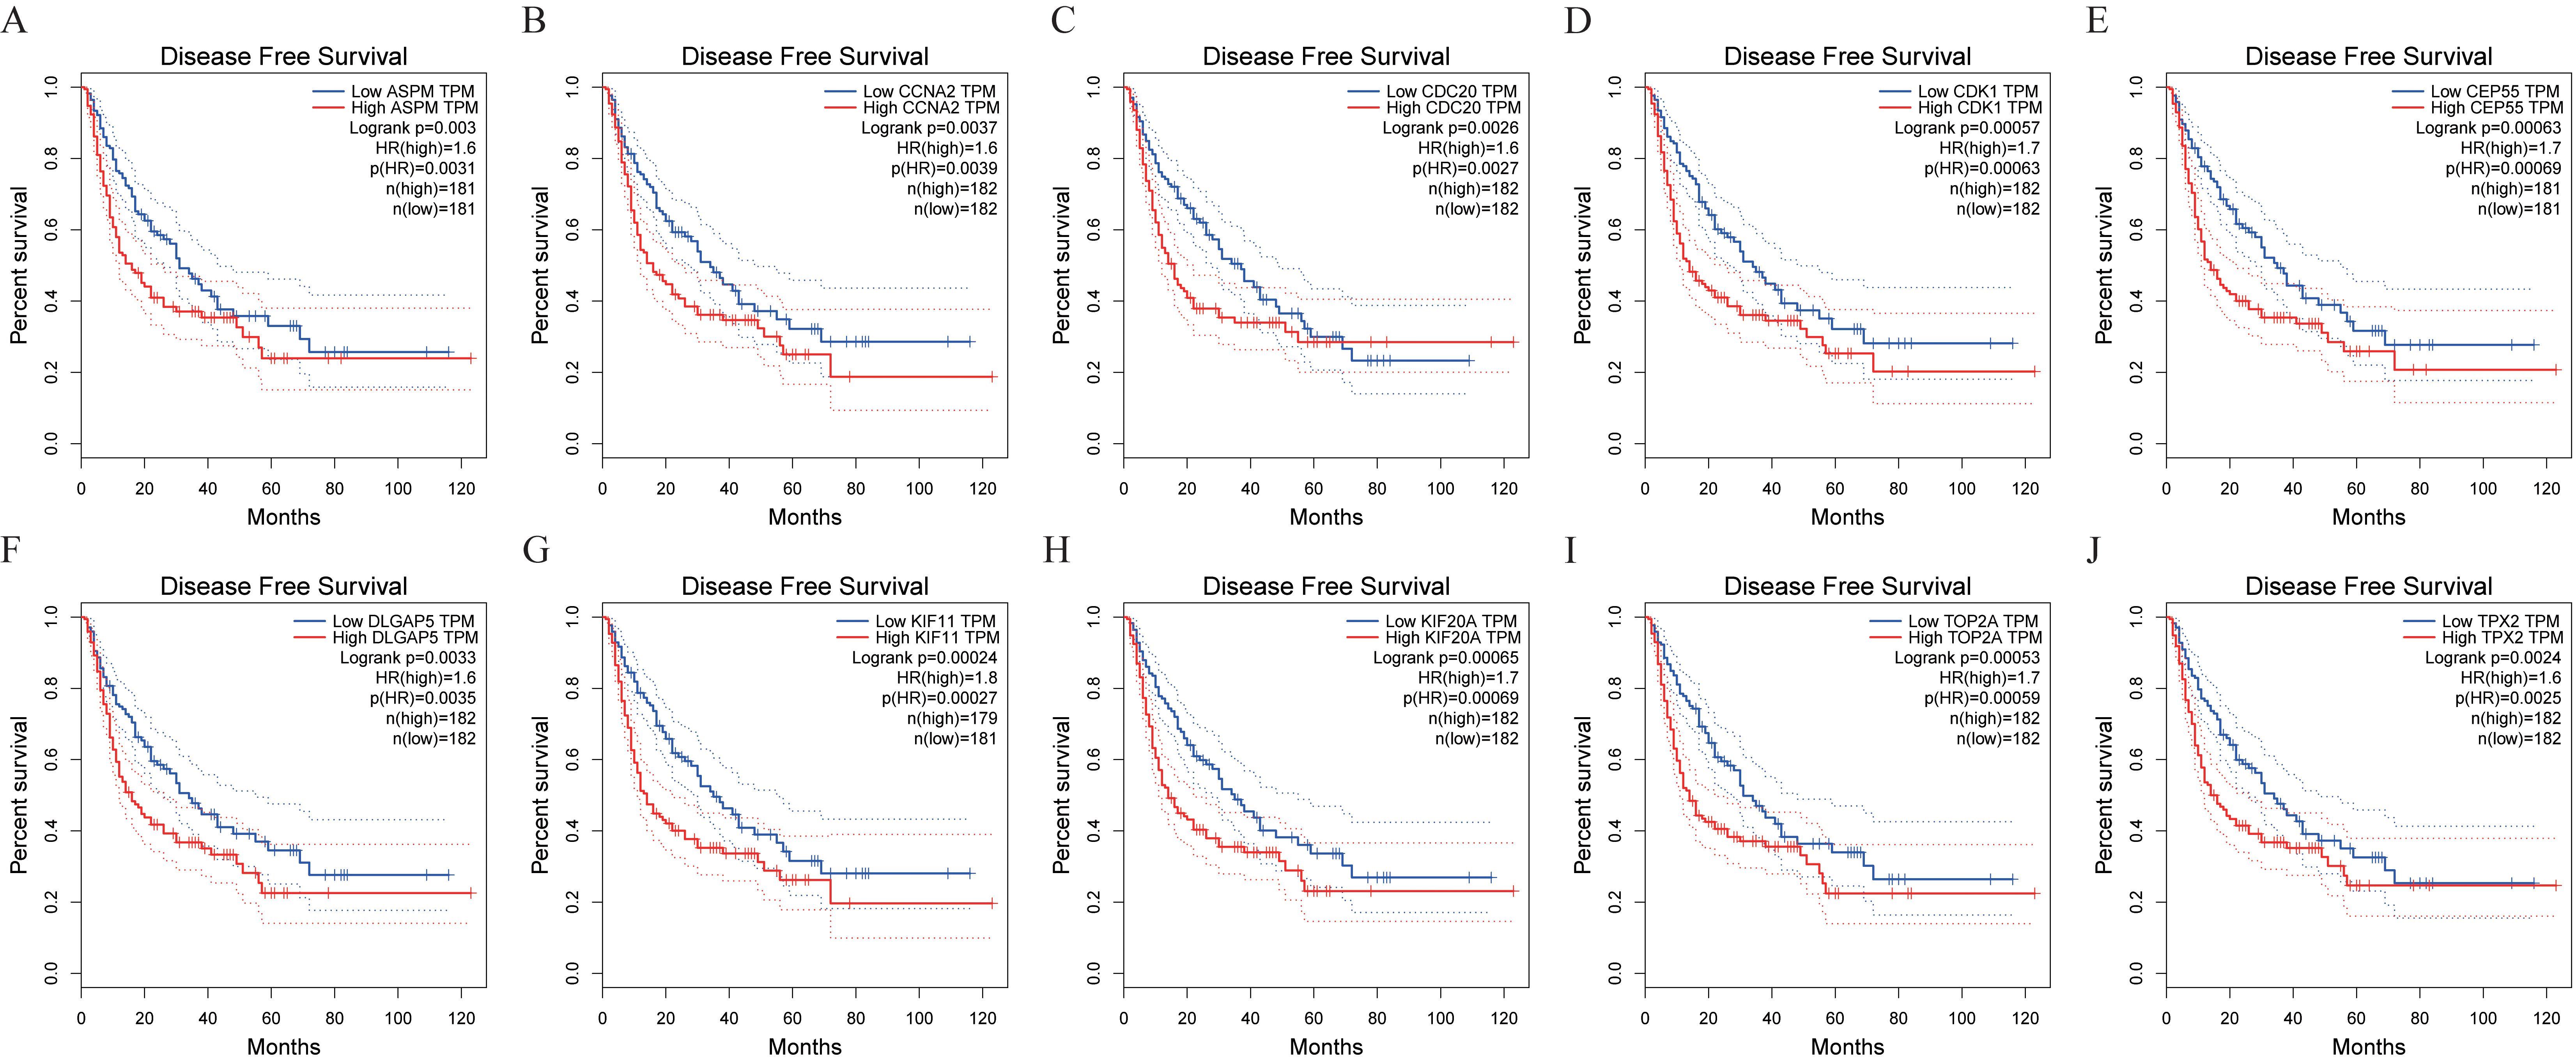
Immunohistochemistry of the real hub genes in tumor (top) and normal tissues (base) from the human protein atlas (HPA) database. (A) CDK1, (B) CDC20, (C) CCNA2. I represents liver tumor tissues. II represents normal tissues.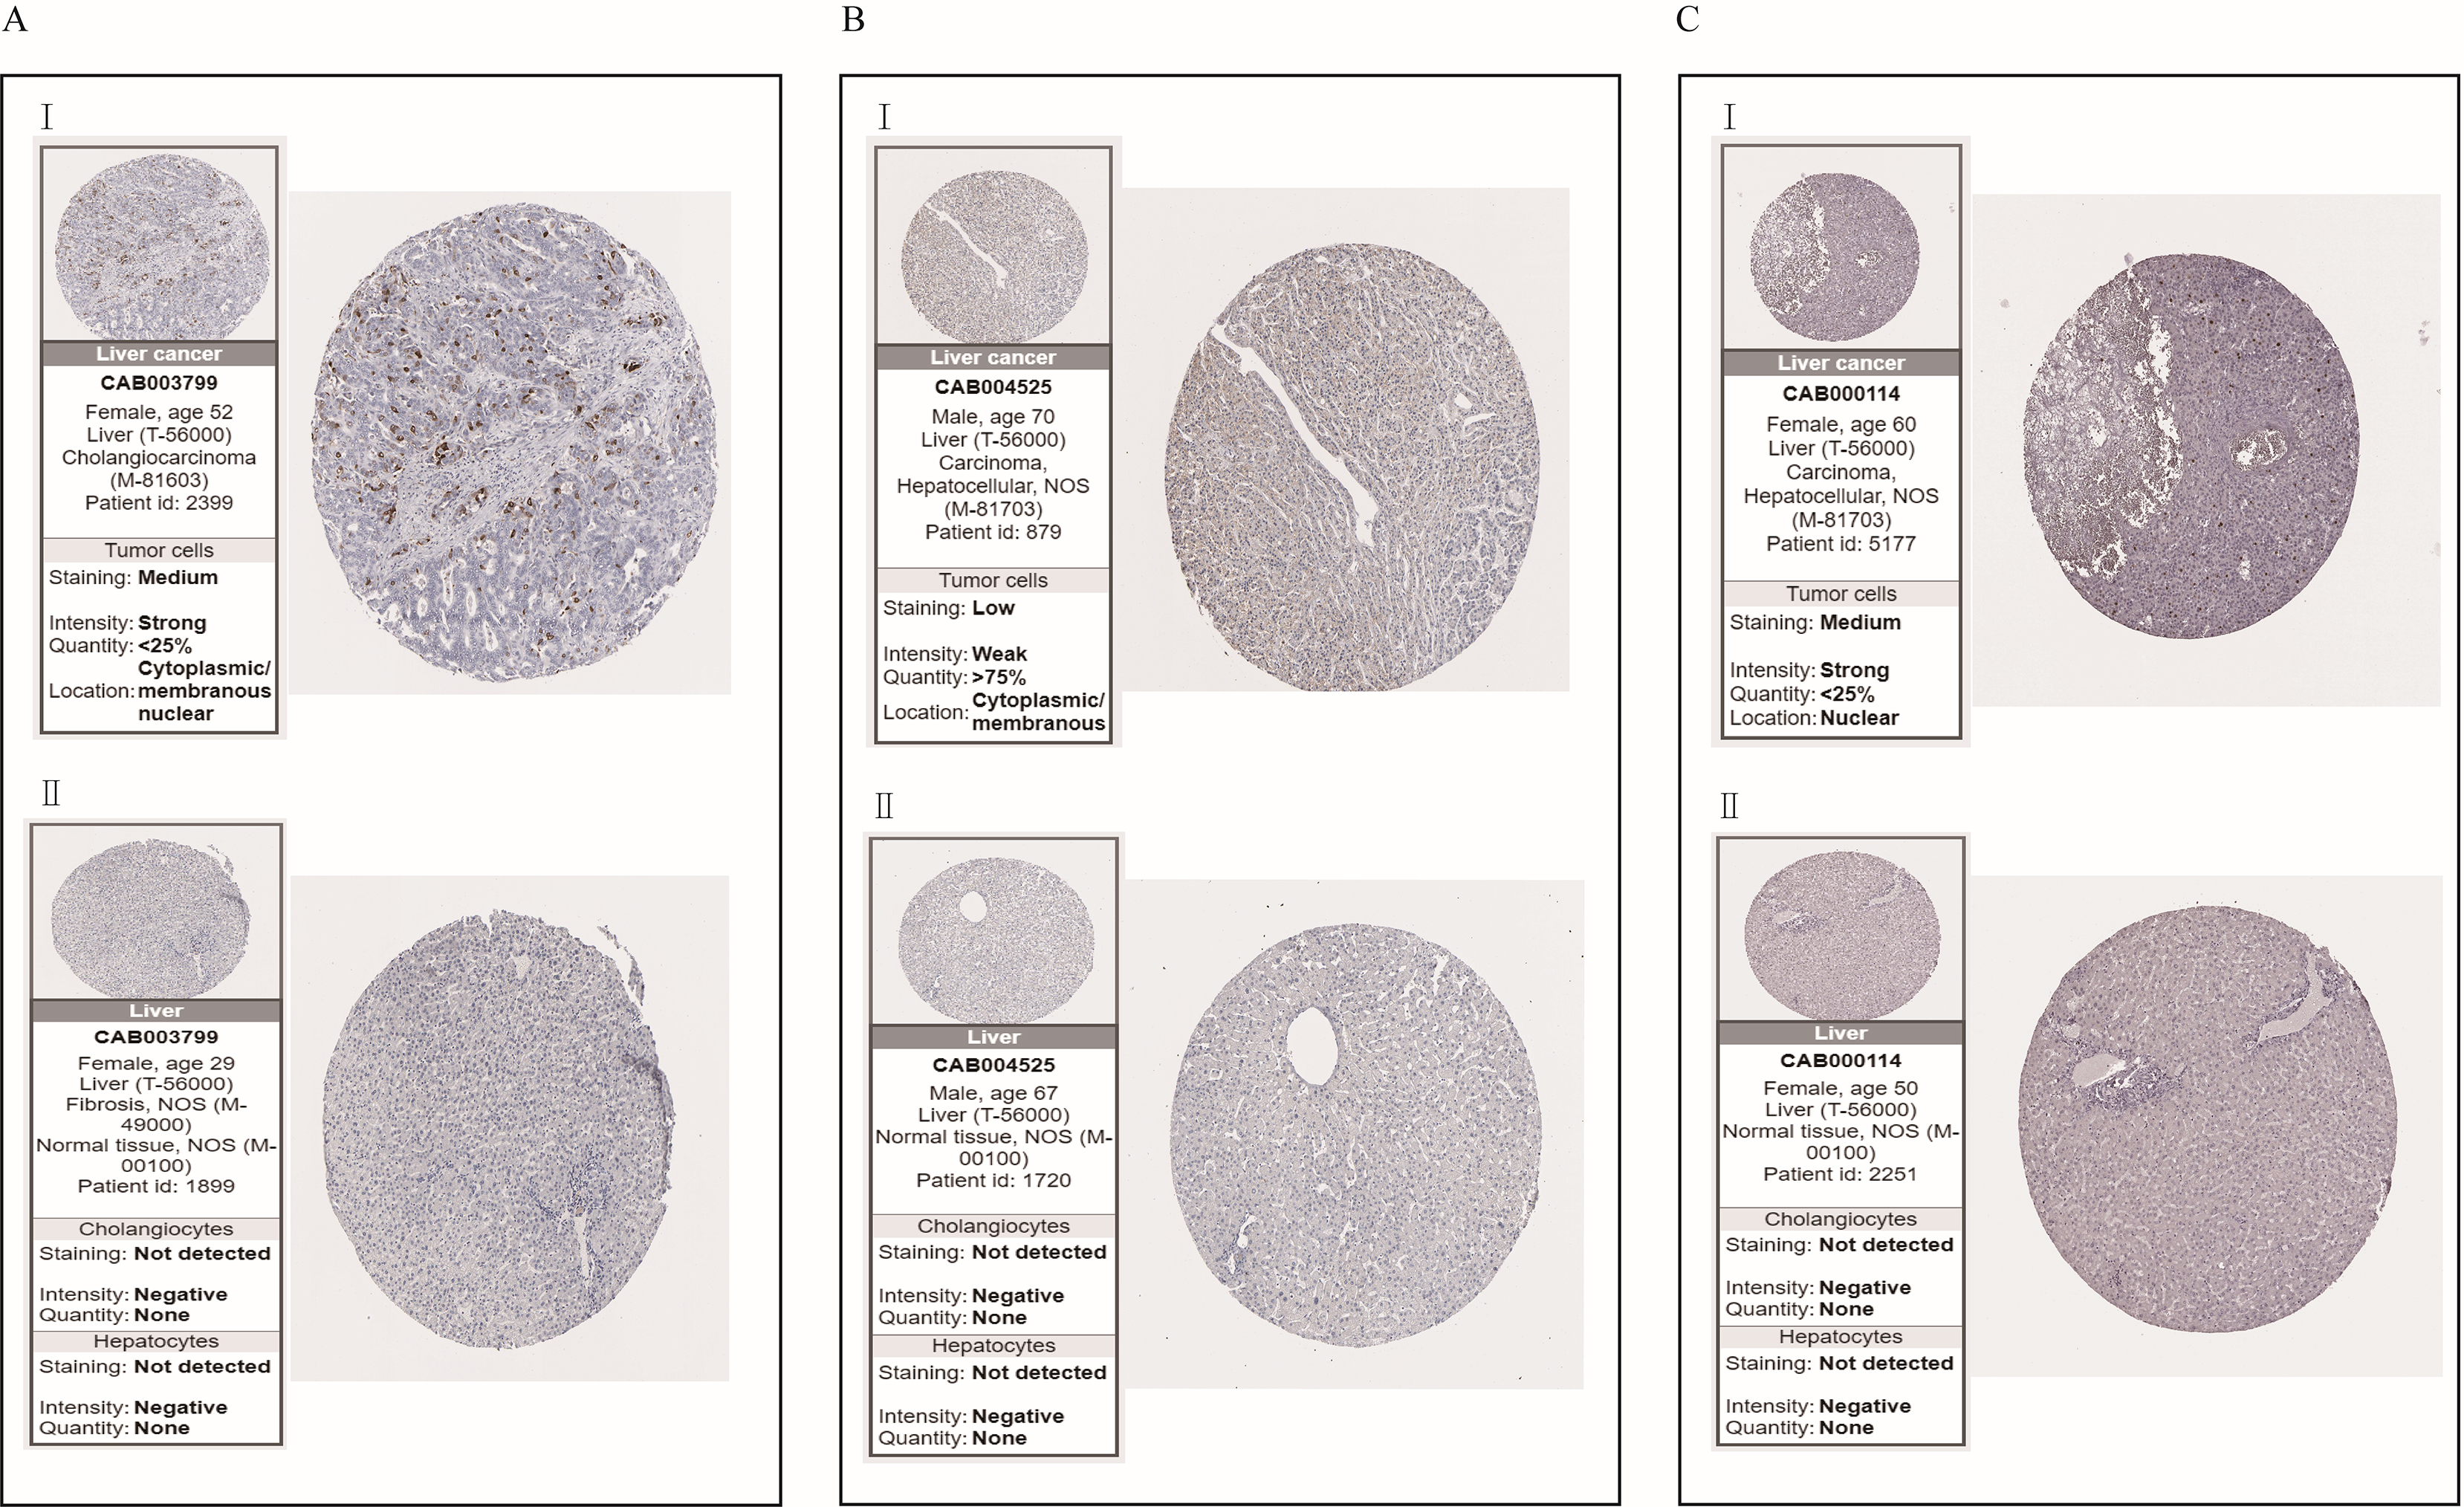
In the current clinical diagnosis and treatment, the continuous increase of serum alpha-fetoprotein (AFP) is often used as an important indicator of liver cancer, but the increase of AFP is also common in some other liver diseases, such as cirrhosis [16], indicating that the specificity and sensitivity of AFP for the diagnosis of liver cancer is not enough. Therefore, biomarkers with higher specificity and sensitivity are needed to diagnose early HCC and effectively judge the future survival of HCC patients. At present, many new and more effective biomarkers are being discovered and applied in clinics. For example, silencing DUSP21 significantly inhibited cell proliferation, colony formation, and tumorigenicity of HCC cells in vivo. DUSP21 plays a significant role in maintaining hepatocellular carcinoma cell proliferation, therefore it could be a potential therapeutic target for liver cancer [17]. High expression of cholesterol esterase (SOAT1) was associated with the worst prognostic risk. By inhibiting the cholesterol esterification enzyme SOAT1, cholesterol levels on the cytoplasmic membrane can be reduced, effectively inhibiting tumor cell proliferation and migration [18]. Therefore, in our study, DEGs and WGCNA were used for the biological analysis of HCC in TCGA and GEO databases. As a result, 73 genes were obtained; PPI and Cytoscape were used for further analysis of overlapping genes to obtain 10 hub genes. Namely, CDK1, TOP2A, DLGAP5, CDC20, ASPM, CEP55, TPX2, KIF11, KIF20A, CCNA2. Combining the enrichment of OS, DFS, and KEGG pathways of 10 genes, ultimately we found that high expression of CDK1, CDC20, and CCNA2 was significantly associated with OS in HCC patients.
Cyclin Dependent Kinase 1 (CDK1) is the protein-encoding gene for a protein that is a member of the Serine/threonine-protein kinase family. The protein is a catalytic subunit of a highly conserved protein kinase complex called the M-phase promoting factor (MPF), which is required for the G1/S and G2/M phase transitions of the eukaryotic cell cycle. It was found that miR-582-5p was down-regulated in hepatocellular carcinoma tissues and up-regulation of miR-582-5p inhibited cell proliferation and blocked the cell cycle in G0/G1 phase. miR-582-5p directly inhibited the expression of CDK1 and AKT3, and indirectly inhibited the expression of cyclinD1, thereby regulating HCC [19]. Experiments have also confirmed that dihydroartemisinin (DHA) can reduce the expression level of CDK1, thereby inhibiting the proliferation of liver cancer cells [20]. At present, CDK1 is highly expressed in various tumor tissues to varying degrees, and it has been proven that CDK1 can play an important role in lung cancer [21], breast cancer [22], pancreatic cancer [23], colorectal cancer [24] and so on by regulating the cell cycle. In the present study, high CDK1 expression was strongly associated with poor prognosis in HCC patients. KEGG pathway also showed that CDK1 was mainly involved in cell cycle, oocyte meiosis, cellular senescence, P53 signaling pathway, and other signaling pathways. Studies have found that CCNB1/CDK1 can mediate mitochondria, coordinate ATP output, and provide biological energy for cell G2/M transformation, thus interrupting the cell replication cycle [25, 26]. Therefore, CDK1 plays an essential role in the cell cycle and cell proliferation.
Anaphase Promoting Complex (APC) was activated by cell division cycle 20 (CDC20) and CDH1 to form two different E3 ubiquitin ligase complex sub-complexes, APC
The CCNA2 gene encodes a protein that belongs to a family of highly conserved cell cycle proteins, whose members function to regulate the cell cycle. CCNA2 binds and activates cyclin-dependent kinase 2, thereby facilitating the G1/S and G2/M transitions. Studies have shown that p53-P21-DREAM-CDE/CHR pathway can down-regulate the CCNA2 gene, thereby blocking the G2/M cell cycle and controlling the growth of cancer cells [35]. This article also found that high CCNA2 expression was significantly associated with the prognosis of HCC patients and that the proliferation of hepatocellular carcinoma cells could be inhibited by drugs that inhibit the FXR-miR-22-CCNA2 signaling pathway [36]. The current studies have found that CCNA2 is highly expressed in all types of tumors. For example, E2F1 can promote the proliferation of triple-negative breast cancer (TNBC) through up-regulation of CCNA2 [37]. miR-545 can inhibit proliferation by inhibiting CCNA2 expression in osteosarcoma cells [38]. In addition, the high expression of CCNA2 has been reported in lung cancer [39], gastric cancer [40], ovarian cancer [41], and esophageal cancer [42].
Studies have begun to target CDK1, CDC20, and CCNA2 as potential targets for liver cancer treatment. The therapeutic effect of sorafenib in hepatocellular carcinoma can be improved by blocking the CDK1/PDK1/DK1/
Multiple bioinformatics methods were used to jointly screen out potential targets for HCC. This study indicated that CDK1, CDC20, and CCNA2 show high expression in hepatocellular carcinoma tissues and that their high expression is negatively correlated with the survival rate of HCC patients, and these targets are mainly involved in regulating the cell cycle and thus controlling the proliferation of tumor cells. Therefore, in the future, we may be able to use them in the clinical diagnosis of early-stage liver cancer and also to predict the survival time of patients with liver cancer. The existing studies corroborate our view. Studies on different hepatocellular carcinoma samples have found that CDK1 is highly expressed in hepatocellular carcinoma cells and can influence tumorigenesis and proliferation by regulating the cell cycle [48, 49]. Other studies have also found that Tax protein can alter mitotic progression and mitotic defects by activating the CDC20 regulatory complex APC
However, our study also had many limitations. First, the sample size we selected was not large enough for a specific analysis of subtypes in HCC, which may lead to inaccurate hub gene screening and insufficient coverage. Secondly, the reliability of hub genes has not been verified experimentally in this paper, and the specific mechanism of hub genes regulating HCC is not fully understood, which needs further exploration in the future. Finally, the correlation between the high expression of these targets and the clinical manifestations and staging of hepatocellular carcinoma was not thoroughly clarified, which may be directly related to the insufficient size of our sample data. In the future direction of our study, we will further incorporate more diverse data to make our analysis more comprehensive.
In the future, we will include a more diverse and richer sample of liver cancer and will analyze it for different stages of liver cancer and those caused by different etiologies. These will provide further support for early liver cancer diagnosis and targeted treatment of liver cancer.
Conclusion
In summary, our combined analysis of the WGCNA and TCGA, and GEO databases has uncovered CDK1, CDC20, and CCNA2 as three potential targets that may be able to diagnose, analyze prognosis and even treat liver cancer. We also further validated the expression of real hub genes in HCC tissues and normal tissues through tissue expression differences and immunohistochemistry. We also analyzed that CDK1, CDC20, and CCNA2 control tumor growth mainly by regulating the cell cycle, but we lack further experimental validation. These findings may provide ideas for our subsequent studies and provide a reference for the more complex study of hepatocellular carcinoma to investigate this complex mechanism of hepatocellular carcinoma treatment.
Footnotes
Acknowledgments
Not applicable.
Author contributions
All authors reviewed and approved the final manuscript.
Conception: Yu Qiao, Fahu Yuan and Zhigang Zhao.
Interpretation or analysis of data: Yu Qiao, Xin Wang, Jun Hu and Yurong Mao.
Reparation of the manuscript: Fahu Yuan, Zhigang Zhao and Xin Wang.
Revision for important intellectual content: Yu Qiao, Fahu Yuan and Zhigang Zhao.
Supervision: Zhigang Zhao.