
Abstract
Depression and anxiety disorders are the most common mental disorders and the leading contributors to the non-fatal burden of disease in Australia [1,2]. With around one in five adults in Australia experiencing a mental disorder in a 12 month period, it is likely that the majority of the population will either experience, or have contact with someone who is experiencing, such a disorder [1]. Despite the scale of the problem, community knowledge about mental disorders and treatments tends to lag behind that of other major disorders such as cancer and cardiovascular disease [3]. Furthermore, approximately two thirds of those meeting the criteria for a mental disorder do not seek help in any one year [4].
Since the early 1990s, a number of community surveys of mental health literacy (defined as knowledge and beliefs about mental disorders which aid their recognition, management or prevention) have been carried out in Australia [5–7]. Results from these surveys suggest there have been improvements over time, with greater recognition of depression and more positive ratings of interventions such as help from mental health professionals, psychiatric medications, psychotherapy and admission to a psychiatric ward [7–9]. Community awareness programs run by organizations such as beyondblue have played a role in improving the Australian public's recognition of depression and beliefs about treatments. [10]. However, there is still need for improvement in many areas, including that of mental health literacy regarding anxiety disorders, which are less likely than depression to be correctly identified [11]. There is also a need to further explore the links between mental health literacy and population mental health [12].
One way to focus public attention on relevant health and social issues is through the use of key summary statistics. While some statistics, such as the road toll, may be expressed as absolute numbers or as prevalence rates, others, such as the Consumer Price Index or the recently developed National Wellbeing Index, may be expressed as percentages of a baseline measure [13]. One advantage of the latter approach is that it avoids the need for consumers to have sufficient ‘literacy’ to understand the meaning of prevalence rates. In the case of mental disorders, the ‘Index’ approach appears particularly appropriate given that a prevalence rate is not absolute in the same sense as a road toll. Prevalence rates for mental disorders vary according to survey methodology, the duration they cover and any cut-points applied to scales used to define a person as having a mental disorder [14].
Thus, in order to promote community debate on mental health and monitor changes in depression rates in a way that may be readily understood by the public, a National Depression Index was developed by two of the authors (A.J.M. and A.F.J.) [15]. This involved using data from the 1997 National Surveys of Mental Health and Wellbeing (NSMHWB) and the 2001 National Health Survey (NHS), with the items for the index selected from the 10-item Kessler Psychological Distress Scale (K10) [16]. The K10 has been extensively used in Australian surveys and several studies have examined the correspondence between K10 scores and diagnoses of anxiety, affective and substance use disorders [17,18].
For the whole population in 2001, the index was set at 100. Scores above 100 indicated populations at greater risk and those lower than 100 indicated lower risk. Since the development of the original index, further surveys have been carried out that have collected the required information to calculate the index, including the 2007 NSMHWB and the 2004–2005 and 2007–2008 NHS, and some data from these surveys is available for analysis. The aim of the current study was to modify the National Depression Index, and create a National Anxiety Index, a similar measure of the anxiety status of the Australian population. Further aims were to compare data from recent surveys with that from previous surveys, and to compare relative risk of depression and anxiety between different population sub-groups.
Methods
National survey datasets
Cross-sectional data from four large surveys of the Australian population were used: the 1997 and 2007 NSMHWB and the 2001 and 2004/2005 NHS. These were carried out by the Australian Bureau of Statistics with data from all the surveys collected by personal interviews. The response rates for the NSMHWB were 78% in 1997 and 60% in 2007, and for the NHS, they were 92% in 2001 and 89% in 2004/2005 [19–22]. The indices were developed and calibrated using data from the 1997 NSMHWB and the 2001 NHS and then applied to the later years of these surveys.
Respondents
While the 2001 and 2004–2005 NHS had respondents less than 18 years of age, the K10 questions were administered to those 18 years and over. All respondents in the 1997 NSMHWB were 18 years and over, while in the 2007 survey respondents 16 years of age and over were administered the K10 questions. For consistency, only responses from those 18 years of age and over were included in the analyses. Survey respondent numbers were as follows: 1997 NSMHWB, n = 10 641; 2007 NSMHWB, n = 8461; 2001 NHS, n = 17 918; and 2004/2005 NHS, n = 19 474.
Development of the indices
It was not possible to follow the approach taken during the development of the original index which used empirical methods for item selection. Therefore a content-based approach was used. In order to produce separate depression and anxiety indices, the K10 items were divided into separate anxiety and depression dimensions, an approach supported by the analysis of Brooks et al. [23], who concluded that the K10 consists of a second-order factor structure with two factors representing depression and anxiety. The items were divided as follows.
Items for National Depression Index
In the past four weeks, about how often did you feel tired out for no good reason?
In the past four weeks, about how often did you feel without hope/hopeless?
In the past four weeks, about how often did you feel depressed?
In the past four weeks, about how often did you feel that everything was an effort?
In the past four weeks, about how often did you feel so sad that nothing could cheer you up?
In the past four weeks, about how often did you feel worthless?
Items for National Anxiety Index
In the past four weeks, about how often did you feel nervous?
In the past four weeks, about how often did you feel so nervous that nothing could calm you down?
In the past four weeks, about how often did you feel restless or jumpy/fidgety?
In the past four weeks, about how often did you feel so restless that you could not sit still?
Two separate scales from these summed items were initially created using the 2007 NSMHWB dataset to predict the probability of depression and anxiety ‘caseness’ respectively. This survey was used to obtain the predicted probabilities of depression and anxiety because it contains diagnoses for the Australian population based on the World Mental Health Composite International Diagnostic Interview (WMH CIDI 3.0) in addition to the individual K10 items.
The procedure for deriving the predicted probabilities involved estimating two logistic regression models: one with the prevalence of ICD-10 affective disorders in the past 30 days as the dependent variable with the six K10 items composing the depression scale as the predictor of depression caseness; and one with the prevalence of ICD-10 anxiety disorders in the past 30 days as the dependent variable with the four K10 items composing the anxiety scale as the predictor variable of anxiety caseness. From the results of the logistic regression models, the predicted probabilities of depression and anxiety for each individual were generated. Not surprisingly, these probability scores predicted 100% of the cases of past 30 day depression and past 30 day anxiety disorder in the 2007 NSMHWB.
Once the predicted probabilities for 30 day depression and anxiety were estimated, these probabilities were then applied to K10 depression and anxiety scale scores constructed in the 1997 NSMHWB and the 2001 and 2004–2005 NHS. (This is a similar method to that proposed by Kessler et al. [24], where estimates of the predicted probability of serious mental illness were calculated for each respondent from K6 scores). Indices of the relative risk for depression and anxiety in these datasets were then calculated by dividing the individual probability scores by the mean probability of caseness for each scale and then multiplying by 100 to eliminate the need to interpret and report decimal values. Values greater than or less than 100 on the indices indicate a greater or lower likelihood of depression and anxiety caseness respectively.
The mean scores on the indices were found to be consistently higher for the NHS than for the NSMHWB on the demographic characteristics examined. Consequently, the decision was made to create two sets of indices. The 1997 NSMHWB and 2001 NHS depression and anxiety indices were used as the benchmark for each survey by setting the subsequent year of these surveys to their respective means and then calculating their respective index scores.
Demographic characteristics examined
Overall differences in the mean risk of depression and anxiety were examined, along with sub-population analyses examining differences in mean index scores by age group (18–24, 25–44, 45–64, > 64), household income (with the fifth quintile representing the highest income group), employment status (employed, unemployed, not in the labour force) and geographical location (major cities, inner regional, other areas) for men and women.
Household income data were not available for the 1997 NSMHWB. Also, there was a change in the classification/release of income information between 2001 and 2004/2005 in the NHS. In the 2001 NHS, gross weekly cash income of income unit in deciles was available, while in the 2004/2005 NHS, even though income units were identified, only gross weekly equivalized cash income of household in deciles was made available. While income unit and household income largely overlap, there are a small proportion of households that have more than one income unit, as when people live together, but do not have the type of relationship that involves the sharing of their income. While this should be kept in mind when interpreting the income quintile changes for men and women between the 2001 and 2004/2005 NHS on the depression and anxiety indices, this difference is unlikely to affect the results. For example, 96% of households comprised single income units in the 2004/2005 NHS. Consequently, for simplicity and consistency with the NSMHWB, we refer to ‘household income’.
Method of analysis
Analyses of overall change and changes within sub-populations in the mean risk of depression and anxiety were conducted using non-parametric bootstrapping, with 3000 replications to estimate bias-corrected 95% confidence intervals. These provided more conservative estimates than those derived from using the jackknife replicate weights method. All analyses were conducted using Stata Release 10.
Bootstrapped analyses could not be conducted on the differences in the mean risk of depression and anxiety by age for men and women in the 2004/2005 NHS. The age categories are not consistent between the 2001 and 2004/2005 NHS datasets available in the basic confidential unit record file (CURF). In an attempt to overcome this limitation, access was gained to the more detailed CURF using the Australian Bureau of Statistics Remote Access Data Laboratory (RADL) system. However, this system does not allow bootstrapped analyses because of their computational intensity.
Results
Index development
Like many epidemiological samples, these scales have exponential distributions. That is, most of the individuals had very low predicted probabilities, with the number of individuals decreasing as the predicted probabilities of depression and anxiety on the scales increased. The mean predicted probabilities of depression and anxiety for the 1997 NSMHWB were 0.025 and 0.072 respectively. For the 2001 NHS, the mean predicted probabilities of depression and anxiety were 0.033 and 0.093 respectively. The predicted probabilities on the depression and anxiety scales in the benchmark surveys had large, positive correlations: 0.64 for the 1997 NSMHWB and 0.62 for the 2001 NHS. This indicates that there is substantial comorbidity between the disorders.
As can be seen in Figure 1, the mean risk of anxiety increased significantly between the 1997 and 2007 NSMHWB (107.91; 95% CI = 104.76–110.94). The mean risk of anxiety in the 2001 and 2004/2005 NHS, as well as the mean risk of depression between the years examined in both surveys, was similar.
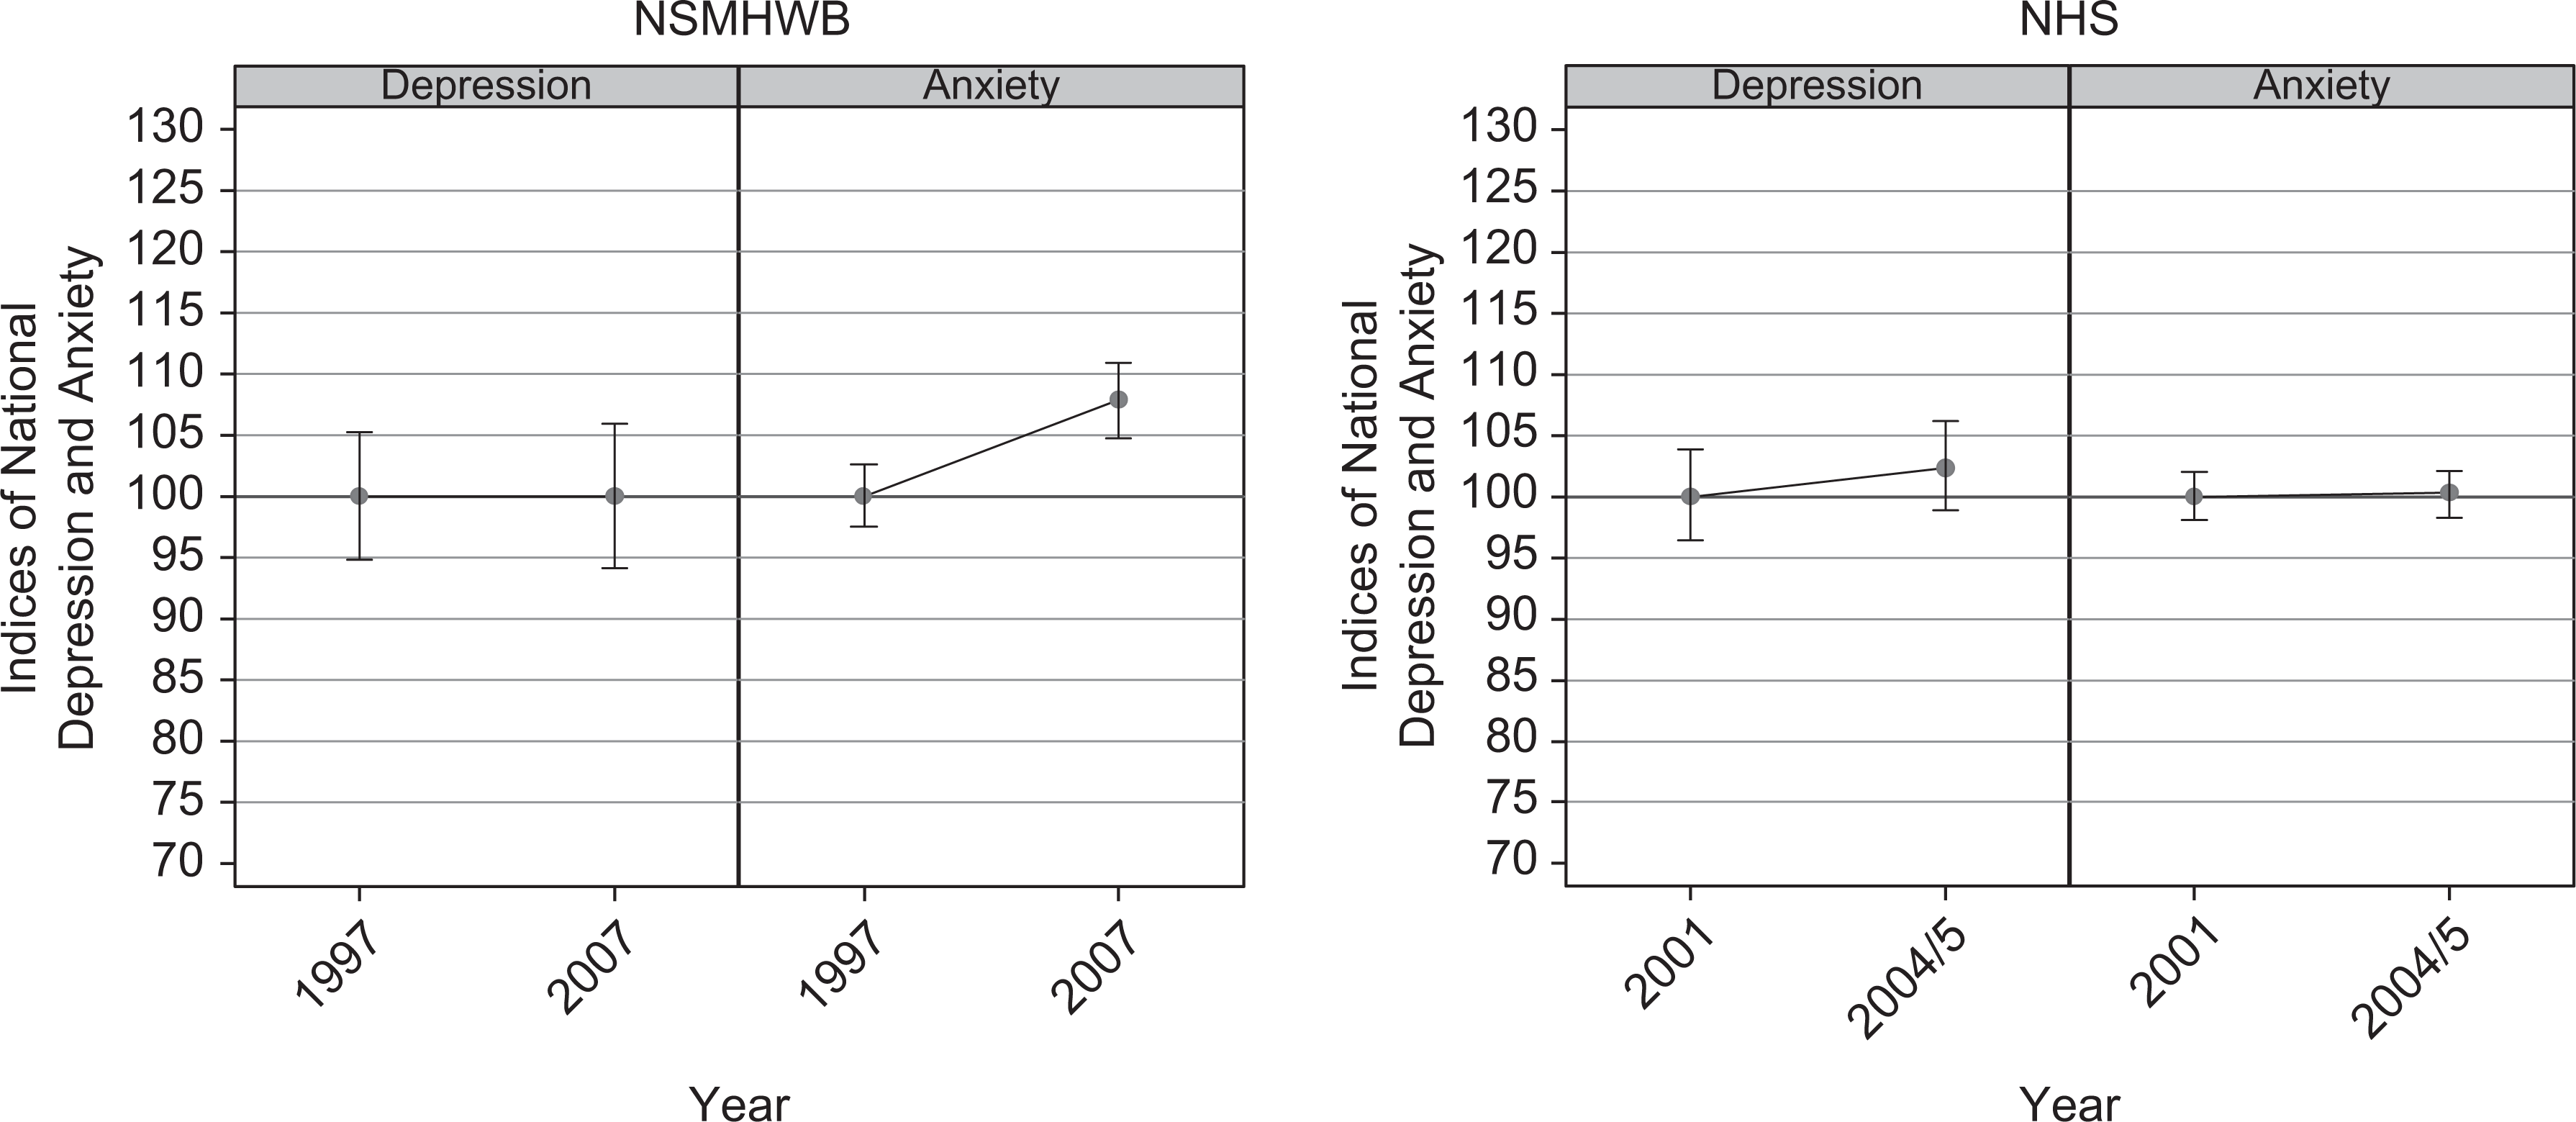
Mean risk of depression and anxiety: NSMHWB 1997 and 2007, and NHS 2001 and 2004/2005.
Mean index scores in subgroups
Age and gender
There were no significant differences in the mean risk of depression by age for men and women. However, women aged 45–64 had a significantly higher mean risk of anxiety in the 2007 NSMHWB (118.98; 95% CI = 110.75–128.54) than in 1997 (100.91; 95% CI = 94.13–108.42) (see Figure 2). No other significant differences were observed.
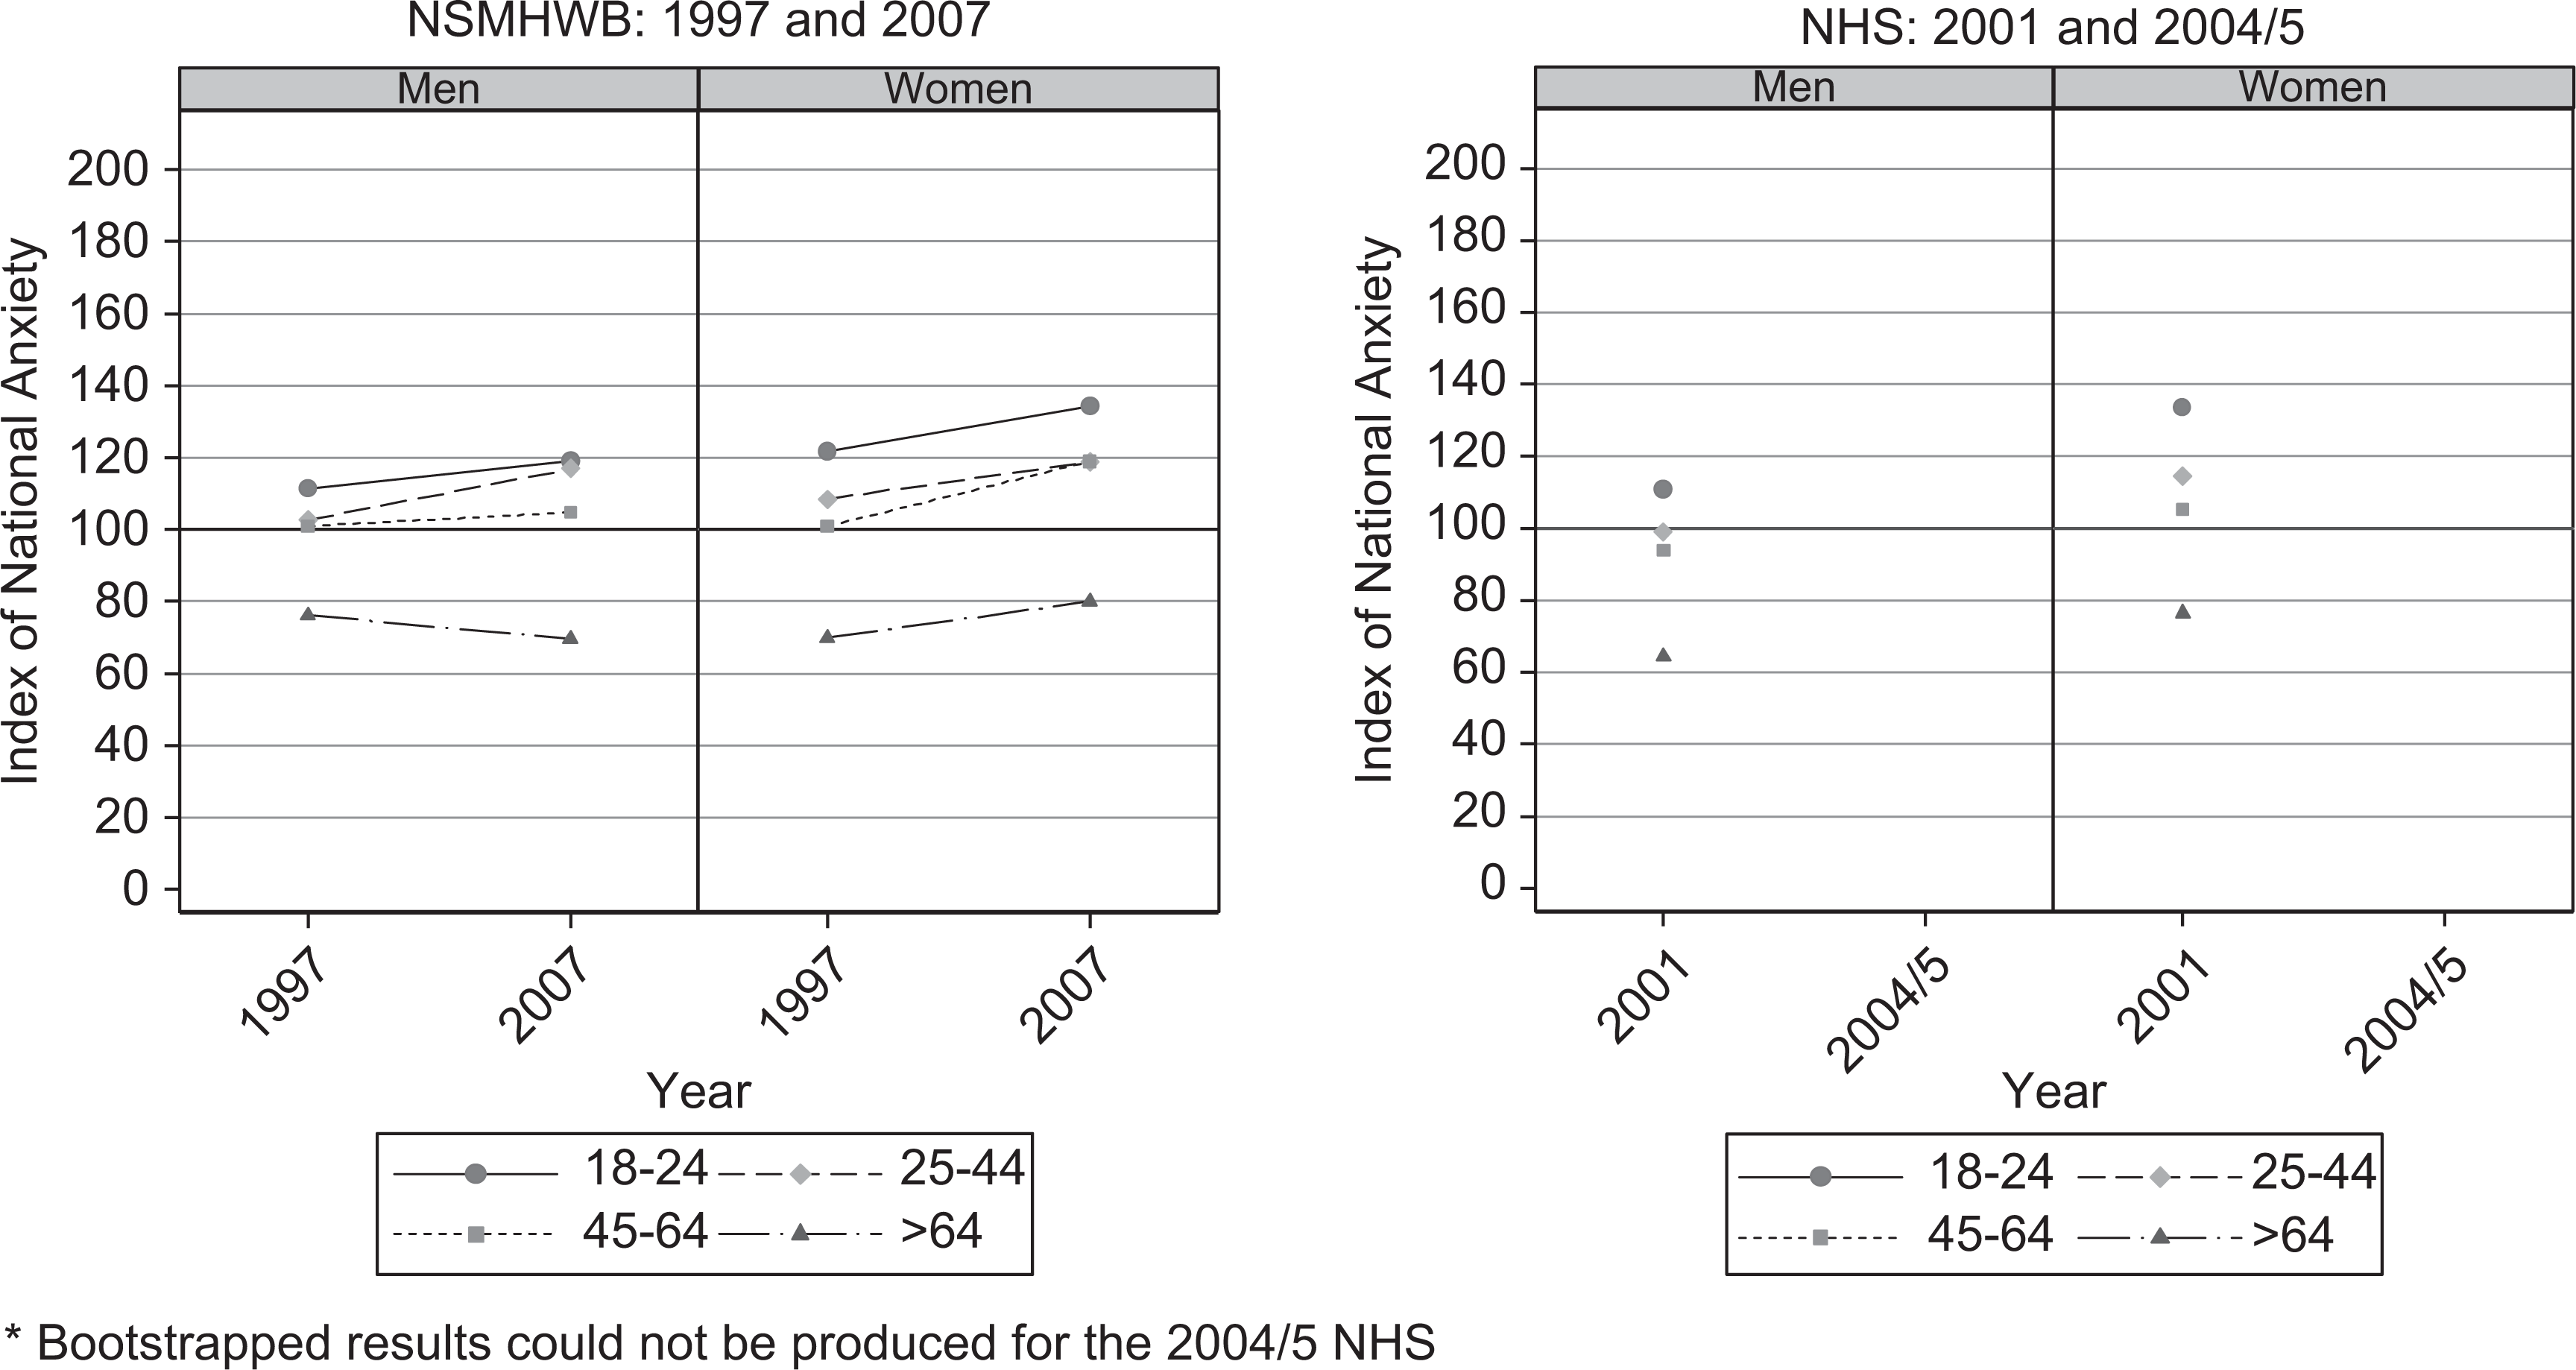
Mean risk of anxiety by age for men and women: NSMHWB 1997 and 2007, and NHS 2001 and 2004/2005.
Household income
The only significant difference in mean risk of depression by household income was for men in Quintile 5 (the highest income group) in the NHS, for whom the risk was higher in 2004/2005 (48.35; 95% CI = 43.11–54.65) than in 2001 (37.44; 95% CI = 34.13–41.92). There were no significant differences in the mean risk of anxiety by household income for men and women.
Employment status
There were no significant differences in the mean risk of depression by employment status for men and women. However, for employed men in the NSMHWB, the mean risk of anxiety was significantly lower in 1997 (91.19; 95% CI = 87.76–95.07) than in 2007 (100.11; 95% CI = 95.38–104.85) (see Figure 3). This was also true for women (1997 NSMHWB: 96.08; 95% CI = 92.05–100.57 versus 2007 NSMHWB: 109.49; 95% CI =104.63–114.23).
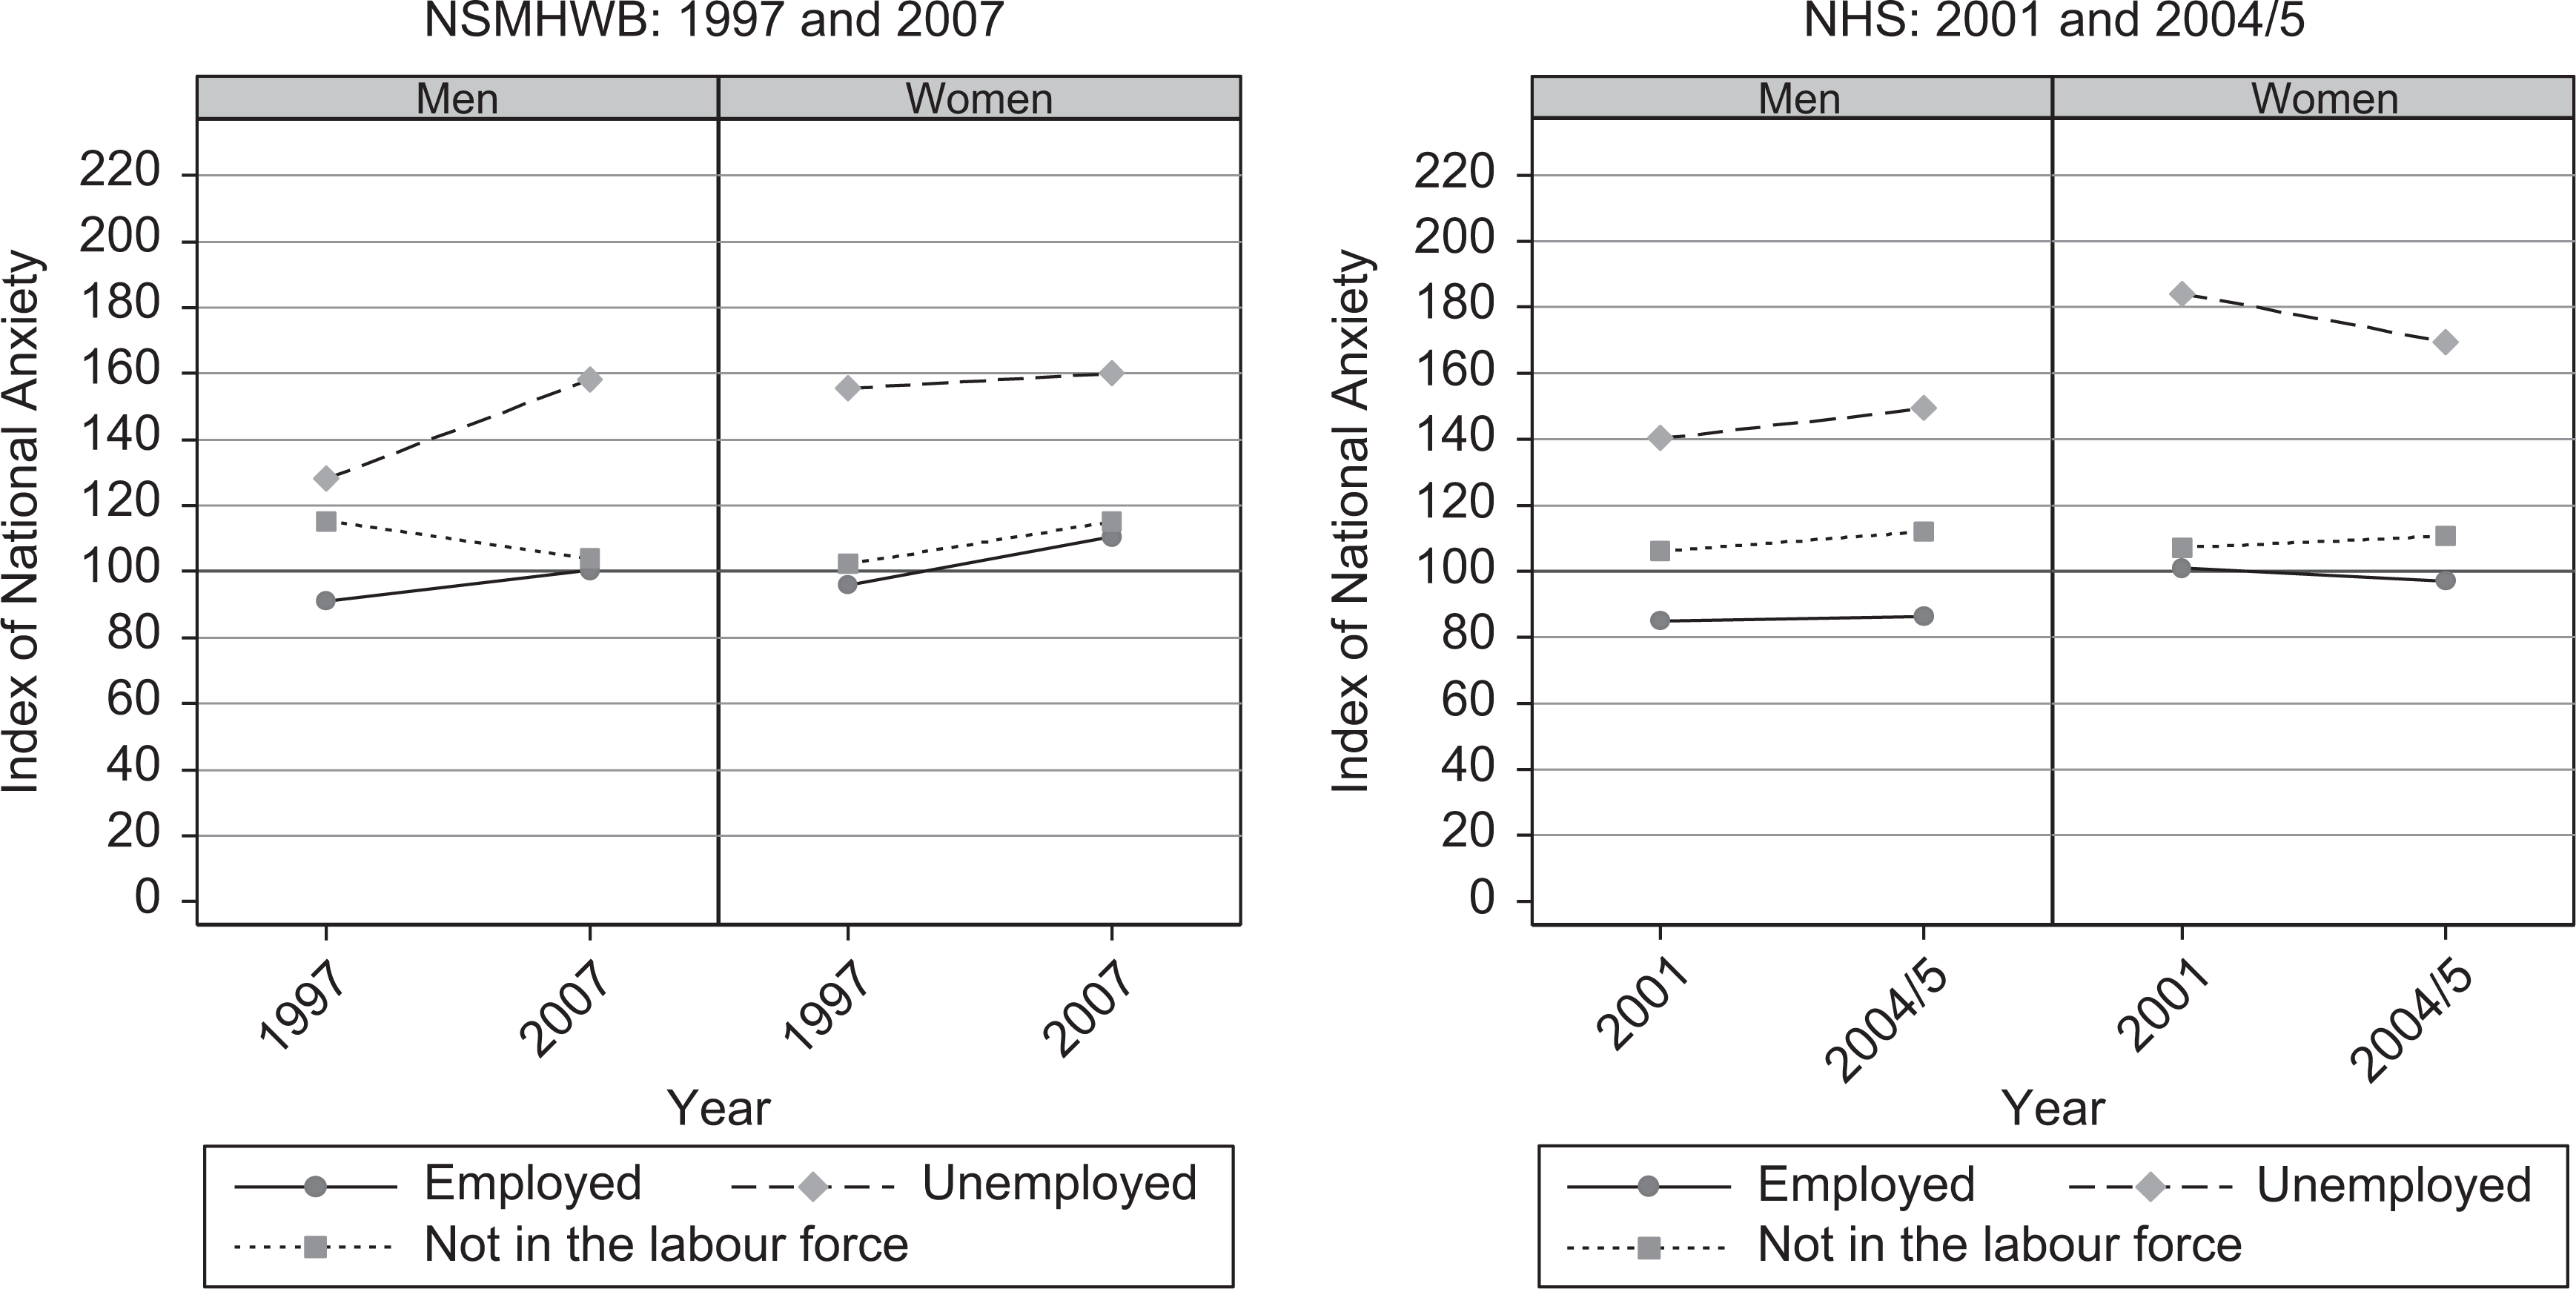
Mean risk of anxiety by employment status for men and women: NSMHWB 1997 and 2007, and NHS 2001 and 2004/2005.
Geographical location
There were no significant differences in the mean risk of depression by geographical location for men and women. However, women in major cities in the NSMHWB, had a mean risk of anxiety that was significantly lower in 1997 (102.56; 95% CI = 98.22–106.87) than in 2007 (112.44; 95% CI = 107.29–117.55) (see Figure 4). This was also true for women in non-regional rural areas (1997 NSMHWB: 90.73; 95% CI = 83.77–98.25 versus 2007 NSMHWB: 117.55; 95% CI = 104.07–133.13).
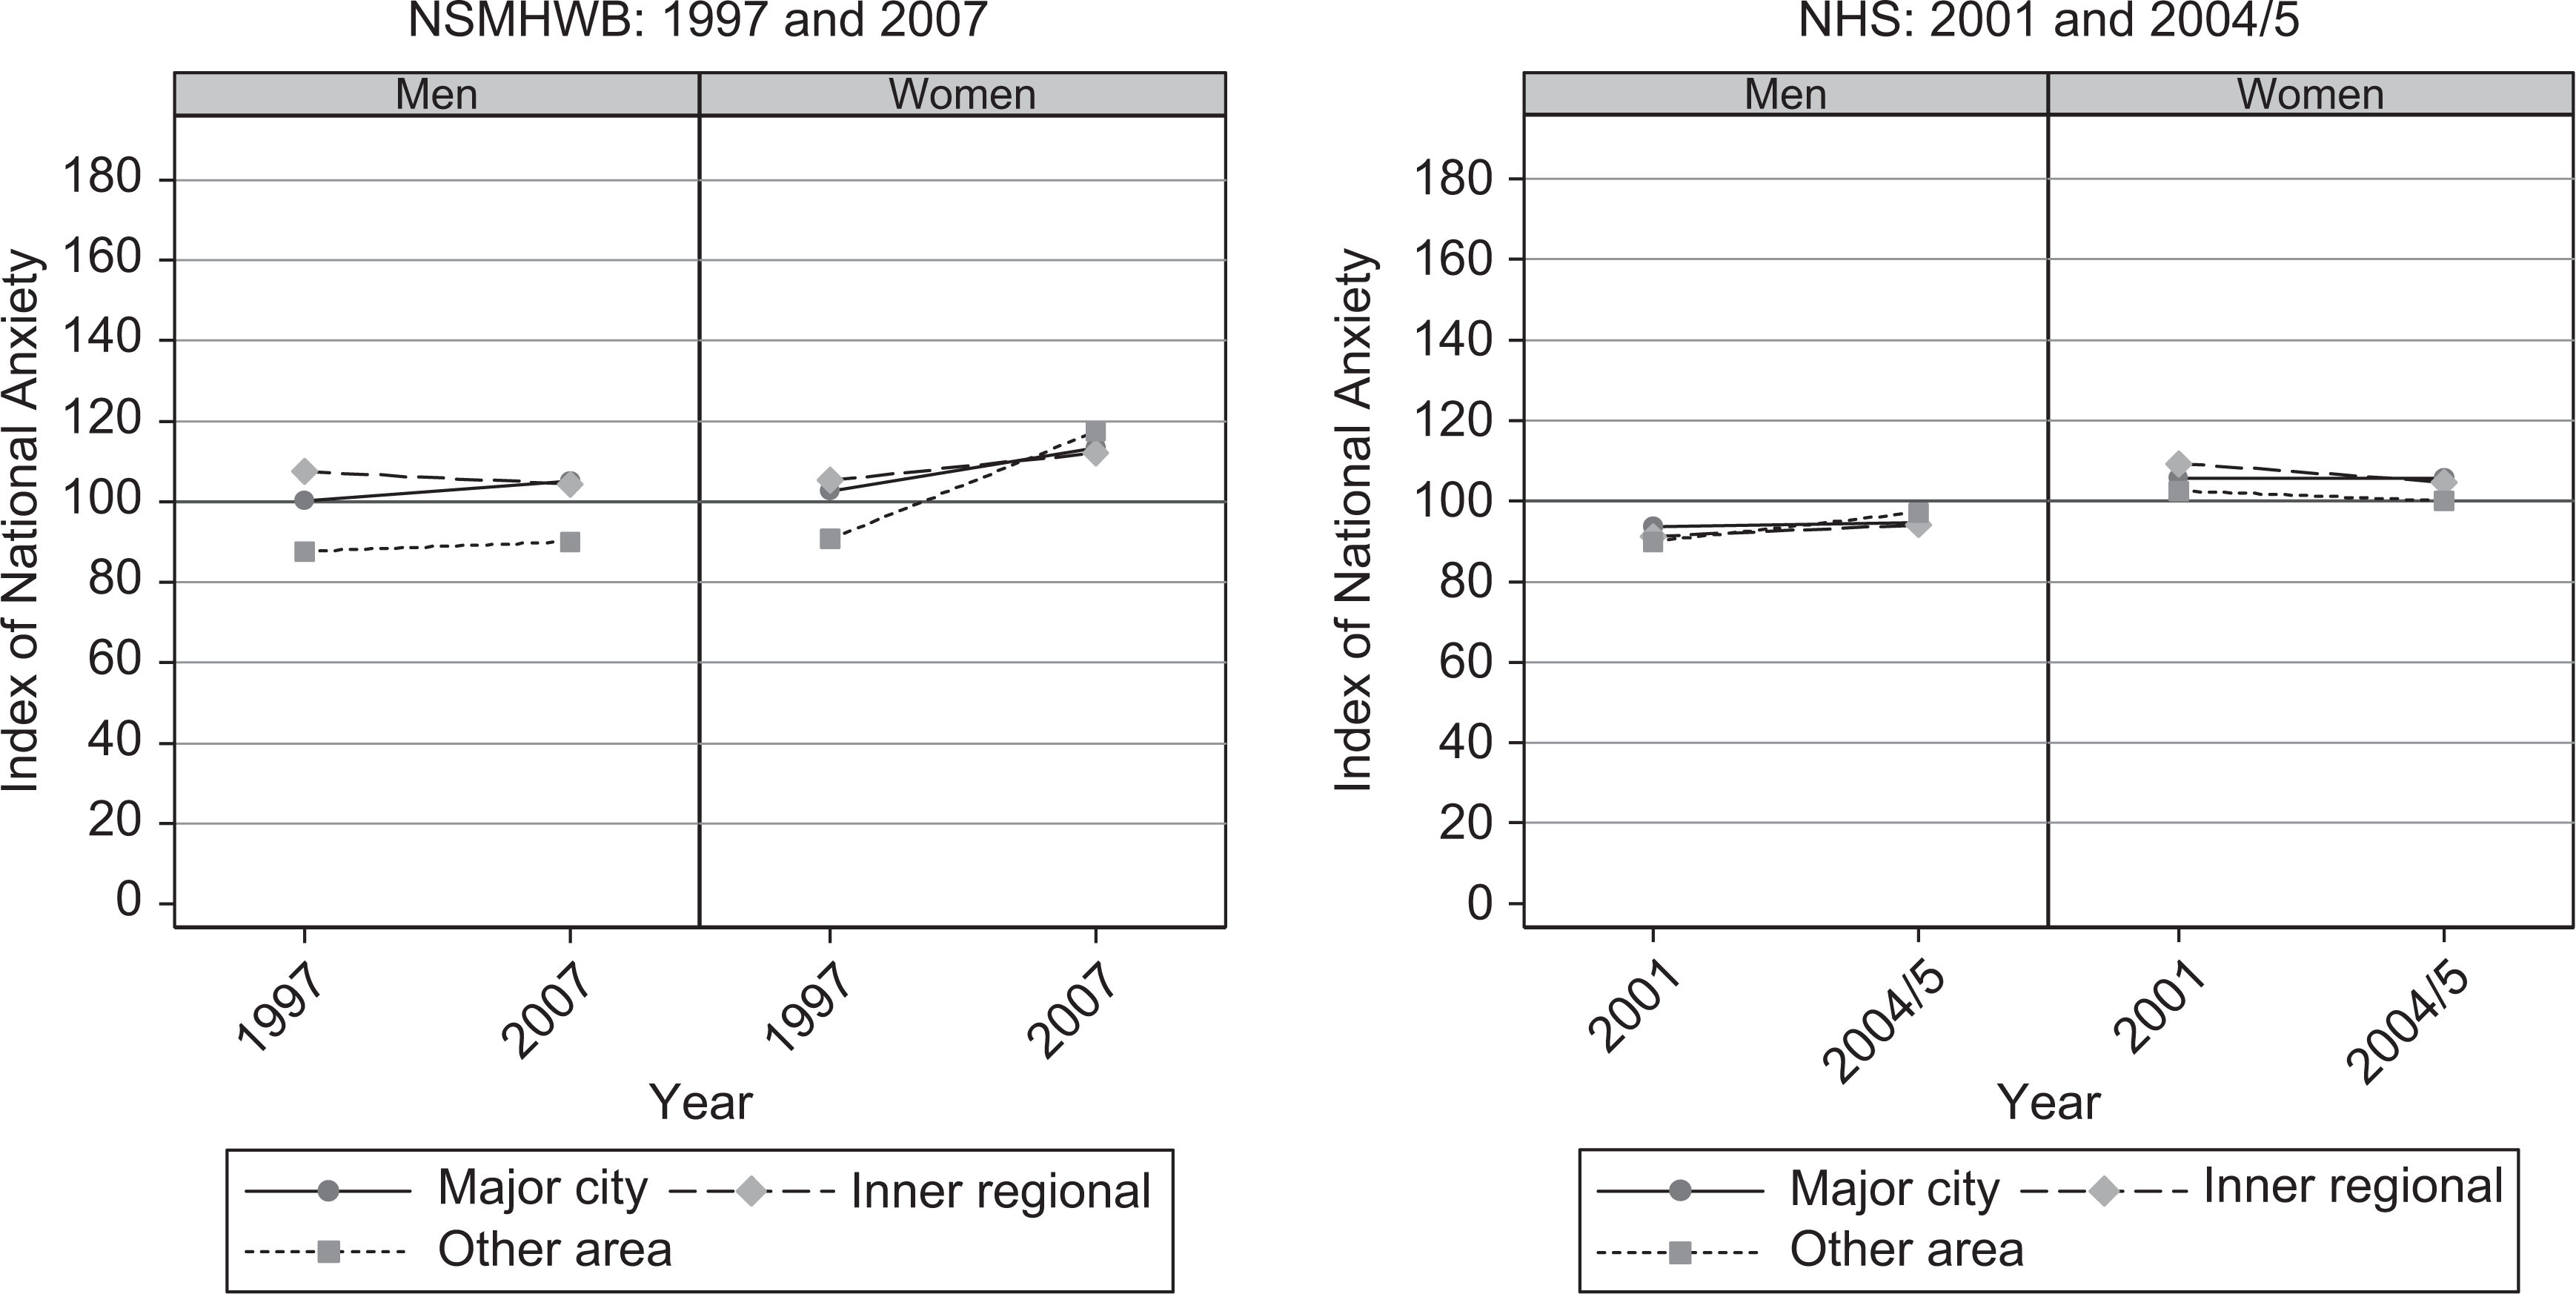
Mean risk of anxiety by geographic location for men and women: NSMHWB 1997 and 2007, and NHS 2001 and 2004/2005.
Discussion
The results suggest that there are population differences in risk of anxiety and depression and that the indices are sensitive enough to detect differences in population groups, such as those of different age, gender, income, employment status and geographical location. There was an overall increase in the mean risk of anxiety between the 1997 and 2007 NSMHWB, but no significant difference in the mean risk of depression.
When population subgroups were compared using data from the NSMHWB, significant increases in the relative risk of anxiety were seen in women aged 45–64, in employed men and women, and in women living in the inner city and other areas. There were no significant differences in relative risk of anxiety using NHS data. In terms of the relative risk of depression, the only significant difference was an increase in the mean risk for men with a household income in the fifth quintile (i.e. the highest income group, with an income greater than AU$997 per week in 2004/2005).
Thus, it appears that the anxiety index is more variable than that for depression and that, in subpopulations in which there has been significant change, there has been an increase in recent years. As this increase was only seen when using the NSMHWB data, it is possible that the shorter time span of the NHS data did not allow for sufficient change. This may also be due to differences in survey methodology. The use of data from subsequent NHS surveys may help to clarify this. However, data from the current study support the need for a greater focus on anxiety disorders in population health campaigns such as those conducted by beyondblue. This may be of greatest value in women aged 45 to 64 and in employed men and women.
Rates of service use for mental disorders are lower in those with anxiety disorders than in those with affective disorders [4]. Using data from the Pharmaceutical Benefits Scheme, Hollingworth et al. [25] found that antidepressant use increased 41% between 2002 and 2007. There is also evidence to suggest that use of psychologists increased between 1997 and 2007 [4]. It is possible that public education programmes and improvements in mental health literacy [7,8] have contributed to improved treatment rates and that this may partly explain the lack of an increase in mean depression index values comparable with that seen in the anxiety index.
A number of recent Australian studies have reported worsening mental health over time [26–28]. Using data from national household surveys conducted in 1995 and 2003/4, including the 4-NS measure of psychological distress, Jorm and Butterworth [27] reported an increase in psychological distress in men aged 20 to 29 years. Results from the South Australian surveys conducted in 1998, 2004 and 2008, involving about 3000 participants, showed a significant increase in the overall prevalence of major depression between 1998 and 2008 [28]. This was largely driven by significant increases in men aged between 15 and 29 and women aged between 30 and 49 years. In a recent study drawing on a wide range of evidence, Eckersley et al. [26] concluded that young people's mental health has declined over time. The results of the current study, in which no increase in the risk of depression or anxiety was seen in those aged 18 to 24, does not appear to support the contention that mental health of young people has worsened in recent years. Furthermore, the principal indicator of population mental health is the suicide rate. Examination of the age-standardized suicide rate in 2008 was 10.2 per 100 000, compared with 13.2 per 100 000 in 1999 [29]. Thus, in a similar time period to that covered in the present study there has been a decrease in the suicide rate.
Limitations
Some limitations of the approach taken in the current study should be noted, one of which is the difficulty of distinguishing between the anxiety and depression indices. These indices were highly correlated. However, other studies support the separation of K10 items into separate anxiety and depression factors [23]. In support of this, in the current study, the risks of depression and anxiety differed between population subgroups. This suggests that, while the anxiety and depression items may be hard to differentiate psychometrically, they have somewhat different risk factors.
A further limitation is that these indices have been designed to examine differences between population groups and not individuals or small groups (e.g. small clinical samples), as they will be highly sensitive to the presence of those with high K10 scores who, necessarily, are very likely to be ‘cases’ [15].
It was found that K10 scores and thus index values were consistently higher for the NHS than for the NSMHWB. It is possible that these differences arise as a result of sampling frame or other methodological differences between the surveys: for example, the survey context in which K10 questions were asked and the placement of these questions in the order of the questionnaire. However, the basis of these differences are largely a matter of speculation. The results of the analyses reported here, as well as those from other surveys [28], support the need for further research into the links between survey methodology and responses to instruments which elicit symptoms of mental disorders.
The cross-sectional nature of these data makes it impossible to draw conclusions about causality. In addition, while the current study was able to identify patterns of increased risk in some population sub-groups, the comparison of only two time points in the analyses limits the current usefulness of the indices, as does the non-comparability of the NHS and NSMHWB data. To enable trends to be examined, consistency in data collection and release by the ABS will be important. For example, while data on the individual K10 items were collected for the 2007/2008 NHS (essential for the development of separate depression and anxiety indices), these data were not released. Further analysis using data from later surveys, provided there is consistent data collection and release, will assist in the comparison of relative risk of depression and anxiety between different population groups, and may assist in determining the effectiveness of interventions to improve the nation's mental health.
Conclusions
Study results suggest that between 1997 and 2007 the mean risk of anxiety in the overall population increased, with this largely driven by increases in women aged between 45 and 64 and in employed men and women. The only significant increase in mean risk of depression was for those in the highest income group in the NHS. This may support the need for public education to focus on anxiety disorders, particularly in these subpopulations.
Footnotes
Acknowledgements