
Abstract
Objective:
The aim of this project was to detail the costs associated with the high prevalence mental disorders (depression, anxiety-related and substance use) in Australia, using community-based, nationally representative survey data.
Methods:
Respondents diagnosed, within the preceding 12 months, with high prevalence mental disorders using the Confidentialised Unit Record Files of the 2007 National Survey of Mental Health and Wellbeing were analysed. The use of healthcare resources (hospitalisations, consultations and medications), productivity loss, income tax loss and welfare benefits were estimated. Unit costs of healthcare services were obtained from the Independent Hospital Pricing Authority, Medicare and Pharmaceutical Benefits Scheme. Labour participation rates and unemployment rates were determined from the National Survey of Mental Health and Wellbeing. Daily wage rates adjusted by age and sex were obtained from Australian Bureau of Statistics and used to estimate productivity losses. Income tax loss was estimated based on the Australian Taxation Office rates. The average cost of commonly received Government welfare benefits adjusted by age was used to estimate welfare payments. All estimates were expressed in 2013–2014 AUD and presented from multiple perspectives including public sector, individuals, private insurers, health sector and societal.
Results:
The average annual treatment cost for people seeking treatment was AUD660 (public), AUD195 (individual), AUD1058 (private) and AUD845 from the health sector’s perspective. The total annual healthcare cost was estimated at AUD974m, consisting of AUD700m to the public sector, AUD168m to individuals, and AUD107m to the private sector. The total annual productivity loss attributed to the population with high prevalence mental disorders was estimated at AUD11.8b, coupled with the yearly income tax loss at AUD1.23b and welfare payments at AUD12.9b.
Conclusion:
The population with high prevalence mental disorders not only incurs substantial cost to the Australian healthcare system but also large economic losses to society.
Keywords
Introduction
Mental and substance use disorders have drawn global attention in the last decade due to their health, social and economic consequences (Whiteford et al., 2013; World Health Organization, 2014). According to the 2010 Global Burden of Disease study, mental and substance use disorders were the leading cause of non-fatal burden of disease (Whiteford et al., 2013). Globally, depression, anxiety disorders and substance use disorders comprised 40.5%, 14.6% and 20.5% (including both illicit drug use and alcohol use disorders) of the total disability adjusted life years (DALYs) attributed to mental and substance use disorders, respectively (Whiteford et al., 2013). In Australia, mental and behavioural disorders accounted for 12.9% of total disease burden, ranking third after cancer and cardiovascular diseases. When limited to non-fatal diseases, they made up of 22.3% of total DALYs in Australia (Australian Institute of Health and Welfare, 2016).
While burden of disease studies measure health impacts, they comprise only one element of ‘burden’. Cost of illness (COI) studies measure the economic burden associated with a health condition including both direct and indirect costs. Direct costs usually represent the monetary value of healthcare resources that could be used for other purposes if the disease was not present (e.g. hospitalisations, community medical costs, pharmaceutical costs, allied healthcare costs). Indirect costs usually refer to the value of lost productivity due to morbidity and mortality. Other costs, such as direct non-health sector costs can also be included in COI studies (e.g. criminal justice system). COI studies can be very informative to policy-makers as they not only provide estimates regarding the cost associated with the treatment but also economic impact on different social sectors (Tarricone, 2006).
Although numerous international COI studies for high prevalence mental disorders (HPD), including depression, anxiety and substance use disorders, are available, there are major impediments to their usefulness in the Australian decision-making context. For example, there are methodological inconsistencies between the studies as well as important structural differences in healthcare systems (Luppa et al., 2007). The mental health expenditure series published by Australian Institute of Health and Welfare (2014) and Australian Government Department of Health and Ageing (2013), while useful, are based on ‘top down’ expenditure allocations, which do not report total expenditure by diagnostic category and do not include costs outside of governmental expenditures (such as productivity impacts). Furthermore, these costs are dependent on institutional diagnostic coding systems which may or may not fully account for costs associated with mental health problems.
The aim of the current study is to estimate the annual costs of HPD from multiple perspectives within the Australian health sector and society using individual data from the most recent Australian community-based mental health survey, the 2007 National Survey of Mental Health and Wellbeing (NSMHWB). This is the first study, to our knowledge, which has costed service use and productivity losses using data from this survey.
Methods
This analysis utilised the 2007 NSMHWB conducted by the Australian Bureau of Statistics (ABS). The 2007 NSMHWB surveyed Australians aged 16–85 with a focus on three major groups of mental disorders: anxiety disorders, affective disorders and substance use disorders (ABS, 2008c). The information collected included individual diagnosis, healthcare resource use, physical conditions, severity of the mental issues, impact of mental health on daily life, and demographic and socio-economic status. The response rate of the 2007 survey was 60% with a final sample of 8841 respondents. Since the response rate was less than expected (in comparison with the first NSMHWB conducted in 1997 where there was a 78% response rate), concerns regarding the representativeness of the survey were addressed by extensive non-response analyses and adjustment in the weighting strategy (ABS, 2008b). The age and gender of the respondents was weighted to match the age and gender distribution in Australia.
Population
We estimated the costs associated with HPD including depression, anxiety-related disorders and substance use disorders (see Table 1). People with comorbid psychosis were excluded from the analysis due to exceptionally high management costs that might introduce bias. The International Classification of Diseases–10 (ICD-10) was selected to identify the target population instead of the Diagnostic and Statistical Manual of Mental Disorder–Fourth Edition (DSM-IV). This was consistent with other existing studies which used the 2007 NSMHWB (ABS, 2008d; Burgess et al., 2009). In addition to the specified diagnosis, the recency of symptoms further categorised diagnosis as (1) 30-day diagnosis, (2) 12-month diagnosis and (3) lifetime diagnosis. The 12-month diagnosis category was adopted in the analysis to match the collected 12-month resource use data.
Subgroup diagnoses within each principal diagnosis used in the 2007 NSMHWB.
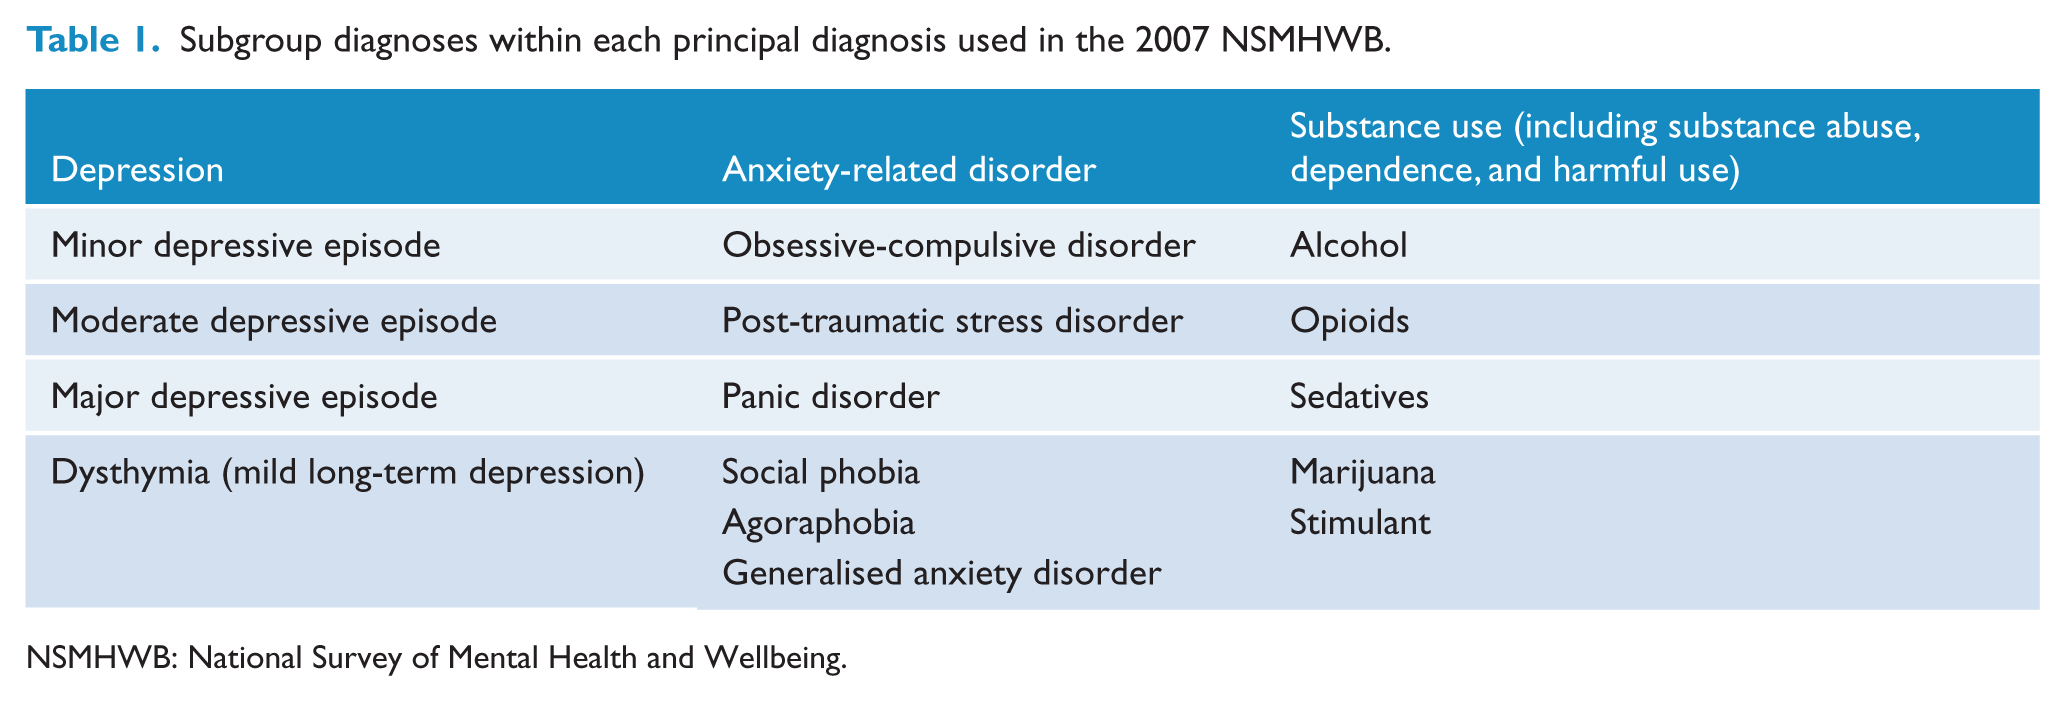
NSMHWB: National Survey of Mental Health and Wellbeing.
Costs
A bottom-up costing approach based on individual-level data was adopted in the estimation of costs associated with HPD. The type of costs included in the analysis was mental health-related treatment costs (i.e. hospitalisation, consultation and medication use), productivity loss, distributed welfare benefits and income tax forgone. The perspectives taken in the study were public (i.e. government), private (i.e. insurance), individual (i.e. out-of-pocket payment by consumers), health sector (i.e. public + private + individual) and societal (i.e. productivity impact). Table 2 summarises the resource use included in each of perspectives. All the costs presented were calculated as annual costs and expressed in 2013–2014 AUD
Resources included in the analysis from each perspective.
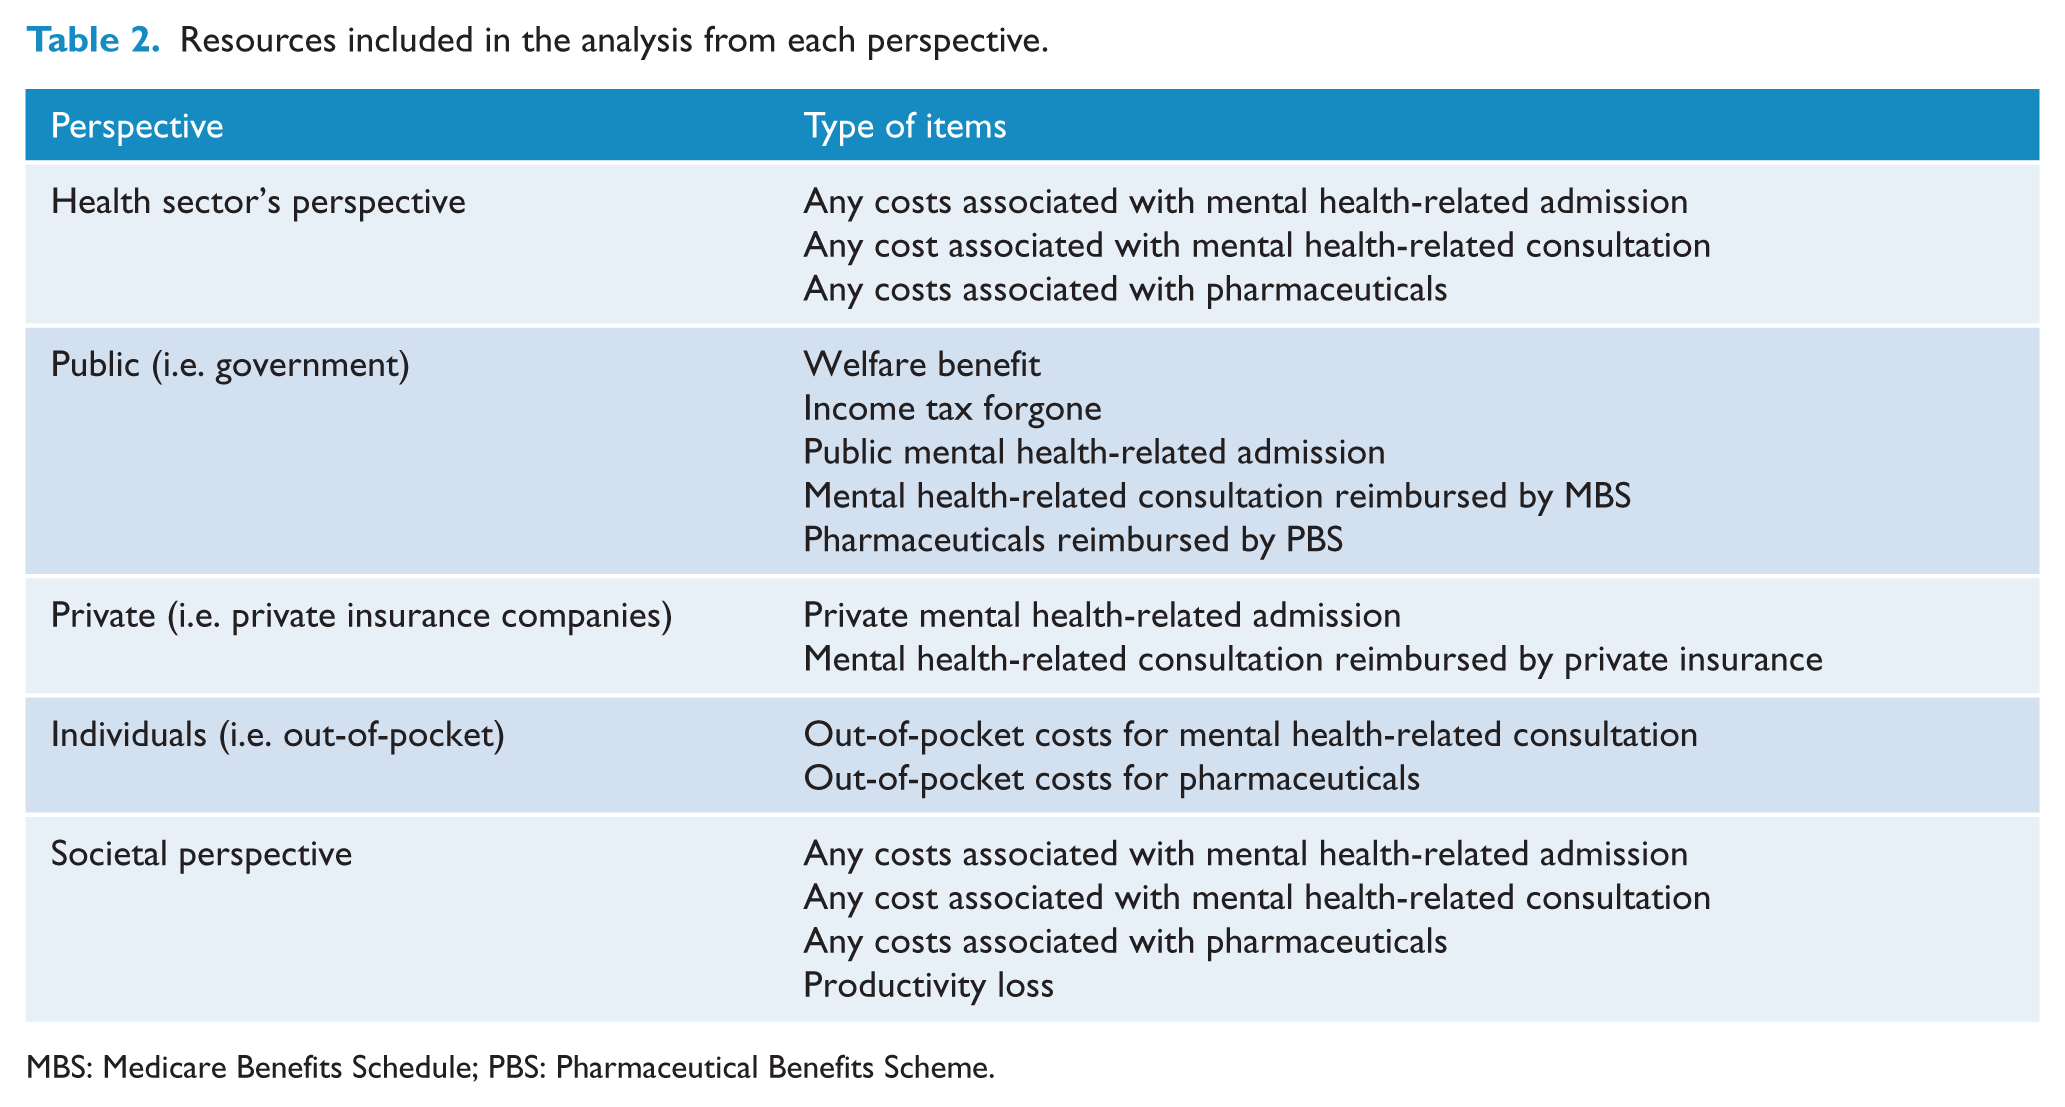
MBS: Medicare Benefits Schedule; PBS: Pharmaceutical Benefits Scheme.
Mental health treatment costs
Twelve-month mental healthcare-related resource use (including hospitalisations, consultations and medications) was collected in the 2007 NSMHWB using a self-report format and costed for the current study. Total costs were determined for the whole population meeting the criteria for a HPD. Average costs per person were based on people who met the criteria for a HPD and sought treatment. Treatment seeking refers to people who meet the criteria for a HPD and stated that they used at least one healthcare resource specifically for their mental health.
Data from the Independent Hospital Pricing Authority (IHPA) were used to assign costs to each hospitalisation reported by survey respondents. The IHPA was established by the Commonwealth of Australia as part of the National Health Reform Act 2011 to determine an annual National Efficient Price (NEP), which is a major determinant of the cost to the Australian Government for public hospital services. In addition, the IHPA also developed the National Weighted Activity Unit (NWAU) as a measure of activity expressed as a common unit, against which the NEP is paid (Australian Institute of Health and Welfare, 2015). For each hospital admission, a NWAU was calculated using Australian refined Diagnosis Related Groups (AR-DRGs) in the IHPA algorithms. The NWAU derived from different AR-DRG codes was based on the reason for hospital admission reported in the survey. The resulting NWAU per case was then multiplied by the 2013–2014 published NEP price of AUD4993 (IHPA, 2015). Public hospital cost was used for both public and private hospital admissions since many cost items occurring in the public sector such as medical salaries, pathology, pharmacy, imaging or allied health services were not accounted for in private hospitals’ unit costs.
The use of up to five medications with duration of use for each survey respondent was collected in the 2007 NSMHWB. Since the reason for taking each medication was not collected in the survey, medications commonly prescribed for people diagnosed with HPD were costed in the analysis including sleeping pills (including antihistamine), tranquillisers, antipsychotics, antidepressants, hormones and mental health-related symptom relievers (i.e. beta-blockers, proton pump inhibitors, etc.). Additionally, as the strength and the form of medication was not collected in the survey, the weighted average cost of all strengths and forms for each medication obtained from 2013–2014 Pharmaceutical Benefits Scheme (PBS) item reports was assigned as the monthly unit cost (Department of Human Services, 2015). Note a co-payment (i.e. out-of-pocket cost) is generally required for prescribed medication in Australia and the amount varies by the type of health card held, the total cost of medication and whether the annual safety-net limit has been reached by individuals within a calendar year. According to the PBS in 2013–2014, for people with a general health card (i.e. a Medicare card), the maximum co-payment for each drug in each prescription was AUD36.90 and the annual safety net was AUD1421.20. For concession card holders, the maximum co-payment for each drug in each prescription was AUD6 and the annual safety net was AUD360 (Australian Government Department of Health, 2015). Since the health card status and the number of prescriptions were not collected in the survey, two assumptions were made to estimate the medication costs: (1) each prescription covered 1 month and (2) people who reported receiving welfare benefits were holding concession cards.
The visits to different health professionals for mental health problems during the past 12 months were collected and costed in the analysis by multiplying the number of visits by a unit cost. Consultations were reported as being funded by three possible sources. For consultations reported as being reimbursed by Medicare (Government-funded universal public insurance scheme), the unit cost was obtained from the Medicare Benefits Schedule (Australian Government Department of Health, 2014). The rebate of each consultation was determined by type of healthcare professional and length of contact. For health professionals without an exact item in the Medicare schedule, the weighted average of all the allied health visits reimbursed by Medicare was adopted as a proxy. When private health insurance was reported as the funding source, unit costs were obtained from The Private Health Insurance Administration Council (2015). Any cost reported as self-funded (i.e. out-of-pocket) was included within the individuals’ perspective.
Productivity costs
The human capital method was adopted in the current analysis to estimate the productivity loss, based on the self-reported total lost working days in the preceding 12 months attributed to HPD (van den Hout, 2010). For respondents who reported their status as being employed, a daily wage adjusted by age and gender, expressed in 2013–2014 AUD, was applied to estimate the loss associated with HPD (ABS, 2014). For people younger than 65 years old who reported their status as being unemployed or not in the labour force, productivity loss was estimated following methods used by Neil et al. (2013) and Tarricone (2006). This method assumed that an individual with HPD should expect the same level of employment at similar wage rates as the general population. The cost of productivity loss was based on differences in labour participation and employment rates between the general population and the population with HPD in Australia. Since the recommended annual leave in Australia is 4 weeks, 48 working weeks were used as the annual working weeks (Fair Work Ombudsman, 2016). The following formula was used to estimate the productivity loss in people not employed:
Productivity loss of unemployed and not in labour force HPD population = daily adjusted wage rate*5*48*number unemployed and not in labour force *(proportion employed in general population − proportion employed in HPD population) / (proportion of general population unemployed + proportion of general population not in labour force)
Using conventional productivity costs methodology, the average daily wage was used (which includes a tax component).
Transfer payment/welfare benefits
Transfer payments, such as welfare benefits, refer to the flow of money from government to individuals that does not arise from the production of resources (Drummond et al., 2005). As the government perspective was also adopted in the analysis, this financial flow was included.
In the 2007 survey, respondents were asked whether a government pension or allowance was a source of income without further specification. Hence, the average of the welfare benefits that were most likely to be claimed by the people with mental illness was adopted (with age used as the indicator for the amount of benefit received). Survey participants with a HPD, who were below 22 years of age and reporting as claimants of welfare benefits, were assigned a fortnightly Youth Allowance of AUD444. Those of working age between 22 and 65 were assigned the average of a NewStart Allowance, Disability Support Pension and Sickness Allowance of AUD588.84 fortnightly. People with HPD, who were over retirement age (65+), were assigned no welfare payments as the planned nature of retirement was unknown and this is unlikely to change as a consequence of HPD (e.g. people are moved to an old age pension).
Income tax forgone
From the government’s perspective, forgone income tax associated with HPD was estimated based on the lost productivity of only the respondents who were unemployed or not in the labour force, as the productivity loss of the employed population with HPD was borne by the employer. The individual income tax rates were sourced from the Australian Taxation Office (2015) and were applied to the average daily wage rates used in the productivity costs estimation.
Data analysis
All analyses were conducted in Stata SE version 13.1 (College Station, Texas, USA). Since the survey was conducted with complex sample designs and weighting procedures, both person weight and replicate weights were applied to determine unbiased results and more precise variance for the total in-scope population (ABS, 2008d). Given this, the jackknife resampling technique for unequal probability of selection was used to estimate standard errors and perform hypothesis tests (ABS, 2009b). This technique was applied for both population and subgroup level. The jackknife procedures were applied to the data since they were recommended by ABS (2009b).
The descriptive analyses undertaken included the mean and total costs of each healthcare resource utilised as well as the mean and total cost incurred from multiple perspectives as listed in Table 2. We conducted independent analysis to assess the impacts of comorbidities by grouping the HPD population into seven mutually exclusive diagnostic groups, namely, (1) Depression only (D), (2) Anxiety-related disorders only (ANX), (3) substance use disorders only (SUB), (4) Depression + anxiety-related disorder (D + ANX), (5) Depression + substance use disorder (D + SUB), (6) Anxiety-related disorder + substance use disorder (ANX + SUB), and (7) Depression + Anxiety-related disorder + substance use disorder (D + ANX + SUB). Proportion data (i.e. the proportion of the total HPD population who reported the use of healthcare, being employed, etc.) were reported with 95% confidence interval and costs data as mean and standard deviation. The parametric test (adjusted Wald test) was applied to detect the statistically significant differences across diagnostic subgroups (described above) for the weighted proportion and cost data (Tu and Zhou, 1999). If there were statistically significant differences across these subgroups, post-hoc pairwise comparisons were conducted to examine whether there was statistically significant differences between specific diagnostic groups.
Results
Diagnostic profile
Approximately 18.5% of Australians were diagnosed with HPD in 2007. Within the HPD population, the majority were diagnosed with a single diagnosis (80%). ANX accounted for more than 50% of the diagnoses in the HPD population, followed by SUB (17%), D + ANX (11%) and D (9%). Overall, men accounted for less than half (43%) of the HPD population. This gender disparity was reversed for the other mental health diagnoses without SUB, as a comorbidity. Additionally, the mean age of people diagnosed with SUB alone or in combination with SUB was significantly lower in comparison with other diagnoses.
Health service utilisation
Table 3 summarises the utilisation rate of mental health-related resource use for the HPD population by type of resource and diagnostic group. Overall, 39% of the HPD population in Australia reported the use of mental health-related healthcare resources. There were statistically significantly higher proportions of people diagnosed with D + ANX with or without SUB who sought any treatment (81% and 70%, respectively) than for those diagnosed with any single mental health diagnosis (D or ANX or SUB) (p < 0.0000). There were also significant differences in the proportions seeking treatment across the groups with a single mental health diagnosis, with SUB lowest (13%) followed by ANX (36%) and D (53%). However, no significant difference of these proportions was found between people with SUB in combination with D or ANX and those who were diagnosed with a single mental health diagnosis. The health funding source for 76% of people reporting use of healthcare resources was the public sector (i.e. Medicare or admitted as public patients). Hospitalisation was the least utilised resource, with less than 2% of respondents with HPD reporting being admitted to hospital in the preceding 12 months due to their mental health.
Proportion of HPD population reporting the use of different type of healthcare resources for their mental health in the 2007 NSMHWB.
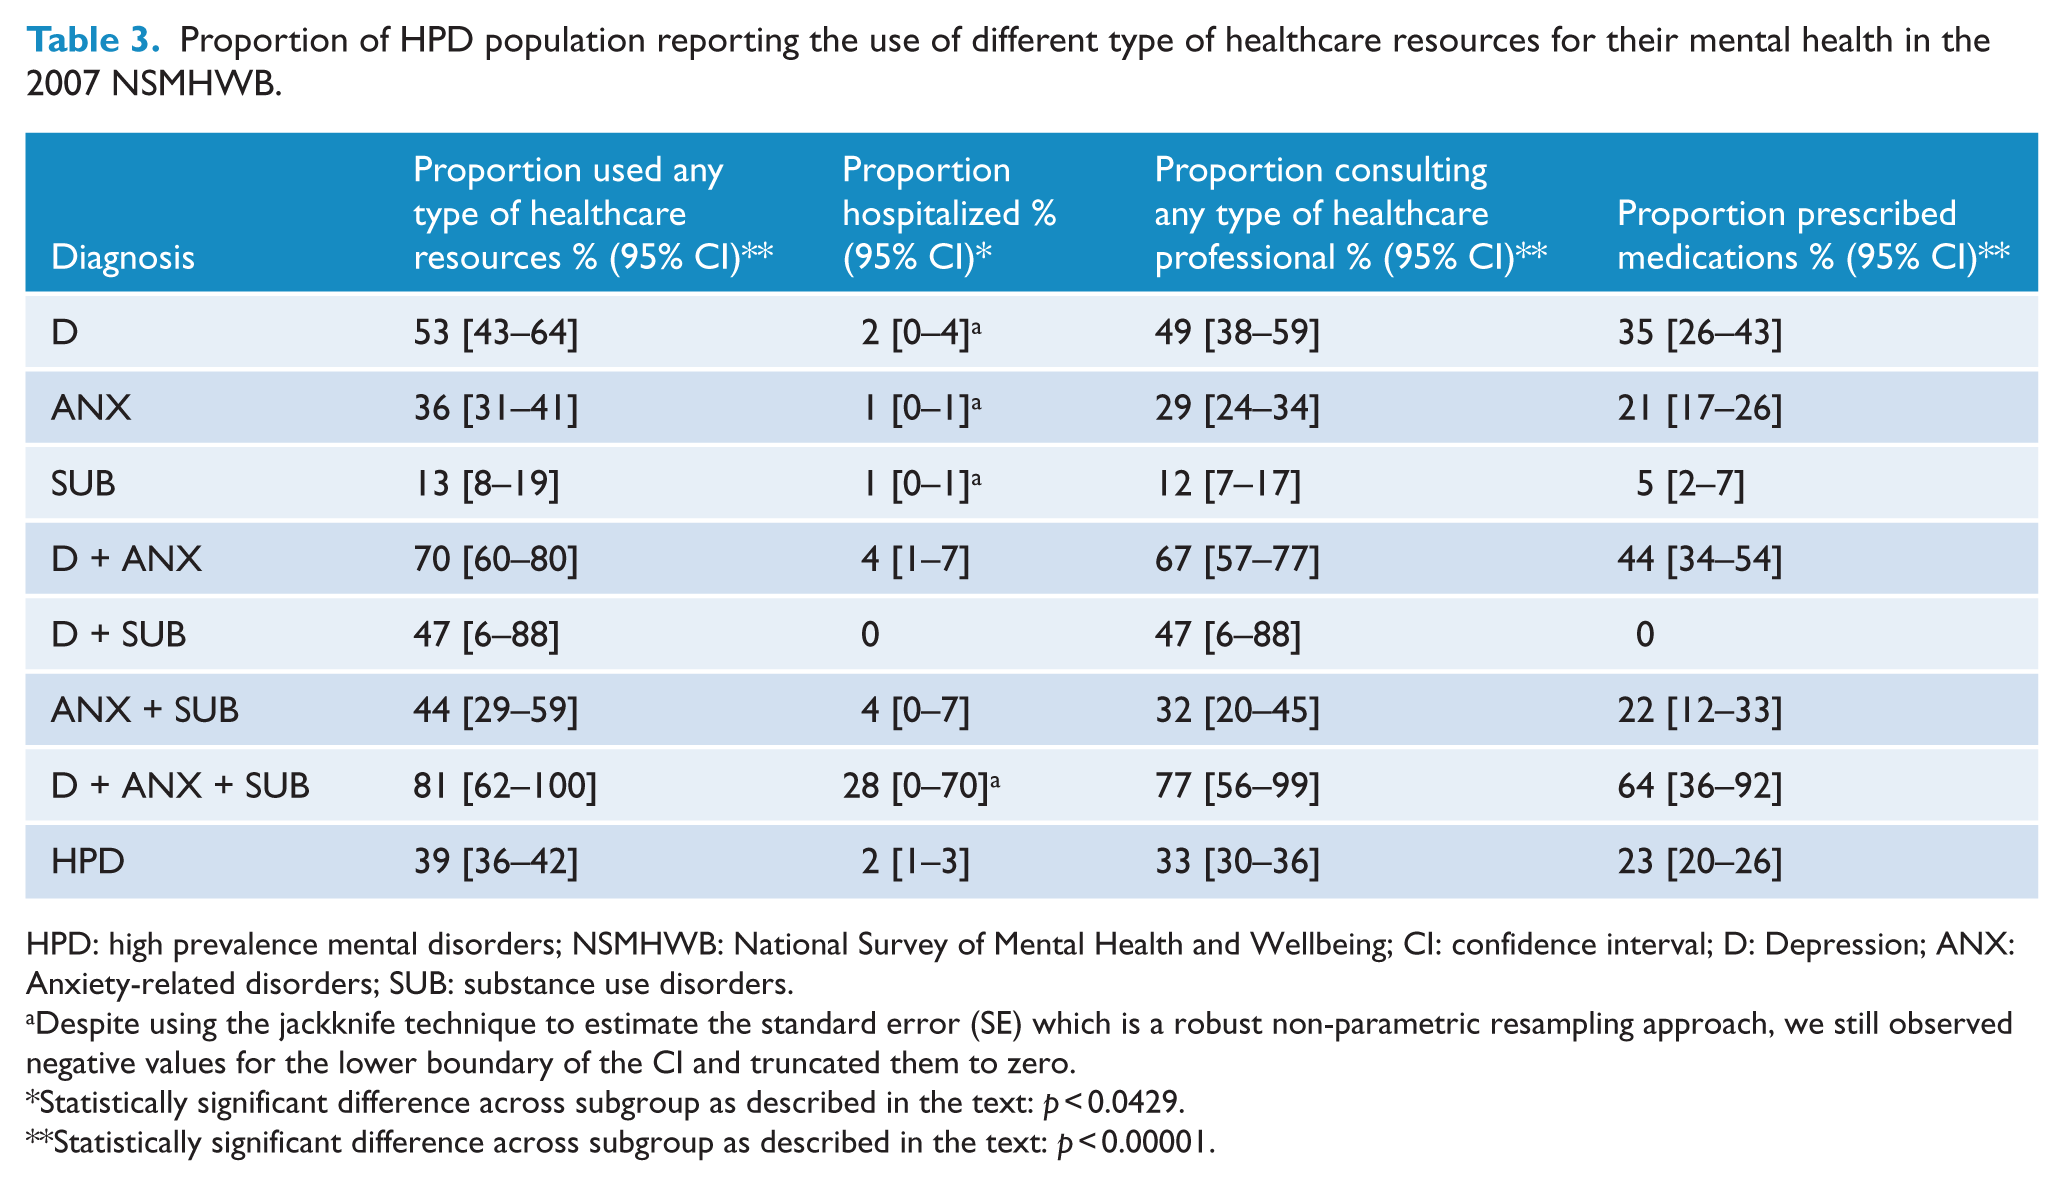
HPD: high prevalence mental disorders; NSMHWB: National Survey of Mental Health and Wellbeing; CI: confidence interval; D: Depression; ANX: Anxiety-related disorders; SUB: substance use disorders.
Despite using the jackknife technique to estimate the standard error (SE) which is a robust non-parametric resampling approach, we still observed negative values for the lower boundary of the CI and truncated them to zero.
Statistically significant difference across subgroup as described in the text: p < 0.0429.
Statistically significant difference across subgroup as described in the text: p < 0.00001.
A larger proportion of people in the D + ANX + SUB subgroup reported being hospitalised (28%) compared to the remaining diagnostic subgroups; however, this was not statistically significant. Only people with D + ANX had statistically significantly higher proportion of hospitalisation compared to those diagnosed with the single diagnoses of ANX or SUB. Consultation services were the most frequently utilised healthcare services among all, with more than 33% of the HPD population reporting ever receiving a consultation from a healthcare professional for mental health problems, and 82% reporting that these were funded exclusively by the public sector. People with D + ANX with or without SUB reported significantly higher use of consultation services (67% and 77% respectively) compared to the remaining diagnostic subgroups. There were statistically significant differences in the proportion utilising consultations across single diagnostic subgroups with SUB having the lowest rate (12%), followed by ANX (29%) and D with the highest rate at 49%. Nearly 23% of people with HPD reported the use of medication relevant to their mental health. People with two or more mental health disorders had significantly higher use of mental health medications compared to those with single diagnoses (except for those with D + SUB). Citalopram was the most frequently prescribed medication (17%), followed by venlafaxine (15.65%), sertraline (14.43%) and temazepam (10.51%).
Table 4 presents the average cost by healthcare service, perspective and diagnostic subgroup for people with HPD who reported the use of any healthcare resources for their mental health in the past 12 months. The average annual treatment costs of people with HPD was estimated at AUD845 from the health sector perspective. People diagnosed with D + ANX + SUB incurred the highest average annual mental health-related treatment costs from the Health Sector perspective which was significantly greater than for people with ANX (F = 4.79; p < 0.0327) or SUB (F = 4.51; p < 0.038) but not D (F = 3.61; p < 0.0622). No statistically significant differences in average costs were found across single diagnostic subgroups. The key findings from this table show that from both the public and the private perspective, people with three diagnoses have the highest cost. In contrast, from the individual’s perspective, the average total out-of-pocket spending was similar among all diagnostic subgroups.
Average cost per person of HPD population reporting the use of healthcare resources for their mental health in the 2007 NSMHWB (2013–2014 AUD (Mean [SD]).
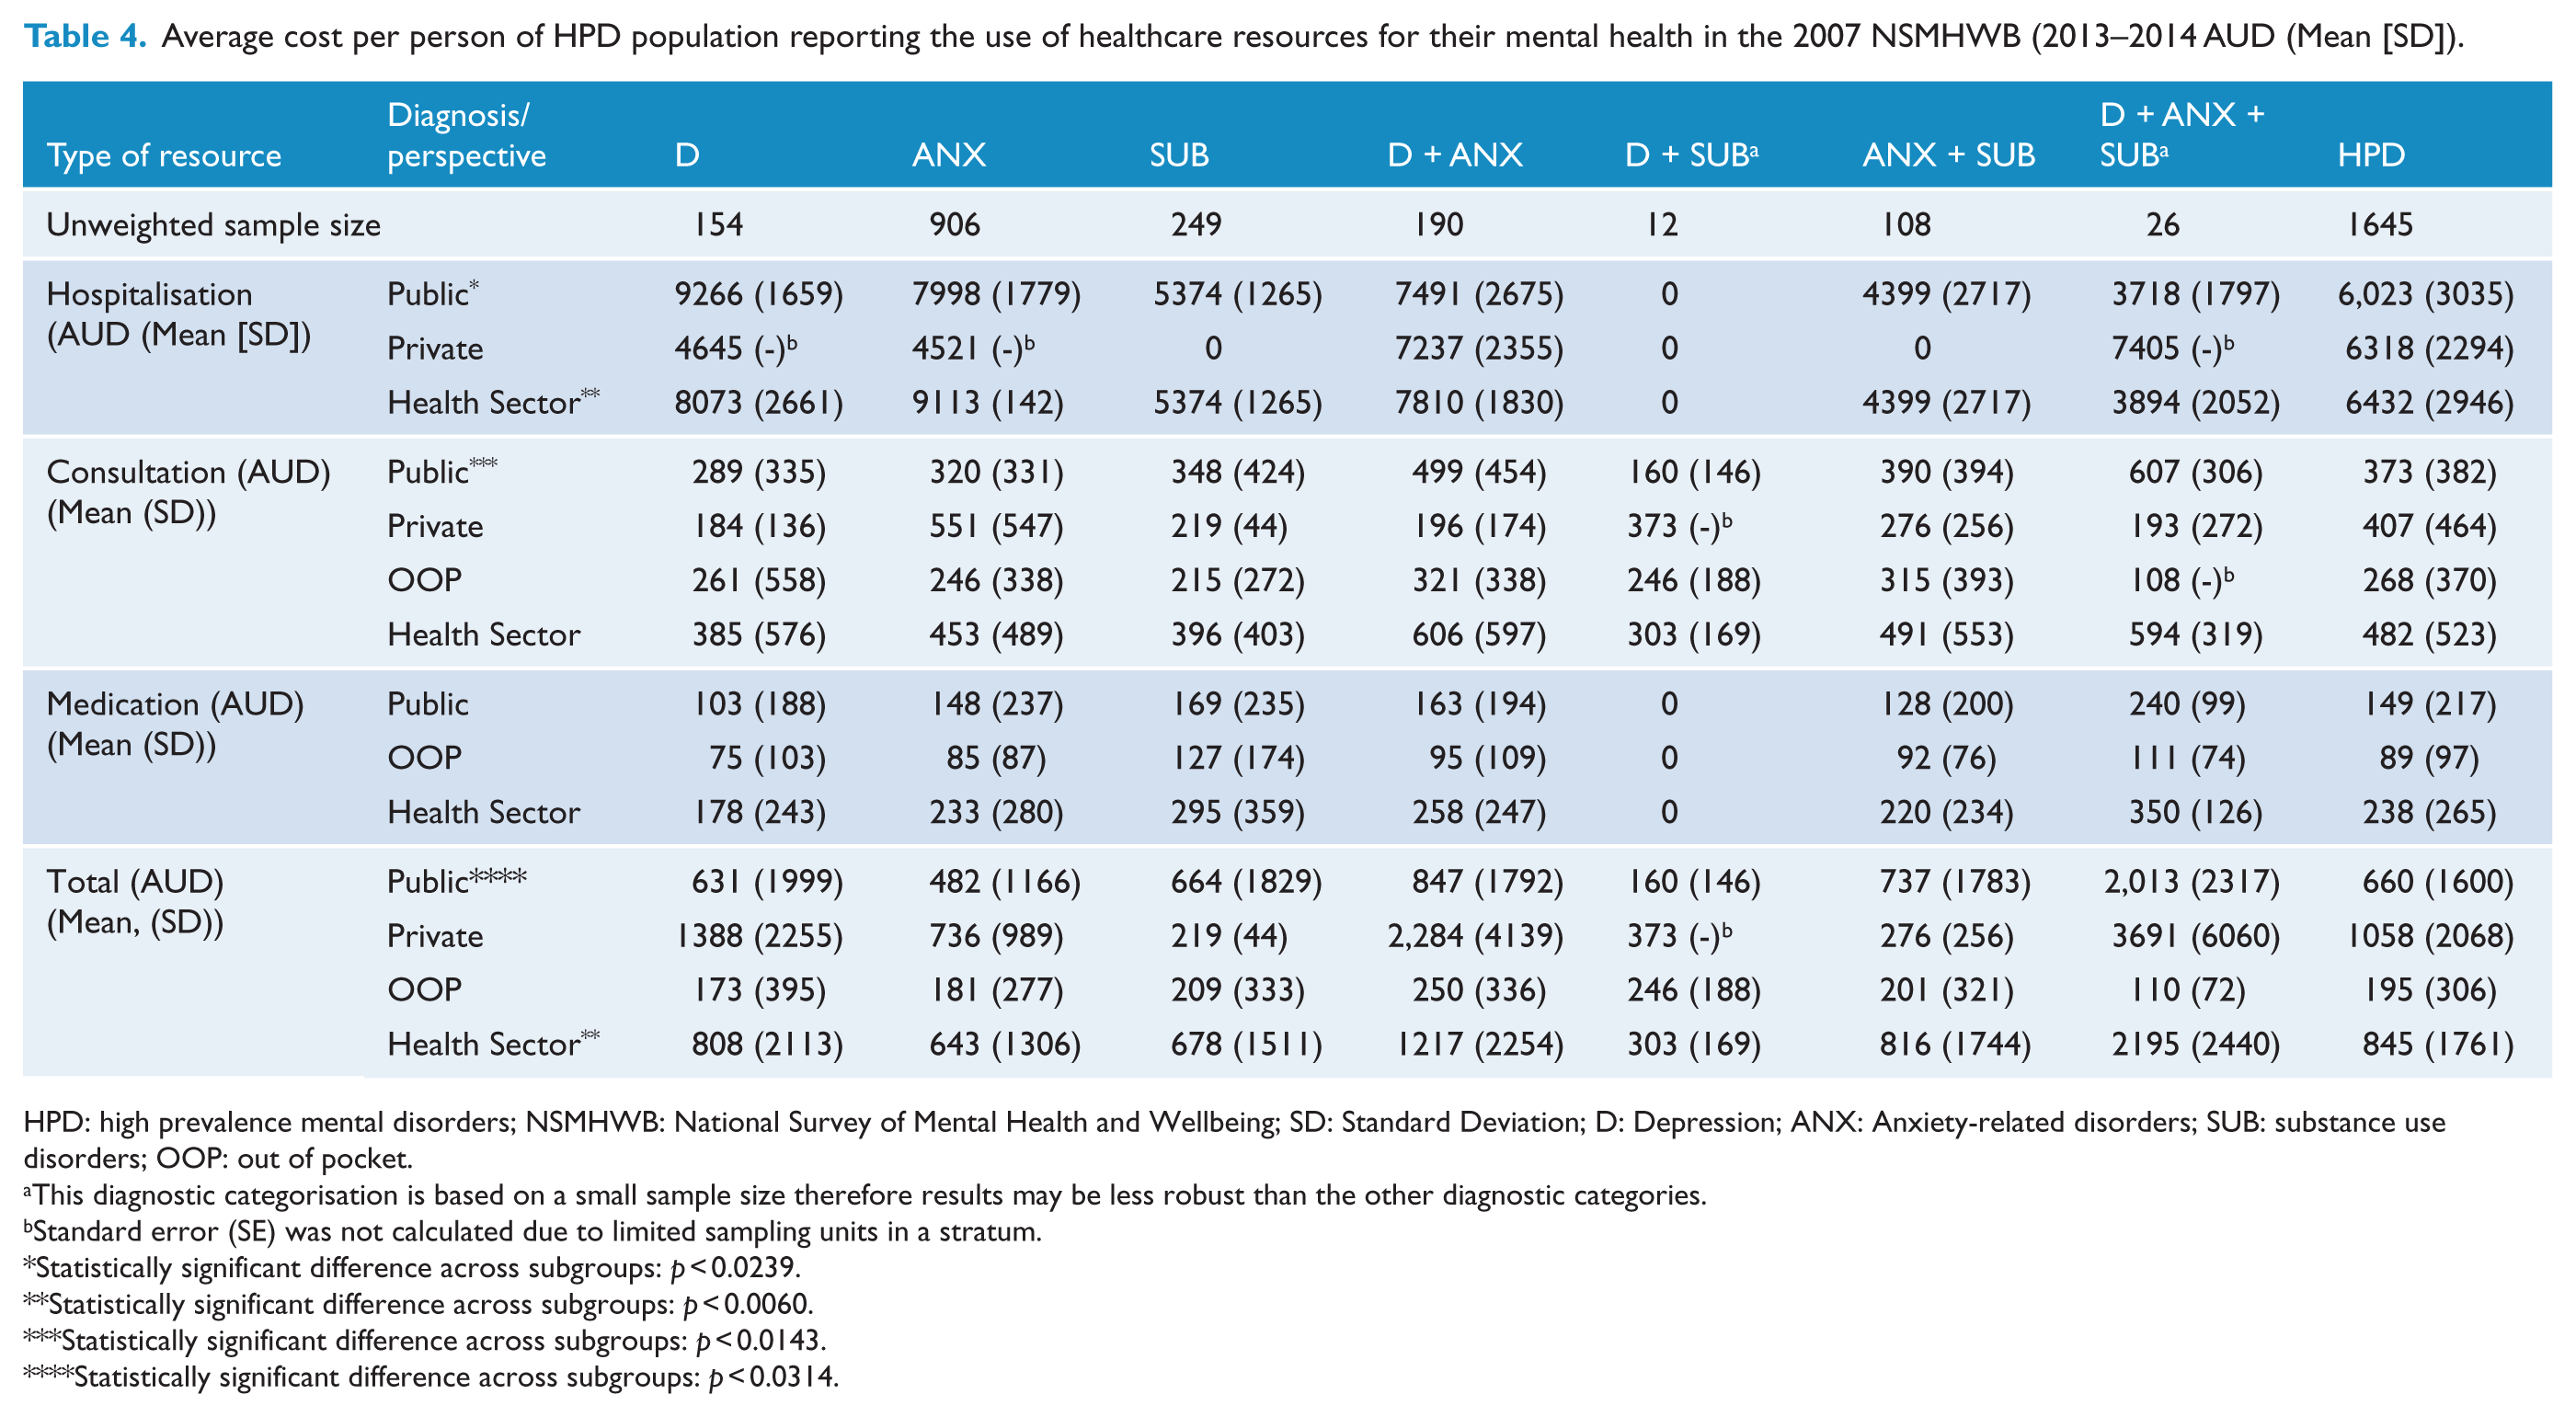
HPD: high prevalence mental disorders; NSMHWB: National Survey of Mental Health and Wellbeing; SD: Standard Deviation; D: Depression; ANX: Anxiety-related disorders; SUB: substance use disorders; OOP: out of pocket.
This diagnostic categorisation is based on a small sample size therefore results may be less robust than the other diagnostic categories.
Standard error (SE) was not calculated due to limited sampling units in a stratum.
Statistically significant difference across subgroups: p < 0.0239.
Statistically significant difference across subgroups: p < 0.0060.
Statistically significant difference across subgroups: p < 0.0143.
Statistically significant difference across subgroups: p < 0.0314.
Table 5 presents the total mental health–related treatment cost for the population diagnosed with HPD in Australia by perspective (health sector, public, private and individuals’ out of pocket) and diagnosis group. Figure 1 shows the proportion of the total mental health treatment costs incurred by each diagnostic group. From the health sector’s perspective, total annual healthcare costs of people with HPD were estimated at AUD974m, with nearly 72% of these costs coming from the public sector, followed by individuals and private sector at 17% and 11%, respectively. People with ANX and D + ANX incurred the highest total costs among all diagnostic subgroups, comprising 39% and 29% of total costs, respectively. The lowest total cost of all the diagnostic groups was D + SUB comprising 0.4% of the total cost. Similarly, from the public and private perspective, people with ANX and D + ANX accumulated the majority of the total costs, and D + SUB remained as the group with the lowest costs among all diagnostic subgroups. From the individual’s perspective, medications accounted for one-third of the overall out-of-pocket costs, with the balance attributed to consultation services. Statistically significant differences in total costs across subgroups were found regardless of perspective or cost categories. An exception was for hospitalisation costs which demonstrated non-statistically significant differences across subgroups irrespective of perspectives.
Total costs people with HPD reporting the use of healthcare resources for their mental health in the 2007 NSMHWB (2013–2014 AUDmillion) (95% CI).
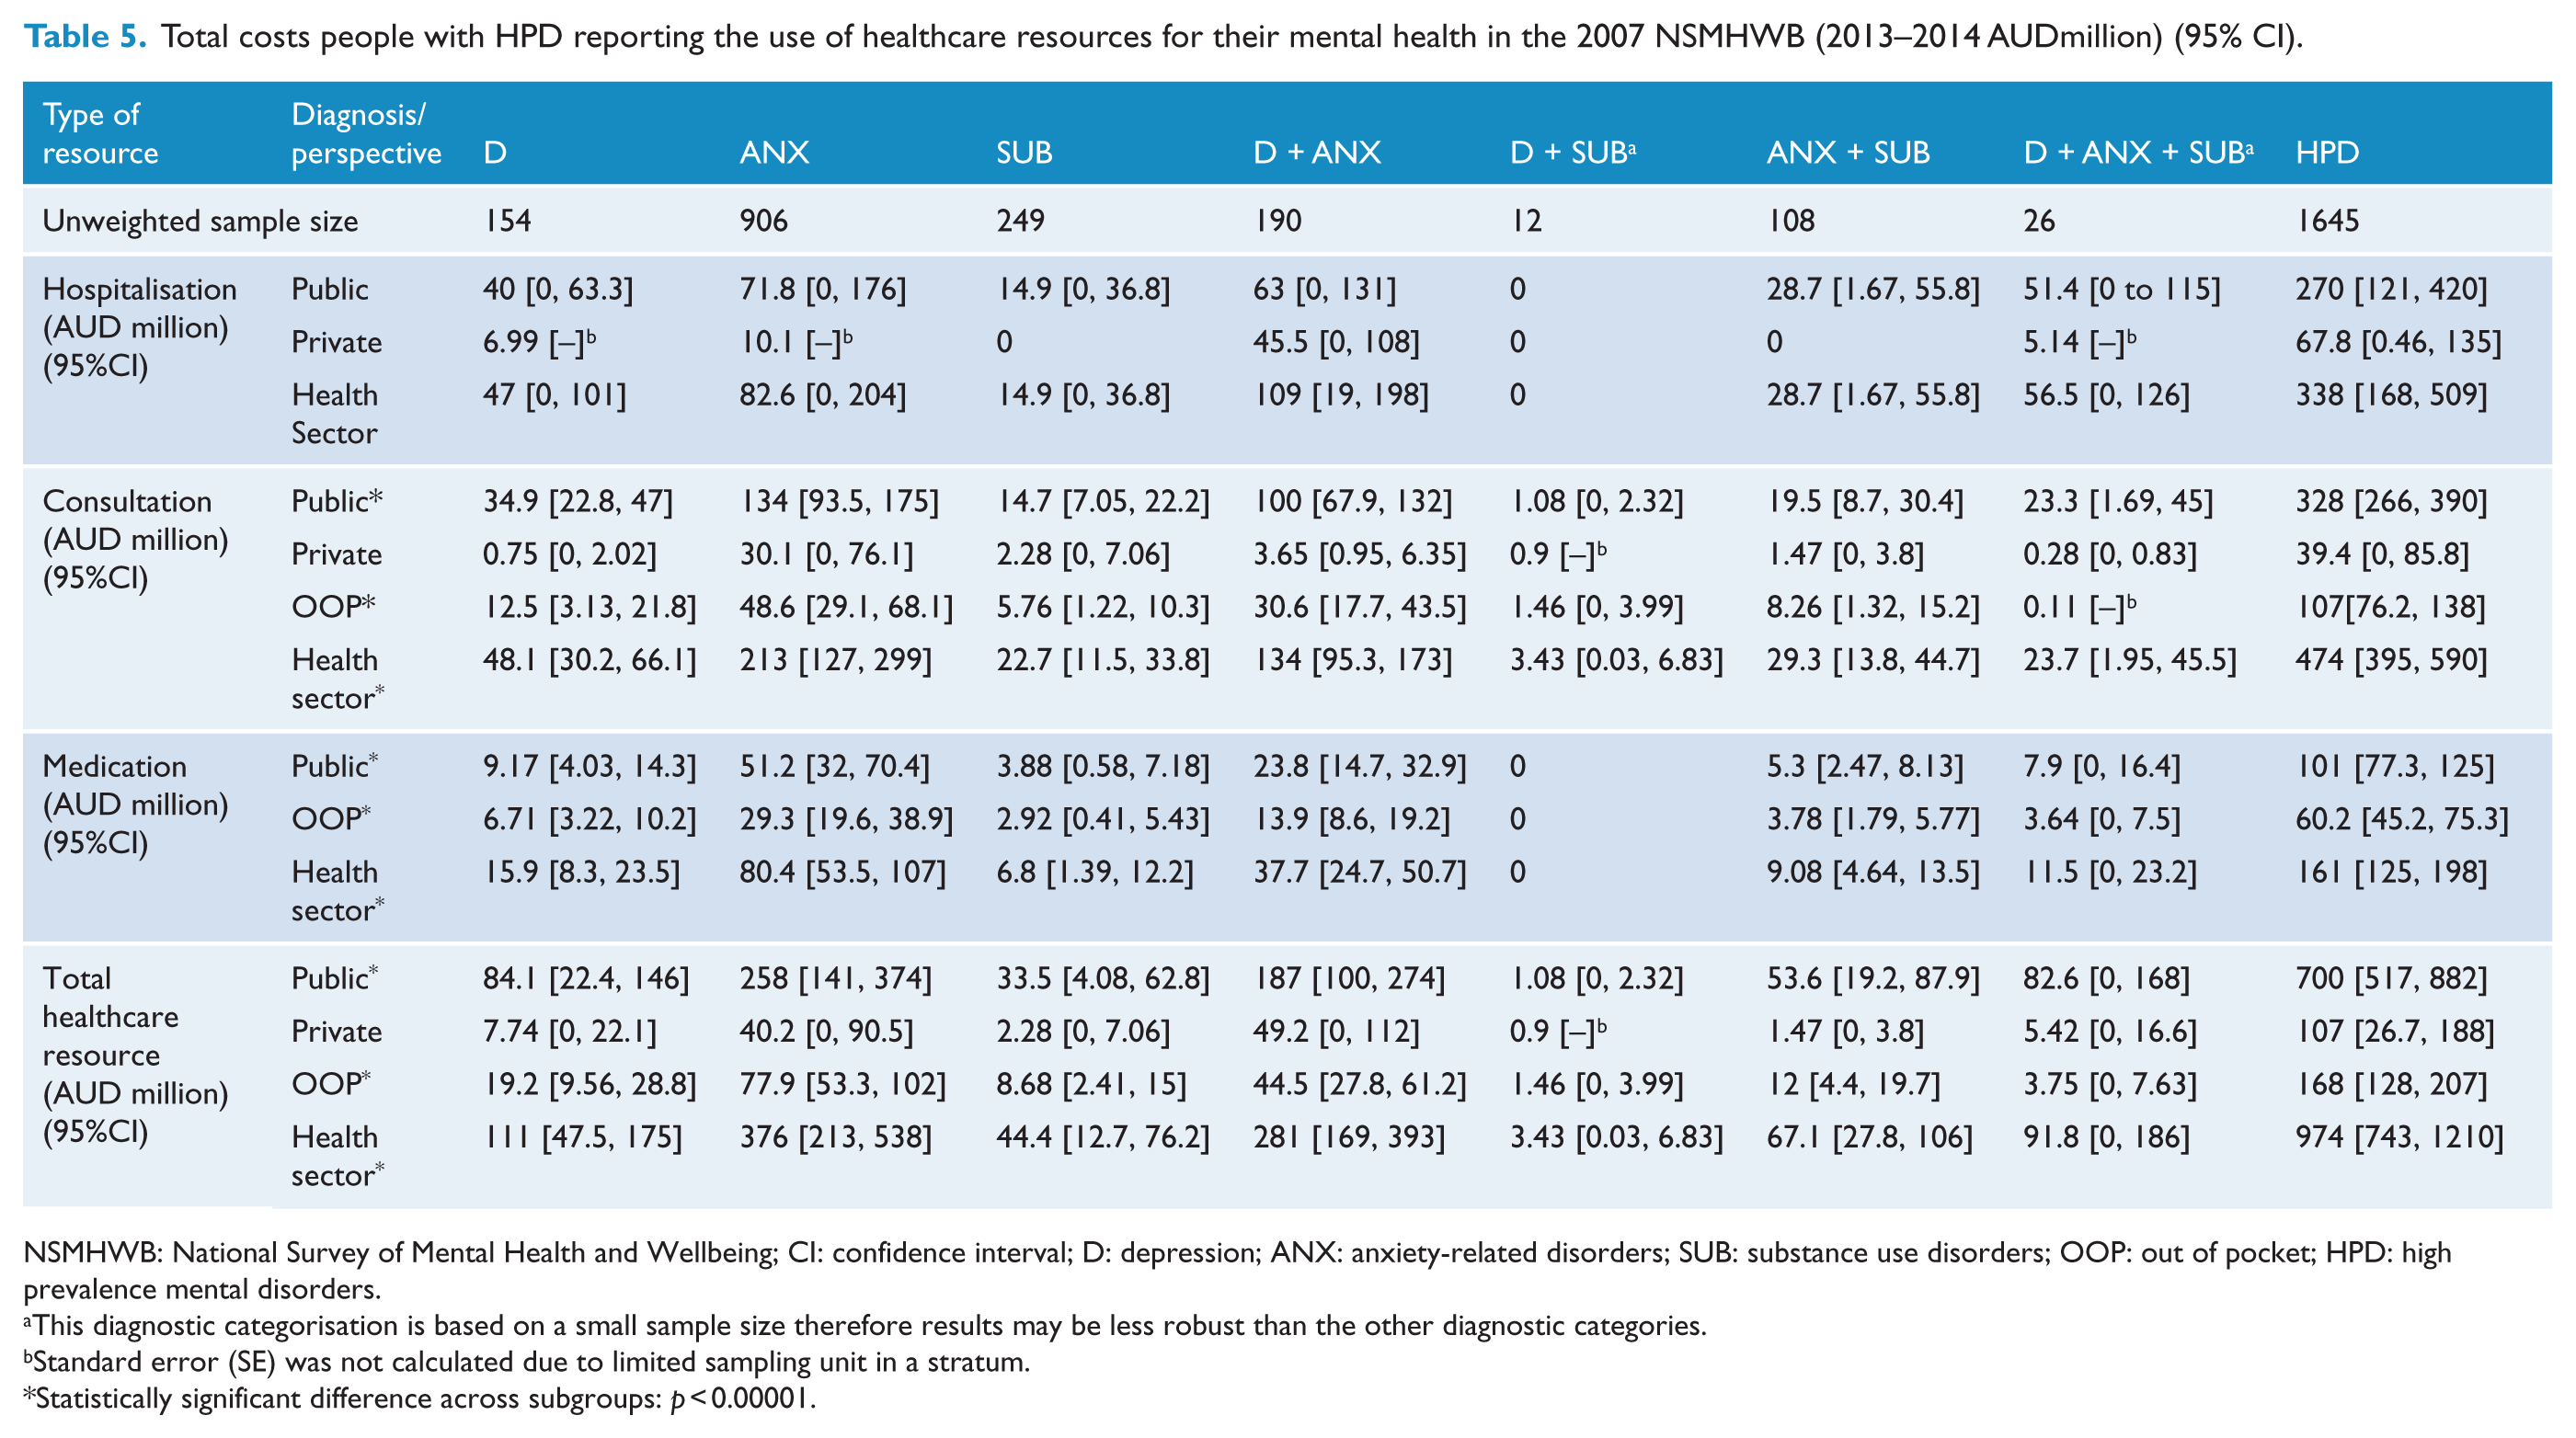
NSMHWB: National Survey of Mental Health and Wellbeing; CI: confidence interval; D: depression; ANX: anxiety-related disorders; SUB: substance use disorders; OOP: out of pocket; HPD: high prevalence mental disorders.
This diagnostic categorisation is based on a small sample size therefore results may be less robust than the other diagnostic categories.
Standard error (SE) was not calculated due to limited sampling unit in a stratum.
Statistically significant difference across subgroups: p < 0.00001.
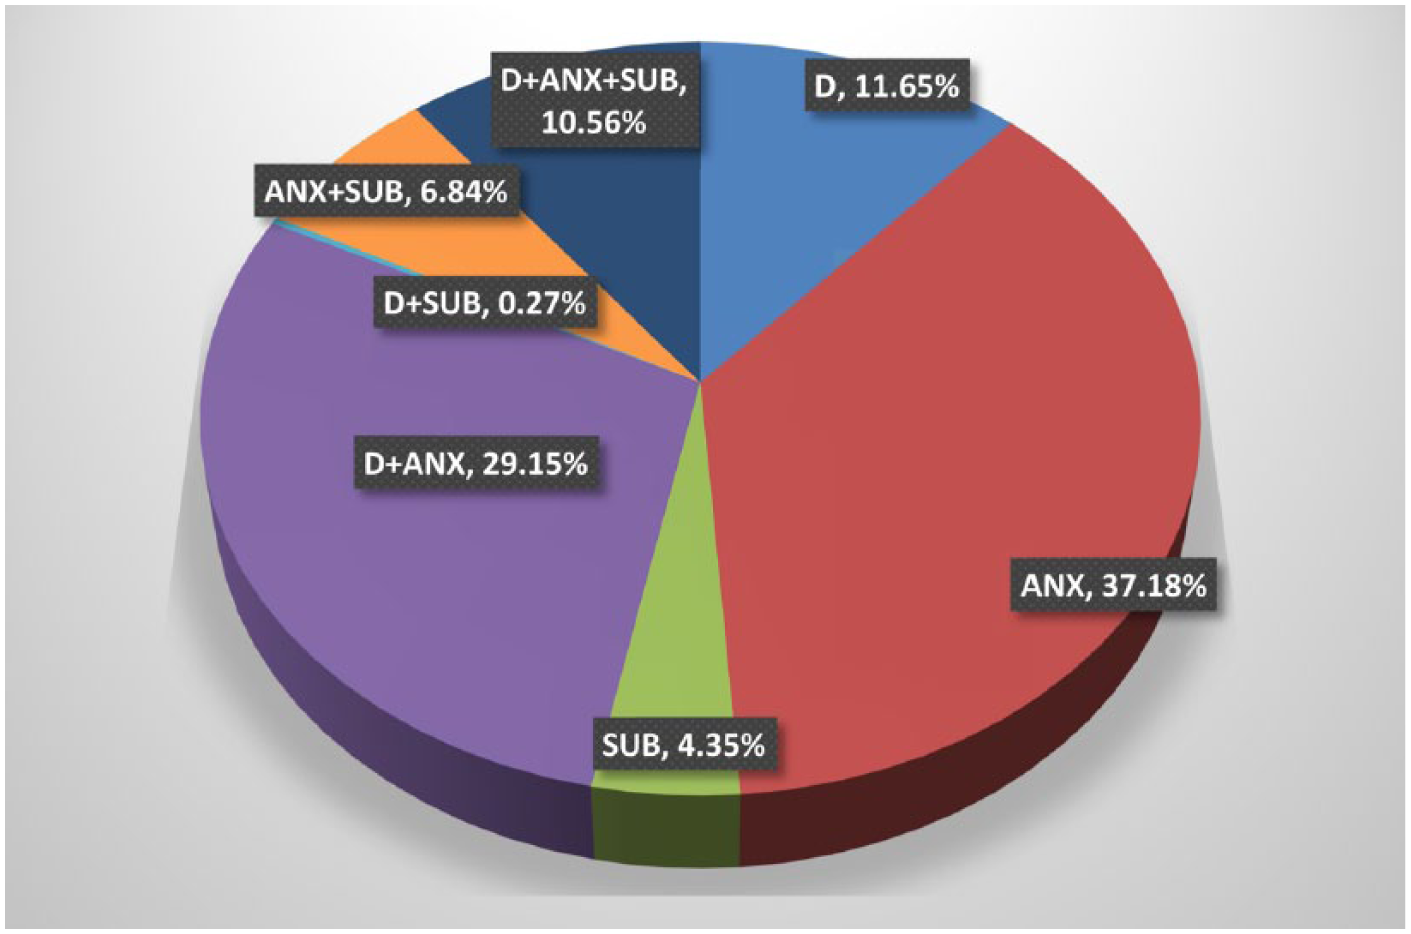
The proportion of total treatment costs incurred by the different diagnostic groupings.
Productivity loss
The total productivity loss attributed to HPD in Australia was estimated at AUD11.8b, with 60% made up of forgone earnings due to higher rates of unemployment in the HPD population compared to the general population and the remaining 40% attributed to lost productivity in the employed HPD population (Table 6).
Productivity loss associated with HPD in the 2007 NSMHWB in Australia 2013–2014 AUD.
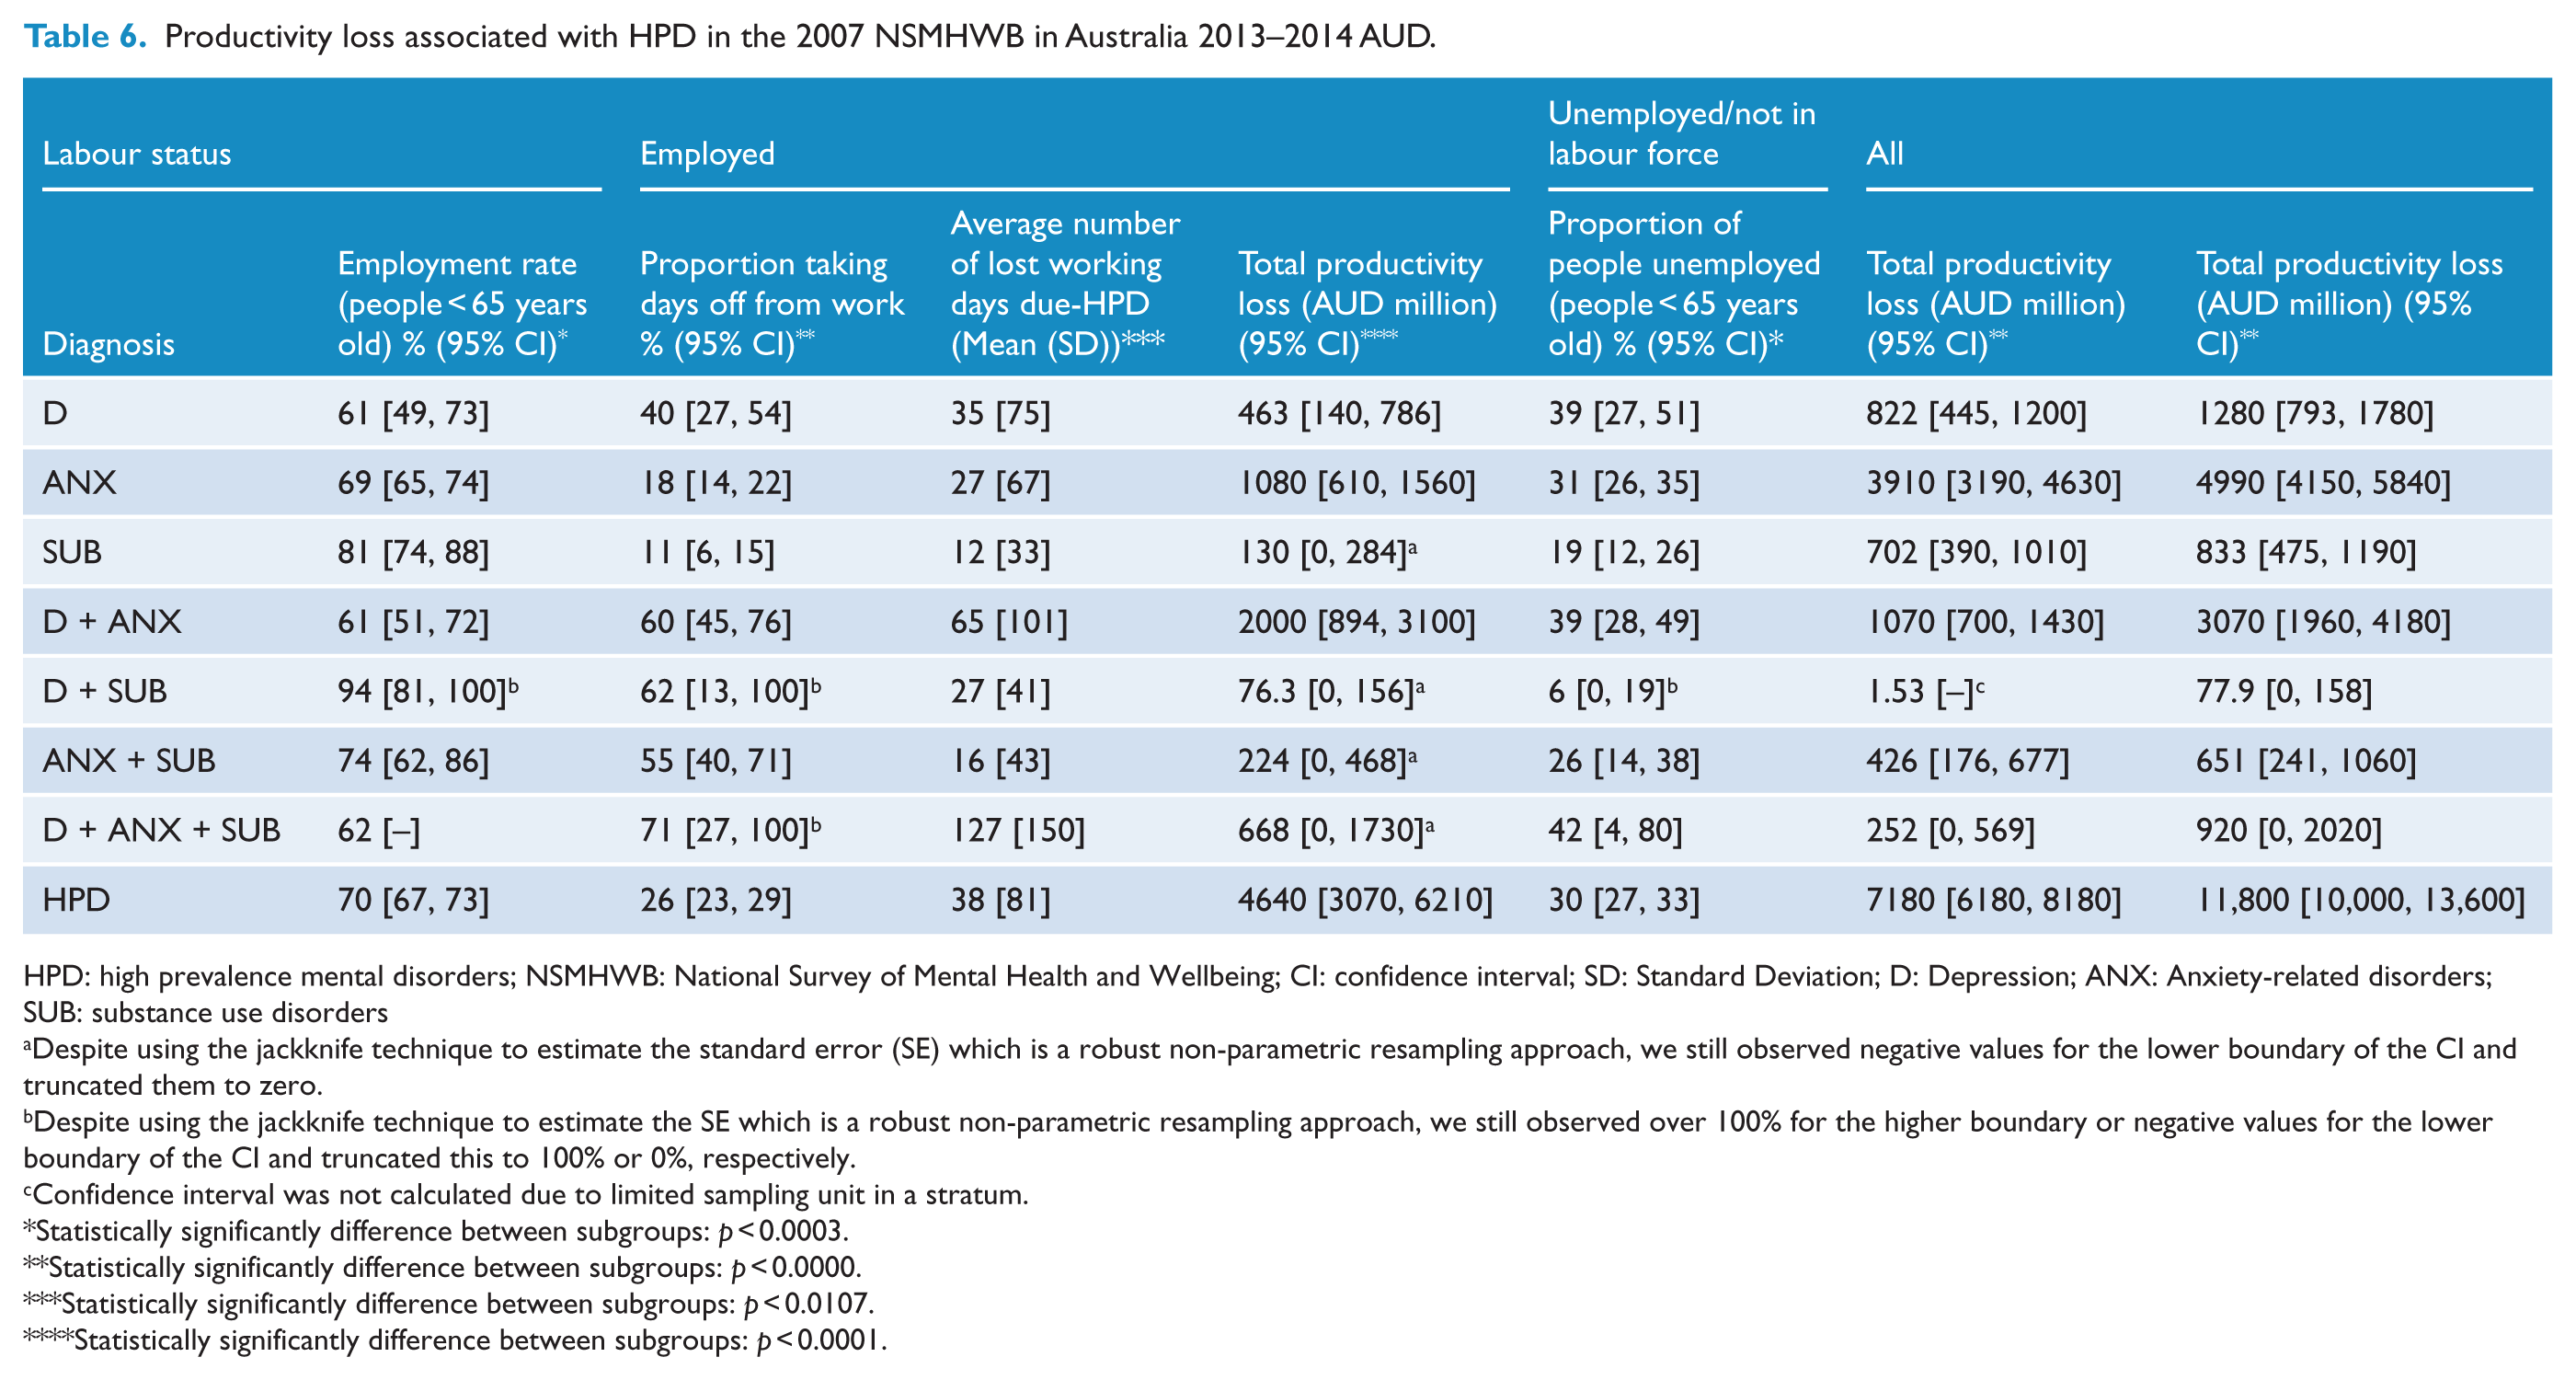
HPD: high prevalence mental disorders; NSMHWB: National Survey of Mental Health and Wellbeing; CI: confidence interval; SD: Standard Deviation; D: Depression; ANX: Anxiety-related disorders; SUB: substance use disorders
Despite using the jackknife technique to estimate the standard error (SE) which is a robust non-parametric resampling approach, we still observed negative values for the lower boundary of the CI and truncated them to zero.
Despite using the jackknife technique to estimate the SE which is a robust non-parametric resampling approach, we still observed over 100% for the higher boundary or negative values for the lower boundary of the CI and truncated this to 100% or 0%, respectively.
Confidence interval was not calculated due to limited sampling unit in a stratum.
Statistically significantly difference between subgroups: p < 0.0003.
Statistically significantly difference between subgroups: p < 0.0000.
Statistically significantly difference between subgroups: p < 0.0107.
Statistically significantly difference between subgroups: p < 0.0001.
Productivity loss in the employed HPD population
In all, 70% of the HPD population below the age of 65 indicated they were employed. The number of mental health diagnoses was negatively correlated with the proportion reporting being employed. Within the employed HPD population, nearly 26% reported loss of working days associated with HPD in the preceding 12 months. The results also suggested the number of comorbidities was positively correlated with the proportion of people who reported lost working days. For people with any single diagnosis, on average only 18% of people reported loss of working days associated with HPD. The proportion increased substantially to 58% and 71% for people with one and two comorbidities, respectively. Within the 26% of the employed HPD population who reported lost working days, the average annual loss was 38 days, costing AUD4.64b. The estimated productivity loss of people diagnosed with any two HPD was AUD2.3b, which accounted for the highest proportion of lost productivity costs (around 50%) in the employed population, followed by people with any single diagnosis and three diagnoses at 36% and 14%, respectively (Table 6).
Productivity loss in the unemployed HPD population
The estimated cost of lost productivity for those with a HPD who reported they were not in employment (estimated at 148,000 individuals) amounted to AUD7.18b to Australian society (Table 6). Productivity costs include both income accruing to the individual and taxes accruing to the government. Below we separately report income tax losses to governments as these may be of particular area of interest to governments. Of the total productivity loss attributed to the unemployed group, the population with a diagnosis of ANX accounted for the highest proportion of all diagnostic groups with nearly 55%, followed by D + ANX (14.9%), SUB (11%) and D (10%).
Transfer payment/welfare benefits
Approximately 31% of the HPD population under 65 years of age reported receiving welfare benefits from the government. Within the group of people who reported their status as not being employed (i.e. unemployed or not in the labour force), nearly 70% were claiming welfare benefits. Conversely, only 17% of the employed HPD population were claimants of welfare benefits. Across single diagnosis subgroups, a statistically significantly lower proportion of people with SUB received welfare benefits (19%) compared to those with D (42%; p < 0.0003) or ANX (31%; p < 0.0047) but not statistically significant between depression and anxiety subgroups (p < 0.0924). The proportion of people with D or ANX was not statistically significantly different to those with D + ANX or those with three comorbidities but was statistically significantly higher compared to those with D + SUB or ANX + SUB. It is worth noting that only 3% of people with D + SUB reported receiving welfare benefits, which was statistically significantly lower compared to the rest of the diagnostic groups. Further details are presented in Table 7.
Welfare benefits and tax forgone due-HPD in the 2007 NSMHWB.
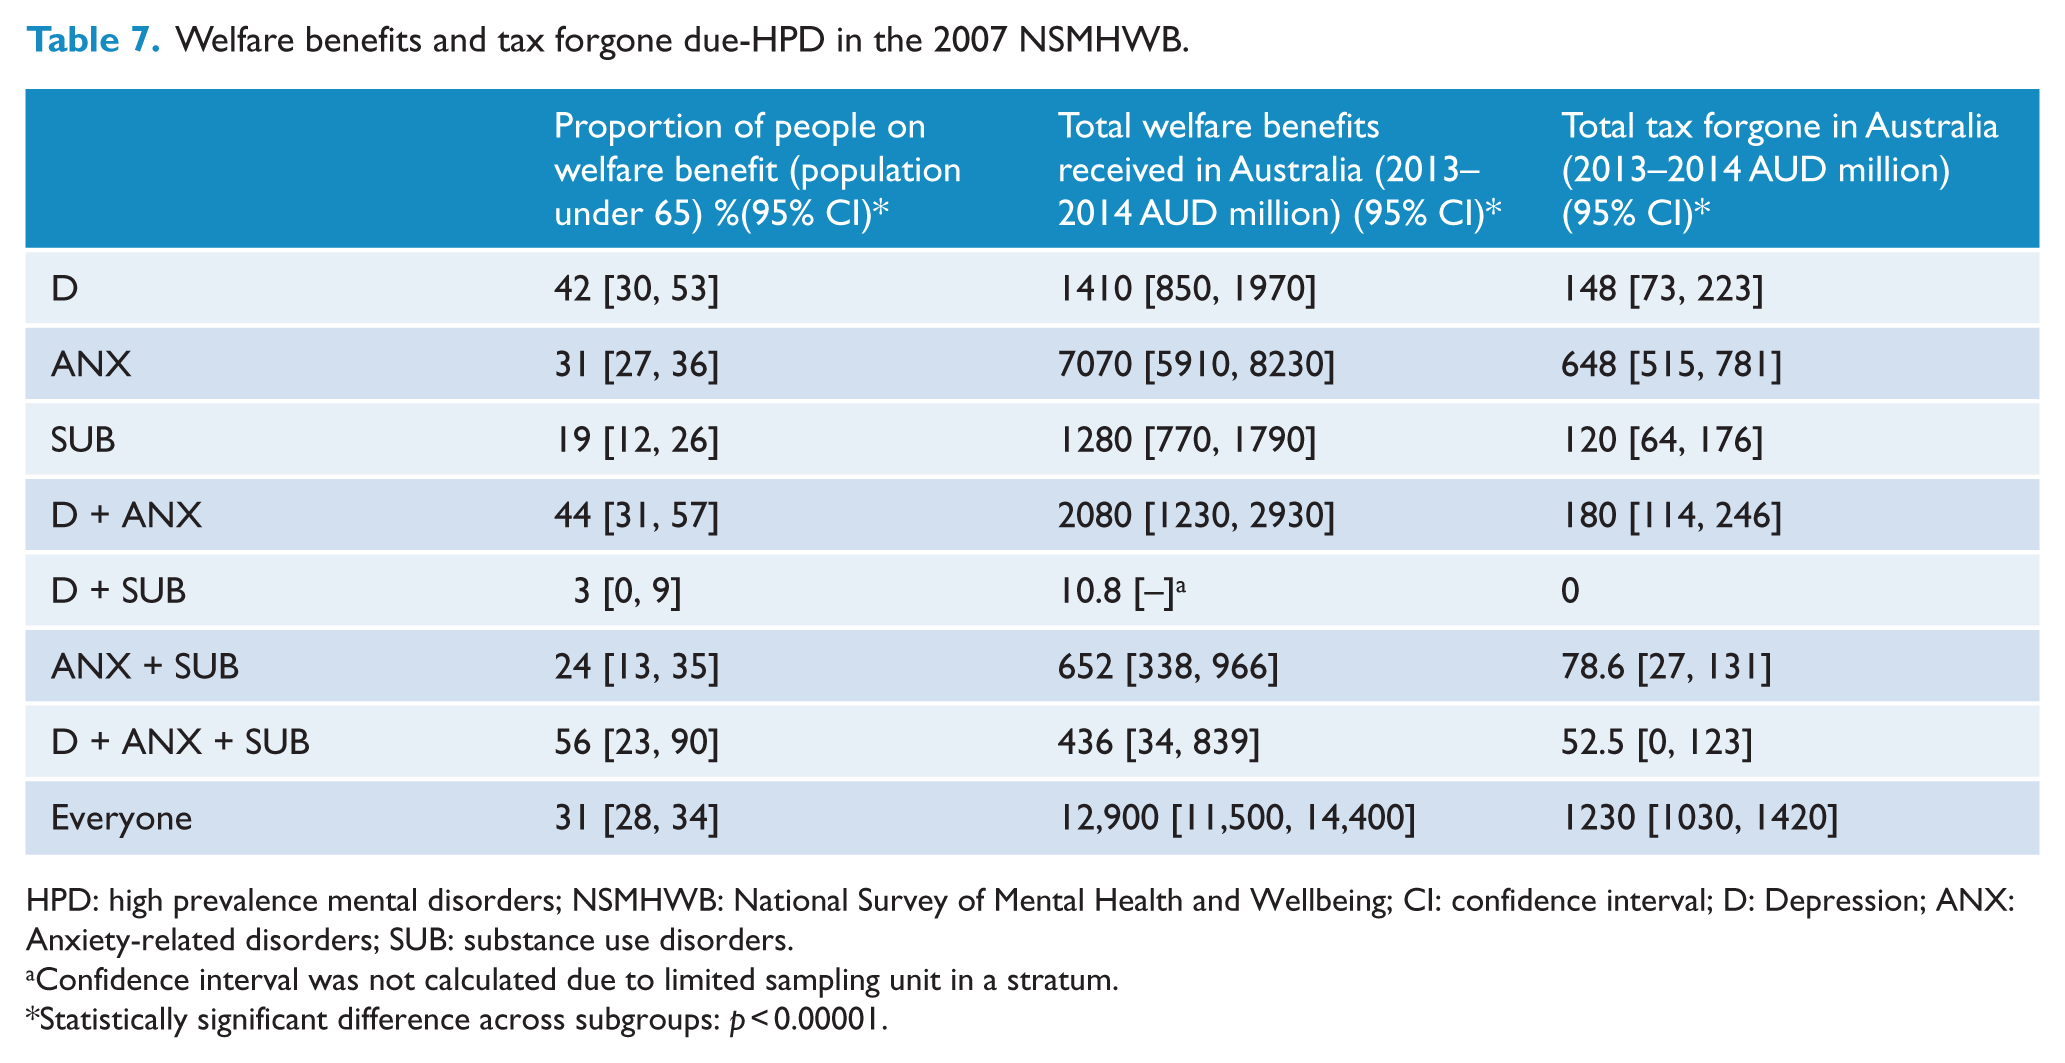
HPD: high prevalence mental disorders; NSMHWB: National Survey of Mental Health and Wellbeing; CI: confidence interval; D: Depression; ANX: Anxiety-related disorders; SUB: substance use disorders.
Confidence interval was not calculated due to limited sampling unit in a stratum.
Statistically significant difference across subgroups: p < 0.00001.
Income tax forgone
Overall, the estimated income tax loss associated with HPD was AUD1.23b annually. People with ANX contributed more than 50% of the total income tax loss compared to the remaining subgroups and this was statistically significant. People diagnosed with D + SUB incurred no income tax loss because the annual income of the unemployed individuals in the D + SUB subgroup was less than the taxable income (see Table 7 for further detail).
Discussion
This COI provides an in-depth analysis of the health resource use and economic impact of HPD to Australia through multiple payer perspectives using the most recent comprehensive community-based survey, the NSMHWB, conducted in 2007. Of the approximate 18% of Australians diagnosed with HPD in the preceding 12 months, nearly 39% reported the use of healthcare resources for their mental health, resulting in AUD974m of treatment costs to the health sector. The HPD population also accounted for AUD11.8b of annual productivity loss, AUD1.23b in forgone of income taxes and AUD12.9b of welfare benefits. The annual total cost to Australian society was estimated at AUD12.8b.
While the estimated total societal cost of HPD in this analysis was nearly three times greater than the AUD4.91b estimated cost of psychosis in Australia, the estimated average costs per person was much lower compared to people with psychosis (Neil et al., 2013). Considering the prevalence of psychosis is significantly lower than HPD (0.45% vs 18%) (Department of Health, 2011), psychosis has a greater economic impact on the individual than HPD.
The estimated 12-month HPD prevalence from our analysis was slightly lower than the value reported by the ABS and other published literature due to the differences in the diagnoses included (ABS, 2008e; Burgess et al., 2009; Slade et al., 2009; Sunderland et al., 2012). Only people with depression, anxiety-related disorder and substance use disorders were included in our analysis, whereas in the other analyses, additional low prevalence disorders such as bipolar disorder, mania and hypomania were also included. This resulted in a higher overall prevalence compared to our estimates. Furthermore, our use of the psychosis screener to exclude people with 12-month psychosis from our target sample further reduced the estimated HPD prevalence (ABS, 2008e; Burgess et al., 2009; Slade et al., 2009; Sunderland et al., 2012).
The estimates of healthcare resource utilisation in the current analysis were slightly higher than those published by ABS (39% vs 35%) (ABS, 2008a). The difference was mainly driven by the inclusion of medication use in this analysis as well as the exclusion of low prevalence disorders. In the previous analyses based on the 2007 NSMHWB, the resource utilisation rate only considered hospitalisations and consultations, but not medication (ABS, 2008e; Burgess et al., 2009; Slade et al., 2009). The rate of medication use in this study was 23% and the percentage of total health sector costs spent on medications was 12%, which is similar to other COI studies in depression (Luppa et al., 2007).
The presence of a positive correlation between the number of comorbidities and healthcare utilisation rates in the current analysis is consistent with the existing literature (Burgess et al., 2009; Mihalopoulos et al., 2005). Similarly to healthcare utilisation patterns, the average total cost of people with mental health comorbidities was significantly higher than people with a single diagnosis. The analysis also demonstrated the impact of HPD on time taken off work and employment status (ABS, 2012). The proportion of people who reported being unemployed was positively correlated with the number of diagnoses, and the overall proportion of the HPD population reporting being employed was statistically significantly different to the general population (70% vs 75%). This finding is echoed by Inder et al. (2012), which suggested that people with mental illness on average were 5%–7% less likely to be employed than individuals without mental illness based on the same data. However, data published by the Department of Health in 2013 reported an 18% difference in the proportions being employed between people with and without mental illnesses (The Department of Health, 2013). The difference between our estimates and the data reported by the Department of Health may be due to their use of self-report for mental health diagnoses as well as the inclusion of different mental health diagnoses. We only included people with HPD and excluded disorders with greater economic disease burden such as psychosis and bipolar disorder. It is unclear what types of mental illness were included in the analysis conducted by the Department of Health.
The current study estimated the total cost of lost productivity associated with the HPD population was AUD11.8b, which was significantly lower than AUD20b and AUD49b estimated respectively by the ABS (2009a) and Inder et al. (2012). This difference was likely due to the methodological differences in estimating lost productivity. In the current analysis, only reported absence from work and the potential loss of employment associated with HPD were defined as productivity loss and costed. While the method used to derive the cost of productivity loss in ABS (2009a) was not presented, the analysis by Inder et al. (2012) included not only absence from work and reduced employment as loss of productivity, but also the income difference between the general population and the population with mental disorders. This suggests that our results are a rather conservative estimate compared with Inder et al. (2012). Other factors including inflation, prevalence of the disorders, population growth, carers’ time, awareness of mental health disorders and the diagnoses included in the analysis were also likely to contribute to the differences between the estimates.
Finally, our results highlight the great economic burden associated with anxiety disorders. While depressive disorders have received considerable attention both in the scientific and popular media due to the high disease burden associated with such disorders, anxiety disorders tend to feature far less prominently. Our study has demonstrated that while disease burden for anxiety disorders may not be as high as depressive disorders, the economic burden of such disorders is considerable.
Strengths and limitations
This is the first study to our knowledge which has estimated the costs associated with HPD in Australia based on the 2007 NSMHWB. A strength of the survey method was the community-based sampling and diagnostic assessment ensuring accuracy of diagnoses classification. Additionally, this is the first study to report medication use from the 2007 survey. The economic burden from health sector and societal perspectives was able to be assessed due to the comprehensiveness of the data which covered not only the quantity of healthcare resources used but also the source of payment allowing costs borne by different sectors to be calculated. Most importantly, as a community-based national mental health survey with individual data available, it allowed us to estimate the costs using a ‘bottom up’ (i.e. micro-costing) approach, which does not have the limitations associated with macro-costing (i.e. top-down costing).
However, there were also several limitations in the analysis due to the data collection methods used in the survey. First, it must be highlighted that the resource use collected in the survey was based on self-report which is associated with recall bias. Future community-based studies should also consider the addition of administrative resource use databases such as Medicare and the PBS, which do not have the problem of recall bias. Second is the potential underestimation of hospitalisation costs for private admissions. As stated in the method section, due to the limited data on the reimbursement of hospitalisation costs from the private sector, public admission cost was used as a conservative proxy for the private admissions, which might lead to the underestimation of the private admission costs. Third, in our analysis, the HPD-associated unemployment was estimated by the difference of the employment rate of the general population (i.e. including people with and without mental disorders) and HPD population multiplied by the whole population. As the HPD population had a higher probability of comorbid physical restrictions, it is unclear whether the potential loss of employment was associated with the physical comorbidities or HPD. Hence, a conservative approach of using the employment rate of the general population rather than the mental disorder-free population to estimate the incremental loss was adopted.
Finally, while the 2007 NSMHWB is the most recent population-based survey of high prevalence disorders in Australia, it is important to note that this survey predated important mental healthcare reforms such as the better access initiative which provided publically subsidised community-based psychological care. Hence, the current results may be an underestimate of total costs or even an overestimate if there has been a substitution away from hospital care. An update of this survey is urgently required to answer such questions.
Conclusion
HPD places great economic burden on Australian society with an estimated total cost of AUD12.7b each year. In the current analysis, we only estimate the treatment cost and economic burden of the population with confirmed clinical diagnoses. However, if we further consider people who do not meet the full diagnostic criteria of such disorders, the economic burden would be even greater.
Footnotes
Acknowledgements
The authors would like to sincerely thank Jessica Bucholc for invaluable assistance in preparation of the manuscript for submission. C.M. was the senior economic evaluator of this study. She conceptualised and developed the study design in terms of the model framework, data sources and analytic techniques. She supervised Y.-C.L. in all aspects of the analyses. Y.-C.L. undertook all the empirical analyses and wrote the first draft of the current manuscript. M.L.C. and A.M. provided expert opinion in the method adopted in the analysis, assistance of write-up of the report as well to the analyses. M.M. and L.K.-D.L provided assistance with the statistical methods used in the analysis. All authors read and provided input into the earlier versions of the submitted manuscript. The authors would like to thank the Australian Bureau of Statistics for access to the 2007 National Survey of Mental Health and Wellbeing.
Declaration of conflicting interests
The author(s) declared no potential conflicts of interest with respect to the research, authorship and/or publication of this article.
Funding
The current study was funded by the Health Research Fund of Medibank Private. Medibank Private had no influence on the methods nor the presentation of results. C.M. was funded on a National Health and Medical Research Council (NHMRC) Early Career Research Grant (APP1035887) during the conduct of this study.