
Abstract
While the duration of youth major depressive disorder has been found to range from 2 to 520 weeks, the mean duration is typically 20 to 35 weeks varying with the sample under investigation [1,2]. Youth depression is a relapsing and remitting condition that will reoccur in over half of children and adolescents. In one study of children with MDD, 72% had a recurrence of depression in the following 5 years [3], while in another study of depressed adolescents the recurrence rate was 69% over a 7-year follow up period [4]. These findings suggest that youth depression is typically a long-term, recurrent issue for young people and their families.
Studies of the factors which affect the course of major depressive disorder (MDD) have produced inconsistent findings. The factors affecting the course of dysthymic disorder (DD) and minor depression (less than five depressive symptoms, for less than 1 year) in adolescents are even less well understood than those affecting MDD. A number of factors confound predictor studies, including the use of varying diagnostic criteria, the duration of follow up period, sampling differences, and assessment measures [5]. Variability in findings may reflect different criteria across studies, including defining a response to treatment, patient selection, differences in samples (e.g. gender, age), sample size, different assessment measures, spontaneous remission, placebo response, type of statistical analysis, lack of psychiatric control groups, co-morbidity, life events, and family history of psychiatric disorders [5,6].
Demographic variables which have been implicated in affecting the course of youth depressive disorders include female gender [2,7,8], lower SES [4,7], race [9], and age [10]. However, other studies have not replicated these findings [11].
Sanford et al. [10] reported that for adolescent MDD, a co-morbid anxiety disorder predicted persistence of MDD at 12 months follow up. Lewinsohn et al. [12] found that in a community sample of adolescents, a past history of an anxiety disorder was associated with a statistically significant odds ratio of 2.4 of having a depressive disorder in the future. In other studies, non-affective co-morbidity did not alter the duration of the major depressive episode [11,13]. In a British study of depressed youth attending Child and Adolescent Mental Health Clinics, predictors of outcome at 6 months were severity of baseline depression, obsessive–compulsive disorder, suicidal thinking and disappointing life events [14].
Overall, findings are inconsistent in relation to predictors such as demographic factors and co-morbid psychiatric diagnoses, but more consistent in relation to predictors such as severity of depression at baseline, adolescent suicidal behaviours/thoughts, and parental depression.
These inconsistent findings highlight the need for further studies into predictors of outcome of adolescent depression. The aim of this study was to explore demographic and clinical variables which might predict categorical depressive disorders or dimensional depressive symptoms in adolescents at six-month follow up after the treatment for depression.
Method
Subjects
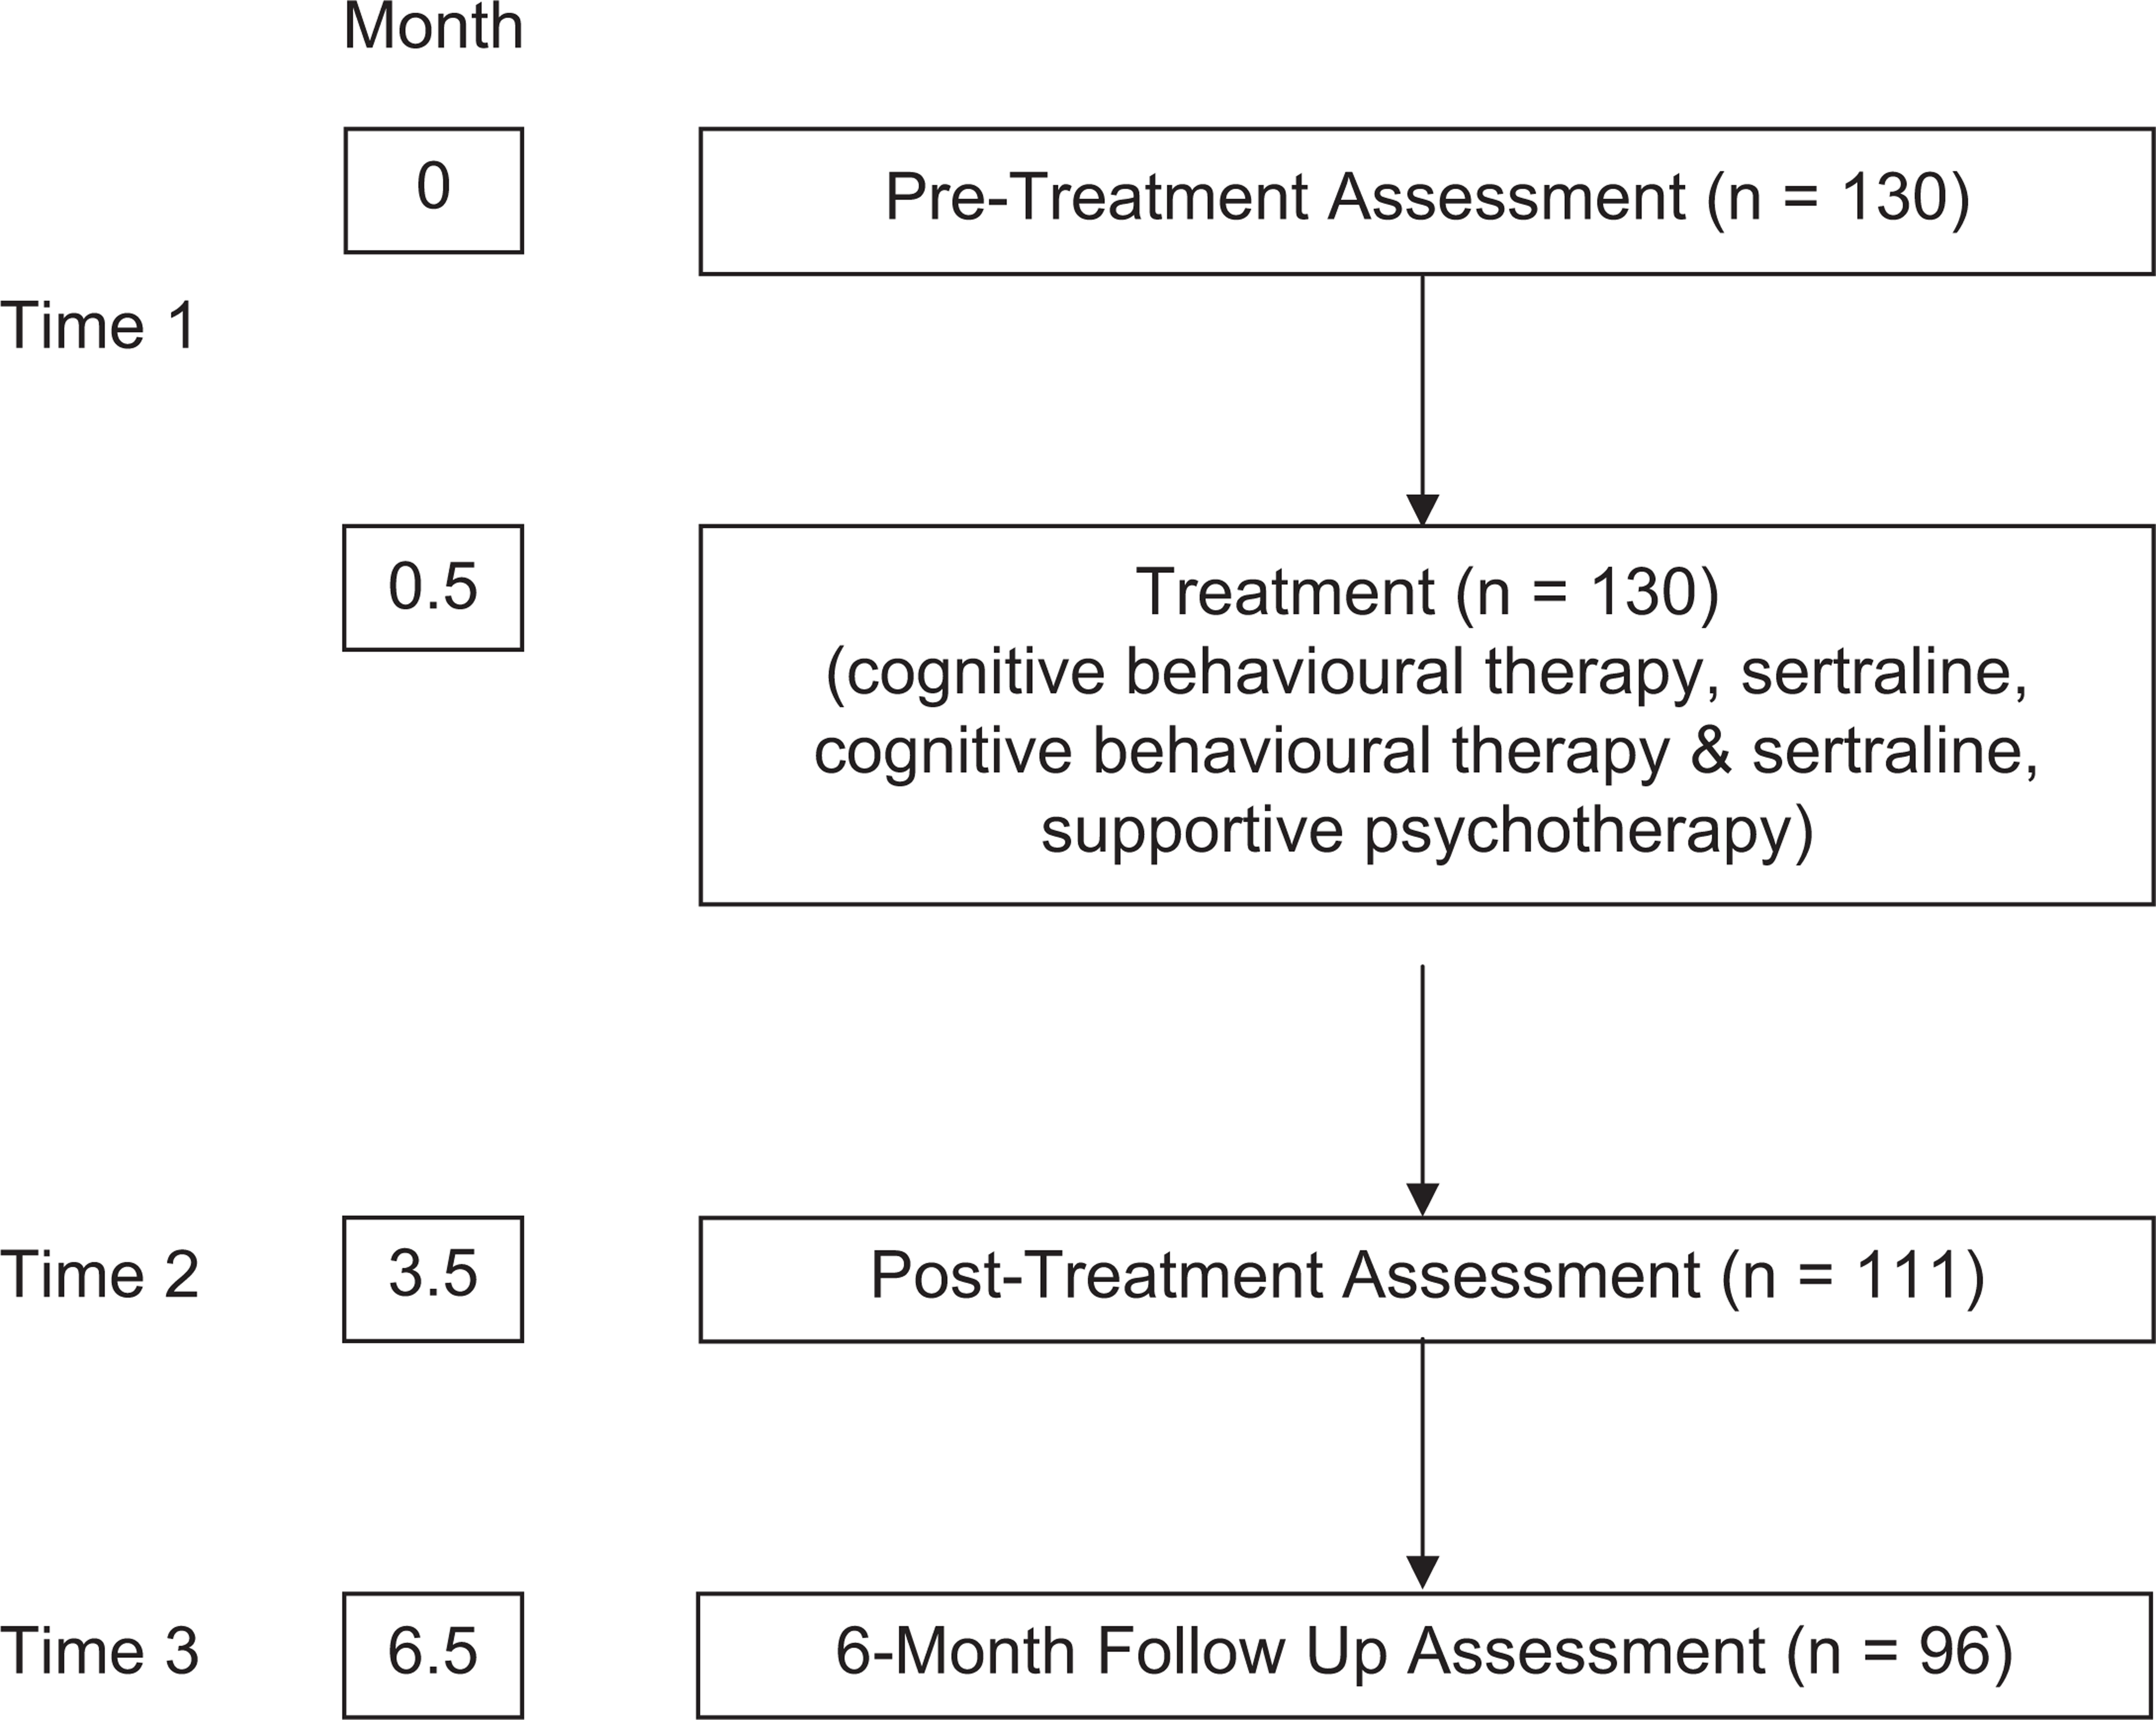
The 130 adolescents (12 to 18 years inclusive) included in this study were referred for treatment of depression by school guidance officers, medical practitioners, community health centres and Child and Adolescent Mental Health Clinics to a community-based Adolescent Mental Health Research Clinic. They were suffering with a primary DSM-IV diagnosis of major depressive disorder (MDD), dysthymic disorder (DD), depressive disorder not otherwise specified (DDNOS), or adjustment disorder with depressed mood (ADDM) and were enrolled in one of two randomized controlled trials for the treatment of adolescent depression; the Berriga House (BH) (N = 57) and Time for a Future (TFF) (N = 73) studies. The TFF cohort and methodology has been previously described [15]. In brief, the TFF sample consisted of 73 adolescents, aged 12 to 18 years inclusive, who were clinically referred for the treatment of depression, between July 2000 and December 2002. The 57 BH depressed adolescents were treated between February 1997 and July 2002. The TFF and BH projects had identical exclusion criteria of major physical illness, epilepsy, bipolar affective disorder, intellectual disability impairing capacity to participate in psychotherapy, psychosis, organic brain syndrome, primary substance abuse, actively suicidal or suffering with a psychiatric disturbance requiring acute hospital admission, and current antidepressant treatment. The BH and TFF studies employed the same assessment instruments and assessment intervals. The BH study was a group comparison design with two active treatments (adolescent-focused CBT (CBT-A) and adolescent- and parent-focused CBT (CBT-A&P)) and a control treatment (supportive psychotherapy). Treatment with adolescent-focused CBT (CBT-A) comprised 14 adolescent sessions and 7 parent sessions. Treatment with adolescent- and parent-focused CBT (CBT-A&P) comprised 14 adolescent sessions and 14 parent sessions. In both the BH and TFF studies depressed adolescents were treated acutely for their depression for 3 months, with a follow up at 6 months following the end of acute treatment. The similar design and identical assessment tools permits the measures in each of the two studies to be pooled for analysis; see Figure 1. The pooled cohort comprised 85 girls and 45 boys (female-to-male ratio of 1.9:1). The mean age in this TFF/BH cohort was 15.1 years (boys 14.8 years, girls 15.2 years) with the modal age 16 years. Of the total, 119 (92%) of the adolescents were born in Australia, three were born in England, two in New Zealand, and one each in Iran, China, Japan, Lebanon, Serbia and the Netherlands. Using DSM-IV criteria [16] 72 (55.4%) were diagnosed with MDD, 30 (23.1%) with DD, 27 (20.8%) with DDNOS, and one adolescent suffered with ADDM.
Program overview.
Analyses
Multiple predictor measures were taken at baseline assessment (T1) and immediately following 3 months of acute treatment (T2). Primary categorical and continuous outcome measures determined a priori were the presence of a depressive disorder 6 months following acute treatment (T3) and the Reynolds Adolescent Depression Scale [17] score at T3.
Measures
The Schedule for Affective Disorders and Schizophrenia for School Aged Children Lifetime was used to determine current depressive diagnosis according to DSM-IV criteria [18]. The Reynold's Adolescent Depression Scale (RADS) [17] is a reliable and valid adolescent self-report questionnaire used to gauge depressive symptoms along a dimensional scale with higher scores indicating a higher level of depression. The clinician assessed global functioning of the adolescent with the Global Assessment of Functioning (GAF) which is axis V of the DSM-IV [16]. The Self-Efficacy Questionnaire for Depressed Adolescents (SEQ-DA), a 12-item self-report scale questionnaire rated the adolescent's perceived ability to cope with depressive symptoms [19]. Higher scores reflect a more adaptive self-evaluation of coping with daily activities and feelings. The Revised-Children's Manifest Anxiety Scale (RCMAS) total score was used to measure adolescent self-report trait anxiety [20–22]. This study also used a 100-point Visual Analogue Scale (VAS) for the assessment of self-reported depressed mood (Sad Thermometer) and irritable mood (Cranky Thermometer). Higher scores reflect higher levels of depression or irritability respectively, referring to current sadness (SAD1), the worst sadness in the last 2 weeks (SAD2), and the worst sadness in their lifetime (SAD3) and current irritability (Cranky1), the worst in the last 2 weeks (Cranky2), and the worst irritability in their lifetime (Cranky3).
Each parent independently completed the Beck Depression Inventory II (BDI-II) and the Abbreviated Dyadic Adjustment Scale (ADAS). The BDI-II is a self-report questionnaire assessing the severity of depressive symptoms with higher scores reflecting more severe depression [23]. The ADAS is a seven item abridged appraisal of parental satisfaction in the relationship with their life partner, which is derived from a subset of items in the Dyadic Adjustment Scale [24,25]. The clinician-rated Global Assessment of Relational Functioning (GARF) and the self-report General Functioning Subscale of the Family Assessment Device (FAD-GF) were used to gauge family functioning. The GARF is a marker of family functioning as described in DSM-IV [16, p. 758]. Like the GAF, higher scores represent more adaptive functioning, and representative values are given as a rating guide. The FAD-GF, a 12-item version of the McMaster Family Assessment Device (FAD) was used to assess both parents and the young person's perception of family functioning [26]. The possible scoring range is between 1 (healthy) and 4 (unhealthy family functioning). A score on the FAD-GF of greater than 2 cut-off has been used in other adolescent MDD studies to identify dysfunctional family dynamics [27,28].
Design
The TFF was a group comparison design in which depressed adolescents were randomly allocated to cognitive behavioural therapy (CBT), sertraline pharmacotherapy, or combined sertraline and cognitive behavioural therapy. The BH study was a group comparison design where depressed adolescents were randomized to adolescent-focused individual CBT, adolescent and parent-focused CBT, or non-directive, supportive psychotherapy. In both the BH and TFF studies the CBT was offered by trained psychologists or mental health practitioners. Treatments comprised weekly sessions scheduled over 3 months. The TFF study design, manual-based CBT and flexible dose design of sertraline pharmacotherapy has been reported elsewhere [15]. Supportive psychotherapy involved 3 months of non-directive psycho-education and support, where the trained therapist used a manual to structure discussion of the patient's illness and provided information, and educational videos.
Of the combined 130 TFF/BH cohort that began treatment at T1, 111 were assessed at T2, and 96 were assessed at T3. A total of 44 variables were identified as potential predictors of depressive disorders and depressive symptoms at T3. These potential predictors included six demographic variables (age, gender, father's occupation, residing in metropolitan versus rural area, marital status of the mother, and education type of the adolescent), and 12 adolescent variables at T1, and 12 variables at T2 (FAD-GF, RCMAS, RADS, SEQ-DA, GAF, SAD1, SAD2, SAD3, Cranky1, Cranky2, Cranky3, and the adolescent's depressive diagnosis). The seven potential parent and family predictors were GARF scores, mother FAD-GF, mother ADAS, mother BDI score, father FAD-GF, father ADAS, and father BDI score, each assessed at T1 and T2.
Statistical analysis
The presence or absence of a depressive disorder at T3 was modelled as a function of individual demographic variables in a logistic regression. The significant demographic predictor variables were retained, and adolescent and parent clinical variables from T1 and T2 were singularly entered in a logistic regression analysis. The independent variables that were found to be significant predictors in a binary regression were then all entered into the model in a combined regression analysis.
The RADS score at T3 was modelled as a function of individual demographic variables in a linear regression. The significant demographic predictor variables were retained, and adolescent and parent clinical variables from T1 and T2 were assessed as the independent variables. The independent variables that were found to be significant predictors in a linear regression were then all entered in the model, in a combined regression analysis.
Data were analysed using the Statistical Package for the Social Sciences Version 11 [29]. The studies received ethical approval from the Southern Health Human Research Ethics Committee. Written informed consent was obtained from the parents and young person.
Results
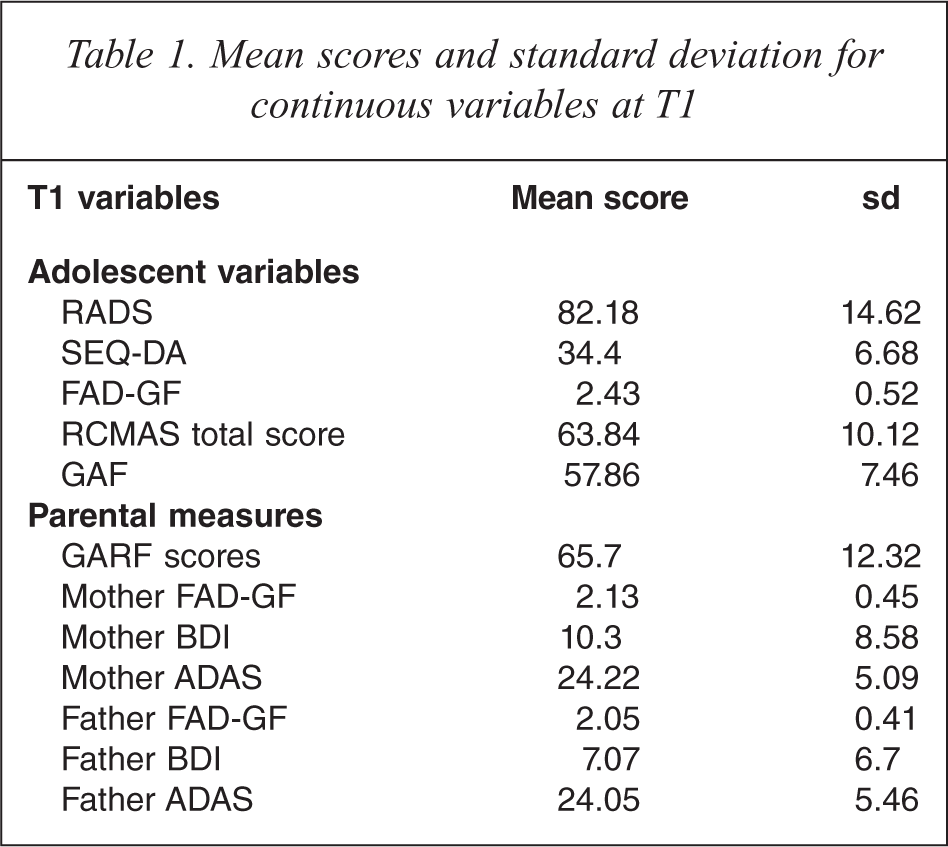
The mean scores of the adolescent and parent continuous variables at T1 are given in Table 1. A total of 81 adolescents (62.3%) at T1 suffered a co-morbid diagnosis including generalized anxiety disorder (12.3%), oppositional defiant disorder (4.6%), post-traumatic stress disorder (5.3%), and social phobia (2.3%).
Mean scores and standard deviation for continuous variables at T1
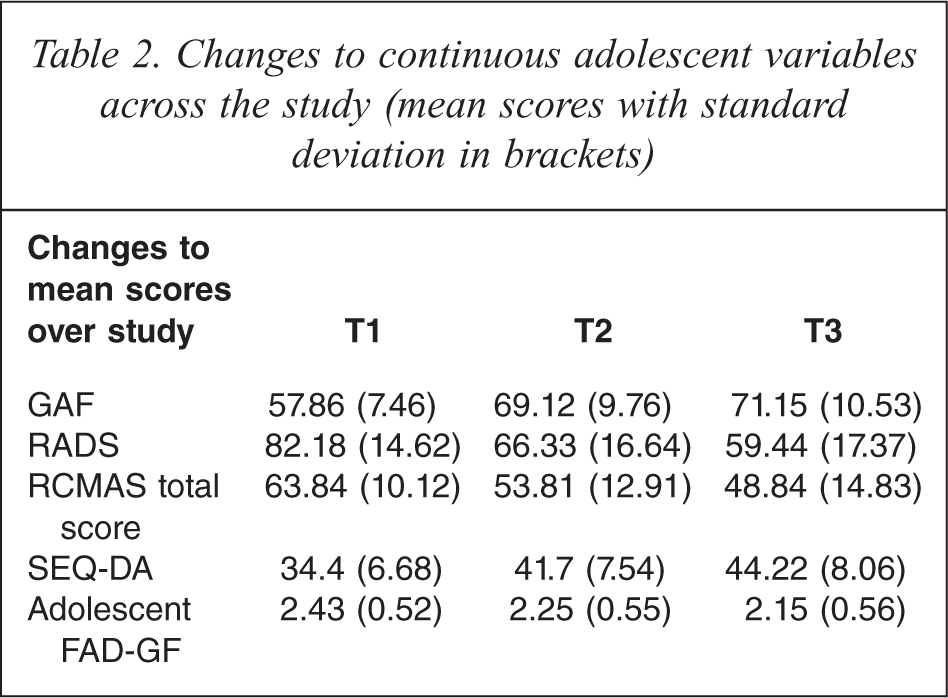
A total of 48 of the 111 adolescents (43.2%) assessed at T2 suffered with a diagnosed depressive disorder. At T3, 26 of the 96 adolescents assessed (27.1%) suffered with a depressive disorder. See Table 2 for changes to the adolescent continuous variables from T1 across to T2 and T3.
Changes to continuous adolescent variables across the study (mean scores with standard deviation in brackets)
Repeated measures analysis of variance (ANOVA)
A repeated measures ANOVA was undertaken to assess whether the six different treatment arms are equally effective interventions for depression in adolescence. The predictor analyses proposed are predicated on an assumption of therapeutic equivalence between each of the six treatment arms. If any of the treatments vary in efficacy then this will skew the predictors towards more heavily weighting those variables that change more in the efficacious treatment arms. Repeated measures ANOVA were performed on the RADS at T1, T2 and T3. In this mixed model analysis, outcome factors assessed included time (RADS scores at T1, T2 and T3), treatment (the six different treatments), and gender of the participants. Interactions of factors were also assessed between factors, including time × treatment, time × gender, and time × treatment × gender. Time was the only significant factor in this repeated-measures ANOVA; F(2,136) = 58.991, p < 0.001, partial η2 = 0.465. Time was a significant factor between pre- and T3 (p < 0.001) and between pre-/post, and post/T3 (p = 0.013). However, a time × treatment interaction was not significant p = 0.392; suggesting that based on RADS scores, there is no evidence that response varies between treatments.
Repeated measures ANOVAs were performed on the RCMAS at T1, T2 and T3. Time was the only significant factor; F(2,144) = 47.268, p < 0.001, partial η2 = 0.396.
Logistic regression: predictors at T1
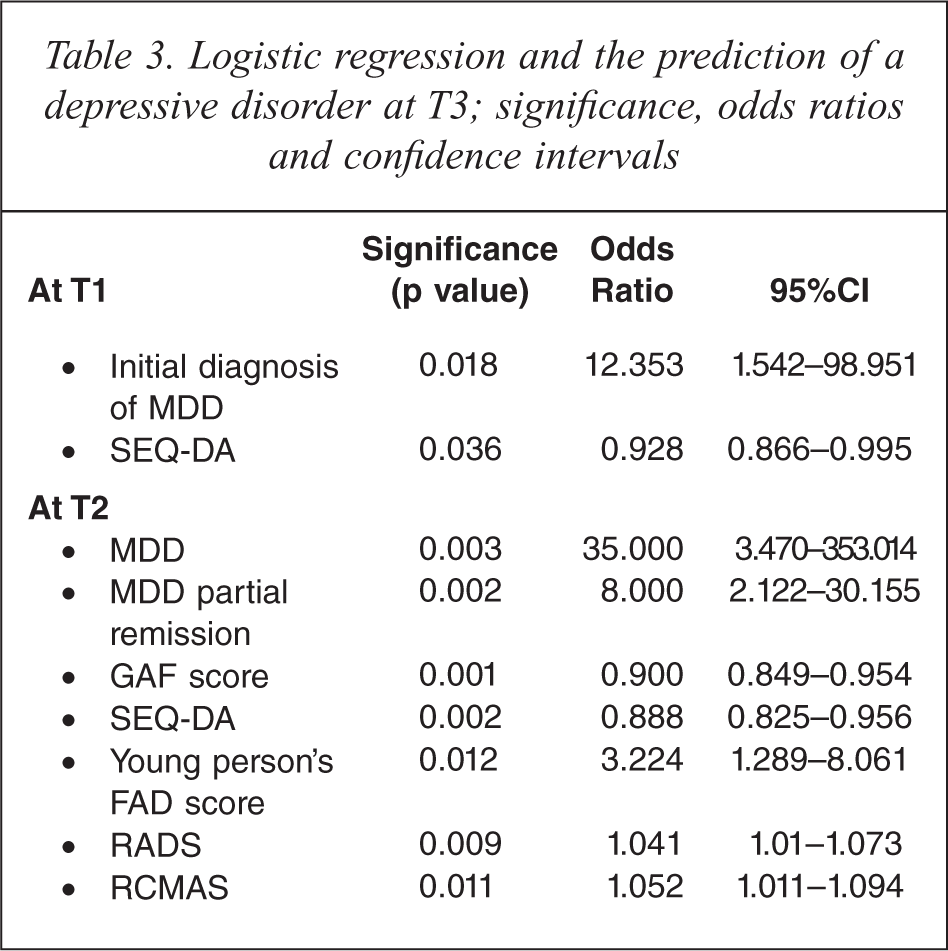
A total of 96 adolescents had complete datasets for T1, T2 and T3. A binary logistic regression was conducted on the six demographic and 19 clinical variables (13 adolescent variables and six parent variables), which were thought to predict a depressive disorder at T3. The variables were individually entered in the regression equation with depressive disorder at T3 as the dependent variable. None of the demographic variables were found to be predictors of a depressive disorder at T3. Demographic variables were excluded from subsequent binary regression modelling. At T1 the presence of MDD, as opposed to DD, predicted depressive disorder at T3 (odds ratio (OR) 12.35, p = 0.018, 95%CI 1.54–98.95). In univariate analysis, the only continuous variable that predicted depressive disorder at T3, was the SEQ-DA score at T1 (OR 0.928, p = 0.036, 95%CI 0.866–0.995). No other adolescent or parent variable at T1 predicted depressive disorder at T3.
Logistic regression: predictors at T2
Nineteen clinical variables (12 adolescent variables and 7 parent variables) were entered in single model binary regression analyses. The six clinical variables identified at T2 that predicted the diagnosis of a depressive disorder at T3 in a univariate regression were the diagnosis of MDD or MDD partial remission, a lower GAF score, an elevated RADS score, an elevated FAD-GF score as assessed by the young person, a lower SEQ-DA score, and a higher RCMAS score (see Table 3). The T2 variables which were non-predictors of depressive disorder at T3, include the VAS measures (SAD1, SAD2, SAD3, Cranky1, Cranky2, Cranky3), all the parent measures (FAD-GF, ADAS and self-report BDI scores) and the clinician-rated GARF score.
Logistic regression and the prediction of a depressive disorder at T3; significance, odds ratios and confidence intervals
Logistic regression: multivariate analysis at T2
A binary regression analysis with all the T2 continuous variables (GAF score, SEQ-DA, RADS, RCMAS, and the young person's FAD-GF) were combined using the enter method. Only the GAF score at T2 and the adolescent FAD-GF at T2 remained as significant predictors of a depressive disorder at T3 (p = 0.008, OR = 0.899; 95%CI 0.831 to 0.973, and p = 0.049, OR = 3.344; 95%CI 1.003 to 11.151 respectively).
Linear regression modelling
The RADS at T3 was used as the continuous dependent variable in linear regression analyses using the enter method. Regression models were initially undertaken using only gender and age. Female gender (but not age) was found to be a significant predictor of T3 RADS score, B = 11.125, 95%CI; 4.01 to 18.24. None of the other four demographic variables were significant predictors of RADS score at T3. Further, regression models were undertaken retaining gender as a co-variate, and then singly entering the other clinical continuous variables. The five variables at T1 which predicted T3 RADS score were the RADS score (B = 0.407; Beta = 0.369, p = 0.001, 95%CI for B 0.176 to 0.638), SEQ-DA (B = −0.858; Beta = −0.341, p < 0.001, 95%CI for B −1.345 to −0.371), adolescent FAD-GF (B = 6.761; Beta = 0.206, p = 0.039, 95%CI for B 0.362 to 13.16), and the SAD thermometers SAD1 (B = 0.148; Beta 0.226, p = 0.028, 95%CI for B 0.016 to 0.281) and SAD2 (B = 0.148; Beta = 0.217, p = 0.033, 95%CI for B 0.012 to 0.284). None of the parent variables at T1 were found to predict RADS at T3.
Linear regression at T2
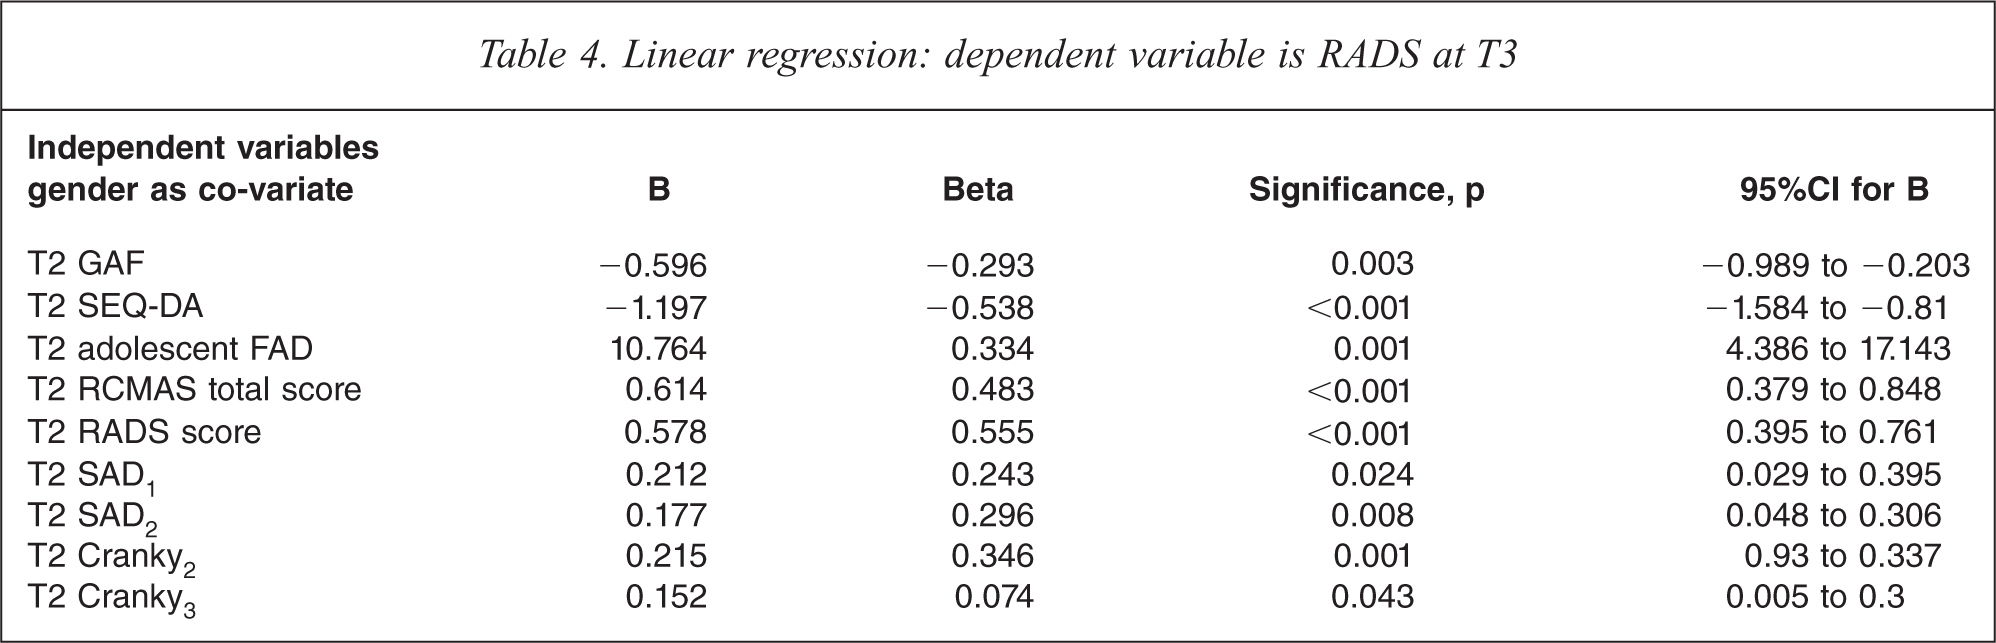
Gender was retained as a co-variate, and the 12 adolescent and seven parent continuous measures were entered individually as independent variables. The continuous variables at T2 which were found to be significant predictors of RADS scores at T3 were the GAF, SEQ-DA, RADS, RCMAS, the young person's FAD-GF, and the VAS of SAD1, SAD2, Cranky2 and Cranky3 (see Table 4).
Linear regression: dependent variable is RADS at T3
Linear regression analyses: multivariate predictors at T1
The clinically significant variables at T1, and then separately at T2 were entered into a combined regression analysis. Gender and T1 variables of RADS, SEQ-DA, the adolescent's FAD-GF, SAD1, and SAD2 were entered in a regression analysis using the enter method. No baseline (T1) continuous variable remained significant when all the significant variables from the previous analyses were combined.
Linear regression analyses: multivariate predictors at T2
Gender was combined with the T2 variables of RADS GAF, SEQ-DA, RCMAS, adolescent's FAD-GF, SAD1, SAD2, Cranky2, and Cranky3 in a regression analysis using the enter method. In this combined regression analysis, the remaining significant predictors were gender (B = 9.34; Beta = 0.253, p = 0.005, 95%CI for B 2.915 to 15.764) and T2 SEQ-DA (B = −0.734; Beta = −0.334, p = 0.012, 95%CI for B; −1.3 to −0.168).
Discussion
As prior studies investigating predictors of adolescent depression have shown inconsistent findings, the aim of this study was to investigate predictors in a sample of 130 adolescents with depressive disorders. Binary regression analyses indicated that at baseline (T1) only the presence of major depression and self-efficacy (SEQ-DA score) were predictors of a depressive disorder at T3. In linear regression analysis, the T1 variables of adolescent FAD-GF, RADS, and SEQ-DA were all predictors of RADS scores at long-term follow up (T3).
Regression analyses indicated that after 3 months of treatment, individual measures that were in part predictive of whether the adolescent would be depressed at T3 included a self-report measures of adolescent self-efficacy (SEQ-DA), adolescent depression (RADS), adolescent anxiety (RCMAS), a family functioning (FAD-GF), the residual diagnosis of a depressive disorder (MDD or MDD partial remission), and a clinician's assessment of adolescent functioning (GAF). Clinically, it would make sense that self-reported markers of self-efficacy, depression, anxiety, perceptions of the family, clinician assessment and residual depression would predict depressive disorder at long-term follow up. There is good face-validity to these findings. The same variables that were predictors at T2 in binary regression were also predictors in a linear regression; T2 VAS variables of sad mood and irritability (SAD1, SAD2, Cranky2, and Cranky3) were all predictors.
The design of this study and its findings are similar to the published papers by Birmaher et al.[30], Brent et al. [31], Vostanis et al. [32] and Clarke et al. [33]. Birmaher et al. treated 107 adolescents suffering with MDD with short-term psychotherapy (CBT, systemic behavioural family therapy or non-directive supportive therapy) and followed them up at 2 years [30]. Like this study, Birmaher et al. had a naturalistic follow up phase, where over half the cohort received other support and treatment outside the study design [30]. They found that the child FAD-GF, Children's Global Assessment Scale and self-reported BDI following psychological treatment were predictors of recovery from MDD over the 2-year follow up period [30], which were comparable to the RADS, GAF and adolescent FAD-GF findings in this study.
In a companion paper, Brent et al. [31] using the same cohort as Birmaher et al. [30] examined the 2-year outcome following brief psychotherapy for those adolescents with subsyndromal depression or MDD or who were no longer depressed following psychotherapy. Similar measures were employed to this study, and they found a trend for a greater rate of recovery in the subsyndromal compared with the still depressed group. Those with subsyndromal depression were not at higher risk of recurrence than those who were non-depressed following treatment [31]. Predictors of time to recovery (recurrence) were MDD at the end of treatment and impaired functioning on the FAD-GF, although it was not clear whether this measure was reported on by the adolescent or parent [31].
Vostanis et al. [32] assessed 58 children and adolescents nine months after a randomized control trial of out-patient CBT or non-focused therapy. In binary regression, with depression at LTFU being the outcome measure, school functioning, additional outpatient appointments, child's expectancy of treatment and self-esteem were the predictors of depression at 9 months. In a multiple regression analysis using the Mood and Feelings Questionnaire as the dependent variable, child self-esteem was found to be a predictor [32]. A comparison of the Vostanis [32] study with this study highlights the problem of the difficulty comparing studies because of the use of different measures, cohort differences, differences in treatments and in the handling of the naturalistic phase with the result that the different studies of predictors yield different results.
Clarke et al. [33] found differences in the predictor findings depending on the methodology within their study CBT, or 14-session adolescent and parent CBT, or a waiting list control condition for adolescent depression (MDD or DD). The variables at baseline were assessed in a discriminant function analysis to see if they predicted (i) those who recovered from their depressive disorder, and (ii) adolescent-reported BDI [33]. They reported different predictor variables when they used a self-report measure (BDI) as the dependent variable, compared to when they employed a dichotomous diagnostic outcome as the dependent variable. Recovery from depression was predicted by four baseline variables of lower BDI scores, lower anxiety scores, increased level of enjoyment and pleasant activities and a higher level of rational thoughts on the Subjective Probability Questionnaire [33].
Clarke et al. [33] reported that their ‘results support the thesis that definitions of depressive symptomatology and/or disorder which differ with respect to assessment (self-report versus semi-structured diagnostic interview) as well as classification methods (categorical diagnoses versus continuous scales) will often yield vastly different associations with variables of interest’ (p.351). This is in keeping with the findings of this study, in which five baseline variables were predictors of RADS score at T3, but were not predictive of depressive disorder at T3.
As with this study, Clarke et al. [33] also reported on the importance of gender as being a univariate predictor for change on the pre-to-post BDI, but gender was not a predictor of recovery. This study was consistent with the finding of Wilkinson et al. who reported that the most efficient predictor of depression was overall depressive symptoms [14].
Limitations
This study pooled the diagnoses of major depression, DD and minor depression. Parker has made the argument that, at least for adults, specific treatments for each depressive disorder sub-type are indicated [34]. Conversely, a community study of psychosocial functioning and co-morbid substance use in adults and adolescents found that depressive symptoms exist as a continuum rather than a categorical threshold [35]. This dimensional concept of depression would validate pooling MDD, DD and minor depression for the purposes of statistical analysis. However in the logistic regression analysis an MDD diagnosis was predictive but not DD, perhaps indicating that the treatment offered might have been have been more beneficial to those young people with a more chronic and milder depression presenting as a DD.
Conclusion
The clinical implication of this study is that self-reported questionnaires completed by the young person are useful and reliable markers which can predict the course of their mental health 6 months after treatment. One of the more reliable markers was the SEQ-DA. Further research is required to establish a cut-off score for the SEQ-DA; however, these findings point to the importance of the development of a sense of self-efficacy in teenagers who have experienced depression. Further work is underway to compare a longer follow up period into adult life, to determine those variables which continue to predict depression.
Footnotes
Acknowledgements