
Abstract
Keywords
Anorexia nervosa (AN) is a severe disorder, which is difficult to manage and treat [1,2], and one that is associated with high levels of functional and social impairment. Deficits in general emotional processing have recently been reported in the literature [3–6], but the mechanisms and clinical implications are not yet fully understood. This paper will focus on emotional processing in AN, with a particular emphasis on facial affect recognition of happiness and sadness.
Emotion recognition in AN
It has been reported that social and emotional factors may act as triggers in the onset of eating pathology, and often constitute maintaining factors in eating disorders (ED) [7,8]. Several studies suggest impairment of social functioning in AN [9–11]. These social difficulties seem to exist pre-morbidly [12] and may persist after recovery [13–15]. The difficulties in social interaction and emotional processing are also associated with a poorer treatment outcome in AN [16].
It has been demonstrated that deficits in interpersonal and social functioning in EDs could be a consequence of problems with facial emotion recognition [17]. Literature on emotional processing and recognition in EDs is limited. The majority of the studies assessed basic emotion recognition [3,6,18–25]. The findings in this field are conflicting, with some studies indicating emotion recognition deficits in AN [3,6,18,21,24,25], and others failing to find any impairment in emotional recognition in this population [19,20,22,23].
Importantly, the confounding variables that could have an effect on facial emotion recognition such as medication status, levels of anxiety, depression, obsessionality or other psychopathological characteristics are rarely reported in studies of emotional processing. This is of particular concern, and underlies the need for additional studies taking into account these different variables. It has been reported that depression is associated with emotional processing deficits [22,26], and that antidepressants affect facial emotion recognition [27,28,29]. Furthermore, several studies report emotional processing deficits in affective, anxiety and Obsessive-compulsive disorders [30–33], and it is known that EDs have a high comorbidity with these disorders [34–36].
Aims and objectives
It is not yet clear how patients with AN recognize facial emotion and whether potential difficulties in the recognition of positive and negative facial affect are related to comorbid symptoms. The rationale for this study was therefore to address this gap in the literature, using the validated Facial Affect Recognition task [26], used for the first time in patients with AN. More specifically, the task will explore different aspects of emotional recognition (discrimination accuracy, response bias, and response time) towards positive and negative facial expressions in patients with AN compared to a group of healthy controls (HCs), as difficulties in the management of negative emotions seem particularly relevant in this clinical group [4,37].
In addition we explore the relationships between facial recognition and clinical characteristics such as body mass index (BMI), anxiety, depression, Obsessive-compulsive, AN symptoms and intelligence quotient (IQ). Based on findings reported in the literature we hypothesized that facial affect recognition would be impaired in patients with AN, and that co-morbid symptoms would relate to these difficulties.
Materials and methods
Participants
Thirty female participants between the ages of 16 and 55 years who met Diagnostic and Statistical Manual of Mental Disorders [38] criteria for AN were recruited from inpatient and outpatient services of the South London and Maudsley NHS Trust. Forty-three female HC participants were recruited from advertisements in the local community. Exclusion criteria for the study were neurological disorder, traumatic brain injury, learning disability, bipolar affective disorder, schizophrenia and other psychotic conditions. In addition, HCs with axis I or II psychiatric or substance abuse disorder, psychiatric disorder in first-degree relatives or a BMI lower than 19 or higher than 27 were excluded. All participants had English as their first language. All participants provided informed written consent for the study. Ethical approval was obtained from the South London and Maudsley Trust NHS and Institute of Psychiatry Committee.
Measures
Facial emotion recognition
Facial emotion recognition was measured using an emotion recognition task, the Facial Affect Recognition task (FAR) [26], which is a computerized task developed to present facial expressions displaying emotions at a range of intensities with different duration of presentations. This task provides various measures of emotional processing, including discrimination accuracy, response bias and response time. Discrimination accuracy reflects how well participants discriminate between emotional and neutral facial expressions. Response bias reflects the tendency to misidentify neutral faces as emotional. During the task the participants viewed randomized pictures of facial identities from a standardized series on a computer screen [39], displaying expressions of happiness, sadness or neutral expressions. The test included two experimental trials, one for happy expressions and another for sad expressions. In each experimental trial eighty faces were presented: sixty emotional (happy or sad) and twenty neutral. The intensity of emotion was either neutral (0%), weak (25%), mid (50%), or strong (100%). The length of stimulus presentation was either short (500 ms), or long (2000 ms). The faces were presented individually, with an inter-stimulus interval of 1500 ms. During the first 500 ms of the inter-stimulus interval a fixation cross was presented.
Self-report measures
ED symptoms were measured using the Eating Disorder Examination Questionnaire (EDE-Q) [40]. The EDE-Q is a 36 item self-report questionnaire used to assess the key attitudes and behavioural features of EDs. The EDE-Q provides a global score and has four subscales: dietary restraint, eating concern, weight and shape concerns. Subscale and global scores range from 0 to 6, with higher scores (EDE-Q global score > 2.5), suggesting the presence of disordered eating.
Obsessive-compulsive symptoms were measured using the Obsessive-Compulsive Inventory Revised (OCI-R) [41]. It has 18 items scored on a 5-point Likert scale 04. It has six subscales (i) washing, (ii) checking, (iii) ordering, (iv) obsessing, (v) hoarding and (vi) mental neutralizing. The total score ranges from 0 to 72 and high scores (OCI-R total score > 21), suggests the presence of clinically relevant obsessive symptoms [41].
Anxiety and depression levels were measured using both the Hospital Anxiety and Depression Scale (HADS) [42] and the Depression Anxiety Stress Scale (DASS-21) [43]. The DASS is a 21 item measure, with 7 items in each of three subscales. Each subscale has a maximum score of 21.
The National Adult Reading Test (NART) [44] was conducted to estimate IQ.
Procedure
Participants were instructed that the main purpose of the task was to decide whether the face was neutral or emotional, as quickly and as accurately as possible. To respond to the facial stimuli the participants were instructed to move a computer joystick according to the labels on the screen (e.g. neutral or sad). To avoid order effects, the order of labels in the task was randomized so that in 50% of the trials the labels were set up to neutral/emotional, and to emotional/neutral in the other 50%. Each experiment took on average 7 min to complete. All participants performed a practice trial before testing to ensure they could perform the task adequately. The emotion used in the practice trial was anger, to avoid confounding effects with the emotions under test (happiness and sadness).
Participants completed the questionnaires and the interview on the day of the experimental tasks, which took 1.5 h on average.
Individuals with AN were diagnosed by experienced clinicians, according to both DSM-IV criteria and clinical assessment. HC participants were assessed using the Structured Clinical Interview for DSM-IV, non-patient edition (SCID-I/NP) [45]. Socio-demographic data, medication history and family psychiatric history of the participants were obtained from medical notes and a self-report questionnaire in the patient group and by a self-report questionnaire in the control group.
Statistical analysis
The Statistical Package for the Social Sciences, version 17.0 (SPSS 17.0) was used to analyse the data. The raw data obtained from the FAR task were transformed into measures of discrimination accuracy (Pr) and response bias (Br), according to the 2HT model [46]. The main outcome variables of the FAR task were discrimination accuracy, response bias and response time (RT). Discrimination accuracy and response bias values were computed taking into account measures of discrimination accuracy of both emotional and neutral facial expressions. We analysed the responses to short duration of stimuli separately from those to long duration collapsing together the emotional intensity levels of stimuli (i.e. 25%, 50%, 100%). The different intensities of stimuli presentation were analysed together since the sample size was not large enough to analyse them separately. Since the data on the main outcome variables were not normally distributed, a mathematical transformation was performed. For both discrimination accuracy and response bias, a logit-transformation of the data was performed. The values of response time were log-transformed. The transformed outcome variables showed a normal distribution.
Simple linear regressions were conducted to evaluate the relationship between discrimination accuracy of happy and sad faces (for both short and long presentation times) with eight predictor variables (diagnosis, age, BMI, IQ, EDE-Q, anxiety, depression and OCI-R score). The same procedure was applied to the other outcome measures: response bias and response time. The predictor variables that showed statistically significant relationships with the outcome measures in the simple regression analysis were selected to run linear multivariate regression models. We used a p value of < 0.05 for this initial selection of variables to enter into the multivariate model. Multiple regression analysis was conducted only for outcome variables that were significantly associated with more than one of the predictor variables. A Bonferroni correction was applied to control for the multiple testing, with a threshold of p < 0.006 (0.05/8).
For the purposes of analysis of co-morbidity two main categorical groups were created for anxiety and depression levels: mild and moderate/severe. These were formed from composite scores taken from the HADS and DASS-21 scores. Two groups were created for anxiety levels: mild (HADS scores from 8 to 10 and DASS-21 from 8 to 9) and moderate/severe (HADS scores from 11 to 15 and 16 to 21 and DASS-21 from 10 to 14 and ≥ 15). Normal anxiety levels were considered for scores ≤ 7 both for HADS and DASS-21. Similarly, for depression levels two categorical groups were created: mild (HADS scores from 8 to 10 and DASS-21 scores from 10 to 13) and moderate/severe (HADS scores from 11 to 15 and 16 to 21 and DASS-21 scores from 11 to 15 and 16 to 21 and DASS-21 from 14 to 20 and ≥ 21. Normal depression levels were considered for HADS scores ≤ 7 and DASS-21 scores ≤ 9. This was done to avoid reducing the sample size in the regression analysis, since we did not have data from both questionnaires (HADS and DASS-21) for all participants. We had data from the HADS from 30 HCs and six patients and data from the DASS-21 from 35 HCs and 21 patients.
Results
Demographic and clinical comparisons
The final sample comprised 70 participants: 30 with AN, and 40 HCs. We excluded three individuals from the HC group: two scoring high on the EDE-Q and one scoring high on the OCI-R. The comparison between groups on the main demographic and clinical variables is summarized in Table 1. There was a significant difference between the groups in age, education and estimated IQ, with higher means in the HC group. With regard to the main clinical variables, the AN group presented significantly higher on levels of anxiety, depression, ED symptoms and obsessive symptoms and significantly lower on BMI.
Demographic and clinical characteristics of patients with AN and HC
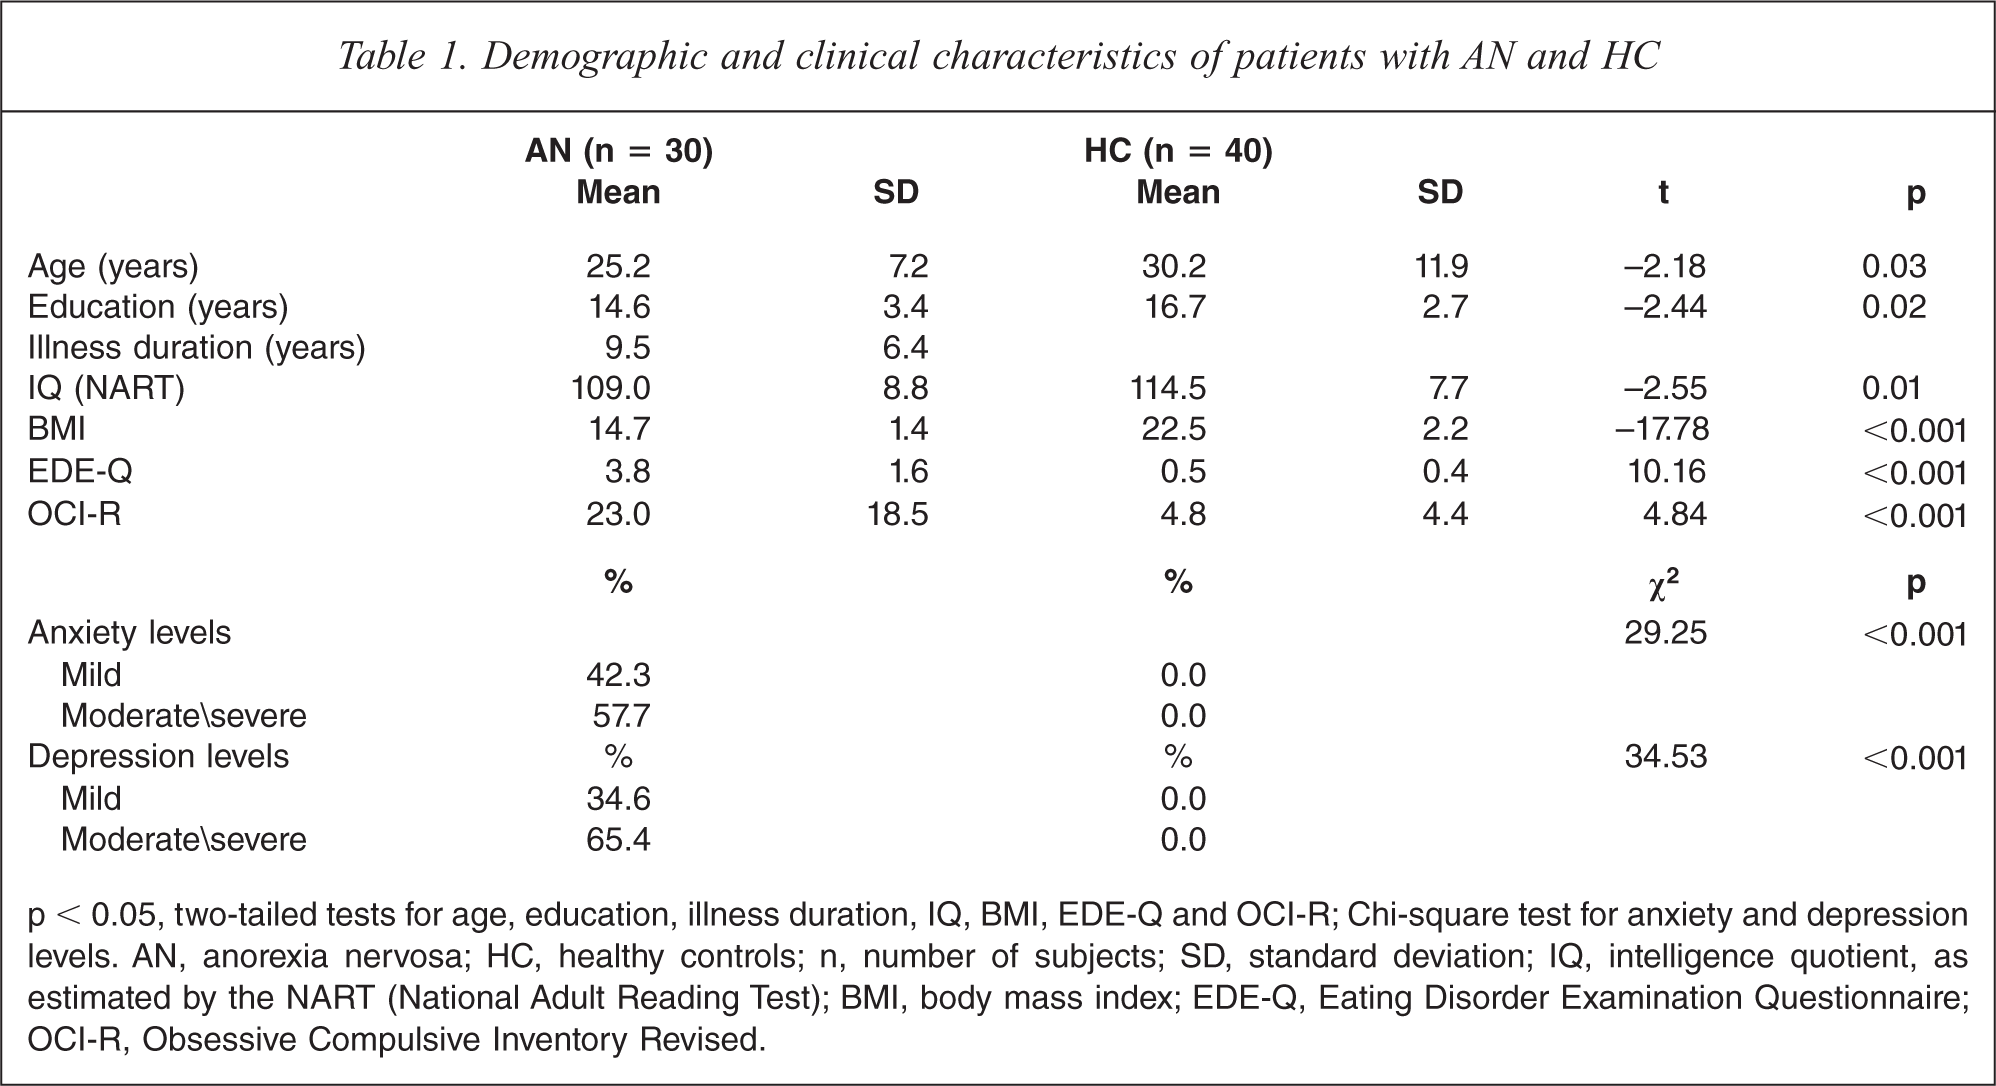
p < 0.05, two-tailed tests for age, education, illness duration, IQ, BMI, EDE-Q and OCI-R; Chi-square test for anxiety and depression levels. AN, anorexia nervosa; HC, healthy controls; n, number of subjects; SD, standard deviation; IQ, intelligence quotient, as estimated by the NART (National Adult Reading Test); BMI, body mass index; EDE-Q, Eating Disorder Examination Questionnaire; OCI-R, Obsessive Compulsive Inventory Revised.
Medication status
In the AN group, 13 people were taking psychiatric medication: SSRIs (n = 7), both antidepressant and benzodiazepine (n = 1), olanzapine (n = 1) and psychiatric medication non-specified (n = 4). In the HC group, none of the participants were taking psychiatric medication.
Main outcome variables: discrimination accuracy, response bias and response time
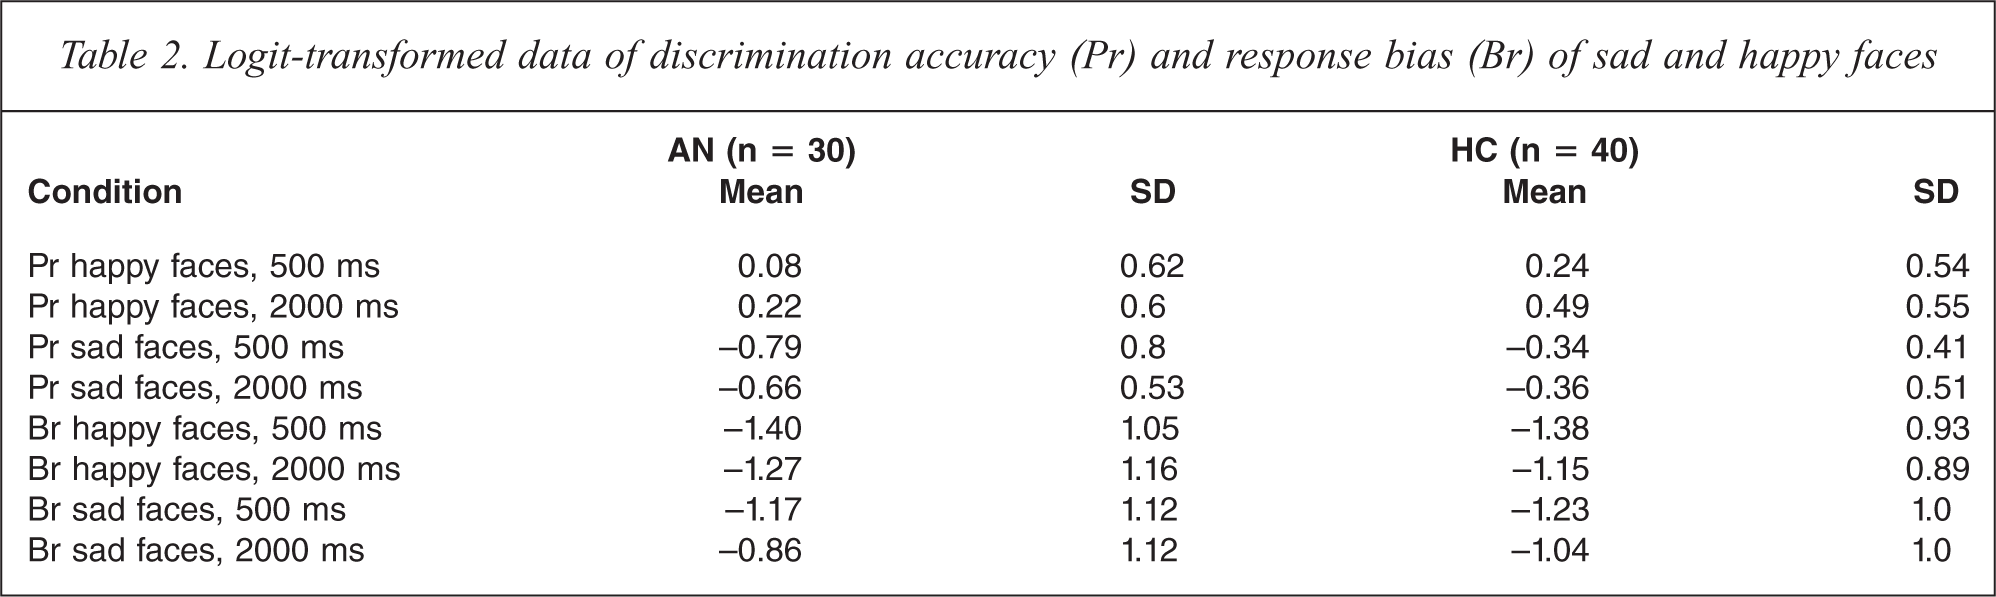
The mean values and standard deviations of logit-transformed discrimination accuracy (Pr) and response bias (Br) of sad and happy faces are presented in Table 2.
Logit-transformed data of discrimination accuracy (Pr) and response bias (Br) of sad and happy faces
Discrimination accuracy
Discrimination accuracy of sad faces (Pr sad)
The results of the simple regressions of discrimination accuracy are shown in Table 3.
Simple linear regressions of discrimination accuracy (pr) of sad and happy faces
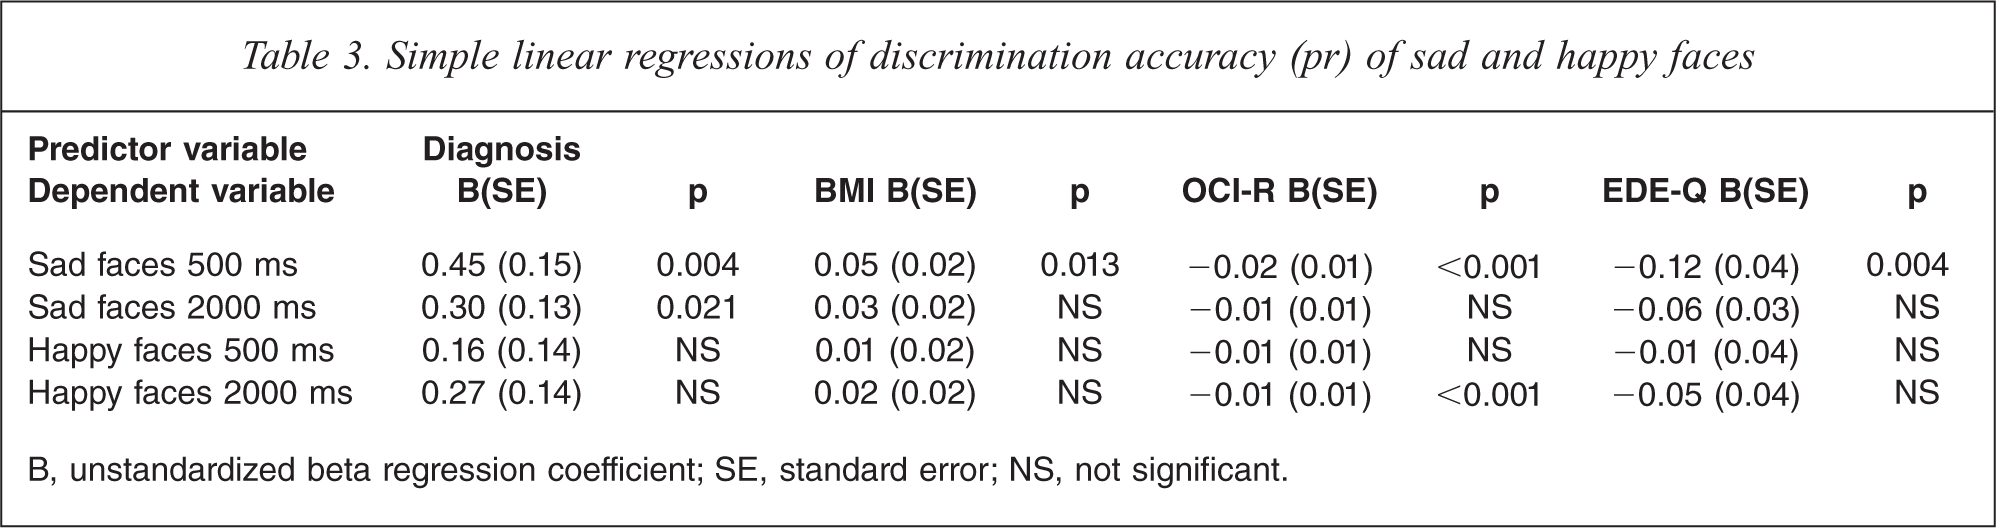
B, unstandardized beta regression coefficient; SE, standard error; NS, not significant.
Discrimination accuracy of sad faces presented for 500 ms (‘Pr sad 500’) was significantly associated with AN diagnosis (p = 0.004), BMI (p = 0.013), OCI-R (p < 0.001) and EDE-Q (p = 0.004). ‘Pr sad 500’ was not associated with age, IQ, anxiety and depressive symptoms.
Discrimination accuracy of sad faces presented for 2000 ms (‘Pr sad 2000’) was significantly associated with AN diagnosis (p = 0.021). Applying the defined threshold of p < 0.006, this association was no longer significant. ‘Pr sad 2000’ was not associated with BMI, OCI-R, EDE-Q, age, IQ, anxiety or depressive symptoms.
According to the criteria for multiple regression models as above, ‘Pr sad 500’ was entered into the multiple regression analysis. ‘Pr sad 500’ was modelled as the dependent variable with the predictor variables AN diagnosis, BMI, EDE-Q and OCI-R. In the multiple regression model, the only significant predictor of ‘Pr sad 500’ was OCI-R (p = 0.001). The results of the multiple regression analysis are shown in Table 4. The multiple regression analysis was significant (p < 0.001) and the model explains 24% of the variance in ‘Pr sad 500’. There was a negative relationship between the two variables, i.e. higher score of Obsessive-compulsive symptoms relates to lower discrimination accuracy of briefly presented sad faces.
Multiple regression model: discrimination accuracy of sad faces, 500 ms
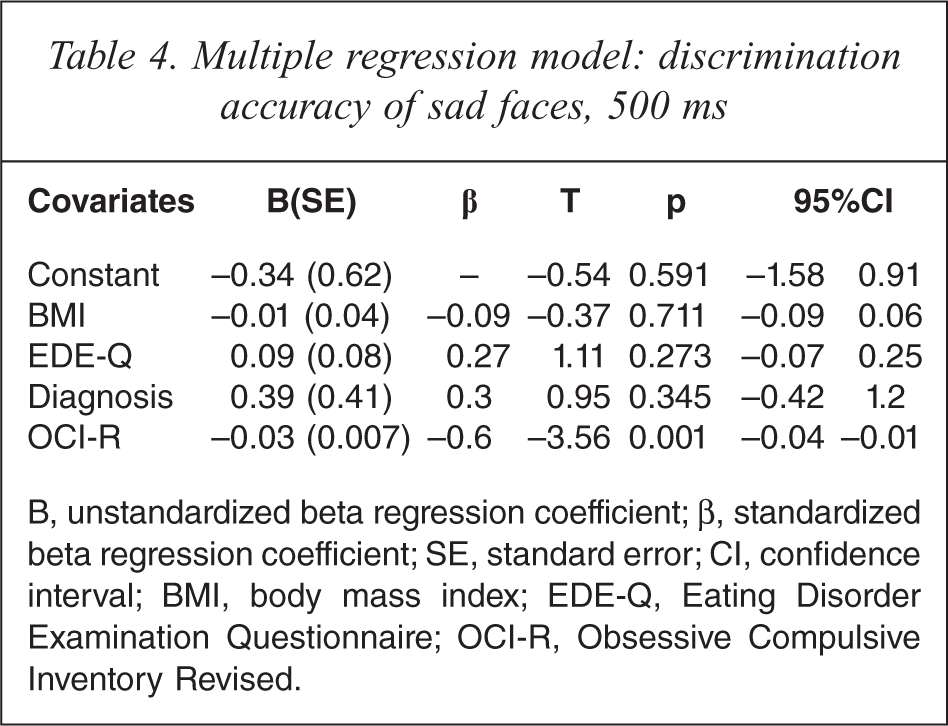
B, unstandardized beta regression coefficient; β, standardized beta regression coefficient; SE, standard error; CI, confidence interval; BMI, body mass index; EDE-Q, Eating Disorder Examination Questionnaire; OCI-R, Obsessive Compulsive Inventory Revised.
Discrimination accuracy of happy faces (Pr happy)
AN diagnosis was not associated with discrimination accuracy of happy faces, neither were BMI, EDE-Q, age, IQ, anxiety and depressive symptoms. The only significant negative association was observed between OCI-R score and discrimination accuracy of happy faces presented for 2000 ms (‘Pr happy 2000’: p = 0.01), but this finding did not remain statistically significant after the correction for multiple analysis (corrected p value <0.006).
Response bias
Response bias to sad faces (Br sad)
Using simple regression analysis, no significant association was found between response bias towards sad faces recognition and AN diagnosis, BMI, EDE-Q, age, IQ, anxiety and depressive symptoms. OCI-R scores were significantly associated with higher response bias towards sad faces presented for 500 ms (p = 0.028) and sad faces presented for 2000 ms (p = 0.014). After correcting the results of simple regression analysis for multiple associations (corrected significance threshold of 0.006), the associations between response bias and OCI-R were no longer statistically significant. Multiple regression analysis has not been applied as there was no association of Br with at least two predictor variables.
Response bias to happy faces (Br happy)
No association was found between response bias to happy faces with AN diagnosis, BMI, EDE-Q, age, IQ, anxiety and depressive symptoms. OCI-R scores were significantly associated with higher response bias towards happy faces presented for 500 ms (‘Br happy 500’: p = 0.028). However, after adjusting for multiple associations, the association between ‘Br happy 500’ and OCI-R scores was no longer statistically significant.
Response time
The mean and standard deviation data for response time to happy and sad faces is presented in Table 5.
Response time to sad and happy faces (in seconds)
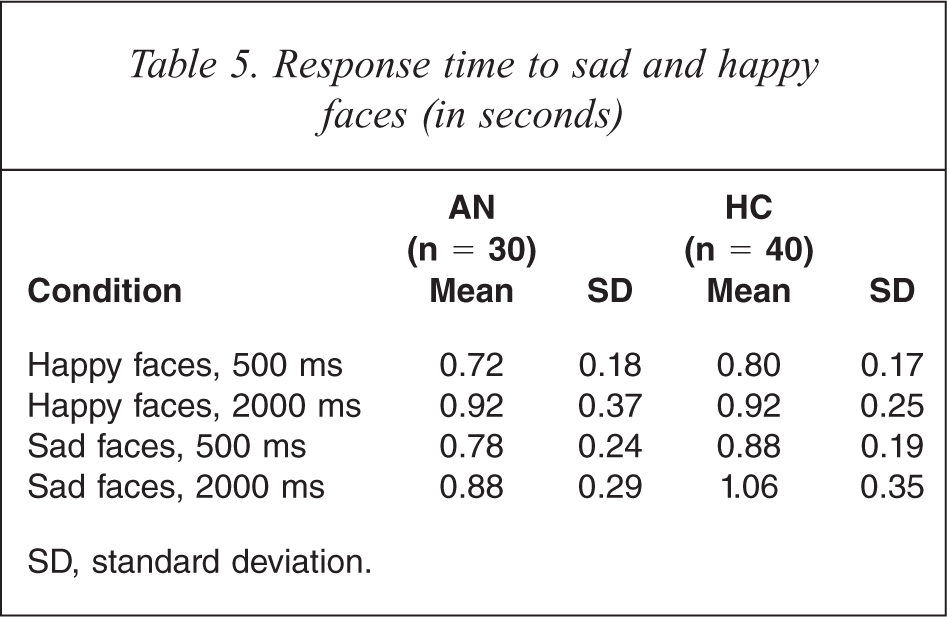
SD, standard deviation.
Response time to sad faces
Simple linear regression analysis showed that four variables significantly predicted response time to sad faces presented for 500 ms: age (p = 0.008), IQ (p = 0.032), OCI-R (p = 0.006) and AN diagnosis (p = 0.037). However, when entered as covariates in a multiple regression model, this was not the case. Similarly, five variables significantly predicted response time to sad faces presented for 2000 ms: EDE-Q (p = 0.028), BMI (p = 0.04), OCI-R (p = 0.014), anxiety (p = 0.027) and AN diagnosis (p = 0.021). However, when entered as covariates in multiple regression analysis, none of the above variables significantly predicted response time to sad faces presented for 2000 ms.
Response time to happy faces
No associations were found between AN diagnosis and response time to happy faces in simple linear regression analysis. None of the other studied variables (age, IQ, BMI, EDE-Q, OCI-R, anxiety and depression) was significantly associated with response time to happy faces.
Discussion
The aim of this study was to explore facial affect recognition of sadness and happiness in patients with AN compared to a HC group.
No association was found between discrimination accuracy of happy faces and AN diagnosis. AN diagnosis was not significantly associated with response bias to sad or happy faces. Also, no significant association was found between the clinical variables age and IQ with response bias to sad and happy faces. Response time to sad and happy faces was not significantly associated with AN diagnosis or with any of the clinical variables or with age or IQ in a regression analysis.
We found that patients with AN showed significantly poorer discrimination accuracy of sad faces presented for short duration (500 ms). Poor discrimination accuracy of sad facial affect presented for 500 ms was also significantly associated with low weight, ED symptoms and Obsessive-compulsive symptoms. A multiple regression analysis showed that the only significant predictor of discrimination accuracy of sad faces presented for 500 ms was the level of Obsessive-compulsive symptoms.
Importantly, when taking into account the level of obsessionality, AN diagnosis and BMI were no longer predictive of poorer discrimination accuracy of briefly presented sad faces. That is, the degree of Obsessive-compulsive symptoms was a better predictor of sad face recognition deficit than AN diagnosis. This is in line with the results of a previous study [47], which found that OCD patients performed poorer than HCs in the recognition of sad and happy facial emotions, especially in the recognition of sad female faces. The question arises: what are the mechanisms of impaired recognition of sad faces in AN? Our results suggest that emotion processing deficits in AN are partly mediated by obsessiveness, and that this could be a distinct mechanism from that operating in affective disorders mediated by low mood and anxiety levels. This is a novel and interesting idea that can have important implications if replicated in further research.
It is not clear, however, why the poorer discrimination accuracy of sad faces was present only for shortly presented faces (500 ms) and not for the longer presentation time (2000 ms). It could be that high obsessionality levels affect the way human facial expressions are processed in brief presentations, with patients focusing on the details of the face (i.e. eye or mouth region), losing information of the overall facial expression, leading to more errors in emotional identification. In future studies it would also be important to take into account the effect of the different intensities of emotion. If a gradient exists, with the discrimination accuracy being poorer in more ambiguous presentations (e.g. 25% intensity of emotion versus 50% versus 100%), then ambiguity could be a factor that invokes obsessionality and affects recognition accuracy.
Obsessive-compulsive symptoms were not measured or controlled for in most of the previous studies of facial emotion recognition in EDs [18,20,22,24,25]. It is important to note that in our study the clinical group was recruited from an inpatient clinic and most of these patients had severe AN, and high levels of Obsessive-compulsive symptoms.
Several studies highlight the close links between Obsessive-compulsive disorder (OCD) and AN [36,48] as well as Obsessive-compulsive personality disorder (OCPD) traits [16,49,50], which has been associated with a poorer prognosis [50]. OCD is reported to precede the onset of AN [34], and the majority of the individuals with AN show anxious and Obsessive-compulsive traits, and traits of childhood perfectionism, prior to the onset of the ED [51–54]. Women with long-term recovery from AN show a persistence of anxiety, perfectionism and obsessional behaviours [35,55–59].
Our findings support previous studies that have reported impaired emotional recognition in EDs, and more specifically in AN populations [18,20,21,24,25]. Conversely, our findings differ from those of Mendlewicz et al. [22], who could neither confirm nor rule out the presence of a deficit in emotional recognition of five basic emotions in AN. Our findings also contradict the work from Kessler et al. [23], that failed to show a difference in emotion recognition ability between AN patients and HCs. It should be noted that in the Kessler et al. study [23], the obsessionality levels were not accounted for.
There are some limitations to our study. First, only female participants were included. Second, we did not differentiate between subtypes of AN (bingepurge and restricting) due to low power. Also, only two emotions (sadness and happiness) were tested, whereas processing of other emotions (e.g. disgust, shame, anger) have also been found to be salient to AN [25,60,61]. Another important clinical variable that may confound the results is mood. It has been reported that co-morbid depression has an effect on facial recognition in EDs [21,22,25,62]. In our sample, we have not found associations between facial recognition accuracy and depressive symptoms, which may be explained by different methodology (task, patient group). It could also be that high levels of obsessiveness involve distinct neural mechanisms or have a stronger effect in emotion processing, inhibiting or masking the effects of low mood.
In conclusion, our findings are consistent with previous studies, which found that patients with AN process facial emotion differently compared with HCs. According to our results, patients with AN do appear to have emotional processing deficits, particularly in the recognition of sad facial affect. Our findings suggest that Obsessive-compulsive symptoms are a stronger predictor of discrimination accuracy of sad faces than AN diagnosis, and seem to have an independent effect on facial emotion processing. Further studies addressing comorbid anxious, depressive and obsessive symptoms can bring important insights to the understanding of emotional processing in AN. Our results also suggest that the processing of negative emotions is particularly relevant in AN, supporting the importance of clinically addressing emotional processing problems in this group. Obsessionality is critical to our understanding of AN. This trait may also be relevant to lack of cognitive flexibility [63], attention to detail [64], global processing, and not being able to correctly ‘read’, understand and express emotions.
Footnotes
Declaration of interest
This work was supported by the NIHR Biomedical Research Centre for Mental Health, South London and Maudsley NHS Foundation Trust and Institute of Psychiatry, King's College London, and the ARIADNE programme (Applied Research into Anorexia Nervosa and Not Otherwise Specified Eating Disorders) funded by a Department of Health NIHR Programme Grant for Applied Research (Reference number RP-PG-0606-1043). The views expressed here are not necessarily those of the NIHR. The authors alone are responsible for the content and writing of the paper.