
Abstract
Normative studies are needed to obtain norms for comparing individuals with the reference population on relevant clinical or educational measures. Norms can be obtained in an efficient way by regressing the test score on relevant predictors, such as age and sex. When several measures are normed with the same sample, a multivariate regression-based approach must be adopted for at least two reasons: (1) to take into account the correlations between the measures of the same subject, in order to test certain scientific hypotheses and to reduce misclassification of subjects in clinical practice, and (2) to reduce the number of significance tests involved in selecting predictors for the purpose of norming, thus preventing the inflation of the type I error rate. A new multivariate regression-based approach is proposed that combines all measures for an individual through the Mahalanobis distance, thus providing an indicator of the individual’s overall performance. Furthermore, optimal designs for the normative study are derived under five multivariate polynomial regression models, assuming multivariate normality and homoscedasticity of the residuals, and efficient robust designs are presented in case of uncertainty about the correct model for the analysis of the normative sample. Sample size calculation formulas are provided for the new Mahalanobis distance-based approach. The results are illustrated with data from the Maastricht Aging Study (MAAS).
To classify individuals’ performance on relevant clinical or educational measures, such as neuropsychological tests or language tests, psychologists and educators need reference values or norms. Three examples of studies that provide normative data are Van der Elst et al. (2006), who derived norms for the three subtasks of the Stroop Color-Word Test, which is a general measure of cognitive flexibility and control, Van der Elst et al. (2011), who normed the Animal Verbal Fluency and the Design Fluency tests in school-aged children, which are aimed to assess vocabulary size and motor planning, respectively, and Dujardin et al. (2021), who provided reference values for several tests to assess vocabulary, reading, and spelling skills in university students.
Norms allow practitioners to directly compare a subject’s performance on a test with the reference population, that is, a group of individuals with the same characteristics deemed relevant for the norming (e.g., the same age and sex). What predictors make the comparison fair or, in other words, what determines the reference population, depends on the purpose of the test (e.g., diagnosis of dementia versus job selection), which is the first crucial choice in a normative study. The second important choice is that of the norming approach. In the traditional approach, after drawing a sample of subjects (i.e., the normative sample), the predictors defining the reference population are categorized and norms are derived within subgroups based on these categories. This approach has been methodologically surpassed by regression-based norming (Oosterhuis et al., 2016; Timmerman et al., 2021; Van Breukelen & Vlaeyen, 2005), which allows test developers to obtain more precise norms for a number of reasons. First, the regression-based approach is more efficient than traditional norming (Lenhard & Lenhard, 2021; Oosterhuis et al., 2016; Zhu & Chen, 2011) because the test score is modeled as a function of the predictors defining the reference population and the norms are estimated from the cumulative distribution of the test score conditional on the fitted norming model, without splitting the normative sample (Timmerman et al., 2021; Van Breukelen & Vlaeyen, 2005). Second, continuous predictors (e.g., age) do not need to be categorized, like in the traditional approach, thus allowing to obtain smoother and more granular norms than the traditional approach (see Figure 1 in Timmerman et al., 2021; Van Breukelen & Vlaeyen, 2005), that is, it is possible to derive norms for any combination of predictor levels within their range in the normative sample. Third, test developers can identify which predictors are actually related to the test score and provide norms based only on these predictors (Van Breukelen & Vlaeyen, 2005), in order to ensure efficient estimations of the norms (how to choose the candidate predictors in the norming context will be discussed in the next paragraph). For these three reasons, the regression-based approach is here adopted.
The Mahalanobis distance
In the specification of a model for norming purposes, one should include, in the list of candidate predictors, only those variables that define the reference population as following from the purpose of the test (Timmerman et al., 2021). When adjusting for all possible predictors that are related to the outcome variable, this may alter the interpretation of the norms. For example, if performance on the Stroop test is known to decline with age and to differ between sexes and educational levels in the cognitively intact population (see, for instance, Van der Elst et al., 2006), then the question of whether to control for all these predictors or only for some of them, or even for none, depends on the intended use of the Stroop test. If the purpose of the Stroop test is to diagnose dementia, then patients’ performance on this test should be compared with the performance of subjects of the same age, sex, and education. But if the Stroop test is used for selecting job applicants, the question becomes which score is more predictive of future job performance, the unadjusted test score, or the score adjusted for one or more of the above predictors. In the initial selection of the candidate predictors, any available prior knowledge about similar tests can be of valuable help, such as the meta-analytic evidence about the relationship between several neuropsychological tests and demographic factors provided by Mitrushina et al. (2005). Furthermore, one should in general not adjust for predictors that can be affected by the trait measured by the test, such as educational level in intelligence testing. There are exceptions to this, for instance, if an intelligence test is used to diagnose cognitive decline instead of to establish a person’s IQ. Finally, one can control for higher order terms (i.e., interactions, nonlinear effects) obtained as a combination of the candidate predictors. Model selection strategies can then be used to identify which predictors, among those defining the reference population and their higher order terms, are significantly related to the outcome variable to ensure efficient estimation of the norms.
Now, normative studies often provide reference values for several tests and questionnaires. In a literature review of 65 regression-based normative studies, Innocenti et al. (2023) found that 54 studies (83%) derived norms for at least two tests or subscales of the same questionnaire and that norms were derived from separate univariate analyses based on the same sample. However, fitting a regression model for each test or subscale has (at least) three weaknesses (Van der Elst et al., 2017). First, the correlation between test scores of the same subject is taken into account neither in the model selection, which entails that regression coefficients cannot be tested across outcome variables (Johnson & Wichern, 2007), nor in norming because the subject’s performance on each test is assessed independently of the other tests. The possible consequence of this limitation is twofold: (1) researchers cannot test some relevant scientific hypotheses, such as the presence of a trial by demographics interaction in multitrial memory studies (Espenes et al., 2023; Van der Elst et al., 2017), and (2) incorrect classification of subjects in clinical practice. Indeed, normative comparisons using the correlation between outcome variables have been shown to yield higher sensitivity in detecting cognitive impairment in HIV infection (Su et al., 2015) and higher sensitivity and specificity in predicting progression to Parkinson’s disease dementia (Agelink van Rentergem et al., 2019). A second limitation of the univariate approach is that the number of significance tests of the predictor effects increases with the number of outcome variables. This increases the risk of type I errors in deciding whether or not to include, say, an interaction of age and sex, into the norming. A third disadvantage of fitting as many regression models as outcomes is that this approach becomes practically more cumbersome as the number of tests to be normed increases and may lead to a different model per outcome, which can be confusing for the application of norms.
To avoid these issues, Van der Elst et al. (2017) proposed to use multivariate multiple regression, which allows to norm several tests with a single model under the assumption of multivariate normality and homoscedasticity of the residuals. However, in Van der Elst et al. (2017)’s multivariate regression-based approach, once the parameters of the multivariate regression model have been estimated, each test is normed separately, just like in univariate regression-based norming. Within the framework of traditional norming, Huizenga et al. (2007) have proposed two multivariate approaches: (1) applying a Bonferroni correction when determining the cutoff for classifying subjects’ performance on each test separately or (2) summarizing subjects’ multivariate performance with Hotelling’s T 2 statistic, which makes use of the covariance between each pair of tests. To facilitate the application of multivariate norming by practitioners, de Vent et al. (2016) have developed the Advanced Neuropsychological Diagnostics Infrastructure (ANDI), a database storing scores on several neuropsychological tests of healthy participants from several studies conducted in the Netherlands and Flemish Belgium. A multivariate regression-based approach using the ANDI database has been developed by Agelink van Rentergem et al. (2017), who combined Hotelling’s T 2, proposed by Huizenga et al. (2007), with a multivariate random intercept model to account for differences in test scores between the different studies in the database. The first goal of this article is to propose a new multivariate regression-based approach that is based on multivariate linear regression, as in Van der Elst et al. (2017), and on a multivariate norm statistic for classifying subjects’ performance, similarly to Huizenga et al. (2007) and Agelink van Rentergem et al. (2017). However, here the Mahalanobis distance is used as multivariate norm statistic. The Mahalanobis distance can be seen as a multivariate Z-score and Hotelling’s T 2 is a multivariate version of Student's t-statistic, so Hotelling’s T 2 is expected to outperform the Mahalanobis distance in terms of subjects’ classification in small samples, but no substantial differences are expected for large sample sizes, which are required for ensuring the stability of the norms anyway. Furthermore, deriving the optimal design of a normative study is easier if norms are based on the Mahalanobis distance than on Hotelling’s T 2 because the variance of the Mahalanobis distance depends on the sample size and the predictors for norming in a much less complicated way than the variance of Hotelling’s T 2, as has been derived in section 1.2 of the Online Supplement A.
The quality of test norms depends not only on the statistical methods used for analyzing the test data from the normative sample but also on the size and composition of the normative sample. To the best of our knowledge, there are no guidelines on how to determine the required sample size for multivariate norming. Indeed, the literature on sample size calculation for normative studies has focused only on univariate norming (Innocenti et al., 2023; Oosterhuis et al., 2016, 2017). Specifically, Oosterhuis et al. (2016) obtained sample size guidelines for percentile estimation under the traditional and the regression-based approach, assuming a quantitative and a qualitative predictor in their simulations. Sample size calculation for several norm statistics (e.g., Z-score, percentile rank score, stanines) can also be made under the traditional approach, by using the standard error formulas derived by Oosterhuis et al. (2017). This latter approach leads to the sample size per subgroup (e.g., per age group per sex), as the formulas do not allow for covariates. Innocenti et al. (2023) have derived the optimal design of the normative study for five univariate linear regression models with a qualitative and a quantitative predictor and proposed a sample size calculation procedure, such that individuals’ positions relative to the derived norms (i.e., univariate Z-scores and percentile rank scores) can be assessed with prespecified power and precision. In Innocenti et al. (2023), the optimal design was defined as the joint distribution of the predictors included in the norming model (i.e., the design of the normative study) that maximizes the precision of estimation of the desired norm statistics. The second goal of this article is to derive sample size calculation and optimal design for multivariate regression-based norming, thus extending Innocenti et al. (2023) to the multivariate case.
This article is structured as follows. First, a new multivariate regression-based approach, based on the Mahalanobis distance, is proposed and compared with that of Van der Elst et al. (2017) and that based on Hotelling’s T 2 statistic. Second, optimal and robust designs are derived both for Van der Elst et al.’s (2017) approach and for the present approach. Third, a sample size calculation is developed for the proposed Mahalanobis distanced-based approach. The obtained results are illustrated through Van der Elst et al.’s (2006) normative study of the Stroop Color-Word Test in the application section, where the proposed multivariate approach is compared with that of Van der Elst et al. (2017) and that based on Hotelling’s T 2 statistic. Finally, some concluding remarks are made. Online Supplement A presents the mathematical derivations of the results given in this article and additional figures related to the application section. The R codes (R Core Team, 2021) to find efficient designs that are robust against misspecification of the norming model, and to compute the required sample size, are given in Online Supplement B (https://github.com/FInnocenti-Stat/Multivariate-Norming).
Multivariate Regression-Based Norming
Multivariate Regression Models for Norming
To derive the norms for P tests (e.g., the scores on the three Stroop subtasks), a normative sample of N individuals is drawn from the reference population. The raw scores of the N individuals (

where

which assumes the following: (i) The design matrix is the same for all P test scores, that is, that (ii) Individuals are sampled independently of each other (i.e., the P residual errors for individual i, (iii) Multivariate homoscedasticity, that is, the variance-covariance matrix of the residual errors is the same for all individuals (i.e., (iv) Multivariate normality of the residual errors (i.e.,
Note that, under model (2), test scores of different individuals are uncorrelated, like under model (1), but scores on different tests of the same individual can be related with correlation
Having estimated
Competing Approaches to Multivariate Regression-Based Norming
To translate the P test scores, (1) Fit the multivariate model in Equation 2, thus obtaining
For the new individual, not part of the normative sample, compute the P-dimensional vectors of (2) predicted scores: (3) residuals: (4) Z-scores: (5) Convert the P Z-scores into percentile rank scores using the standard normal cumulative distribution.
So, Van der Elst et al.’s (2017) approach yields a separate set of norms for each test, like in the univariate approach, and a psychologist or an educator can use these norms to determine on which test a subject has an “abnormal” performance. However, unless the subject’s performance is fairly consistent across all administered tests (e.g., always close to the average or always below the average), it is not straightforward how to combine their P Z-scores to evaluate their overall performance. For instance, can the overall performance on the Stroop Color-Word test be classified as “abnormal,” if a subject has Z-score

which can be seen as a multivariate Z-score (note that, for (4) Compute the Mahalanobis distance value for the new subject not included into the normative study: (5) Convert the Mahalanobis distance
To distinguish between “abnormal” and “normal” performance based on
While Van der Elst et al.’s (2017) approach leads to as many norm statistic values as tests for a given testee (or: person tested), the Mahalanobis distance-based approach provides a single norm statistic value for all P tests, thus yielding a general overview of an individual’s condition (i.e., performance/symptoms). Likewise, the approach of Huizenga et al. (2007) and Agelink van Rentergem et al. (2017) is based on a multivariate statistic, that is, Hotelling’s T
2, which is closely related to the Mahalanobis distance, because
Classification Rules to Combine P Z-Scores
To compare the Mahalanobis distance-based approach with Van der Elst et al.’s (2017) approach in terms of the assessment of the overall performance, we propose to apply a classification rule to the P Z-scores obtained with Van der Elst et al.’s (2017) approach. At least two classification rules can be considered: An individual’s performance/symptoms could be classified as “abnormal” when

or

An example of the disjunctive rule is the Frascati criterion that defines a cognitive domain as abnormal if at least one test is 1 standard deviation below the mean (Su et al., 2015). The conjunctive rule can be used, for instance, as a criterion to recommend knee surgery to elderly persons if they score too low on a physical function scale (e.g., the Short Physical Performance Battery, see Bergland & Strand, 2019) and too high on a fear of falling questionnaire (e.g., the Fall Efficacy Scale-International, see Kempen et al., 2007).
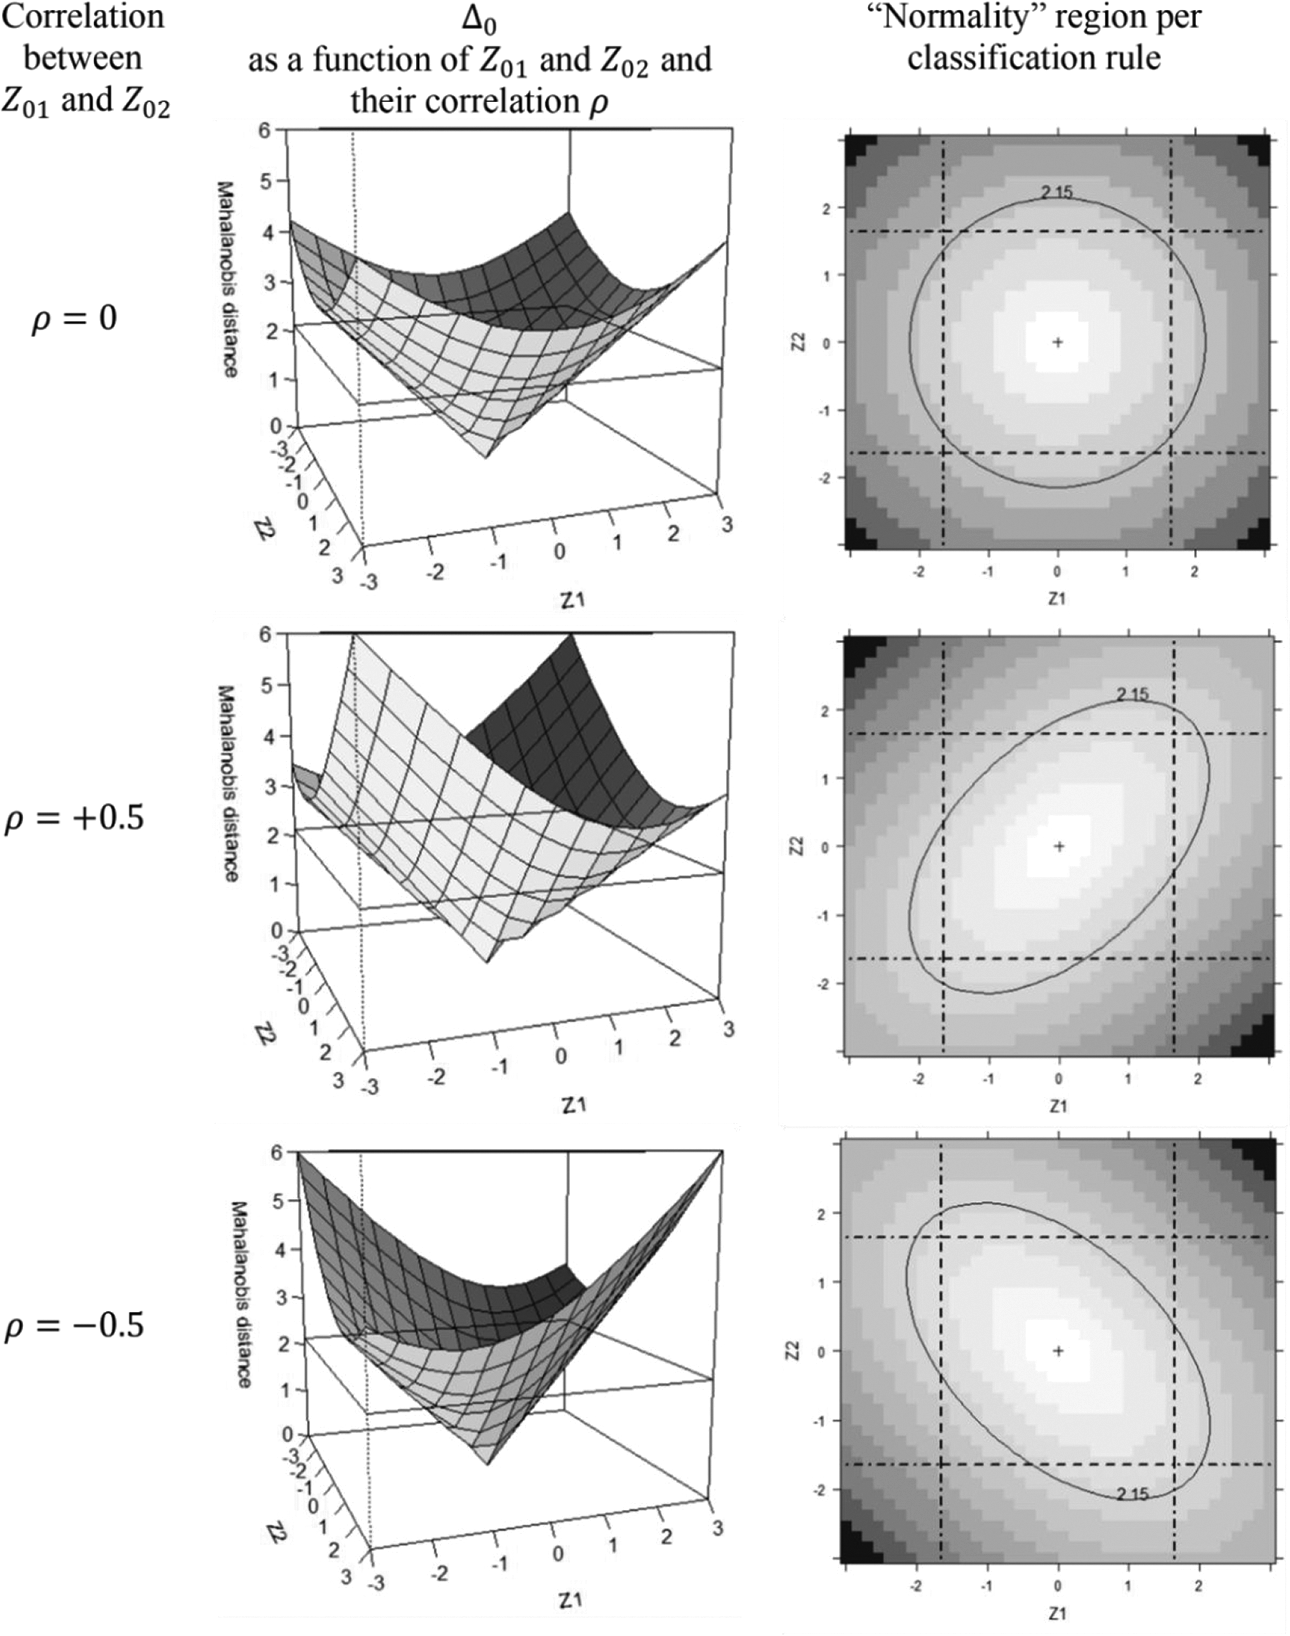
Unlike the disjunctive and conjunctive rule, the Mahalanobis distance is a classification rule that not only takes into account the P Z-scores but also their pairwise covariances/correlations through
The three classification rules (i.e., Equations 3–5) are also compared in Figure 1 (rightmost column), which is composed of three panels, one for each
Sampling Variances of the Norm Statistics
The two norming approaches presented in the previous section are based on two different norm statistics: Van der Elst et al.’s (2017) approach is based on the Z-score, while the approach proposed here is based on the Mahalanobis distance. In both cases, the norm statistic is estimated by using
Using the delta method (Casella & Berger, 2002, p. 245), it can be shown that (see Online Supplement A, section 1)
The sampling distribution of
The formulas in Table 1 are approximations, with the exception of Equations 6 and 11. Indeed, the delta method is a large-sample approximation, and thus, a simulation study was performed to investigate the accuracy of the formulas in Table 1 as a function of the sample size, with the final goal of determining the smallest sample size for which the accuracy was satisfactory (i.e., defined as a relative bias no larger than 5%). The factors considered in the simulation study were the sample size, the variance–covariance matrix
As shown in Table 1,
Norm Statistics and Their Variances and Covariances
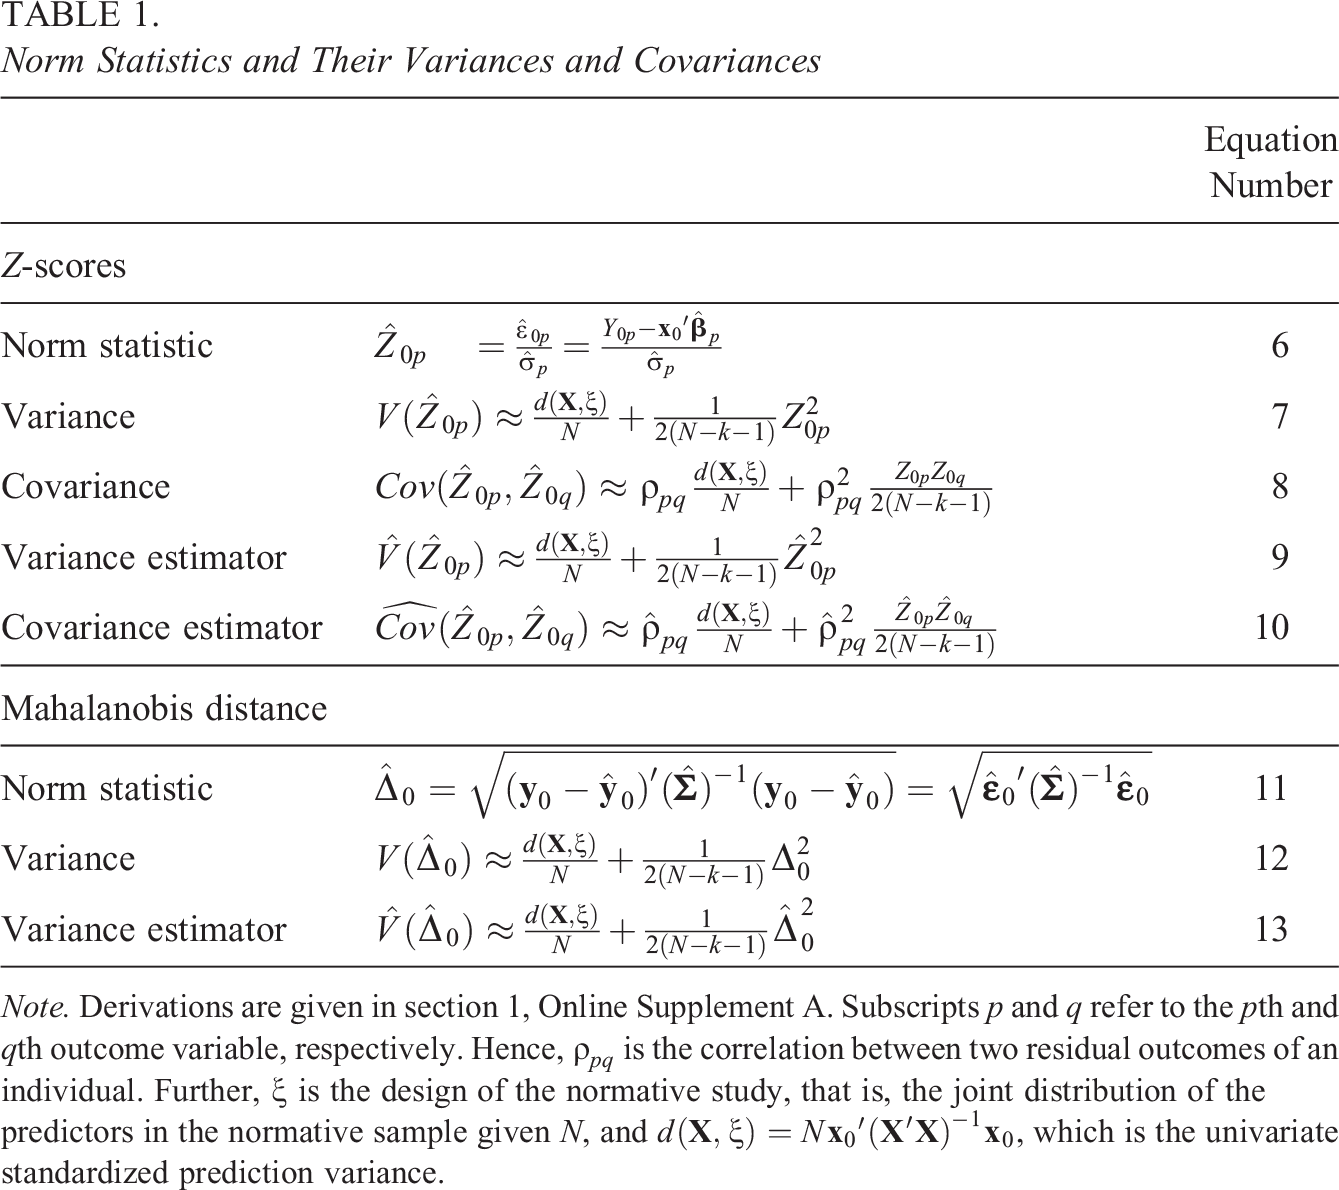
Note. Derivations are given in section 1, Online Supplement A. Subscripts p and q refer to the pth and qth outcome variable, respectively. Hence,
Optimal and Robust Design for Optimizing Precision of Norms Estimation
In this section, the optimal design that maximizes the precision of Z-score and
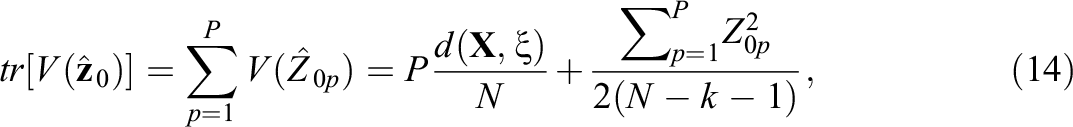
which follows from Equation 7. Instead, the precision of
We restricted ourselves to polynomial regression models allowing at most for quadratic effects, because such models are commonly found in normative studies (for univariate normative studies, see Innocenti et al., 2023, Online Supplement A, and for multivariate normative studies, see Espenes et al., 2023, and Van der Elst et al., 2017). Hence, Table 2 shows the optimal designs for five multivariate polynomial regression models, which differ on whether they allow for interactions and/or quadratic effects but, being special cases of model (2), they all make the same assumptions (i) through (iv). Denote by X
1 the quantitative predictor, and X
2 the qualitative predictor with Q
2 levels. Two literature reviews indicated that age and sex (and education) are the most frequent predictors in normative studies (Innocenti et al., 2023; Oosterhuis et al., 2016), so from now on
As can be seen in Table 2, the number of age levels in the optimal design depends on the degree of the polynomial effect of age: Two levels are required for estimating a linear effect and its interaction (i.e., first and third row), and three levels are needed for estimating a quadratic age effect (i.e., second, fourth, and fifth rows). Furthermore, the optimal design is balanced, that is, each support point (i.e., age–sex combination) has the same sample size (or design weight), the only exception being the optimal design in the fourth row. The optimal design in the fourth row gives equal weight to age levels −1 and 1 (thus allowing the estimation of the linear age effect and its interaction with sex) and a smaller weight to age level 0 (which is needed for estimating the quadratic effect). This can be understood by noting that the model in the fourth row is a combination of the models in the second and third rows, which leads to an optimal design which is a compromise between the optimal designs in the second and third rows.
A limitation of the optimal design, such as those in Table 2, is that it depends on the assumed regression model, but the “true” model (i.e., the best fitting polynomial) is often unknown at the design stage. To deal with model uncertainty at the design stage, there are (at least) two strategies, differing in the criterion by which a design is identified as the most robust against misspecification of the model. The first strategy is based on the maximin efficiency criterion, that is, the most robust design is that design which maximizes the minimum efficiency across all plausible “true” models (e.g., the five models in Table 2). Efficiency is defined as
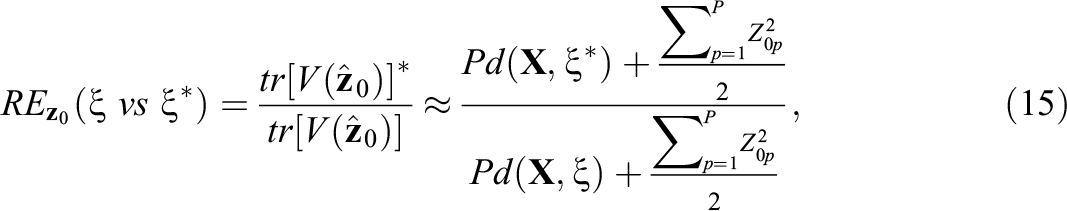
under Van der Elst et al.’s (2017) approach, and as
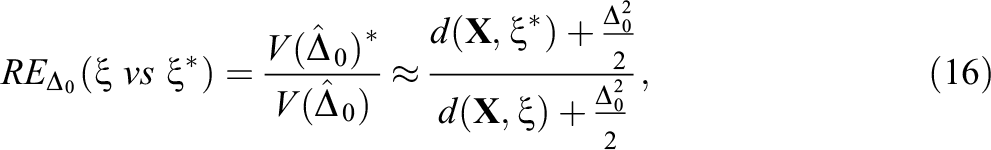
under the Mahalanobis distance-based approach. The interpretation of RE is the same for both definitions (Equations 15 and 16): Based on a sample of
Models and Corresponding Optimal Designs That Maximize the Precision of
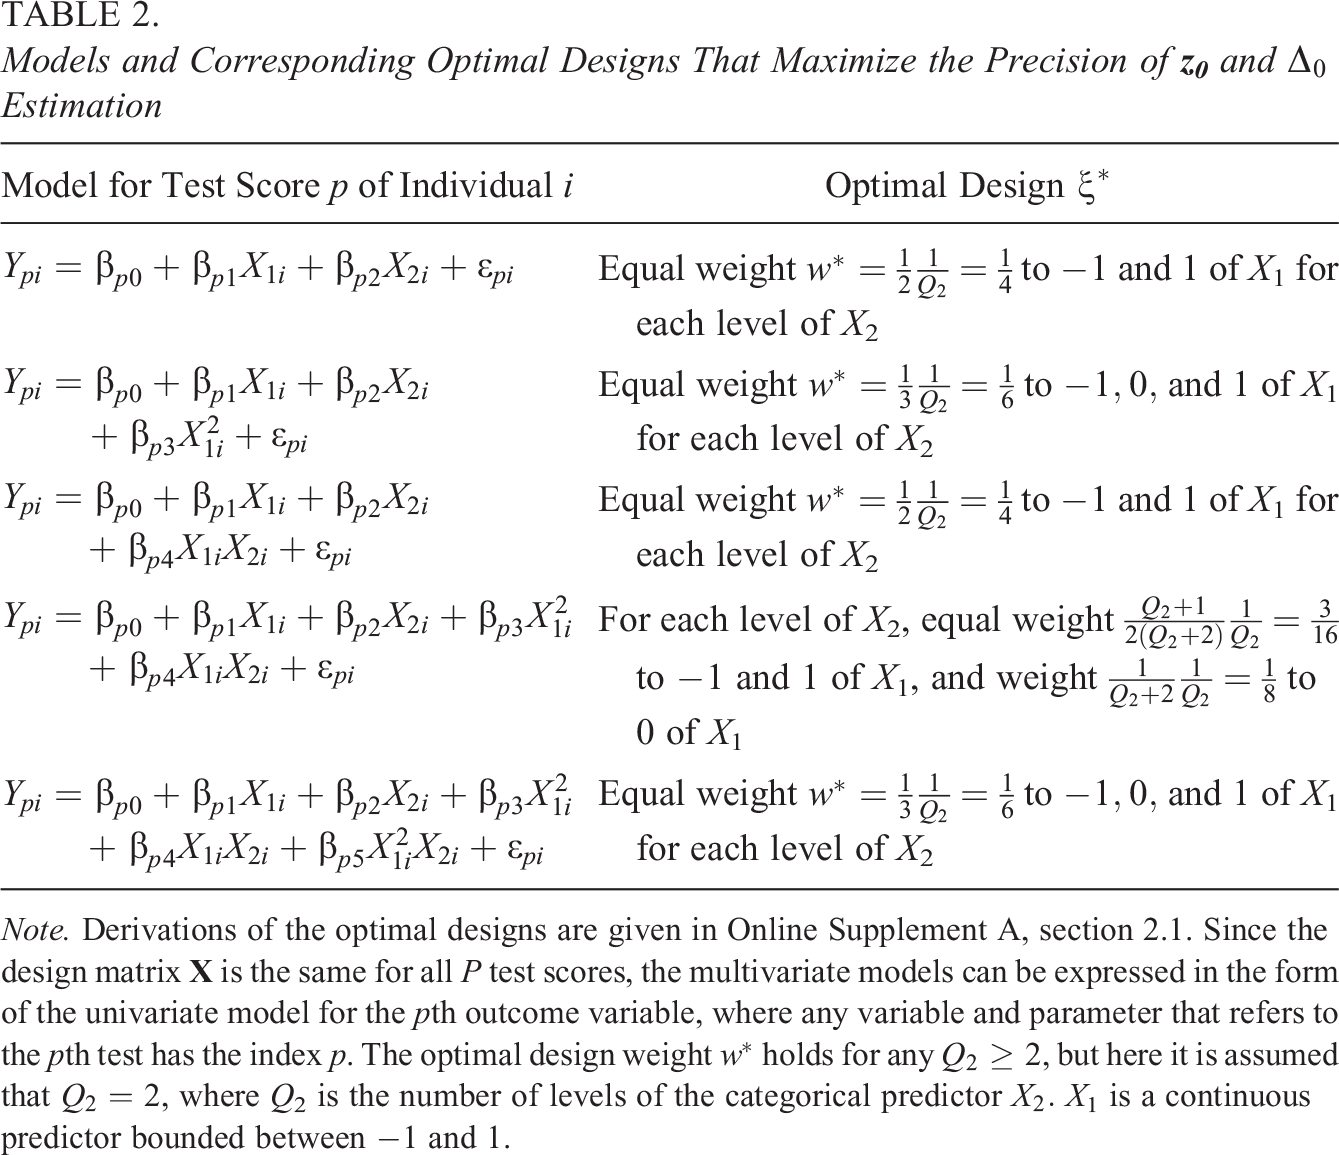
Note. Derivations of the optimal designs are given in Online Supplement A, section 2.1. Since the design matrix
Sample Size Calculation for the Mahalanobis Distance-Based Approach
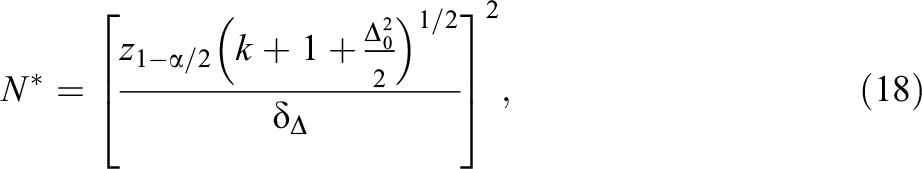
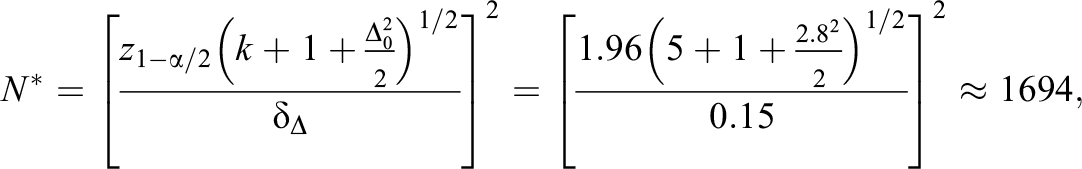
In practice, norms are used to classify individuals’ performance or symptoms to make important decisions (e.g., the assignment of a student to remedial teaching). This classification problem can be formalized in a hypothesis testing framework, and a sample size calculation procedure can be developed to ensure that the size of the normative sample is sufficiently large to have enough power for properly classifying individuals (Innocenti et al., 2023). Suppose that (1) Choose the norming model, the cutoff point (2) Compute the required sample size with the following equation (for proof, see Online Supplement A, section 3.1):
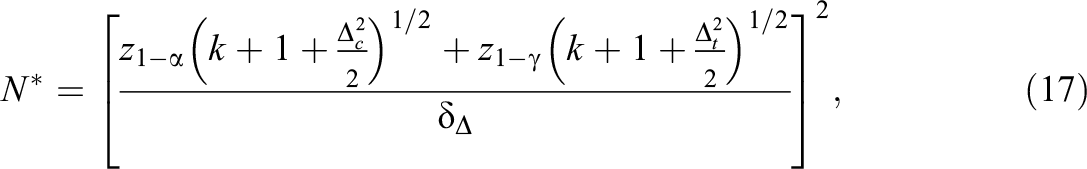
where
As can be seen in Equation 17 and in Figure 2,
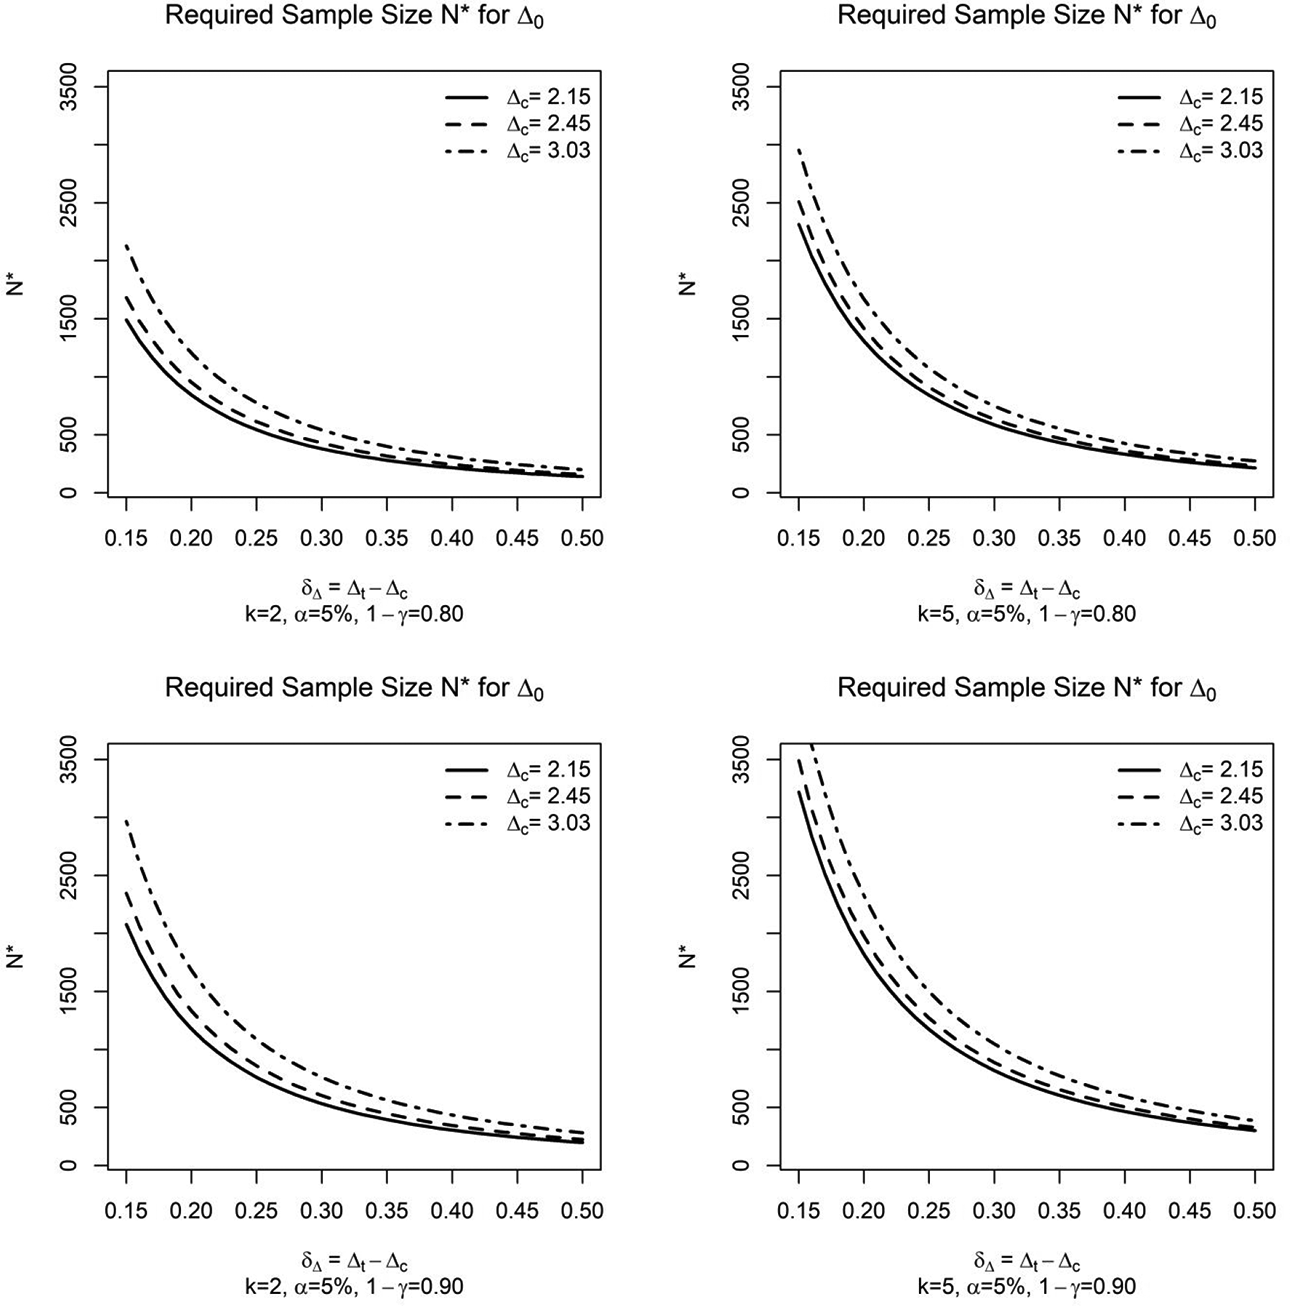
Required sample size
An alternative approach to sample size calculation is to focus on the precision of parameter estimation instead of power for hypothesis testing (see Maxwell et al., 2008 and references therein). This approach consists in choosing the
which is obtained by replacing
Application
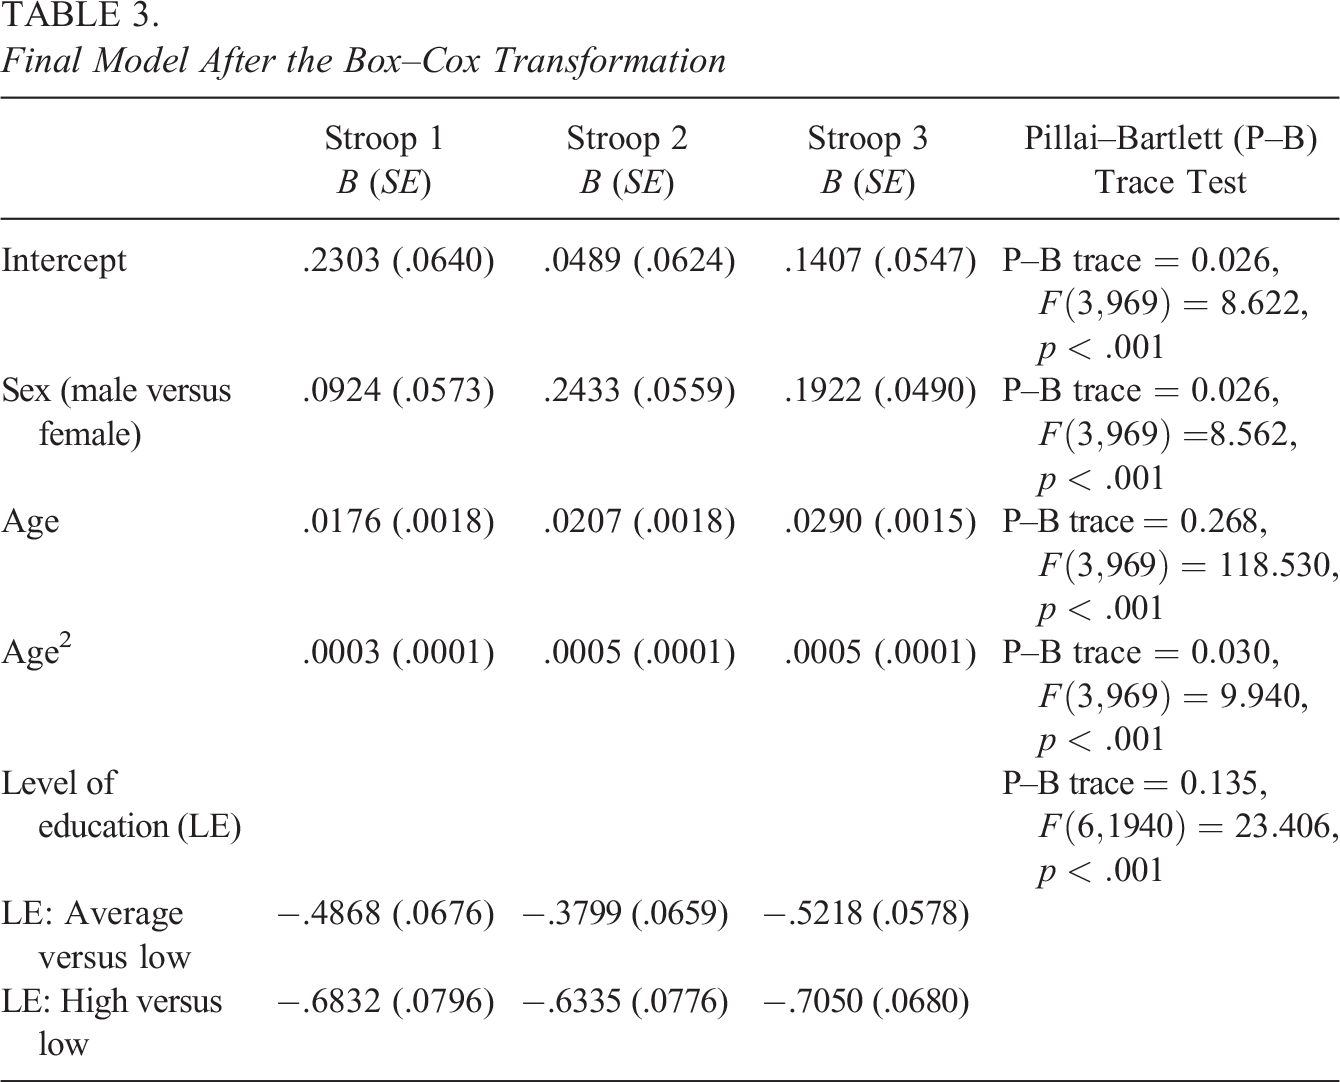
In this section, the results of this article are illustrated using Van der Elst et al.’s (2006) normative study of the Stroop Color-Word Test. This test is composed of three subtasks: A subject is asked to read 100 color words (i.e., red, blue, yellow, green) printed in black ink (Subtask 1), then to name the colors shown in 100 solid patches (Subtask 2), and finally to name the ink color of 100 color words printed in an incongruent ink color (e.g., the word “blue” printed in green; Subtask 3), as fast and accurately as possible. The outcome variable is the time (seconds) to complete each subtask. Additional outcome variables (not considered here) could be the number of not-self corrected errors and\or interference scores (for details, see Stroop-ANDI-Norms, 2020; Van der Elst et al., 2006). The rationale of this test is that the time to complete a subtask increases with the complexity of the task, that is, when moving from Subtask 1 toward Subtask 3 (Dyer, 1973). Poor performance on the Stroop test has been shown to be associated with several brain pathologies and disorders, such as discrete frontal lobe lesions and schizophrenia (Mitrushina et al., 2005). Furthermore, there is consistent evidence that performance on the Stroop test declines with age, but inconclusive evidence about the effect of sex and education (Mitrushina et al., 2005). Both Van der Elst et al. (2006) and Stroop-ANDI-Norms (2020) derived norms for the Dutch version of the Stroop test adjusting for age, sex, and education. Since the selection of the candidate predictors for a norming model should be dictated by the test’s purpose, we assume here that the Stroop test will be used to uncover brain pathologies. Thus, we will control for age, sex, and education, and their possible interactions and nonlinear effects.
The results of this article are illustrated with a subsample of Van der Elst et al.’s (2006) data (i.e., 1,000 subjects out of 1,856), which were derived from the Maastricht Aging Study (MAAS), a prospective study into the determinants of cognitive aging (Jolles et al., 1995):
Multivariate normality (see Table S.A.6, Online Supplement A): Following Mecklin and Mundfrom (2005), this assumption was checked by inspecting the univariate distributions of the residuals (with normal QQ-plots, univariate skewness and kurtosis, and Shapiro–Wilk tests), and the bivariate and trivariate distributions of the residuals (with χ2 QQ-plots, Mardia’s [1970] measure of multivariate skewness and kurtosis, and Royston and Henze–Zirkler tests).
Multivariate homoscedasticity: Homogeneity of the variance–covariance matrix of the residuals,
Linearity: For sex and educational level, the assumption was satisfied since dummy variables were used, while it was relaxed for age by adding a quadratic term.
No influential outliers: Univariate outliers were identified by inspecting the studentized deleted residuals on each Stroop subtask, and multivariate outliers were identified by checking the Mahalanobis distance of the residuals (Johnson & Wichern, 2007). The influence of the outliers was assessed by checking Cook’s distances, but all observations had a Cook’s distance below 1.
No multicollinearity: Multicollinearity was assessed by computing variance inflation factors (Harrell, 2015), which were below 10 for all the predictors.
which means that
Final Model After the Box–Cox Transformation
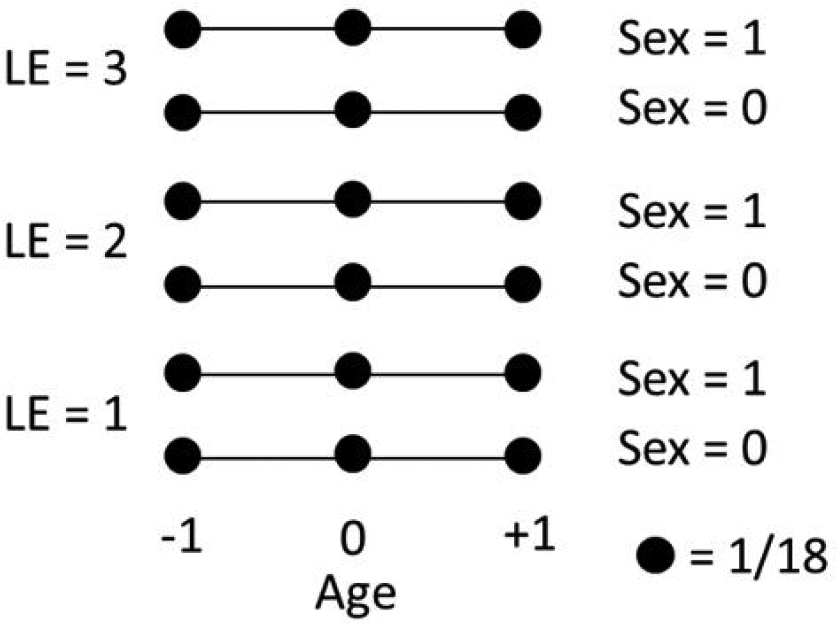
Optimal design for the norming model in Table 3.
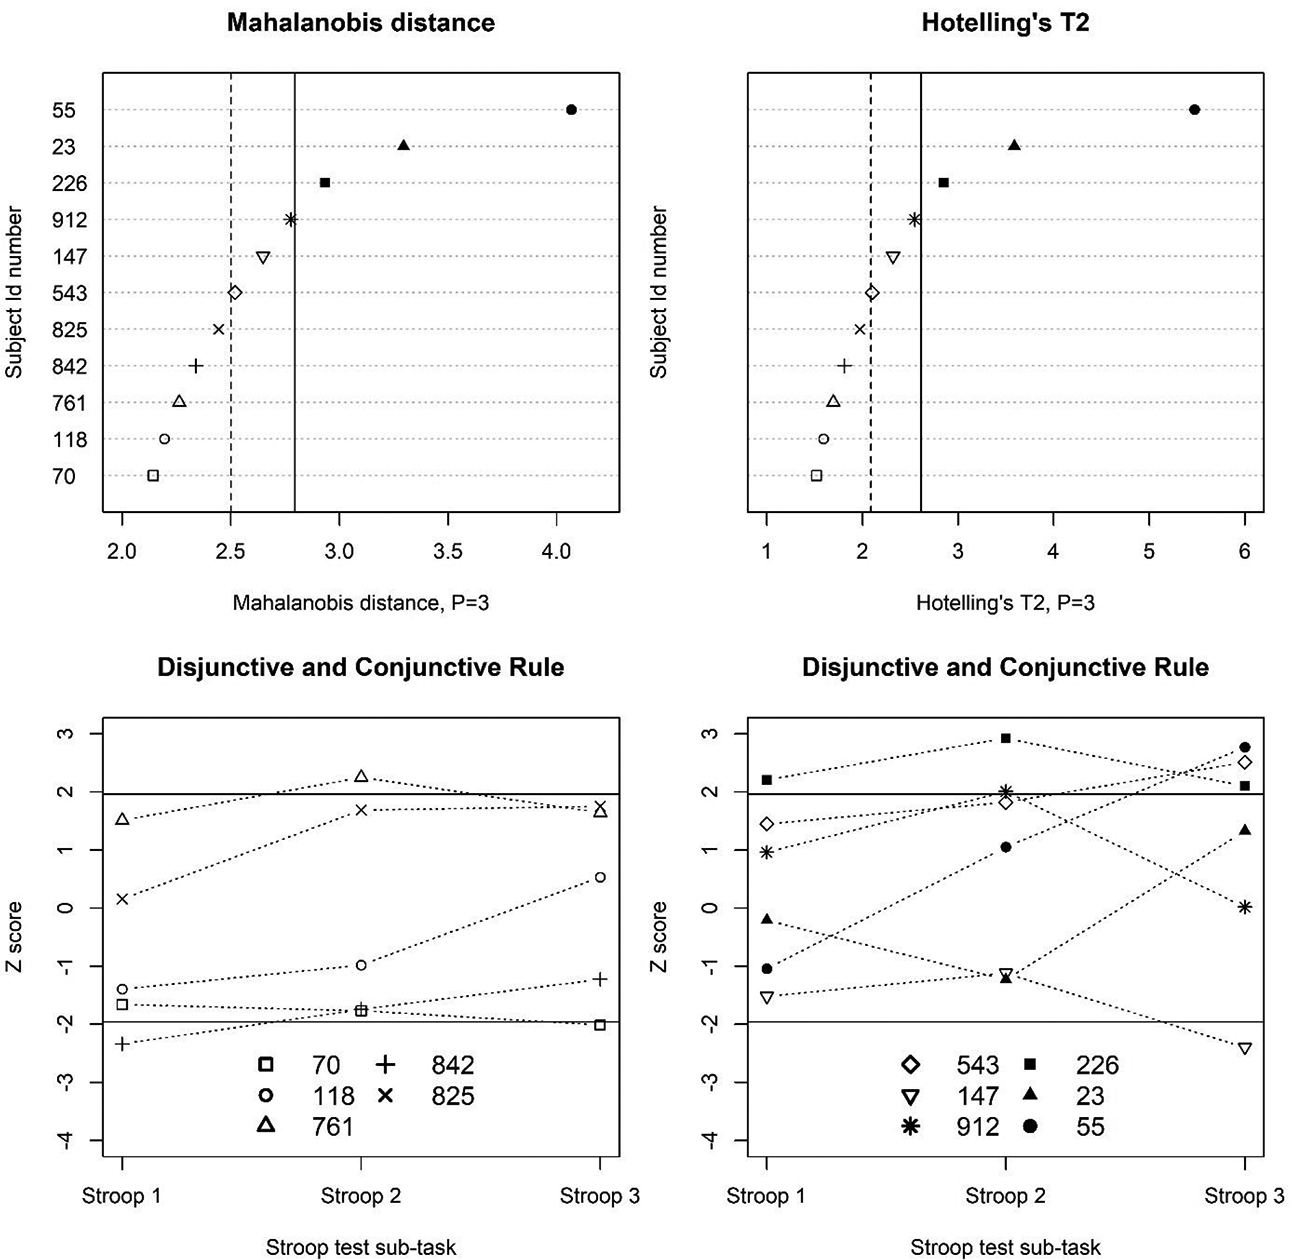
Classification of the multivariate performance of 11 profiles based on the Mahalanobis distance (top-left panel), Hotelling’s T2 statistic (top-right panel), and the disjunctive and conjunctive rule (bottom panels). In the top panels, the 90th and 95th percentile of the
Discussion
For multivariate normative studies, Van der Elst et al. (2017) proposed to use multivariate regression to take into account the correlation between the test scores of the same individual when testing hypotheses about the regression coefficients in the norming model, thus reducing the number of such tests and preventing the inflation of the type I error rate. However, this approach was multivariate only in the norming model because norms were derived separately for each test, like in the univariate regression-based approach, which makes it difficult to evaluate the overall performance of a subject across all administered tests. A new multivariate approach that targeted subject’s overall performance was therefore proposed in this article. This new approach relies on multivariate regression to identify which predictors (among those defining the reference population given the test’s purpose and their higher-order terms) are related to the outcomes, like in Van der Elst et al. (2017), but then summarizes all test scores of an individual with the Mahalanobis distance, which is a multivariate Z-score. Agelink van Rentergem et al. (2017) developed a third multivariate approach based on multilevel multivariate regression and Hotelling’s T 2, which is a multivariate t-statistic. It turned out that the Mahalanobis distance and Hotelling’s T 2 yield similar classifications for a sufficiently large normative sample (Figure 4). Thus, the main difference between the approach developed here and that of Agelink van Rentergem et al. (2017) is that the former guides researchers from the design of the normative study to the derivation of the norms, while the latter can be applied when data from different studies are already available and can be combined to establish the norms.
To compare these approaches, two classification rules combining the P Z-scores obtained with Van der Elst et al.’s (2017) approach were proposed, namely, the disjunctive rule, which classified as “abnormal” a profile with at least one extreme Z-score relative to the chosen cutoff for decision-making, and the conjunctive rule, for which “abnormality” was defined as having extreme Z-scores on all tests. It turned out that the conjunctive rule was the most conservative definition of “abnormality,” the disjunctive rule was the most liberal, and the Mahalanobis distance and Hotelling’s T 2 were in-between these two extremes (Figure 4). Unlike the conjunctive and disjunctive rule, the Mahalanobis distance and Hotelling’s T 2 take the correlation between Z-scores of the same subject into account, thus identifying “abnormality” as an unlikely profile (given the correlation sign) and not merely as a profile with extreme Z-scores. However, the Mahalanobis distance and Hotelling’s T 2 are two-tailed criteria (i.e., not distinguishing between scoring high or scoring low on all tests), while in practice, one is often interested in one-tailed comparisons (e.g., comparing “normal” with “too low”). A solution can be to take the 90th percentile instead of the 95th percentile as the cutoff for decision-making, and if a profile is classified as “abnormal,” to examine the signs of the Z-scores to decide if a person is “abnormally” low or “abnormally” high in performance.
Sampling variance formulas were derived for the Z-score and the Mahalanobis distance using the delta method; hence, these formulas are approximations. A paper on details of the simulation study that examines the accuracy of these formulas is in progress, both for
For the Mahalanobis distance-based approach, a sample size calculation procedure was proposed, such that individuals’ positions relative to the derived norms could be assessed with prespecified power, for hypothesis testing, or prespecified margin of estimation error, for interval estimation. This procedure allows to determine the required sample size for the optimal design of the normative sample, assuming that the individual to whom the norms will be applied has as predictor values a support point of the optimal design. This is a safe approach because for other predictor values, the sampling variance of the Mahalanobis distance is smaller and then the power is larger. When several cutoff values are of interest, for instance, because the psychologist/educator wants to distinguish between “normal,” “borderline-normal,” and “abnormal” performance, one should use the most extreme cutoff value in the sample size calculation, as illustrated in the application section, because the sampling variance of the Mahalanobis distance is an increasing function of the value of the norm statistic. A sample size calculation procedure for Van der Elst et al.’s (2017) approach is a topic for future research, because controlling the familywise type I and II error rates is complicated, except for the rather unrealistic case of independence between the P Z-scores for the tested person, which is covered in section 3.2 of the Online Supplement A. Future research can also investigate how to determine the sample size for Agelink van Rentergem et al.’s (2017) approach regarding data from multiple studies, for which a good starting point could be methods to compute the sample size for meta-analyses (see Valentine et al., 2010).
The results of this article are restricted by the assumptions underlying model (2), namely, multivariate normality and homoscedasticity of the residuals, and linearity of the predictors’ effects. These assumptions also underly the approaches of Van der Elst et al. (2017) and Agelink van Rentergem et al. (2017). Since the validity of the norms derived with these approaches depends on these assumptions, it is crucial that researchers check the assumptions and report the results of the diagnostic analyses. In the application, it was shown how these assumptions can be checked and simple methods to repair their violations were illustrated. For instance, multivariate normality and homoscedasticity could be achieved after a transformation of the test scores, such as the Box–Cox transformation (de Vent et al., 2016; Johnson & Wichern, 2007; Velilla, 1993). However, future research is indeed needed to develop a multivariate regression-based approach under nonnormality and heteroscedasticity. Starting points for this extension could be those approaches that gave promising results in the univariate case, such as generalized additive models for location, scale, and shape (Timmerman et al., 2021) or semi-parametric approaches, such as quantile regression (Sherwood et al., 2015) and cNORM (Lenhard et al., 2018; Lenhard & Lenhard, 2021). Nonlinearity was here handled by adding a quadratic term for the continuous predictor (e.g., age), but the optimal designs in Table 2 can be extended to more complex nonlinear trends by considering higher order polynomials for which optimal designs are known in the literature (see Berger & Wong, 2009). Although polynomial regression models are easy to implement, they can show undesirable nonlocal behaviors (Magee, 1998), that is, the predicted outcome value in a region of the predictor (e.g., 20 ≤ age ≤ 25) can be affected by the observed outcome value in a different region of the predictor (e.g., 45 ≤ age ≤ 50). This issue can be prevented by using more flexible methodologies such as restricted cubic splines (Harrell, 2015).
In many practical situations, it is important to evaluate individual’s performance/symptoms over time, for instance, to monitor the progress of a rehabilitation or tutorial program. When a test is repeatedly administered to an individual, the test scores are correlated. Treating repeated measures as multiple outcomes, normative data can be derived through a multivariate regression (Van der Elst et al., 2013, 2017). For a given number of measurements and a given spacing of those measurements, the designs in Table 2 are also optimal for repeated individual’s performance/symptoms assessment. Finding the optimal number of time points and their spacing could be a topic for future research (see, for instance, Winkens et al., 2005). Future research could also compare the Mahalanobis distance-based approach for norming repeated measures of the same test with the univariate approaches presented by Gu et al. (2021), both in terms of the consequences for norming and the required sample sizes. Furthermore, the regression-based approach could be extended to multilevel populations (e.g., to norm educational tests in children nested within schools). Finally, Voncken et al. (2020) and Wang et al. (2020) developed more sophisticated univariate regression-based approaches within the Bayesian inferential framework that future research could extend to the multivariate case.
Supplemental Material
Supplemental Material, sj-docx-1-jeb-10.3102_10769986231210807 - Sample Size Calculation and Optimal Design for Multivariate Regression-Based Norming
Supplemental Material, sj-docx-1-jeb-10.3102_10769986231210807 for Sample Size Calculation and Optimal Design for Multivariate Regression-Based Norming by Francesco Innocenti, Math J. J. M. Candel, Frans E. S. Tan and Gerard J. P. van Breukelen in Journal of Educational and Behavioral Statistics
Supplemental Material
Supplemental Material, sj-docx-2-jeb-10.3102_10769986231210807 - Sample Size Calculation and Optimal Design for Multivariate Regression-Based Norming
Supplemental Material, sj-docx-2-jeb-10.3102_10769986231210807 for Sample Size Calculation and Optimal Design for Multivariate Regression-Based Norming by Francesco Innocenti, Math J. J. M. Candel, Frans E. S. Tan and Gerard J. P. van Breukelen in Journal of Educational and Behavioral Statistics
Footnotes
Appendix
Acknowledgments
The authors would like to thank Dr. Martin van Boxtel, School for Mental Health and Neuroscience of Maastricht University, for the use of the Maastricht Aging Study (MAAS) data.
Declaration of Conflicting Interests
The authors declared no potential conflicts of interest with respect to the research, authorship, and/or publication of this article.
Funding
The authors received no financial support for the research, authorship, and/or publication of this article.
References
Supplementary Material
Please find the following supplemental material available below.
For Open Access articles published under a Creative Commons License, all supplemental material carries the same license as the article it is associated with.
For non-Open Access articles published, all supplemental material carries a non-exclusive license, and permission requests for re-use of supplemental material or any part of supplemental material shall be sent directly to the copyright owner as specified in the copyright notice associated with the article.