
Abstract
The use of neuroimaging examinations is crucial in Alzheimer’s disease (AD), in both research and clinical settings. Over the years, magnetic resonance imaging (MRI)–based computer‐aided diagnosis has been shown to be helpful for early screening and predicting cognitive decline. Meanwhile, an increasing number of studies have adopted machine learning for the classification of AD, with promising results. In this review article, we focus on computerized MRI‐based biomarkers of AD by reviewing representative studies that used computerized techniques to identify AD patients and predict cognitive progression. We categorized these studies based on the following applications: (1) identifying AD from normal control; (2) identifying AD from other dementia types, including vascular dementia, dementia with Lewy bodies, and frontotemporal dementia; and (3) predicting conversion from NC to mild cognitive impairment (MCI) and from MCI to AD. This systematic review could act as a state‐of‐the‐art overview of this emerging field as well as a basis for designing future studies.
1 Introduction
Alzheimer’s disease (AD), the most common type of dementia, is a progressive disease characterized by memory loss and overall cognitive decline beyond normal aging. The prevalence of dementia is increasing worldwide, and in 2016, it became the fifth leading cause of global deaths, as per the World Health Organization (WHO) statistics [ 1 ]. According to the World Alzheimer Report 2018, published by Alzheimer’s Disease International, there are at least 50 million people worldwide living with AD or other dementias, and that number is expected to triple to 152 million by 2050 [ 2 ].
In 2011, the National Institute on Aging and Alzheimer’s Association (NIA‐AA) began incorporating the use of biomarkers in the diagnostic criteria of AD [ 3 ]. In 2014, the International Working Group (IWG) issued a revised diagnostic criteria IWG‐2, which further categorized the biomarkers into diagnostic and progression biomarkers [ 4 ], among which tau and amyloid‐β positron emission tomography (tau‐PET and Aβ‐PET) are used for diagnosis, whereas brain structural magnetic resonance imaging (sMRI) and glucose metabolism imaging (2‐[fluorine‐18]fluoro‐2‐deoxy‐D‐glucose PET, or FDG‐PET) are used for monitoring the progression of the disease. In 2018, the NIA‐AA published the AT(N) research framework, which proposed three groups of biomarkers: Aβ deposition (A, based on cerebrospinal fluid [CSF] or Aβ‐PET), pathologic tau (T, based on CSF phosphorylated tau [p‐tau] or tau‐PET), and neurodegeneration (N, based on FDG‐PET, CSF total tau [t‐tau], or brain atrophy as measured by MRI), which collectively define the various stages of AD progression [ 5 ]. Although the 2018 NIA‐AA framework was not intended for clinical diagnosis, it further emphasized the importance of medical imaging for monitoring disease progression and its prospect in early screening for AD. Apart from the core biomarkers, emerging CSF and blood biomarkers such as neurofilament light protein, neuronspecific enolase, and visinin‐like protein 1 might be feasible for detecting AD‐related neurodegeneration [ 6 ]. Other imaging modalities such as diffusion tensor imaging (DTI) [ 7 ], arterial spin labeling [ 8 ], and functional MRI (fMRI) [ 9 ] have also shown great prospects in the research of preclinical AD. In this review article, we focus on the following aspects of computerized MRI‐based biomarkers of AD: (1) identifying AD from normal control (NC), (2) identifying AD from other dementia types, including vascular dementia (VaD), dementia with Lewy bodies (DLB), and frontotemporal dementia (FTD), and (3) predicting the conversion from NC to mild cognitive impairment (MCI) and from MCI to AD.
2 MRI biomarkers used in identifying AD from NC
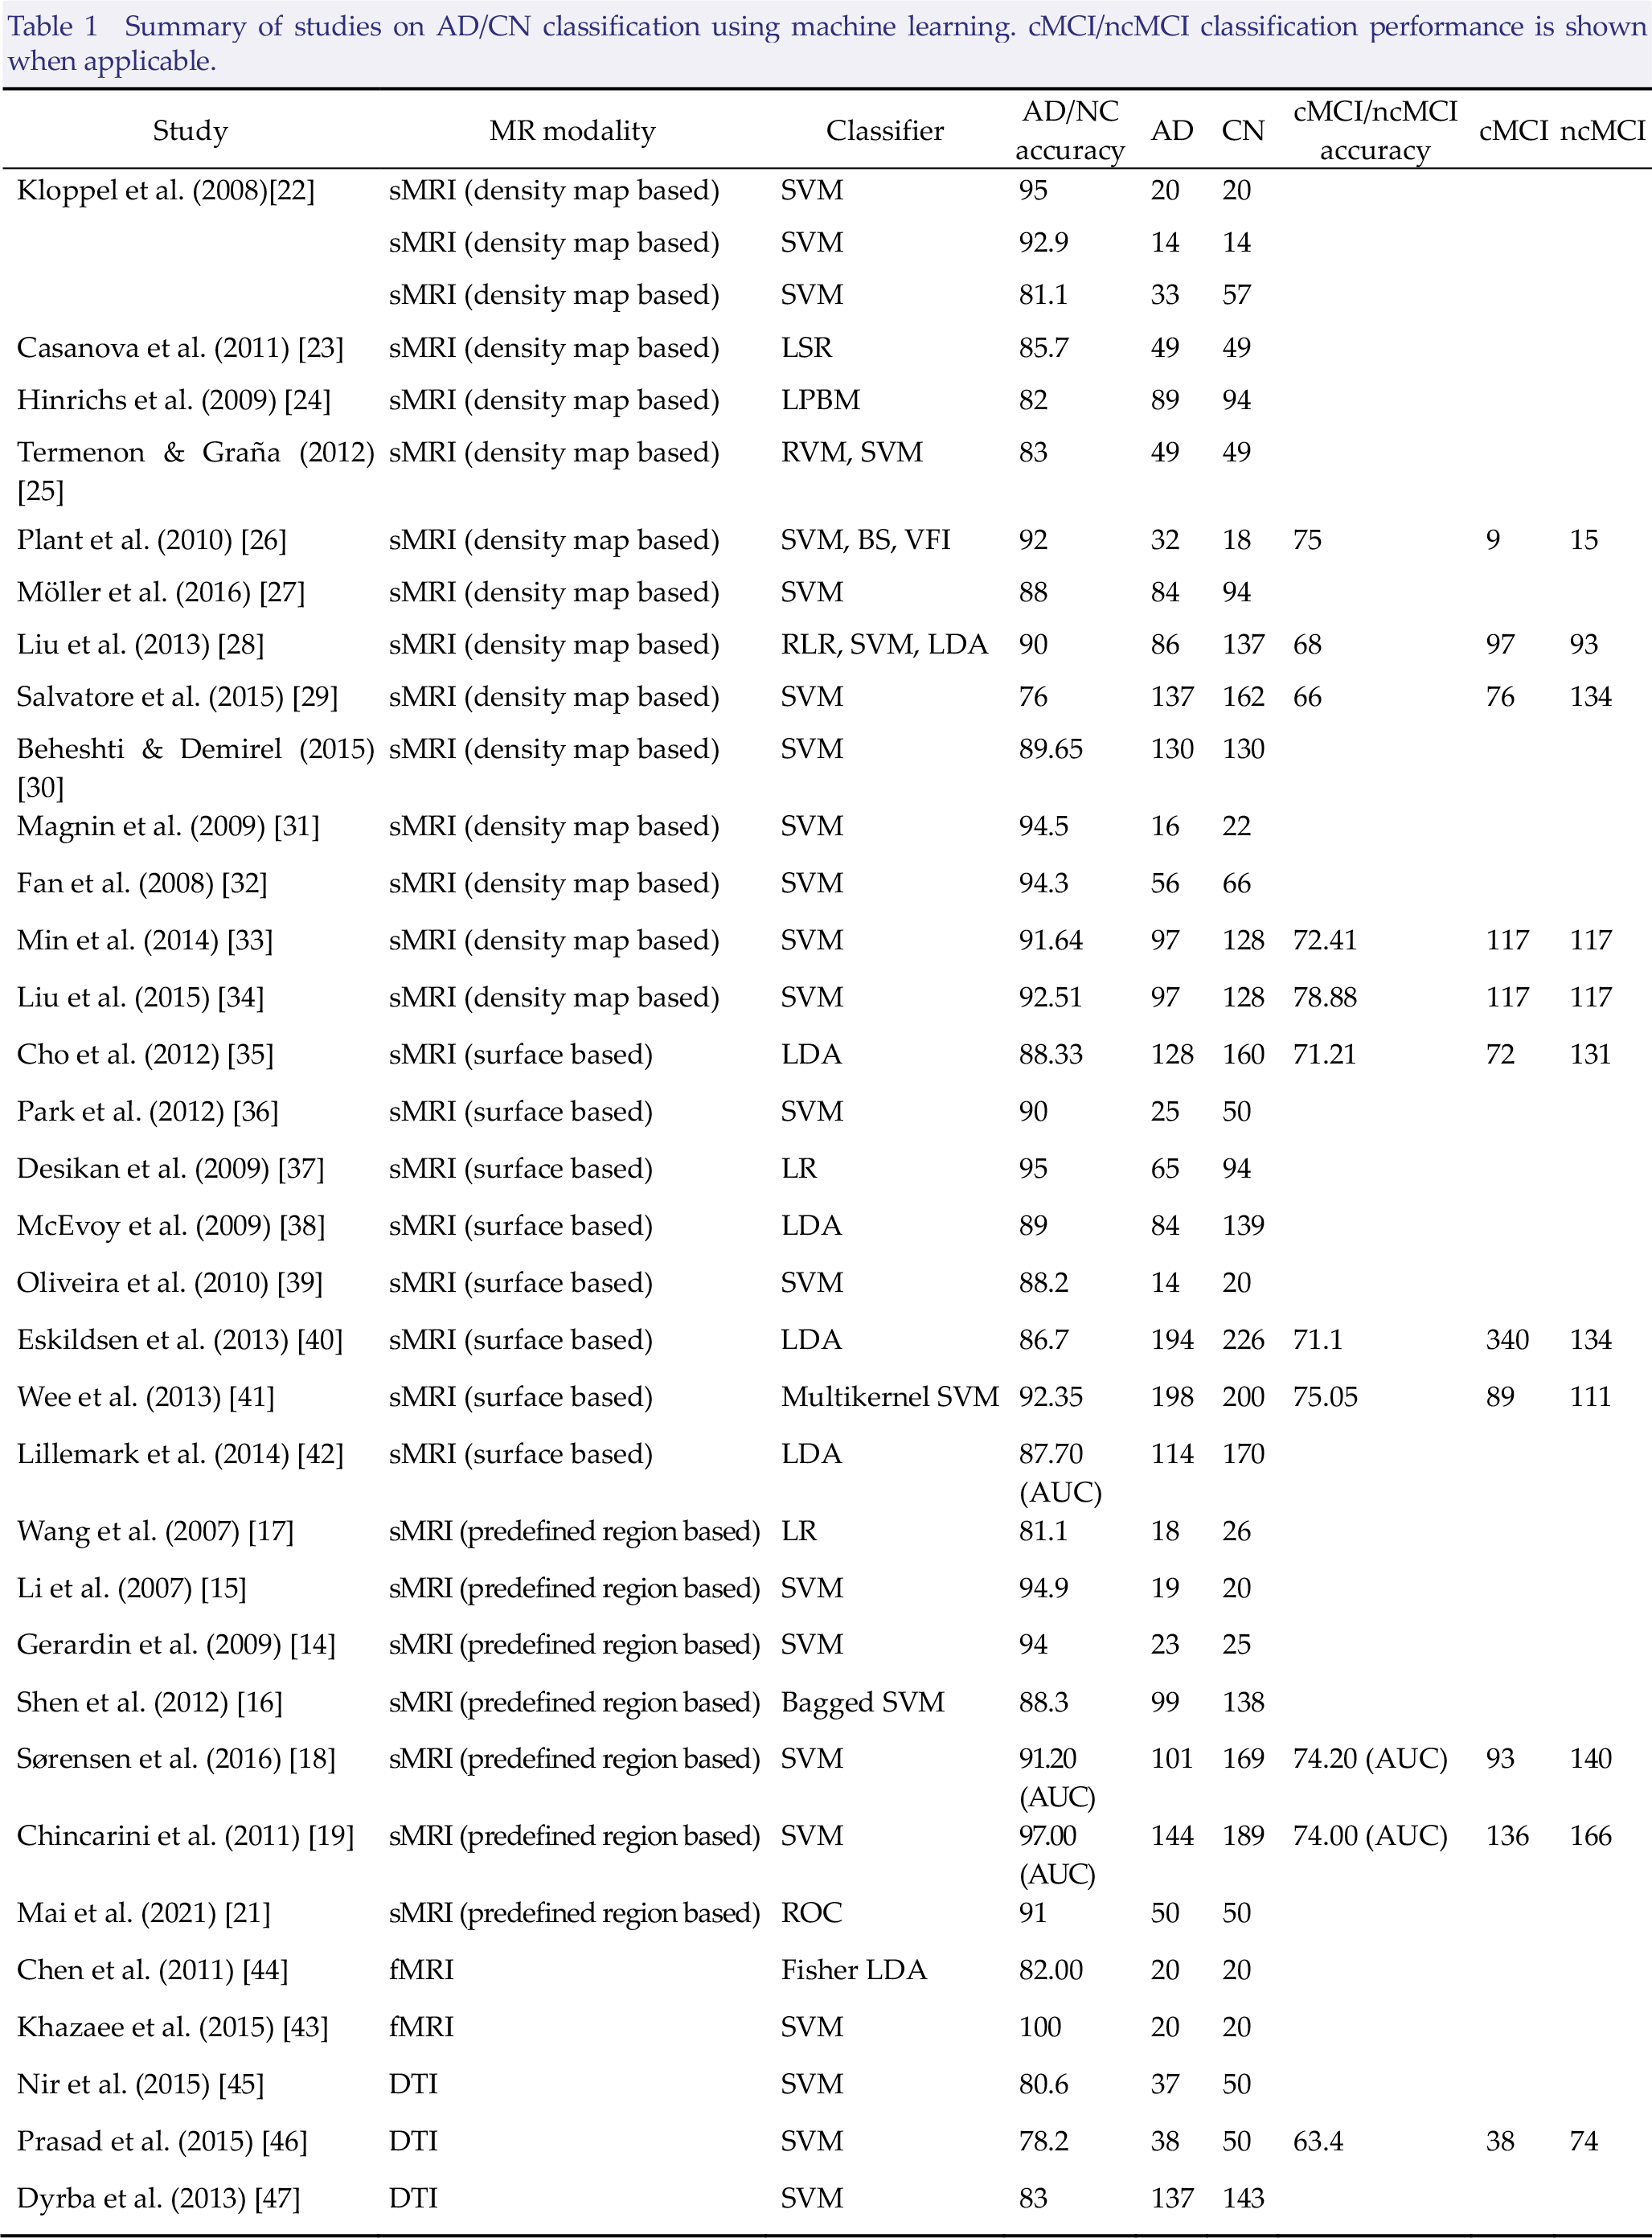
With regard to the algorithms used for identifying AD from NC, research has been conducted on machine learning, deep learning, or a combination of both approaches. In some studies, modalities other than MRI, such as PET and cerebrospinal fluid (CSF), were also integrated into the AD/NC classification. Most studies used sMRI as the magnetic resonance (MR) modality. Among these sMRI studies, density maps, cortical surface, and predefined region–based methods were the main extraction methods used in machine‐learning studies, whereas the image patch‐based method is another common method used in deep‐learning studies.
2.1 AD/NC classification using machine learning
In their review, Rathore et al. [ 10 ] categorized the MRI‐based AD classification studies into sMRI, fMRI, and DTI.
For the sMRI biomarkers of AD, the hippocampus has always played an important role and is considered to be a crucial region that aids in the diagnosis of AD. In particular, hippocampal volume has been validated and accepted by the Coalition Against Major Diseases/European Medicines Agency as the neuroimaging biomarker for trials targeting predementia stages [ 11 ]. In addition, other regions have shown significant atrophy or volumetric differences between AD and NC [ 12 , 13 ]. Therefore, studies using predefined regionbased methods have used hippocampal features and biologically selected features beyond the hippocampus for classification.
Using spherical harmonics to model the shape of the hippocampus, Gerardin et al. [ 14 ] detected an accuracy of 94% for the classification of AD/NC. Li et al. [ 15 ] quantified the hippocampal shape using surface‐based anatomic mesh modeling and reported an accuracy of 94.9%. After constructing a statistical shape model for the hippocampus, She et al. [ 16 ] reported an accuracy of 88.3%. Wang et al. [ 17 ] demonstrated an accuracy of 81.1% using a large‐deformation diffeomorphic and momentumbased hippocampal shape. Sørensen et al. [ 18 ] used hippocampal texture to yield an area under the curve (AUC) of 0.912 in discriminating AD from NC.
Among studies using biologically selected features beyond the hippocampus, Chincarini et al. [ 19 ] achieved an AUC of 0.97 using temporal lobe structures that are known to be affected in early AD, such as the entorhinal cortex, perirhinal cortex, hippocampus, and parahippocampal gyri. In addition, Spulber et al. [ 20 ] used supervised multivariate data analysis and orthogonal projection to latent structures (OPLS) for statistical learning, yielded an accuracy of 88.4% for the AD/NC classification using cortical thickness and volumetric features. In a more recent study, Mai et al. [ 21 ] combined the degree of atrophy of multiple brain structures into an AD resemblance atrophy index (AD‐RAI) and evaluated its performance among groups of AD/NC and subgroups of AD/NC that were assessed with AT(N) biomarkers and demonstrated accuracies of 91% and 100%, respectively.
In addition to predefined region‐based methods, density maps and cortical surface are other main feature extraction methods that can be used in sMRI for AD/NC classification. In studies using the density map‐based method, researchers used either whole‐density maps [ 22 –27 ] or reduced‐density maps as features, which are features that have been reduced using supervised or unsupervised feature‐reduction methods [ 28 –30 ] or features that have been extracted from predefined atlases [ 31 ] or adaptive regions to reduce dimensionality [ 32 –34 ]. For studies using the surface‐based method, the authors used supervised/unsupervised feature reduction‐based methods [35, 36] or atlas‐based methods to reduce vertices as features [ 37 –42 ].
For fMRI studies distinguishing AD from NC, the authors used features that were based on graph theory‐based measures [ 43 ] or functional connectivity [ 44 ]. In the DTI studies, features were extracted based on tractography [ 45 ], connectivity network measures [ 46 ], and discriminative voxel selection [ 47 ].
Table 1 presents a summary of MRI studies for identifying AD from NC.
Summary of studies on AD/CN classification using machine learning. cMCI/ncMCI classification performance is shown when applicable.
2.2 AD/NC classification using deep learning for feature selection from neuroimaging data
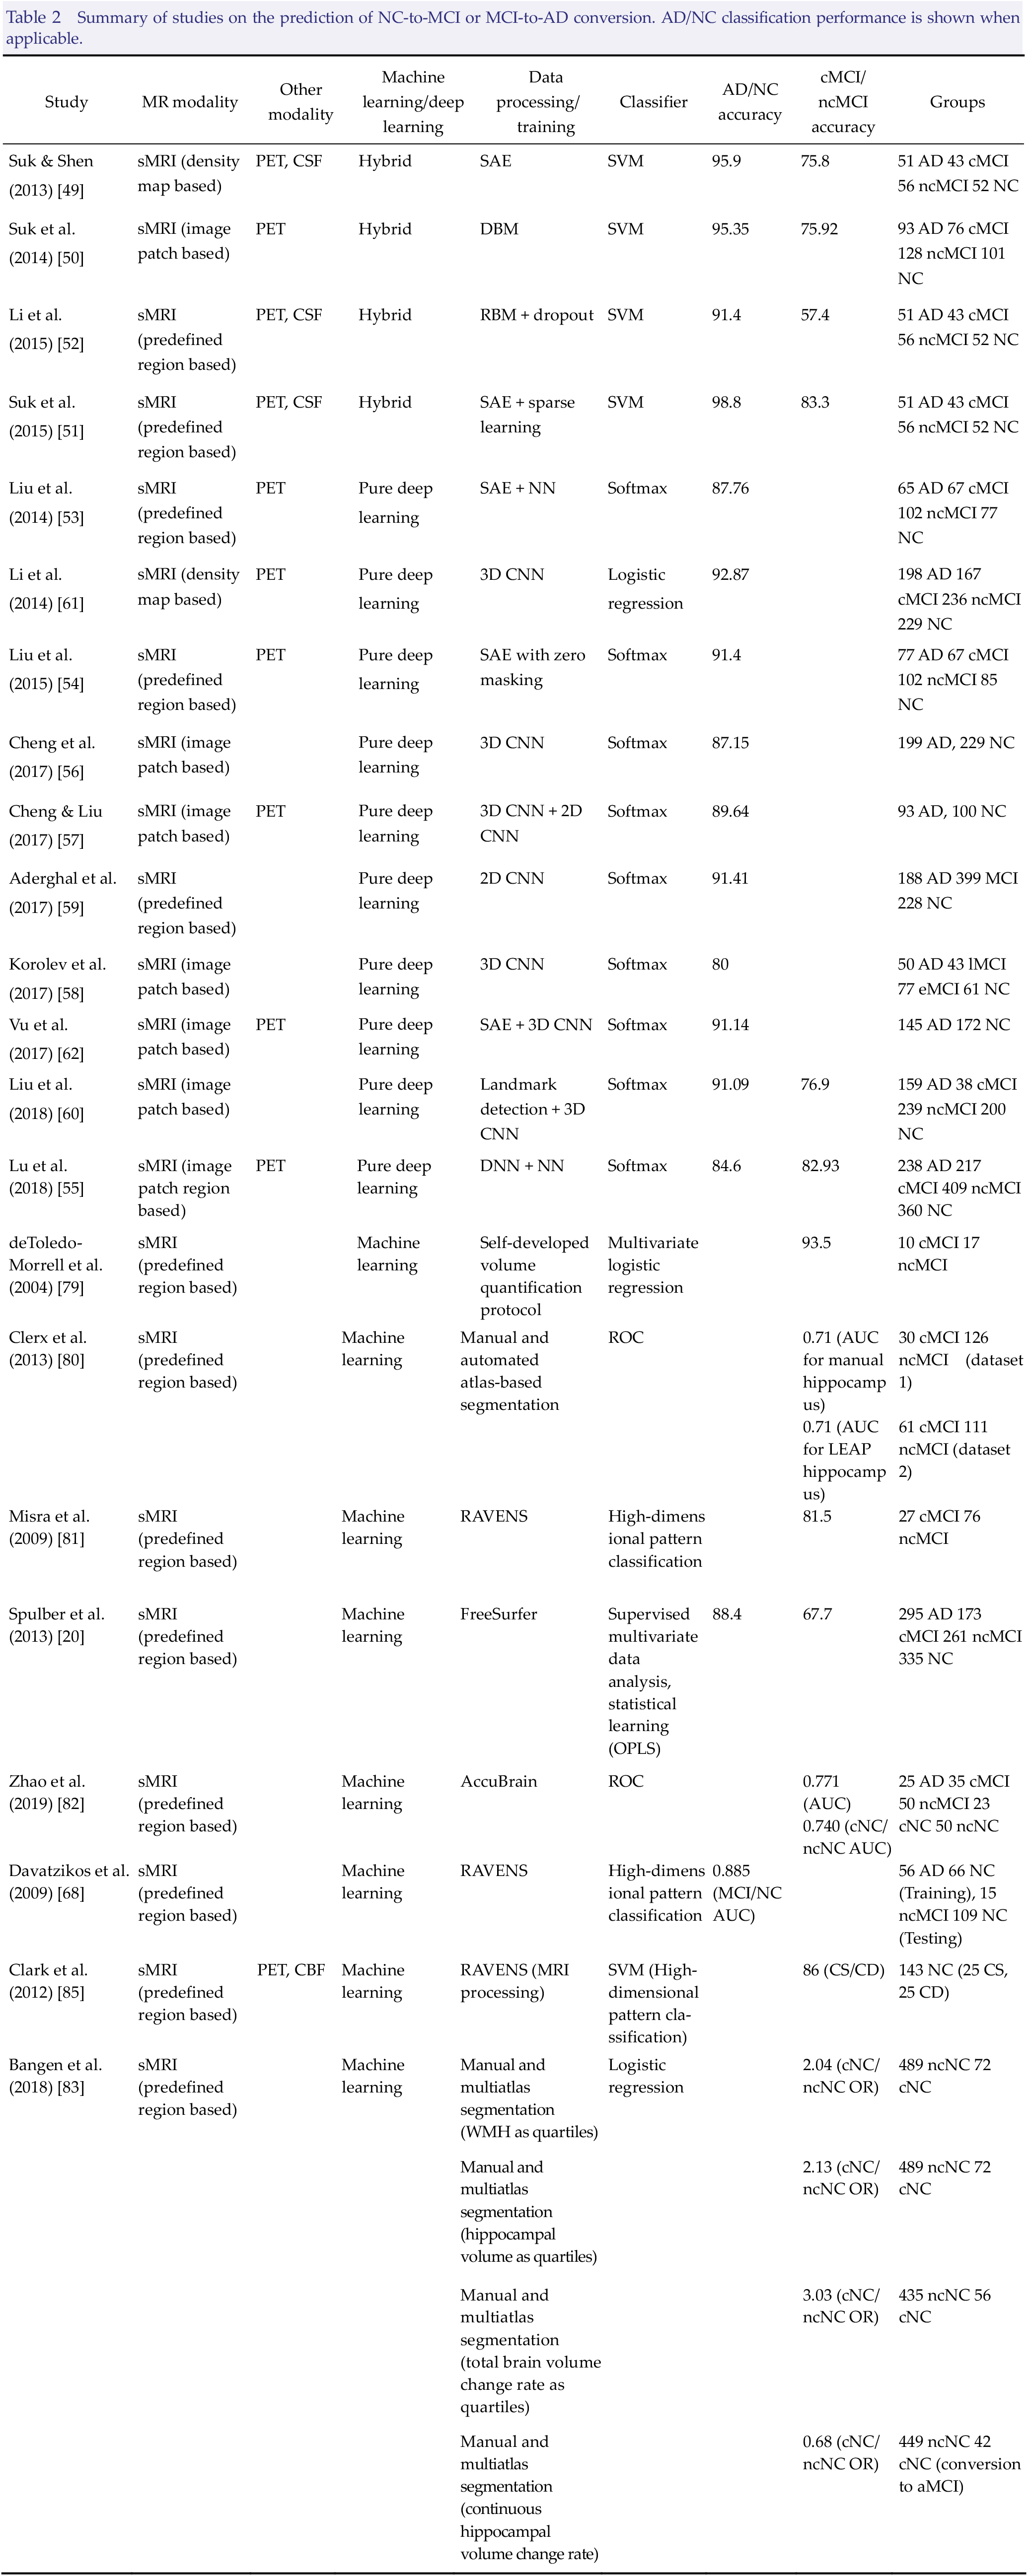
In the systematic review by Jo et al. [ 48 ], the authors identified studies combining traditional machine learning and deep learning, with the latter responsible for the feature selection from the images (Table 2). By using the gray matter (GM) tissue volume from MRI, as well as the mean intensity from PET and CSF biomarkers of Aβ42, t‐tau, and p‐tau as features, Suk et al. [ 49 ] used a stacked autoencoder (SAE) to discover a latent feature representation and adopted a multikernel support vector machine (SVM) for classification to achieve an accuracy of 95.9%. These same authors [ 50 ] used a deep Boltzmann machine (DBM) to demonstrate an accuracy of 95.35% by using the tissue densities of an MRI patch and the voxel intensities of a PET patch as observations. Later, they combined SAE‐learned feature representation with the original low‐level features from multimodality fusion via multikernel SVM and showed the highest accuracy of 98.8% in semisupervised learning [ 51 ]. Li et al. [ 52 ] used volumetric features from MRI and PET images and CSF biomarkers of Aβ42, t‐tau, and p‐tau, via the restricted Boltzmann machine (RBM) with dropout and SVM as a classifier, to obtain an accuracy of 91.4%.
Summary of studies on the prediction of NC‐to‐MCI or MCI‐to‐AD conversion. AD/NC classification performance is shown when applicable.
2.3 Deep learning for classification of AD and NC
Jo et al. [ 48 ] also identified several studies that used only deep learning for identifying AD from NC (Table 2). Liu et al. [ 53 ] used SAE and a softmax output layer to yield an accuracy of 87.76% for the classification of AD/NC. Liu et al. [ 54 ] proposed a framework using SAE and a softmax logistic regressor and applied a zero‐mask method to achieve an accuracy of 91.4%. Lu et al. [ 55 ] used a deep neural network (DNN) and obtained an accuracy of 84.6%. Cheng et al. [ 56 ] proposed the construction of multiple deep three‐dimensional (3D) convolutional neural networks (CNNs) and reported an accuracy of 87.15%. Later, they proposed the construction of cascaded CNNs (3D CNN + 2D CNN) and achieved an accuracy of 89.64% [ 57 ]. Using residual and plain 3D CNN architectures without intermediate handcrafted feature extraction, Korolev et al. [ 58 ] reported an accuracy of 80%. Aderghal et al. [ 59 ] proposed a multiprojection fusion approach using CNNs and demonstrated an accuracy of 91.41%. Liu et al. [ 60 ] proposed a landmark‐based deep multi‐instance learning framework to achieve accuracies of 91.09% and 92.75% from the Alzheimer’s Disease Neuroimaging Initiative (ADNI)‐2 and Minimal Interval Resonance Imaging in Alzheimer’s Disease (MIRIAD), respectively. Li et al. [ 61 ] designed a 3D CNN architecture and yielded an accuracy of 92.87%. Vu et al. [ 62 ] used SAE and 3D CNN and demonstrated an accuracy of 91.1%.
3 MRI biomarkers in differentiating AD from other dementia types
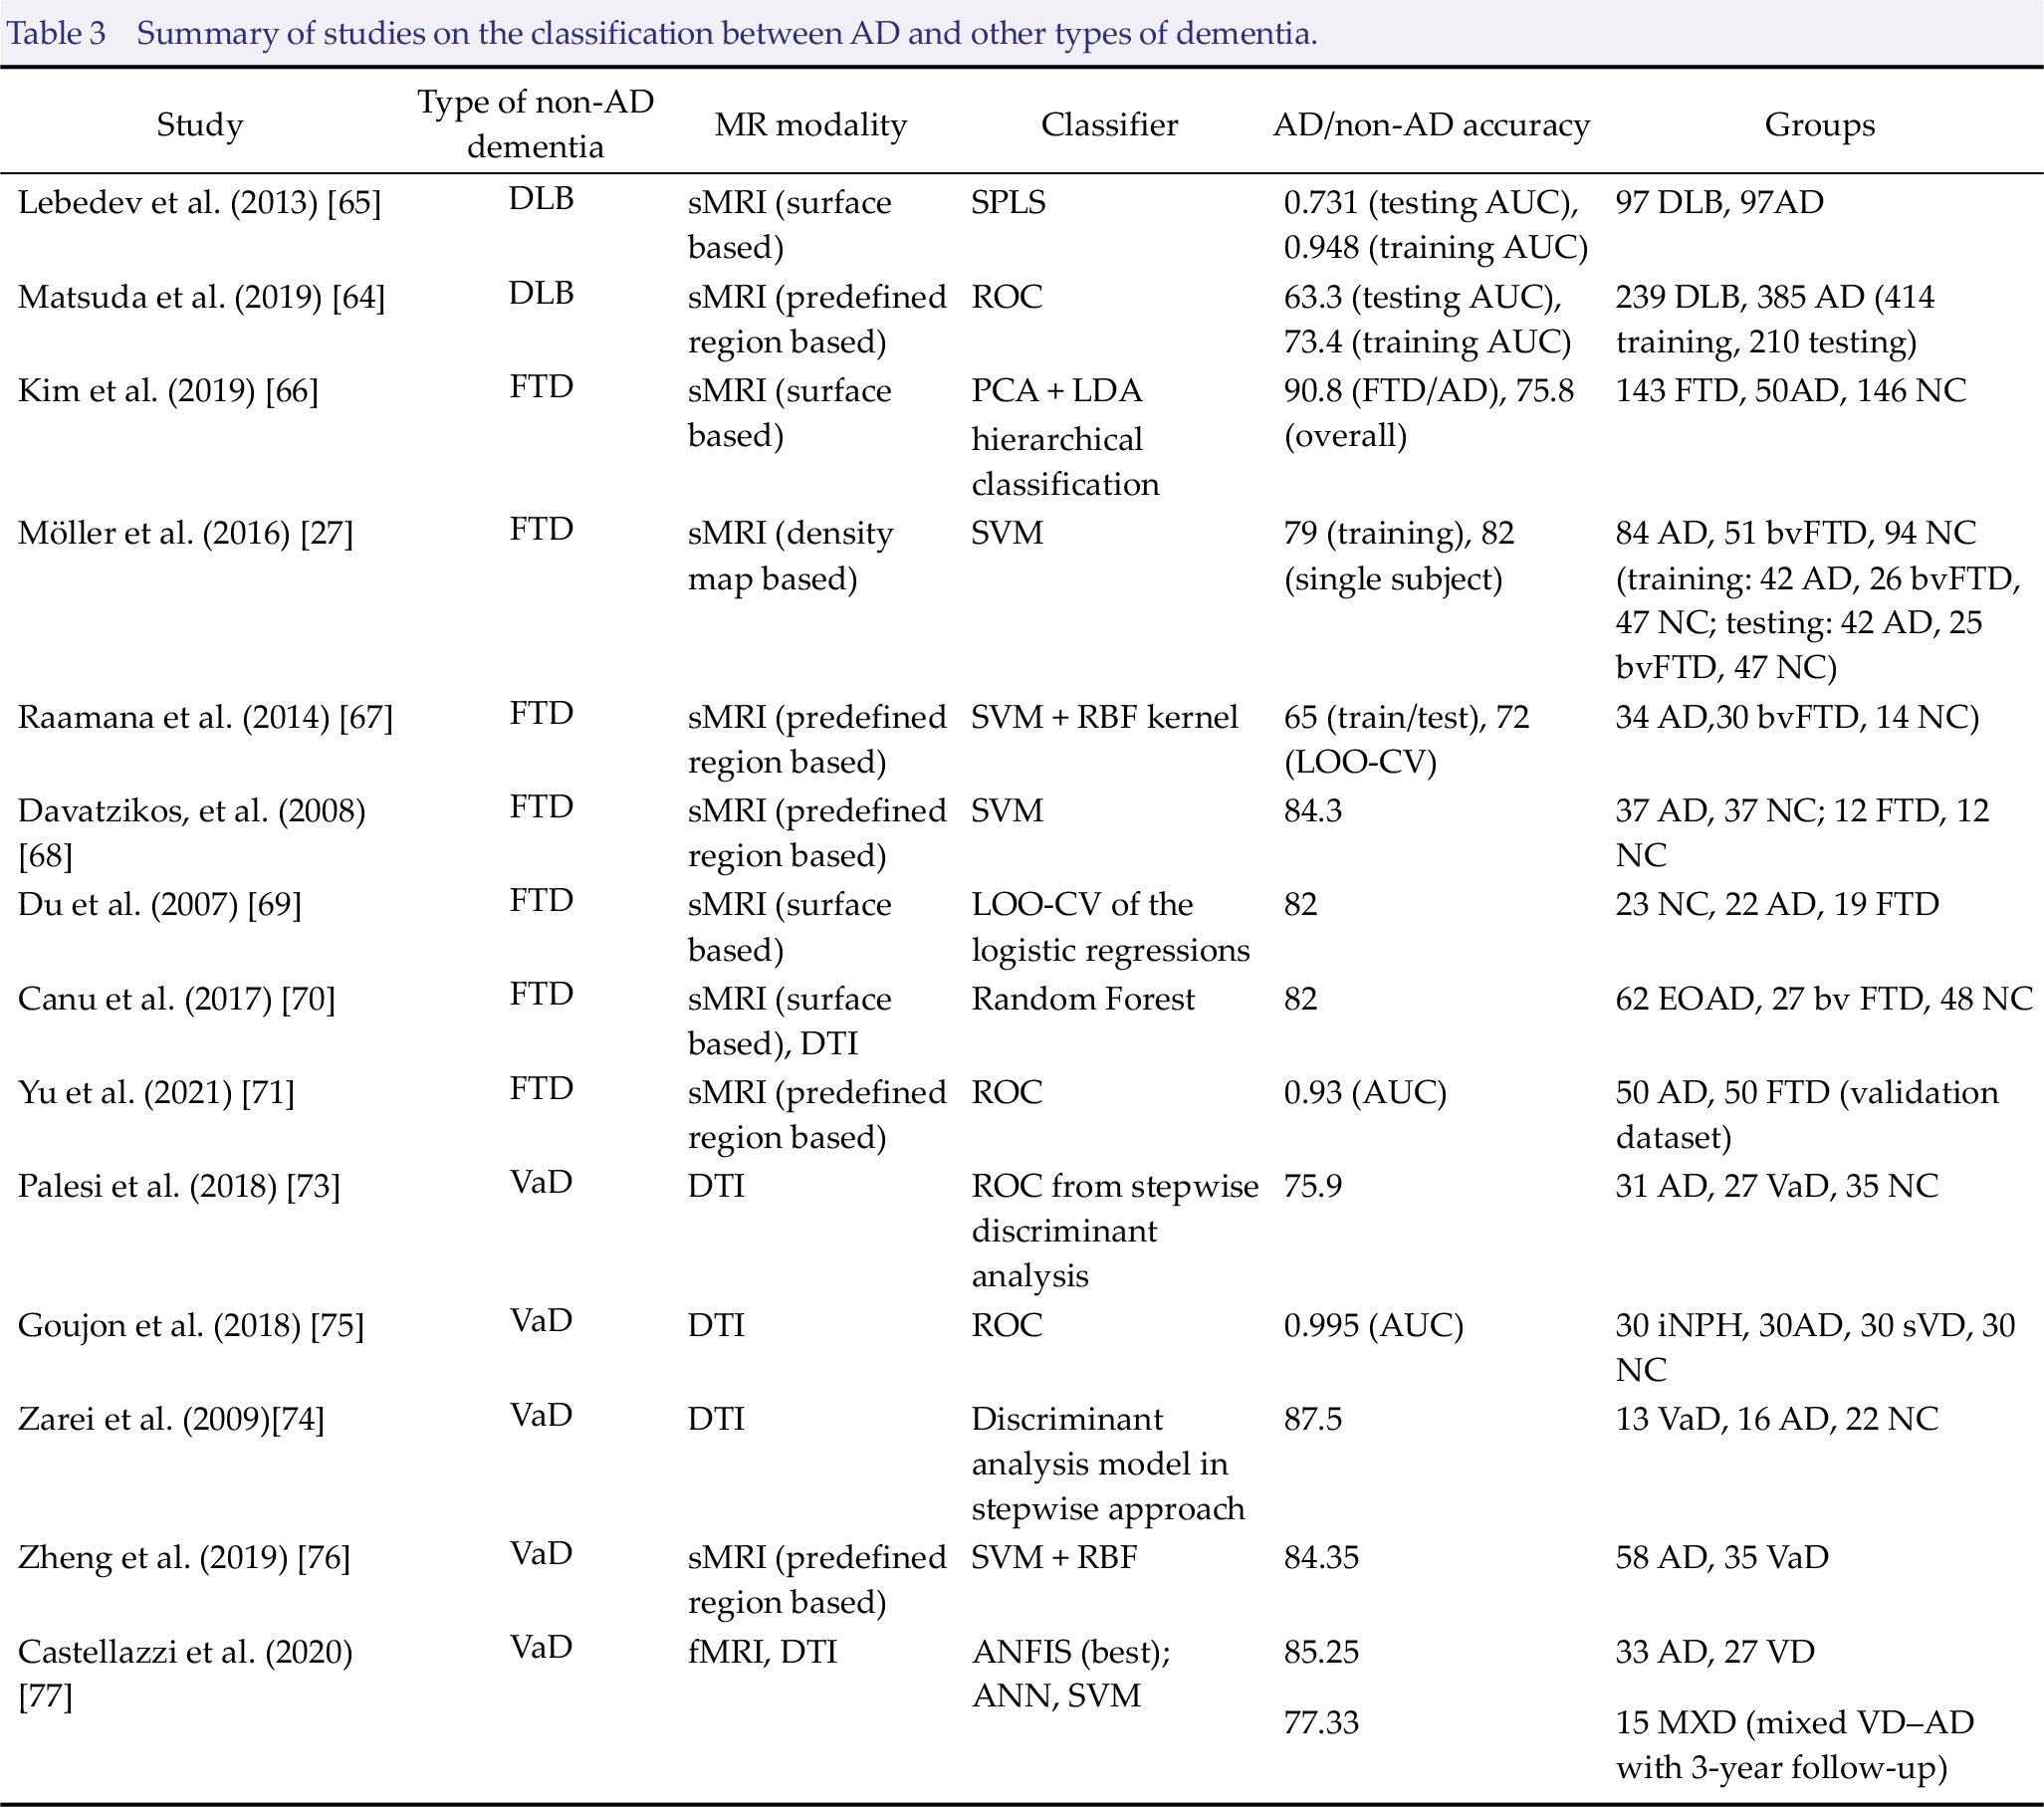
Table 3 provides a list of studies classifying AD versus DLB, FTD, and VaD. All of the examined studies used machine learning to differentiate AD from other dementia types. The MR modalities used in these studies include sMRI, DTI, and fMRI.
3.1 Classification between AD and DLB
One of the supportive biomarkers, according to the 2017 revised criteria for the clinical diagnosis of DLB, is a relative preservation of medial temporal lobe structures on computed tomography or MRI scan [ 63 ]. To differentiate DLB from AD, Matsuda et al. [ 64 ] investigated the local atrophy of the medial temporal lobe and brainstem and reported accuracies of 73.4% and 63.3% in the receiver‐operating characteristic (ROC) analyses for the training and testing sets, respectively. Lebedev et al. [ 65 ] used the sparse partial least squares regression (SPLS) classification using cortical thickness and achieved AUCs of 0.948 and 0.731 for the training and testing sets, respectively.
3.2 Classification between AD and FTD
To differentiate AD from FTD, Kim et al. [ 66 ] used principal component analysis (PCA) and linear discriminant analysis (LDA) classifiers and achieved an accuracy of 90.8% based on cortical thickness. By using the GM density map as a feature, Möller et al. [ 27 ] used SVM for the classification to show a training accuracy of 79%, whereas single‐subject diagnosis in the prediction set yielded 82% accuracy when using the discrimination maps. By studying the volume, surface displacement, and Laplacian invariants of the hippocampus and lateral ventricle, Raamana et al. [ 67 ] applied k‐means clustering for dimensionality reduction and used SVM with radial basis function (RBF) kernel for classification. When using left ventricular displacements as features, these authors reported 72% accuracy from leave‐one‐out cross‐validation (LOO‐CV) classification and 65% accuracy from the train/test classification. In addition, they achieved a three‐class AUC of 0.76 using bilateral ventricular displacement as features, which is the first multiclass classification study among AD, FTD, and NC. Using regional analysis of volumes examined in normalized space (RAVENS) for image processing and PCA for feature selection, Davatzikos et al. [ 68 ] selected features from different brain regions and reported an accuracy of 84.3% from SVM classification. Du et al. [ 69 ] studied the cortical thickness and yielded 82% accuracy from LOO‐CV of logistic regression. Canu et al. [ 70 ] conducted a multimodal MRI study by combining the cortical thickness and diffusion tensor measures and was able to distinguish patients with early‐onset Alzheimer’s disease (EOAD) and those with FTD with 82% accuracy from random forest analysis. Recently, by incorporating volumetric indexes in FTD‐dominant regions, Yu et al. [ 71 ] developed the frontotemporal dementia index and achieved an AUC of 0.93, as validated in independent data from ADNI and the Frontotemporal Lobar Degeneration Neuroimaging Initiative database.
Summary of studies on the classification between AD and other types of dementia.
3.3 Classification between AD and VaD
The existence of overlap between pathology of AD and VaD is widely accepted [ 72 ]. Therefore, it is crucial to obtain a reliable method of distinguishing these two types of dementia. By using fractional anisotropy (FA) values of multiple regions as features, Palesi et al. [ 73 ] classified AD and VaD with 75.9% accuracy from a stepwise discriminant analysis. Zarei et al. [ 74 ] showed their highest accuracy of 87.5% from a combined discriminant analysis model based on transcallosal prefrontal FA values and Fazekas score. Goujon et al. [ 75 ] achieved their highest AUC of 0.995 using apparent diffusion coefficient values in the parietal periventricular region as features. Zheng et al. [ 76 ] used SVM with RBF kernel for classification and yielded an accuracy of 84.35% using structural MRI biomarkers obtained by AccuBrain® as input features. In their recent study, Castellazzi et al. [ 77 ] tested three machine‐learning algorithms: artificial neural network (ANN), SVM, and adaptive neuro‐fuzzy inference system (ANFIS), with both structural and functional information used as input features. When providing multiple regional metrics from resting‐state fMRI and DTI as inputs, ANFIS was the most efficient algorithm for discriminating AD from VaD, which yielded an accuracy of 85.25%. In addition, when applying the best discriminant pattern to patients diagnosed with mixed VaD‐AD dementia (who converted to AD or VaD at the 3‐year follow‐up), ANFIS showed 77.33% accuracy in predicting the underlying disease based on the baseline data, which demonstrates the potential for early detection on the typology of dementia.
4 Prediction of cognitive conversion from NC to MCI and from MCI to AD
Although many studies have targeted the identification of MCI subjects at risk of AD, few studies have involved the prediction of conversion from NC to MCI. With regard to the algorithms used for predicting disease progression, machine learning, deep learning, or a combination of both approaches have been reported. sMRI was the mostly used MR modality in the examined studies. Some of the studies mentioned in Section 2 also predicted MCI to AD conversion (Table 1 and Table 2).
4.1 Machine learning for prognostic prediction
Similar to the AD/NC classification, we found that the hippocampus and several AD‐related regions were commonly used biomarkers for the prediction of cognitive conversion from MCI to AD. Several predefined region‐based studies mentioned in Section 2.1 also applied their classification algorithms to the prediction of the conversion from MCI to AD. Sørensen et al. [ 18 ] used hippocampal texture as a predictor of MCI‐to‐AD conversion and obtained an AUC of 0.742. Chincarini et al. [ 19 ] computed a single index combining local analysis of several regions and yielded an accuracy of 0.74. In addition, by quantifying entorhinal volume using their developed protocol, Goncharova et al. [ 78 ] and deToledo‐Morrell et al. [ 79 ] used multivariate logistic regression to achieve their best concordance rate of 93.5% of MCI to AD conversion. Plant et al. [ 26 ] investigated the performance of three types of classifier and obtained their best prediction accuracy of 75% of MCI‐to‐AD conversion when using voting features intervals (VFI), in which the anterior cingulate gyrus and orbitofrontal cortex were the best features. Clerx et al. [ 80 ] studied the use of the hippocampus, medial temporal lobe atrophy score, and lateral ventricle as features and yielded the best AUC of 0.71 using the hippocampus segmented either manually or using the Learning Embeddings for Atlas Propagation (LEAP) method. Misra et al. [ 81 ] achieved a prediction accuracy of 81.5% for the MCI‐to‐AD conversion using a highdimensional pattern classification of brain atrophy. By using supervised multivariate data analysis and OPLS for statistical learning, Spulber et al. [ 20 ] used brain regions segmented from FreeSurfer as features and used AD/CN and cMCI/ncMCI as the training set and testing set, respectively, which yielded an accuracy of 67.7% for the MCI‐to‐AD conversion. By using their AD‐RAI index, which combined the atrophy degree of multiple brain structures, Zhao et al. [ 82 ] yielded an AUC of 0.771 for the MCI‐to‐AD conversion.
In addition to the predefined region‐based methods, several density maps and cortical surface‐based sMRI studies mentioned in Section 2.1 also applied their classification algorithms in predicting the conversion from MCI to AD. Among the sMRI studies using the density map‐based method, Liu et al. [ 28 ] used embedded MRI features of regional brain volume and cortical thickness and reported an accuracy of 68%. Salvatore et al. [ 29 ] implemented PCA coupled with a Fisher discriminant ratio criterion to MR images (whole‐brain, GM, and white matter) and obtained an accuracy of 66%. Min et al. [ 33 ] extracted adaptive regional features and yielded an accuracy of 72.41%. Liu et al. [ 34 ] proposed a novel view‐centralized multiatlas classification method and achieved an accuracy of 78.88% for cMCI/ncMCI classification. Among the sMRI studies using a cortical surface‐based method, Cho et al. [ 35 ] demonstrated an accuracy of 71.21% based on the incremental method using a spatial frequency representation of cortical thickness data. Eskildsen et al. [ 40 ] used patterns of cortical thickness measurements for the cMCI/ncMCI classification and reported an accuracy of 71.1%. By integrating the correlative morphological information with region of interest‐based information via multikernel SVM, Wee et al. [ 41 ] achieved an accuracy of 75.05%. Last but not least, among the DTI studies, Prasad et al. [ 46 ] reported an accuracy of 63.4% for cMCI/ncMCI classification by combining the fiber network measures and the flow network measures (Table 1).
With regard to the conversion of NC to MCI, Bangen et al. [ 83 ] demonstrated that baseline measures of white matter hyperintensities (WMH) and hippocampal volume were associated with a higher odds of conversion from normal cognition to MCI at 6.5‐year follow‐up. In addition, they found that the annualized change rates in total cerebral brain volume and hippocampal volume were associated with a higher odd of conversion from normal cognition to MCI at follow‐up. Using a composite index of multiple MRI features, Zhao et al. [ 82 ] reported an AUC of 0.740 for the NC‐to‐MCI conversion, which demonstrated for the first time that such an index could also differentiate normal subjects at risk of conversion to MCI over a 2‐year period. Several other studies also applied a composite index of multiple MRI features to longitudinal data from NC. For instance, by using their spatial pattern of abnormality for the recognition of early Alzheimer’s disease (SPARE‐AD) index of brain atrophy, Davatzikos et al. [ 84 ] evaluated the longitudinal progression of SPARE‐AD in NC and MCI and were able to distinguish these using the rate of SPARE‐AD change, which achieved an AUC of 0.89. Later, by combining MRI and resting PET cerebral blood flow (CBF) images, Clark et al. [ 85 ] used the resulting index, the spatial pattern of abnormality for recognition of early cognitive decline, to predict subsequent cognitive decline in cognitively normal older adults. Using a combination of MRI and [15O] PET CBF data, they classified cognitively stable (CS) and cognitively declining (CD) individuals with 86% accuracy, using leave‐two‐out cross‐validation. Overall, despite the lack of studies predicting the conversion from NC to MCI using MRI‐based biomarkers, it is encouraging that there are multiple ongoing longitudinal studies exploring different neuroimaging biomarkers in people with subjective cognitive decline [ 86 –89 ].
4.2 Prognostic prediction using deep learning for feature selection from neuroimaging data
The studies mentioned in Section 2.2 also applied their classification algorithms for the prediction of the MCI‐to‐AD conversion. Suk et al. [ 49 ] used the SAE and SVM as classifiers to yield an accuracy of 75.8%. The authors also demonstrated an accuracy of 75.92% in a study using the DBM [ 50 ] and an accuracy of 83.3% in another study using SAE [ 51 ]. By applying the RBM with a dropout technique, Li et al. [ 52 ] obtained an accuracy of 57.4%.
4.3 Deep learning for prognostic prediction
Two of the studies mentioned in Section 2.3 also used pure deep learning for the prediction of MCI to AD conversion. Lu et al. [ 55 ] used DNN to yield an accuracy of 82.93% for the MCI‐to‐AD conversion. Liu et al. [ 60 ] used landmark detection and 3D CNN to obtain an accuracy of 76.9%.
5 Discussion
In this review article, we focused on computerized MRI‐based biomarkers of AD, for which we identified representative studies using machine learning, deep learning, or a combination of both approaches. Deep learning has the ability to detect complex nonlinear relationships and interactions between variables and has been shown to yield excellent performance in identifying AD from NC and predicting the conversion from MCI to AD. Nonetheless, its black box nature may prevent researchers from clearly understanding its models. In addition, the ability to model nonlinearities and interactions makes deep learning easily prone to overfitting, and training a DNN that generalizes well to new data could be a challenge. Last but not least, deep learning could be much more computationally expensive than machine learning.
Meanwhile, traditional machine learning is relatively better for understanding the effect of features on the classification outcome, which makes it easier to interpret the importance of certain brain features that are extracted from the images. However, for feature extraction and selection, expert knowledge might be required, whereas deep‐learning‐based classification could be performed using automated selection of features or without feature selection. From this review, we found that traditional machine learning still appears to be widely used in studies of computerized MRI‐based biomarkers of AD, ranging from the classification between AD and NC, and between AD and other dementia types, to the prediction of NC‐to‐MCI and MCI‐to‐AD conversion.
One of the limitations of this review is that the classification performance metrics of most studies were reported only in terms of accuracy (or AUC when accuracy is not available). However, a high accuracy does not necessarily indicate good performance. Since these studies had different sample sizes, group composition, and data sets, a fair comparison cannot be made based only on classification accuracy. Thus, when interpreting and comparing the classification performance of different studies, it is essential to consider factors beyond accuracy.
Footnotes
Lin Shi is the director of BrainNow Research Institute. Raymond Wong and Yishan Luo are employees of BrainNow Research Institute. The remaining authors report no conflict of interests.