
Abstract
Metastatic mouse models of melanoma have been characterized by gross necropsy examination, histopathology, and optical imaging. To determine if the time progression, extent, and metabolism of melanoma metastases could be monitored noninvasively, serial micro-CT and small-animal PET imaging studies were performed by using a mouse model of melanoma. Juvenile female C57BL/6 mice were injected intravenously with syngenic B16-F10 melanoma cells. Serial micro-CT imaging studies were performed on anesthetized mice. Mice were necropsied at the development of adverse clinical signs or at postinjection Day 30, and tissues were collected for histopathology. In a separate study of four mice, tumor viability was assessed with 2-deoxy-2-[18F]fluoro-
Introduction
Metastasis of the primary tumor is a devastating progression of melanoma in humans, with approximately 7,770 deaths occurring in the United States in 2005 due to advanced cases of melanoma [1]. To study the mechanisms of melanoma metastasis and investigate promising new therapies for treatment of advanced melanoma, mouse models of melanoma have been developed using both mouse-derived and human-derived melanoma cell lines. These mouse models of metastatic melanoma have been characterized by gross lesion description [2,3], histology, optical imaging [4–6], and MRI [7]. An unfortunate limitation of these methods is the need to euthanize the animal to collect the necessary experimental data for histology, negating longitudinal experimental measurements in the same animal, and poor spatial resolution of optical imaging.
Microimaging technologies, including micro-CT and small-animal PET, have shown great utility for noninvasively characterizing small-animal models of disease. High-resolution micro-CT imaging has been used to characterize small-animal models of lung carcinoma and injury [8,9], prostate carcinoma [10], bone lesions [10,11], and lung tumor response to therapy [12]. The primary strength of micro-CT imaging is the excellent anatomical detail that can be achieved in rodent models. The micro-CT imaging modality is best suited to image anatomic areas of high radiographic tissue contrast, for example, lung and bone. In addition, small-animal PET imaging is widely used to image metabolic function and physiologic processes in small-animal models, including 18F− imaging of bone metastases [11], monitoring tumor response after photodynamic therapy using 2-deoxy-2-[18F]fluoro-
The aim of this study was to noninvasively characterize the development and progression of tumor formation and monitor tumor metabolism in a mouse model of metastatic melanoma by using micro-CT and small-animal PET imaging. Intravenous injection of B16-F10 melanoma cells has been used extensively in the literature to induce lung tumor formation [3,16,17]. This model system is ideal to study by micro-CT imaging, given the high radiographic tissue contrast between lung parenchyma and tumor tissue. In addition, due to the high metabolic rate of the B16-F10 cells, small-animal PET imaging with [18F]FDG can be used to monitor metastatic tumor metabolism relative to nontarget tissue. A noninvasive description of metastatic tumor development, progression, and metabolism via micro-CT and small-animal PET will allow for the assessment of the efficacy of novel therapeutic regimens to cause tumor regression and alter tumor metabolism.
Materials and Methods
Animals
Female C57BL/6 mice (4 to 5 weeks old) were obtained from Harlan Industries, Inc. (Indianapolis, IN) and were certified virus antibody free and parasite free by the vendor. The mice were housed in groups of five in static microisolator caging on woodchip bedding in AAALAC International accredited animal facilities. The housing facility maintained a 12-hr light/dark schedule at 22–23°C. Mice were fed standard rodent chow and acidified water ad libitum. Mice were allowed to acclimate for 1 week prior to cell inoculations. All animal studies were approved by the Institutional Animal Care and Use Committee.
Cells
Syngenic, B16-F10 melanoma cells free of
Cell Inoculations
Awake mice were physically restrained in an acrylic mouse-restraint device (Plas-Labs, Inc., Lansing, MI) for intravenous cell inoculations. Mice were injected intravenously via the tail vein with 1 × 10⁵ B16-F10 melanoma cells in 100 μL of phosphate-buffered saline with a 30-gauge needle. After cell inoculations, mice were observed daily for 14 days and then twice daily until the end of the study for the development of adverse clinical signs, including labored breathing, weight loss, abdominal swelling, paralysis, and palpable tumors.
Micro-CT Imaging
Mice were imaged every other day with a MicroCAT II™ micro-CT scanner (CTI Concorde Microsystems LLC, Knoxville, TN). The X-ray-sensitive CCD camera collected 1024 × 1024 pixel projections at a 700-msec exposure time. The X-ray tube settings were of 55-kVp voltage and 800-μA current. Twenty dark-field and 20 light-field calibration images were collected prior to scanning the mice. The micro-CT scan protocol consisted of 360 projections collected at 1-degree increments to give a complete 360-degree rotation. Each micro-CT scan was approximately 15 min in duration. The field of view of the CCD camera was limited to approximately half of the mouse. Therefore, each mouse was scanned twice to obtain full-body images. Mice were anesthetized with either a ketamine (100 mg/kg dose; The Butler Company, Columbus, OH)–xylazine (8 mg/kg dose; The Butler Company) cocktail administered via intraperitoneal injection or 2–3% isoflurane (Forane®, Baxter Healthcare Corporation, Deerfield, IL) by inhalation to perform the micro-CT scans. Mice were allowed to breathe spontaneously during image collection. Micro-CT projection data sets were reconstructed by a Feldkamp cone-beam reconstruction algorithm with a Shepp-Logan filter to obtain a 512 × 512 × 512 pixel image volume. This image volume size corresponded to a 100-μm cubic voxel dimension. Reconstructed image data sets were viewed and analyzed using the Amira 3.1® software package (TGS, San Diego, CA). Image analysis to discern metastatic tumors was performed retrospectively in this portion of the experiment. Tumor doubling times were calculated with the Schwartz equation,
Small-Animal PET Imaging
To determine glucose utilization of metastatic B16-F10 tumors, small-animal PET imaging was performed in a separate series of experiments using a Mosaic™ Small Animal PET System (Philips Medical Systems, Milpitas, CA). Eight mice were first imaged using micro-CT to anatomically follow metastatic tumor development and progression. When tumors were anatomically identified by micro-CT imaging, [18F]FDG imaging was performed using small-animal PET. Four mice underwent [18F]FDG micro-PET imaging. All mice were fasted prior to undergoing [18F]FDG imaging procedures. For small-animal PET imaging, mice were anesthetized by inhalation of isoflurane and then injected intravenously with 1 mCi of [18F]FDG. The mice were allowed to recover from anesthesia after injection. One hour after [18F]FDG injection, the mice were then anesthetized again to perform small-animal PET imaging. PET data acquisition time was approximately 20 min. Immediately after PET imaging, micro-CT imaging was performed on the same mouse to obtain anatomical image data to correlate with the PET metabolic image data. For accurate coregistration of the PET and CT image data with minimal relative motion of the subject, the mice were anesthetized and imaged within acrylic anesthesia tubes (CTI-Concorde Microsystems LLC, Knoxville, TN) that could be easily transferred between the PET and CT instrumentation. Small-animal PET raw image data were reconstructed by using a 3-D-RAMLA reconstruction algorithm to obtain either 0.5- or 1-mm reconstructed isotropic cubic voxel dimensions. Software-based fusion of micro-CT and small-animal PET image data sets using the Amira 3.1® software package allowed for anatomic registration of metabolic [18F]FDG uptake.
Histology
Mice were euthanized by CO2 inhalation at Day 30 post cell inoculation or at the development of adverse clinical signs (such as paralysis, respiratory distress, or >20% body weight loss). After euthanasia, a gross necropsy was performed, and tissues were collected for histopathologic evaluation. Tissues collected included lung, heart, spleen, liver, kidneys, and any tissues suspected of having metastatic lesions. Because the B16-F10 cell line is melanotic, visual identification of the majority of suspected metastatic lesions was easily performed. Collected tissues were fixed in 10% buffered formalin, embedded in paraffin, and routinely processed into histologic sections. Bone tissues were collected, fixed in 10% buffered formalin, and decalcified with a formic acid/sodium citrate solution. The decalcified bones were embedded in paraffin before processing of tissues into histologic sections. All histologic sections were stained with hematoxylin and eosin (H&E) and evaluated by light microscopy to determine the presence and extent of metastatic disease.
Results
Metastatic Model
Metastatic lesions were identified in 59% (17/29) of the mice by gross necropsy and histopathologic evaluation. A wide anatomical distribution of metastatic tumors was noted, as shown in Table 1. Lung tumor formation occurred in 76% (13/17) of the mice that developed metastases. Bone metastases were noted in 65% (11/17) of the mice, with metastatic lesions being observed in the mandible, femur, tibia, and vertebrae. Extrapulmonary soft-tissue metastases were noted in 59% (10/17) of the mice and included anatomical locations of lymph node, kidney, omentum, musculature, and cranial vault. Figure 1 displays photomicrographs of metastatic tumors in extrapulmonary locations including kidney, cranial vault, lymph node, and the intramedullary space of the iliac crest. As shown in Table 1, adverse clinical signs necessitated euthanasia in 82% (14/17) of the mice and included palpable swellings caused by tumors (8/17), hind limb paralysis (4/17), weight loss greater than 20% (1/17), and a head tilt due to central nervous system metastasis (1/17).
Micro-CT Imaging
Longitudinal noninvasive micro-CT imaging studies were successfully performed in mice to follow the development and progression of metastatic tumors. Micro-CT imaging was able to follow the development and progression of at least one metastatic lesion in 65% (11/17) of the mice. Of the lesions found upon gross examination and confirmed histopathologically (53 lesions), we were able to identify 36% (19/53) by micro-CT imaging. Metastatic lesions were identified in lung, abdominal cavity, bone, and subcutaneous tissue by micro-CT image analysis as early as Day 15 post cell inoculation. In our hands, tumors confirmed by histopathology with a diameter of approximately 1 mm or less were not detectable by micro-CT image analysis. With confirmed tumors greater than 1 mm in diameter, 54% of the lesions were detected by micro-CT image analysis. Only tumors greater than 1 mm in diameter were able to be followed serially by micro-CT imaging. Using image analysis software, metastatic tumors were segmented from micro-CT images, three-dimensional tumor volumes were measured, and tumor doubling times were calculated.
Examples of Metastatic Lesions Identified by Micro-CT Imaging
Description of the Metastatic Model

Lesions identified by micro-CT image analysis.

Photomicrographs of metastatic tumors (arrows). (A) Tumor in the parenchyma of the kidney, (B) intramedullary tumor in the iliac crest, (C) lymph node metastasis, (D) tumor in the cranial vault displacing the brain, (E) tumor within the spinal canal impinging on a spinal nerve, (F) 0.3-mm-diameter lung tumor not detected by micro-CT. Hematoxylin and eosin-stained sections; bar = 1.0 mm.
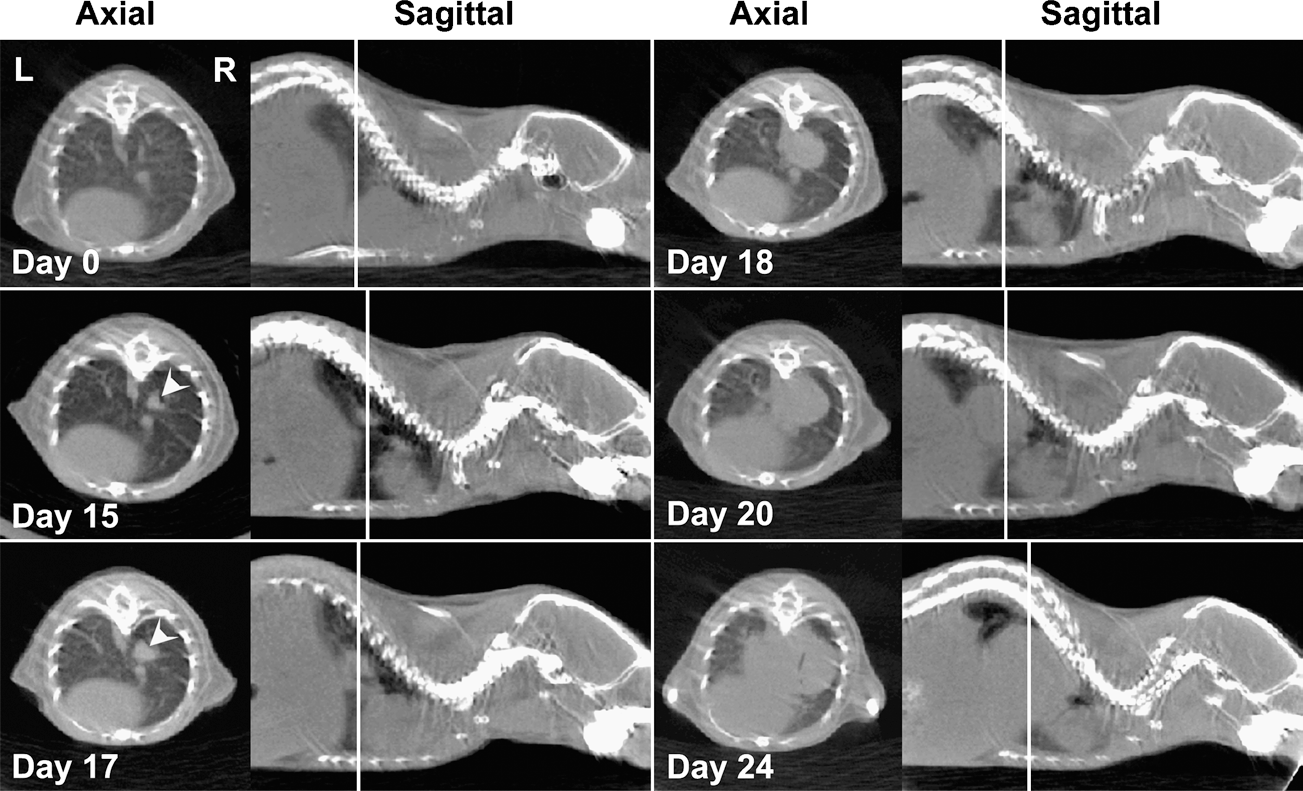
Micro-CT image progression of a lung metastasis (arrowheads). Axial and sagittal micro-CT slice data are shown for the same mouse at multiple time points through the experiment. The lung metastasis is first discernable at postinjection Day 15 and progresses in size until euthanasia at Day 24. Vertical lines on the sagittal images represent the location of the corresponding axial slice.

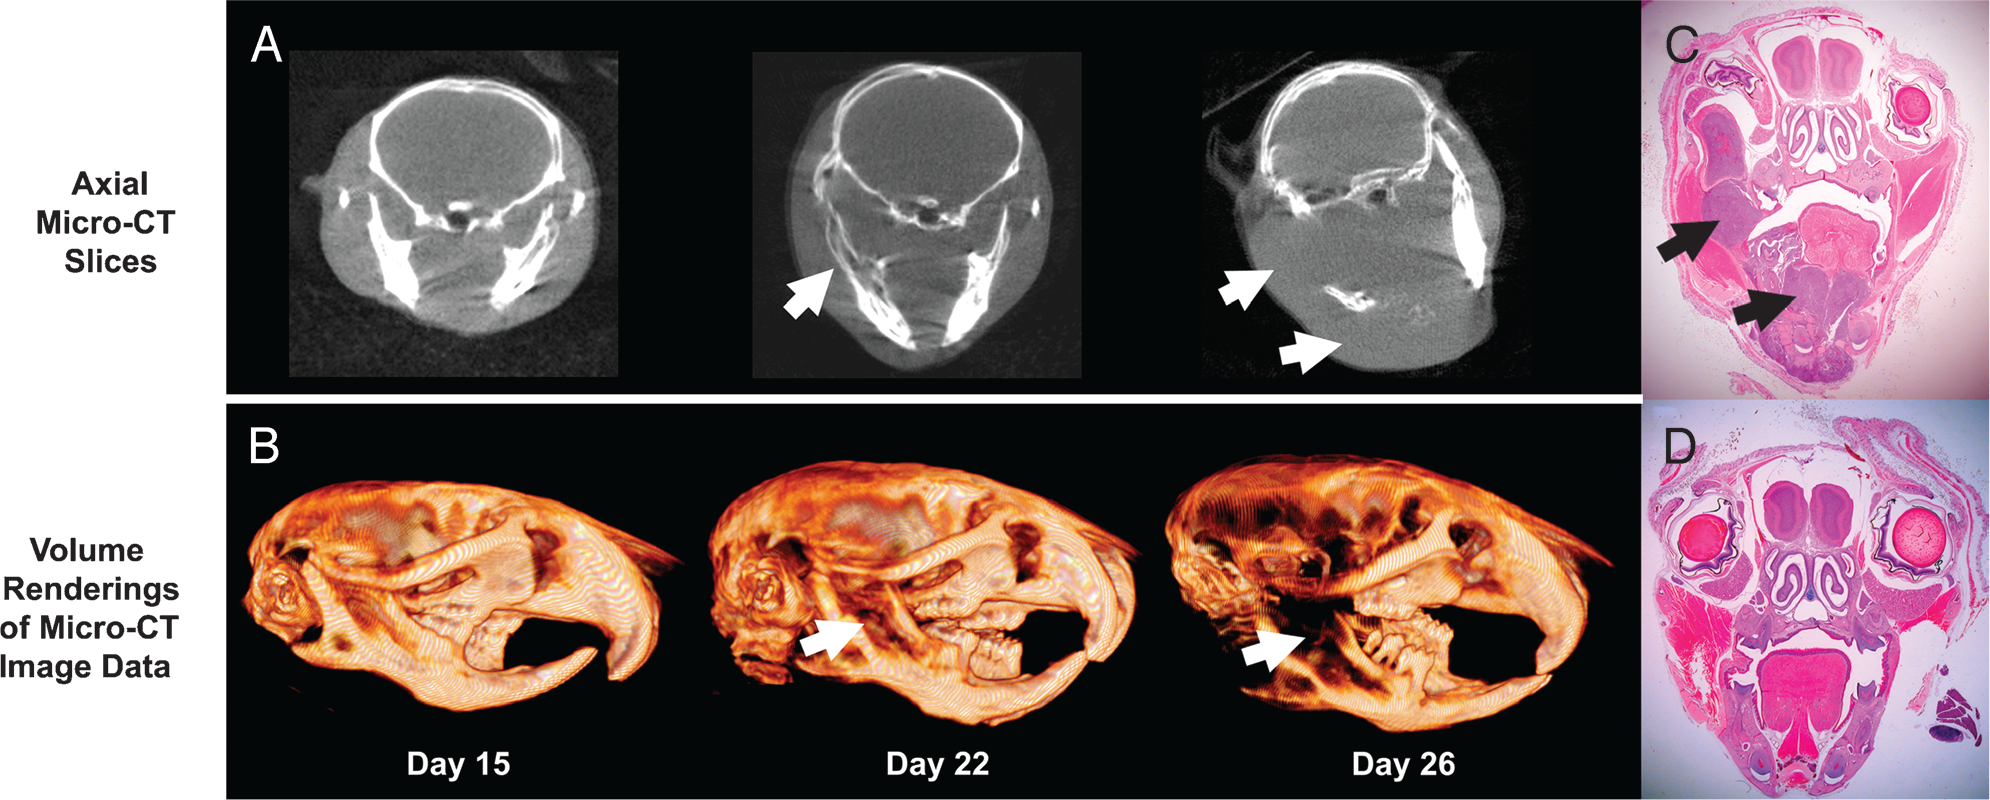
Progression of a mandibular metastasis. (A) Axial micro-CT slices showing the displacement of bone by tumor (arrows) starting at Day 22 and progressing until Day 26, (B) volume renderings of micro-CT image data. Note the osteolytic nature of the lesions. (C) Photomicrograph of the mandibular metastasis (arrows). Hematoxylin and eosin (H&E) stain, 2× objective. (D) Photomicrograph of a control mouse for comparison. H&E stain, 2× objective.

Micro-CT imaging of a subcutaneous metastasis. The time progression of the tumor (arrowheads) visualized by coronal micro-CT slices is shown on the left. The corresponding color-scaled volume renderings of the micro-CT image data is shown on the right. The segmented tumor volume is rendered in purple.

Time progression of bone metastases (arrows) of the femur and tibia. Surface renderings of micro-CT image data.
Discussion
Melanoma Model
Intravenous injection of B16 melanoma sublines into syngenic C57BL/6 mice is well documented in the literature to induce lung metastases. In the current study, intravenous injection of B16-F10 melanoma cells induced metastatic tumor formation in 59% of mice with a wide anatomical distribution. Although most injected mice did develop lung metastases, extrapulmonary metastases were also present in 100% of affected mice. Extrapulmonary metastases resulting from intravenous inoculation of B16 melanoma cells have been reported in the literature [3–5,16,17,20,21]. Arguello et al. [21] reported extrapulmonary metastases following intracardiac inoculation of a B16 cell subline, but not with intravenous injection of the cells. Vantyghem et al. [3] reported extrapulmonary metastases including ovary, peritoneal cavity, abdominal mesentery, and mesenteric lymph nodes. Investigations using GFP-transfected B16 cell lines have reported extrapulmonary metastases to bone, brain, liver, kidney, adrenal glands, lymph nodes, and muscle [4,5,20]. In this study, we injected 1 × 10⁵ B16-F10 cells intravenously; however, other studies have injected different numbers of cells, including 2 × 10⁴ [22,23], 5 × 10⁴ [3,17,22,24], 1 × 10⁵ [21], 1 × 10⁶ [5], and 5 × 10⁶ [4], and have reported differences in the distribution of the metastatic tumors. In addition, Vantyghem et al. [3] have reported that metastatic distribution of the lesions varied with the stage of estrus cycle of the mice at cell inoculation. In this study, we did not control for estrus phase at the time of cell injection. Also, an additional experimental factor that may have led to differences in metastatic distribution was the needle size used for cell inoculation. We used a small, 30-gauge needle for cell injections, which could have caused a portion of the injected cells to lyse and led to a smaller population of viable cells to form tumors. Although this may have led to a difference in metastatic distribution, the application of micro-CT and small-animal PET to characterize and follow the lesions remains unchanged.
Micro-CT Imaging
Studies describing the utility of micro-CT imaging to noninvasively detect and identify lung tumors in the mice have had promising results. Cavanaugh and coworkers [8] reported using micro-CT imaging to characterize a transgenic mouse model that developed lung tumors. Although micro-CT was shown to be able to detect lung tumors in vivo, the study did not present any longitudinal serial imaging to follow the progression of disease. Kennel and coworkers [12] reported performing serial micro-MRI and micro-CT imaging on a mouse lung tumor model by using the EMT-6 mammary carcinoma cell line. From this report, the micro-MRI imaging studies were unable to detect lung tumor formation in vivo due to excessive respiratory motion. In addition, the micro-CT imaging data showed that lung tumors could be detected in vivo; however, serial micro-CT imaging studies to follow the progression of the tumors had mixed results. Posteuthanasia studies for micro-MRI proved to be the best conditions for detecting lung tumors in that study. The current study builds upon Kennel's work by using micro-CT to follow the progression of metastatic lesions induced by the B16-F10 melanoma cell line.

Micro-CT and [18F]FDG PET imaging of a lung metastasis (arrowheads). Increased [18F]FDG accumulation is noted in the tumor (arrowheads), heart (long arrows), and brown fat tissue (short arrows). The vertical white lines are the location of the respective axial and sagittal slices. Images were collected on post cell inoculation Day 28.
In this study, micro-CT imaging was able to follow the development and progression of metastatic lesions in 70% of mice that developed metastatic tumors. Several examples of lesions that were noninvasively followed included a lung metastasis, mandibular metastasis, subcutaneous metastasis, and tibial/femoral metastasis. Using image analysis software, metastatic tumor volumes could be measured and monitored noninvasively. Potential applications of these methods include following tumor shrinkage in response to therapeutic treatment and assessment of tumor growth or recurrence in spite of treatments. Following tumor responses in the same animal over time is a powerful technique that provides unique information with respect to potential therapeutic efficacy of new drugs.
As expected, the use of micro-CT for lesion detection is best suited for anatomical regions that provide high contrast between lesion and normal tissue. Examples included lung tissue, where normal lung tissue density versus tumor tissue density provided excellent X-ray tissue contrast to define the tumor. Another example of the utility of micro-CT imaging technique was in the detection of anatomical changes to bone, where bone tissue density was high compared to surrounding soft tissue, including tumor. Due to limitations of the micro-CT imaging modality including resolution limits and the inability to distinguish between materials of similar radiodensity, several metastatic lesions could not be identified, either due to lack of adequate contrast between normal tissue and tumor tissue or due to the small size of the metastatic lesions. Examples of lesions poorly detected or not detected included intramarrow bone tumors, tumors in the parenchyma of organs such as kidney, tumors in the cranial vault adjacent to the brain, and spinal cord tumors that invaded the spinal canal without inducing bone changes to the surrounding vertebrae. Several of these examples are shown in Figure 1. In the case of soft-tissue lesions not detected by micro-CT, a more appropriate imaging modality for the detection of these lesions would be in the use of micro-MRI [25].
In addition, a concern when utilizing the micro-CT imaging modality in small-animal oncology models is the cumulative radiation dose given to the animal when performing longitudinal studies. Serial high-resolution micro-CT studies have been suggested to potentially lead to growth inhibition of the tumors due to the therapeutic dose from the micro-CT imaging studies [8]. Depending on the micro-CT imaging equipment and protocol used, radiation doses from a single micro-CT scan have been measured to range from 6 to 30 cGy [8,10,26]. In our hands, the radiation dose received by the animal from a single micro-CT scan has been measured to be approximately 8 cGy [27]. To adequately account for the potential effects of radiation dose when performing micro-CT imaging studies, appropriate control populations should be incorporated into the study design.
The current micro-CT imaging studies were not respiratory gated and did not utilize contrast medium. In vivo respiratory gated micro-CT scans have been shown to reduce motion artifact in performing thoracic imaging in mice [8]. It is likely that the lung tumor presented in Figure 2 had some blurring artifact due to respiratory motion. This blurring artifact could lead to error in the exact size measurement of the tumor. This study did not investigate this potential artifact. As the lung tumor progressed in size, the blurring artifact was most likely reduced due to adhesion of the tumor within the thoracic cavity and the difficulty of moving a large mass compared to a smaller mass. Blurring of other anatomical sites, such as the mandibular tumor (Figure 4) and the subcutaneous tumor (Figure 5), due to respiratory motion, if present, was very slight due to their anatomical location distant from the chest wall and diaphragmatic motion. The use of contrast media to improve visualization of soft tissues is routinely used in clinical imaging studies. In future studies, contrast agents could be used to improve the detection of soft-tissue metastases. To improve metastatic lung tumor imaging and postimaging measurements, we are currently investigating incorporating respiratory gating into our micro-CT scan protocols. However, incorporating contrast media and/or physiological gating into diagnostic protocols can increase image acquisition time, animal pretest preparation time, as well as study cost, and these factors must be considered in light of the potential benefits gained.
Small-Animal PET Imaging
In human clinical settings, [18F]FDG PET imaging is widely used to assess regional and distant metastatic disease in melanoma patients [28] and has been used to detect recurrent melanoma and assist in staging melanoma disease [29]. In addition, [18F]FDG PET imaging is currently used to monitor the response of tumor metabolism to oncology therapy treatments [30]. In preclinical studies, PET imaging is currently being used in mouse oncology models to monitor tumor response to therapy [13].
In this study, metastatic melanoma tumors were detected by [18F]FDG small-animal PET imaging in several different anatomical areas. The anatomical location of [18F]FDG tumor tissue uptake was confirmed by coregistration with micro-CT image data. These initial results confirm other work demonstrating the potential of using noninvasive [18F]FDG small-animal PET to monitor changes of tumor metabolism in response to therapy treatments of small-animal oncology models [13,31–33]. These small-animal imaging studies parallel human clinical studies to detect recurrent melanoma and monitor the response of tumor metabolism to therapy treatments.
Summary
The results of this study demonstrate the ability of micro-CT to follow the onset and progression of metastatic disease in a mouse model of melanoma in living subjects in several different tissue types and anatomical locations. In addition, small-animal PET imaging with [18F]FDG was able to target metastatic tumors in the mouse model and demonstrated increased uptake in tumor tissue relative to surrounding tissue. CT/PET fusion imaging correctly correlated radiotracer uptake with anatomical location demonstrating the utility of multimodality imaging in oncology models. Potential applications of these results include following tumor regression in small-animal oncology models in response to novel therapy treatments, both in terms of size (Micro-CT) and metabolism (small-animal PET). This study is another example of the power of these noninvasive imaging modalities to gain a deeper understanding of disease processes in living subjects.
Footnotes
Acknowledgments
This work was supported by the United States National Institutes of Health grants R01 CA72942-06 (TJH), P50 CA13013 (WAV), T32 RR07004 (CTW) and American Cancer Society grant RSG 99-331-04 (TJH). The authors thank the United States Department of Veteran Affairs Biomolecular Imaging Center at the Harry S. Truman Memorial Veterans Hospital, Columbia, MO, for support of the imaging studies, the histology staff at the University of Missouri—Research Animal Diagnostic Laboratory for exceptional histology expertise, and Tiffani Shelton and Lindsey Atkinson for excellent technical support. Portions of this work have been presented at the 2nd annual Society for Molecular Imaging meeting and the 54th annual American Association for Laboratory Animal Science meeting.