
Abstract
We present a method for registering histology and in vivo imaging that requires minimal microtoming and is automatic following the user's initialization. In this demonstration, we register a single hematoxylin-and-eosin-stained histological slide of a coronal section of a rat brain harboring a 9L gliosarcoma with an in vivo 7T MR image volume of the same brain. Because the spatial resolution of the in vivo MRI is limited, we add the step of obtaining a high spatial resolution, ex vivo MRI in situ for intermediate registration. The approach taken was to maximize mutual information in order to optimize the registration between all pairings of image data whether the sources are MRI, tissue block photograph, or stained sample photograph. The warping interpolant used was thin plate splines with the appropriate basis function for either 2-D or 3-D applications. All registrations were implemented by user initialization of the approximate pose between the two data sets, followed by automatic optimization based on maximizing mutual information. Only the higher quality anatomical images were used in the registration process; however, the spatial transformation was directly applied to a quantitative diffusion image. Quantitative diffusion maps from the registered location appeared highly correlated with the H&E slide. Overall, this approach provides a robust method for coregistration of in vivo images with histological sections and will have broad applications in the field of functional and molecular imaging.
Keywords
Introduction
The goal of correlating in vivo imaging results with histology has been sought for some time via methodology that is continuously evolving. This generic problem has at least two major components that must be addressed by all methods: (1) correcting for the 2-D distortions in the preparation and cutting of the histology specimen from the tissue block and (2) restoring the 3-D geometry of the tissue block back to its in vivo state. Typically, both steps require complex geometric transformations characterized by warping. Previous reports demonstrated a variety of methods. In 1995, Zimmer et al. [1] demonstrated that in vivo and ex vivo images of the cerebral distribution iron oxide nanoparticles in blood-brain barrier disrupted rats correlated well with histological section-matched iron maps. In 1997, Kim et al. [2] demonstrated an automatic method for warping neuroautoradiographic slices back to their geometry in the tissue block and then one final 3-D warping from the geometry of the tissue block to its geometry in the in vivo brain MRI image using mutual information [3,4] as the objective function and thin plate splines as the geometric warping interpolants [5]. In 1999, Jacobs et al. [6] described a sequential technique, first using Pelizzari et al.'s automatic surface fitting method for rigid structures [7] followed by manually defined warping using thin plate splines. In 2003–2004, Wilson's group published several articles describing the use of manually inserted needle tracks and the iterative closest point method [8] to register in vivo MRI with tissue slices in 3-D followed by the use of manually chosen homologous points augmented with points on contours to warp the 2-D histology slices back into the geometry of the tissue slices [9–11]. In 2004, Zarow et al. described postmortem MRI and brain tissue registration obtained using the Pearson cross-correlation coefficient first and mutual information last as two separately and sequentially applied objective functions and an nth-order polynomial as a 2-D (only) geometric warping interpolant [12]. In the following paragraphs we describe an automated method that is relatively free from user bias in locating homologous points in that it is driven by maximization of mutual information, can operate on multimodal data, and can handle mixed combinations of 2-D and 3-D data sets. The clinical implications of this methodology are that the partial volume, cellular bases for the resulting medical image intensities in complex tissues can be more closely correlated, that is, explained, than currently appreciated.
Methods
Intracranial Tumor Implantation
All of the animal work was carried out in the animal facility at University of Michigan in accordance with federal, local, and institutional guidelines. Intracerebral brain tumors were implanted in male Fischer 344 rats (Charles River Breeding Laboratories, Wilmington, MA) weighing between 125 and 150 g. Animals were anesthetized by an intraperitoneal administration of a ketamine (87 mg/kg)/xylazine (13 mg/kg) mixture. A small skin incision was made over the right hemisphere and a 1-mm-diameter burr hole was drilled through the skull. A sterile inoculum of 1 × 10⁵ 9L cells in 5 µL serum-free medium was introduced through a 27-gauge needle to a depth of 3 mm. Rats were allowed to recover after the burr hole was filled with bone wax and the skin was sutured closed.
In Vivo MRI Studies
In vivo quantitative maps of tumor apparent diffusion coefficient (ADC) were acquired using the previously described method [13]. Briefly, a trace diffusion sensitive multislice spin echo sequence (with motion compensation and a navigator echo) was used to acquire 13 slices with two different diffusion weightings (Δb value of 1148 sec/mm2). The slice thickness was 1 mm, image matrix was 128 × 128 (zero filled to 256), field of view was 30 × 30 mm, TR of 3 sec and TEeff of 60 msec). During all MRI procedures, animals were anaesthetized using 1.5% isoflurane and body temperature was maintained at 37°C with a heated water recirculating pad.
Histopathology and Ex Vivo MRI
Following in vivo imaging of the 9L tumor, animals were deeply anesthetized with ketamine/xylazine and then killed by exsanguination during transcardial perfusion of the brain with 4% paraformaldehyde in 0.1 M phosphate buffer (pH 7.4, ice-cold, 500 mL/rat, flow rate 50 mL/min.) The fixation was preceded by a short rinse with PBS (50 mL/rat). Once removed, brains were kept in 10% buffered formalin until used. Brains were then placed in test tubes of 10% buffered formalin and anatomical T2-weighted MR images were acquired ex vivo. The ex vivo MRI studies were accomplished using a high-resolution 3-D FSE, 128 × 128 × 32 slices, echo train = 16, TR = 4 sec, TE = 15 msec, and fov = 2 × 2 × 2 cm3 acquired by imaging the in vitro formalin-fixed specimen over several hours. Upon completion, brains were incubated for 24 hr in a 10% sucrose/PBS solution at 4°C for cryoprotection. The brains were then incubated for another 24 hr at 4°C in a 20% sucrose/PBS solution containing 0.01% sodium azide. Fixed brains were quickly frozen in dry ice and were stored at −80°C until used. Brains were then mounted to frozen wooden cutting chucks with Tissue-Tek® OCT compound and covered with black-dyed OCT compound for contrast enhancement. Transverse slices were cut in a cryostat microtome serially until the approximate level of interest was reached. A “block face” digital photograph was then taken and the subsequent 20-mm slice was isolated on a Superfrost Plus™ slide. Twenty-micrometer slices were serially isolated every 120 µm until we had passed through our area of interest. Slides were covered and allowed to air-dry overnight. Slides were then rehydrated at room temperature in PBS for 5 min and were stained with hematoxylin and eosin (H&E). Slides were digitized for coregistration with MR images.
MRI and Histology Registration in Mice
In the following we describe how we can map the location of a highly magnified histology section whose total field of view is typically smaller than an MRI voxel back to a computed voxel location in the in vivo MRI without the need for manual creation in tissue or definition of homologous points in images based on intensity variations; manually placed control (not homologous) points are used only to initialize a mutual information-driven optimization. Here we emphasize the difference between the function of “homologous” and “control” points. By definition, homologous points represent identical morphological structures within multiple volumes chosen either by an algorithm or expert; on the other hand, control points in splines are simply “handles” that the optimizer can move as hypothesized homologous points, while testing the hypothesis by searching for the optimal solution as defined by an objective function, that is, mutual information in our case.
In the following text we will interchangeably use the phrases “mapped onto” and “registered with,” for example, the “floating or homologous” data set is “mapped onto or registered with” the reference data set. Shown in Figure 1 is a schematic overview that describes in broad terms the scope and rationale behind the approach. This schema summarizes how mapping of a histological slide back to its correct anatomical location within an in vivo MRI volume can be accomplished. In the following paragraphs, additional methodological details of the individual steps are also provided. Note that the keystone in this whole process is the digital image of the tissue block face image prior to tissue sectioning by the microtome, as it will ultimately drive all of the important registrations that we describe. The block face slide images were captured by a digital camera and their contrast was increased using histogram equalization. The H&E slide image is a mosaic created by positioning many smaller, 10× magnification digital images together and decimating the number of voxels [14].

Overview schema for registration of a histological section with its corresponding in vivo MR image.
We begin at the bottom of the overview schema (Figure 1). After the histological slide is cut from the tissue block, it is inevitably deformed in a manner relatively uncorrelated with other adjacent cuts only tens of microns away. When the slide is not torn, this deformation can be recovered, that is, unwarped, by registering the resulting (H&E in this example) slide back onto the geometry of the block face. This transformation is reliably performed as a two-dimensional (2-D) thin plate spline (TPS) warping using 5–10 control points (here we use 7) using mutual information as the objective function [2]. In Ref. [2] as well as here, the control points are initially approximately uniformly distributed on the reference block face image, whereas only the first three are placed by the user in approximate homology on the floating image for initialization. While the reference control points remain stationary, the optimizer drives the loci of the control points in the floating image, that is, the H&E slide in this case, first using only three control points to approximate the transform as a (linear) full affine transform, and then finally using all 7 to warp the floating image such that the mutual information between the two data sets is maximized. All registrations described in this article were implemented using a software package developed at the University of Michigan that uses mutual information for automatic multimodality image fusion, referred to as MIAMI Fuse© [15]. Figure 2 shows the mapping accuracy achieved in restoring the original H&E slide shown in the schema above to the geometry of the block face. In addition to showing the geometrically restored H&E-stained tissue sample in Figure 2C, we have used a common “checkerboard” display in Figure 2B to show the alignment of multiple structures where each alternate checkerboard block comes from the alternate image. The computed transformation obtained by the optimal registration is denoted as T1 in the overview schema (Figure 1).

(A) Photographic image of the coronal tissue block face of a rat brain with a 9L tumor while located in the cryomicrotome just prior to sectioning. (B) The histological slide resulting from the sectioned, H&E-stained coronal section that was mapped onto block face image (2-D T1 transform, 12 DOF). (C) The H&E slide following restoration back to the block face geometry as a result of the T1 transformation (see Figure 1).
Now that the geometry of the histological section has been restored to that of the tissue block, we concentrated on ultimately mapping the correct 2-D manifold within the 3-D in vivo MRI onto the block face image (and consequently onto the H&E slide). Due to the lower spatial resolution of the in vivo MRI and the dramatic change in geometry after the brain has been removed from the cranium, we elected to register the block face with an intermediate ex vivo MRI scan rather than directly proceeding to registration with the in vivo MRI. In a sense, this replaces the complete serial sectioning of the block face to obtain the ex vivo geometry as we reported in our earlier publication [2]. The intermediate anatomical MRI scan is acquired from the ex vivo tissue specimen after it has been removed from the cranium before mounting on the cryomicrotome's cutting block. During the extraction of the brain following ex vivo fixation, the tumor and the normal surrounding parenchymal tissue undergo differential geometry change (for an example of this, see Figure 5A and where the dotted line approximates the surface of the brain as constrained by the cranium in vivo).

Ex vivo MRI mapped onto the block face via T2 transform (3-D, 18 DOF). (A) Checkerboard revealing the registration of the ex vivo MRI onto the block face image in Figure 1A. (B) The resulting ex vivo MR image that was mapped onto block face geometry. (C) Same as A but the registration is shown with overlay of block face in color and ex vivo MRI in gray scale.

(A-E) This series of images shows the result of the T2 reverse transform (Figure 1), that is, block face slice in color mapped onto adjacent ex vivo MRI slices in gray scale.

(A) Anterior coronal slice of the ex vivo reference volume. (Dotted line approximates the restraining boundary of the cranium in vivo.) (B) The checkerboard shows the mapping of the in vivo Lo-b MR image onto the ex vivo MR image. (C) View of the in vivo Lo-b MR image mapped onto the ex vivo MRI. (D) A color overlay of the ex vivo MR image with the grayscale in vivo Lo-b MR image is shown as an additional approach to view the overall registration quality.
Figure 3 demonstrates the results of mapping a 2-D manifold in the 3-D, ex vivo MRI volume onto the block face image using six control points where the 3-D TPS warping is automatically optimized using mutual information as the objective function [14]. This is computed by creating a thin 3-D “sandwich” from the 2-D block face image and its replica, and warping the 3-D in vitro MRI volume such that its intersection with the 3-D sandwich maximizes mutual information. The result of the mapping transformation, identified as T2 in the overall schema (Figure 1) of the ex vivo MRI is shown in Figure 3B, and the quality of the registration is shown both in Figure 3A and C. Additionally, in Figure 4A-E we show the resulting reverse mapping of a finite thickness of the block face image back onto the individual adjacent slices of the ex vivo MRI volume. In Figure 4, we observe that the manifold is indeed warped in a regular fashion consistent with a smoothly deformed 2-D manifold.
The next step addressed mapping of the in vivo MRI onto the geometry of the ex vivo MRI (Figure 1, label T3). As mentioned earlier, the challenge was to capture the dramatic warping required to map the in vivo MRI onto the dilated lesion in the ex vivo MRI. Although the in vivo diffusion MRI is lower resolution, nevertheless the region of support to obtain the registration is sufficiently large and provides enough information for this information-driven technique to succeed, as demonstrated in Figures 5, 6, and 7. Figures 5 and 6 show the results of the 3-D warping computed in the anterior portion of the rat brain, which in this case is the region most affected by the tumor size change upon extraction from the cranium in spite of ex vivo, in situ fixation. Figure 7 demonstrates the same 3-D warping that also affects the midbrain section that still contains significant tumor, but is less affected by the dilation. The mapping between the in vivo and ex vivo MRIs was computed using ex vivo MRI as the reference volume and the Lo-b vector component of the diffusion in vivo MRI as the floating volume; the resulting computed deformation was applied to all three vector components, Lo-b, Hi-b, and ADCo. Figure 5A-D shows the results of mapping the Lo-b diffusion in vivo MRI scan onto the ex vivo MRI scan. Note the high quality of the automatic registration in this anterior region obtained using a 14-control-point TPS warping computed by optimizing mutual information between the two data sets; in 3-D the degrees of freedom (DOF) of the warping equal 3n, where n is the number of control points. Figure 6A-D demonstrates the same warping applied to the ADCo vector image component of the in vivo diffusion scan. Figure 7A-D demonstrates the same 3-D warping affecting the midbrain region of the brain. Normally, the deformation between two 3-D volumes is not as great as seen in this case, and we are able to use fewer control points with a schedule whose complexity begins only with linear transforms and ends with warping, but in this case the deformation is sufficiently great that we must both use more control points and initiate the registration using a manual placement of all 14 control points in the floating data set. The density of control points is highest in the region of the dilated tumor in order to accommodate the greater warping curvature needed.

(A) The identical slice of the ex vivo reference volume as shown above (Figure 5A) is shown. (B) Checkerboard overlay that shows the mapping of the in vivo ADCo MR image onto the ex vivo MR image computed using the Lo-b component mapping. (C) A view of the in vivo ADCo MR image mapped onto the ex vivo MR image. (D) A color overlay of the ex vivo MR image with the grayscale in vivo ADCo MR image.

(A) A midbrain coronal slice of the ex vivo reference volume. (B) A checkerboard showing the mapping of the in vivo ADCo MR image onto the ex vivo MR image computed using the Lo-b component mapping. (C) A view of in vivo ADCo MR image mapped onto the ex vivo MR image. (D) A color overlay of the ex vivo MR image with the grayscale in vivo ADCo MR image.
After computing transformation T3 we were nearing our goal of completely defining the mapping from histology to in vivo MRI if we have made no errors in the previous steps. However, error-free registration is unlikely across multiple warping transformations, especially where there are relatively large changes in local deformations and an in vivo MRI of relatively low resolution. Therefore, the information generated at this point in the process was used to initialize one final registration to improve the resulting geometric accuracy of the final solution. In this last maneuver we used the reverse of the now estimated T2(T3[in vivo MRI]) transformation to map seven control points from the reference block face image shown in Figure 8A back onto a 2-D manifold in the 3-D in vivo MRI volume, as shown by the smaller blue spheres in Figure 8B. The in vivo MRI (Figure 8B) was used as the “floating” image in this registration where the seven pairs of blue spheres provided the initial estimates of the warping to be computed. Again, a registration of the 3-D in vivo data as mapped onto the block face image was computed by optimizing the positions of the control points in the floating image where the objective function to be optimized was the mutual information between the green color component of the block face image and the Hi-b vector component of the diffusion in vivo MRI volume. The Hi-b vector component was chosen for this registration instead of the Lo-b component used in the previous registration due to the increased dynamic range of mutual information between those two components. The pink spheres in Figure 8B demonstrate the final positions obtained by the optimization of mutual information. The registration obtained is demonstrated by the color overlay shown in Figure 8C. Note the excellent agreement visualized in Figure 8C. Figure 8D is obtained by replacing the block face image in Figure 8C with the registered H&E slide. The transformation computed in this last step is labeled as T4 in the overview schema and represents the last step required to map any pixel in the H&E slide into a voxel in the vivo diffusion MRI scan.
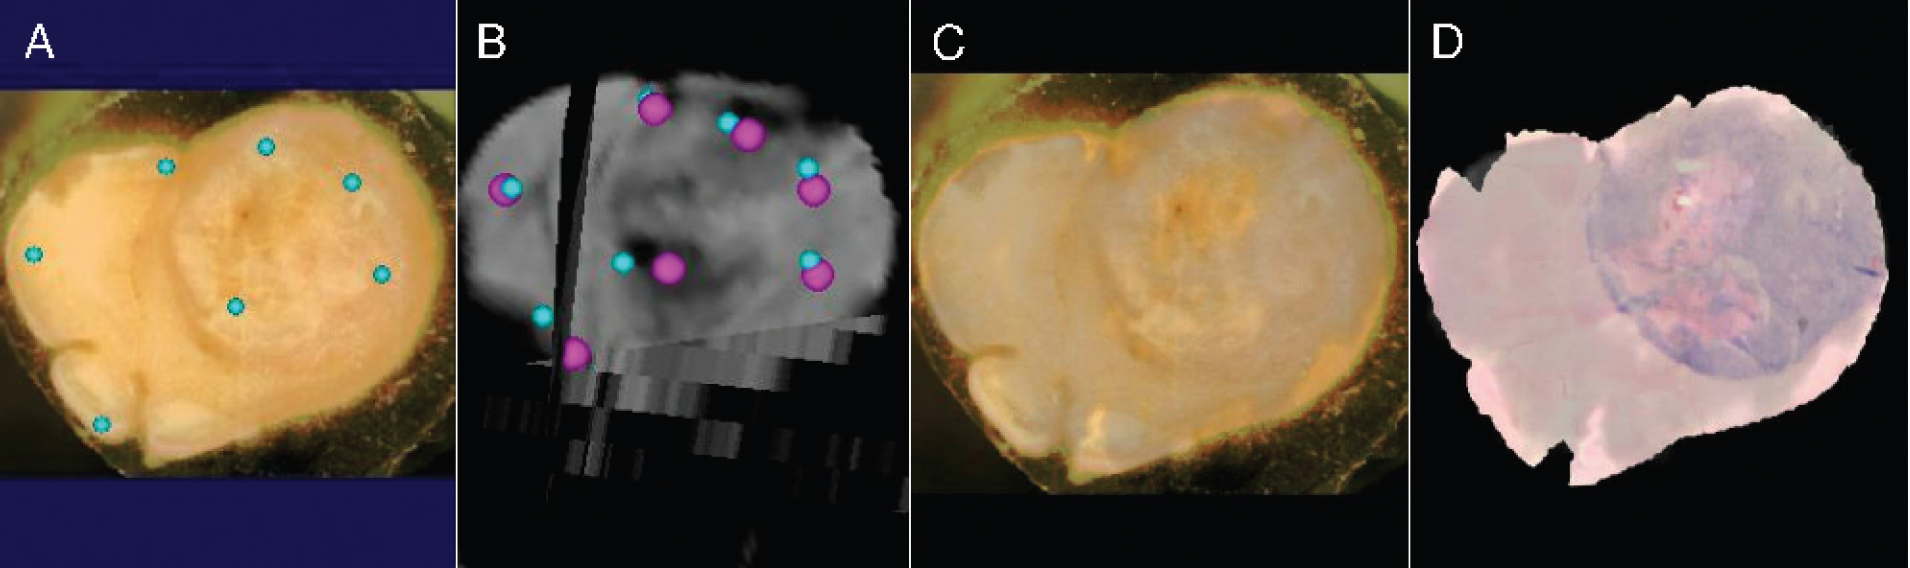
(A) The block face reference image with seven control points. Note that these reference points do not move. (21 DOF mapping). (B) Small blue spheres represent initial mapping of points shown on block face shown on the left into the in vivo Hi-b MR image volume. After one final registration optimization, they have been moved to the pink positions. (C) A color overlay of the block face image with the registered grayscale Hi-b in vivo MR image resulting from the final control point positions shown in pink in B. (D) Same images as in C except that color block face image has been replaced with the H&E slide mapped onto the block face's geometry (note the excellent quality of the registration).
Results
Figure 9A-C emphasizes the resulting solution by showing the geometric agreement between the ADCo in vivo MRI scan mapped onto the block face geometry and the H&E slide also mapped onto the block face geometry as shown in Figures 2B and 8D. In addition to providing a checkerboard image in Figure 9C to compare edges of structures, we have drawn the identical region of interest (ROI) on Figure 9A and B. The region that corresponds to the location of high diffusion (Figure 9B) is shown in the H&E image (Figure 9A). Microphotographs (inset) reveal a significant loss of cellularity due to the presence of spontaneous necrosis in the high-diffusion area as compared to a region outside the high-diffusion area (inset) that revealed high cell density. This data reveals the power of this method, as it provides an opportunity to precisely map histological data onto the in vivo images (in this case, diffusion MRI) allowing for histological basis of the imaging changes to be determined.

(A) The H&E-stained slide restored (mapped) back to the block face geometry. A large area of spontaneous necrosis is delineated by the white outlined boundary. (B) The same mapping as in Figure 8C and D above was applied to the in vivo ADCo MR image volume. The large necrotic region within the circled ROI is consistent with an increase in ADCo values for that region. (C) A checkerboard verification of registration of in vivo ADCo MR image onto the H&E slide, which was also restored to block face geometry. Inset images are H&E-stained microphotographs of a tumor tissue region within the area of high diffusion and from a region outside of the high-diffusion region. These regions are also delineated in B for correlation of the diffusion image with histology. (Bars represent 50 µm).
This provided the opportunity to map a pixel on the H&E (or any other stain) slide directly onto the block face image via T1 and then into the in vivo diffusion MRI volume using the reverse T4 transformation. Because the TPS solutions possess no closed-form inverse, the reverse, that is, reversing the role of the data sets and associated control points as reference and homologous images, can be used as the starting point in an iteratively computed inverse using a numerical Newton-based iterative technique.
Summary
In summary, we have demonstrated a method by which any loci on the histology slide can be mapped back to the corresponding in vivo MRI voxels without significant microtome-hours or compute times (each of the component registrations were obtained in less than 5 min except for T3, which required approximately 10 min to compute).
There are several possible modifications that we envision can be explored for further increasing the robustness of the technique without significantly increasing man-hours or computational burden to perform this registration. For example, by acquiring a high-resolution in vivo anatomical MRI in addition to the diffusion MRI it may be possible to map directly from the block face image onto the anatomical MRI and eliminate the need for the high-resolution ex vivo MRI; the transformation between the two in vivo scans, that is, high-resolution anatomical and the diffusion scan, is essentially a rigid body transform and easily computed. Additionally, the use of deeper seeded, more invasive tumors should lead to the need for less dramatic warping between the in vivo and ex vivo conditions. Of course, because we are using mutual information as an objective function, in the true theoretical sense the success of this methodology assumes that the tissue being imaged is intrinsically feature rich in all of the modalities; this condition is easily satisfied for most histological studies.
The ability to precisely map histological information back onto imaging data sets using the robust approach detailed here provides many important opportunities for validation studies in the area of molecular imaging. For example, detection of a presumed molecular event as a signal obtained in a tomographic imaging study can now be directly compared with its corresponding histological information such as immunohistochemical markers.
Footnotes
Acknowledgments
This work was funded by DHHS, PHS, NIH, and NCI grants 1P01CA85878, R24CA83099, and P50CA46592. The authors thank Tim Desmond and Kirk Frey, MD, PhD, for providing the equipment and for assistance in cryomicrotome sectioning and staining of the tissue samples.