
Abstract
Amide's a Medical Image Data Examiner (AMIDE) has been developed as a user-friendly, open-source software tool for displaying and analyzing multimodality volumetric medical images. Central to the package's abilities to simultaneously display multiple data sets (e.g., PET, CT, MRI) and regions of interest is the on-demand data reslicing implemented within the program. Data sets can be freely shifted, rotated, viewed, and analyzed with the program automatically handling interpolation as needed from the original data. Validation has been performed by comparing the output of AMIDE with that of several existing software packages. AMIDE runs on UNIX, Macintosh OS X, and Microsoft Windows platforms, and it is freely available with source code under the terms of the GNU General Public License.
Introduction
In the molecular and medical imaging community today, there is a paucity of software tools available for volumetric image analysis that are freely available, modifiable, and relatively feature-complete. While a number of packages exist, few of these packages encompass all the features that a researcher may desire, and only a subset of these can be freely modified by the researcher for her or his needs (see Table 1). For a researcher wishing to do multimodality image analysis, the choices are further constrained as the majority of packages are restricted to strictly orthogonal or planar processing of data sets. This particular limitation will become more pronounced as the role of multimodality imaging increases in importance [1].
In light of this need, Amide's a Medical Image Data Examiner (AMIDE) has been developed to provide the research community with a relatively full-featured, freely available, and open-source solution for single and multi-modality volumetric medical image analysis. AMIDE, licensed under the General Public License (GPL) [2], is freely modifiable and redistributable, and it is not dependent on any proprietary underlying packages.
In addition to being open source, AMIDE is unique in that it has been designed to avoid specific constraints of previous software packages. Data sets (e.g., PET, CT, MRI) and regions of interest (ROIs) are logically organized within a tree structure so that an unlimited number of these items can be displayed, modified, and analyzed simultaneously. Furthermore, data sets in AMIDE are not restricted to processing along orthogonal directions. Instead, information is continuously interpolated as needed from the original data to allow for nondestructive and nonorthogonal reslicing of anisotropic data sets. This ability facilitates manual alignment and fused viewing of multiple medical images within an AMIDE session, and it allows for seamless handling of data sets with differing voxel sizes and dimensions.
A List Comparing AMIDE with Several Available Molecular Imaging Software Packages

The “nonorthogonal” interface designation indicates that the program does not need to reslice the entire data set when showing a nonorthogonal viewing plane.
AMIDE provides a variety of additional features useful to the molecular imaging researcher, including fully three-dimensional ROI drawing and analysis for static and dynamic images, two- and three-way-linked viewing (dual cursor mode), rigid body registration using fiducial markers, filtering and cropping of data sets, movie generation, series viewing, and volume rendering.
Description
Underlying Concepts
The data hierarchy within AMIDE is built around a tree abstraction composed of a succession of objects such as data sets and ROIs (described below). Conceptually, any object type can be the child of any other object type, although not all pairings are necessarily logical. Generally, data set objects will be the children of the study object, and ROI objects will be the children of either the study object or a specific data set object. The tree-based hierarchy allows operations performed on an object, such as shifts and rotations, to be successively mapped down to all of that object's children.

Each object in AMIDE is assigned its own Euclidean space, and the location of this local coordinate frame is defined with respect to the global coordinate frame. When information from one object is needed by another object, AMIDE automatically handles the requisite affine (linear plus translation) transformations between the spaces, as shown in Figure 1. This approach allows the rotation or movement of a data set object to be accomplished by a simple alteration of the parameters specifying the object's local coordinate frame, rather than the destructive reslicing of the image data.
Diagram of coordinate transforms done by AMIDE. Each object in AMIDE (1) is defined with respect to its own Euclidean space, with transformations between different spaces performed as needed. When the user clicks on the display (2), a slice request is formed for each data set (3). The program then translates each slice request into the local coordinate frame of the appropriate data set (4) and fills the slice with interpolated data (5). The extracted data is thresholded, colored, and fused (6) into a single image for display to the user (2). Similarly, to calculate statistics for an ROI, the three-dimensional ROI geometry is transformed into the Euclidean space of the data set (7), and the voxels enclosed in this volume are iterated over to tabulate the statistical values. Salient user interface elements of AMIDE. A standard AMIDE session is shown, with the most important elements of the user interface labeled.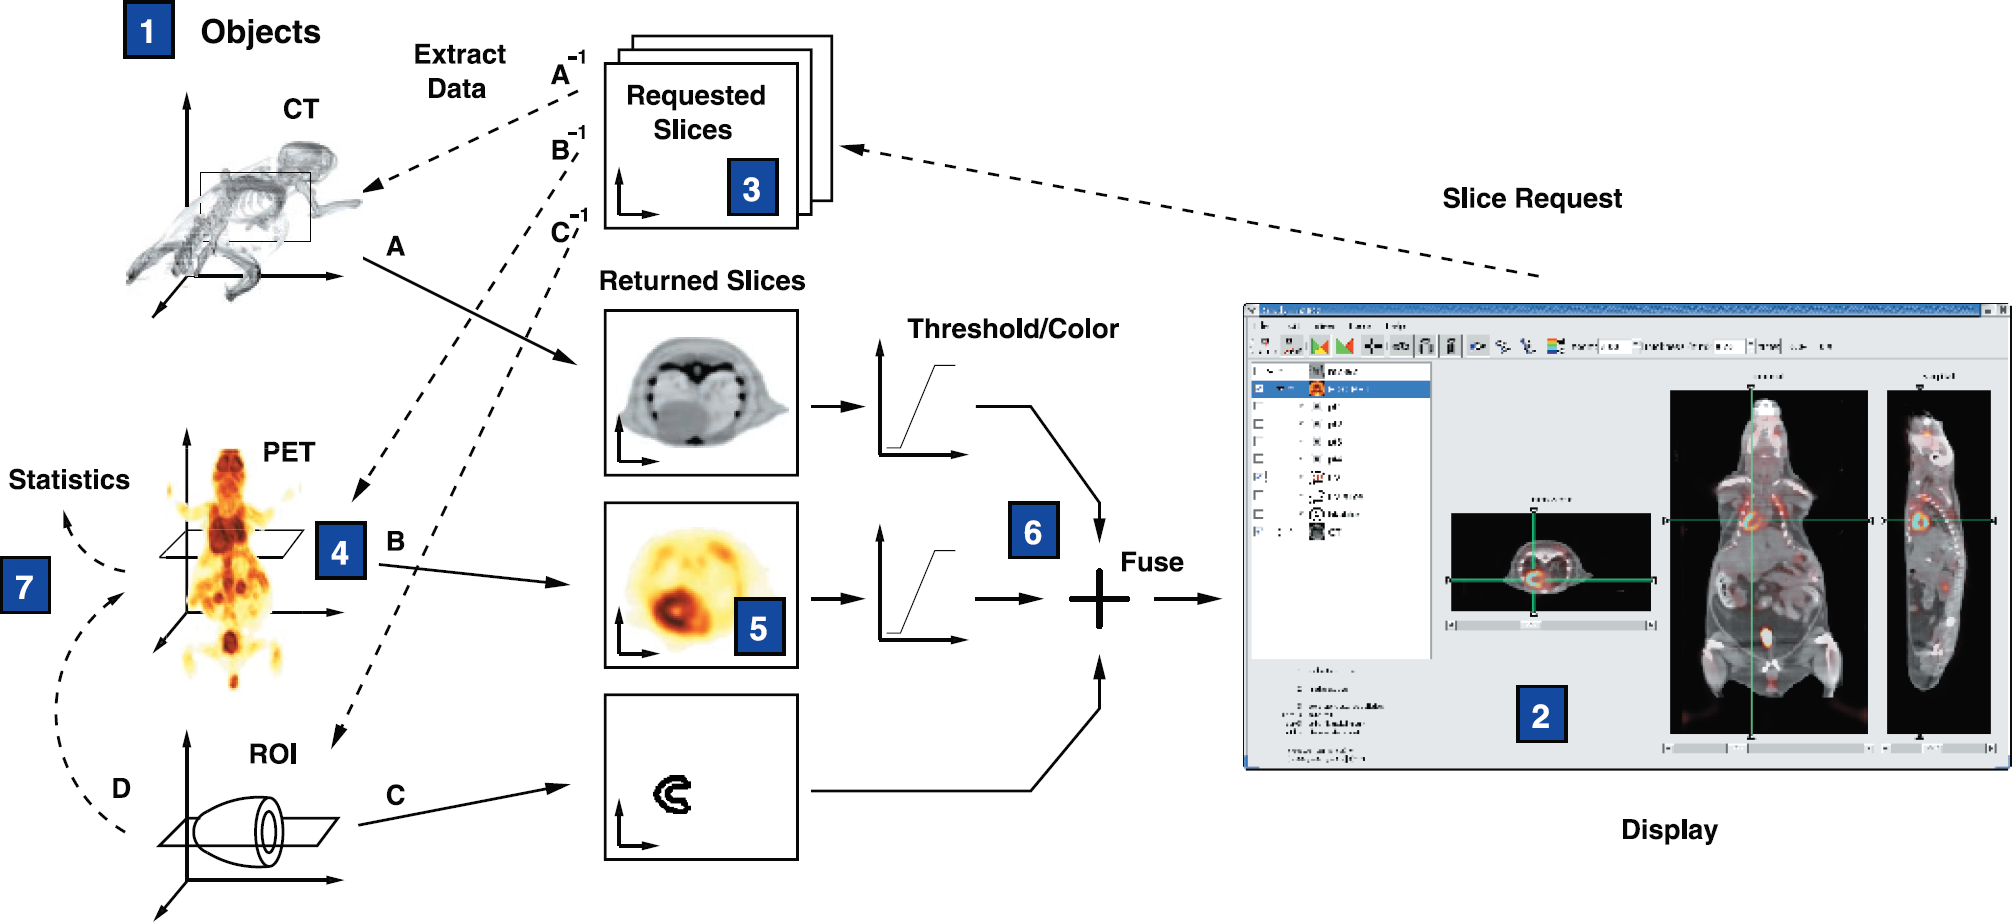

Implementation
The C programming language was chosen for the coding of AMIDE for several reasons, the three most important being the general familiarity of most researchers with this language, the ready availability of high performance C compilers on current operating systems, and the desire to avoid burdening the program with requirements on underlying proprietary packages such as Matlab or IDL. The specific compiler used in this work was GNU Compiler Collection (GCC, gcc.gnu.org).
Version 2 of the GTK+/GNOME toolkit (www.gnome.org) was used for the user interface and object model. This toolkit was chosen for a combination of portability, a C language interface, and free licensing. Much of the core functionality of AMIDE has been written as an extension to this toolkit in order to provide a convenient interface for using AMIDE functionality in separate pieces of code.
ROI Statistics Generated for Similarly Placed and Sized ROIs Using Five Different Image Analysis Programs

The first entry is from a calibration cylinder, with the remaining three entries from an [18F]FDG PET scan. Values expressed as 1000 × mean image units ± SD.
AMIDE saves studies in an eXtensible Markup Language (XML)-based directory format. Each object's parameters and data format information are saved in a text file, with the raw image data saved as a separate binary file. This approach allows data files to be easily viewed and manipulated externally to the program, guards against endian incompatibilities (incompatibilities due to the inconsistent ordering of stored data between different processor architectures), and makes backward and forward file compatibility easy to maintain between different versions of the program.
Data importing is done primarily through the (X)MedCon image conversion library [4], a software project that provides image reading and conversion between many of the more commonly used medical image formats. Currently supported file formats include DICOM 3.0, ECAT 6.4/7.2, Acr/Nema 2.0, Analyze (SPM), InterFile 3.3, and Concorde. Additionally, raw data importation in big, little, and PDP endian formats is handled natively for both integer and floating point data.
Volume rendering in AMIDE is performed using the VolPack [5] volume rendering library, which accelerates rendering using a shear-warp factorization algorithm. This software-library-based approach is portable and provides for true volume rendering capability, as opposed to the surface rendering approaches provided by many libraries and hardware accelerators. Series of rendered images, along with series of slices (fly throughs), can be encoded into MPEG-1 video files using the fame MPEG encoding library (fame.sf.net).
Rigid body registration is implemented inside of AMIDE through the use of fiducial reference markers and the Procrustes rigid body alignment algorithm without scaling [6]. Briefly, the transform needed to minimize the least-squares error between a set of fixed and a set of movable fiducial marks is calculated. This transform is then applied to the coordinate space of the data set to be aligned.
Filtering is implemented using a “wizard” interface. Currently, Gaussian and median filters have been implemented, although any finite impulse response filter would be a trivial extension. Finite impulse response filters are implemented using an overlap + add method with a 643-point fast Fourier transform. Median filters are of variable kernel size and can be run as separable 1-D or a single 3-D filter. In the interest of algorithmic simplicity, spatial coherence is ignored and the median filter is implemented using a partial sort median finding algorithm [7].
Validation
The validation animal data set, consisting of PET and CT scans, was acquired as follows: A nude mouse (Charles River Laboratories, Wilmington, MA), anesthetized with pentobarbital, was injected with 200 μCi [18F]-fluoro 2-deoxy-glucose ([18F]FDG). One hour was allowed for tracer uptake and clearance. The mouse was then placed on a plastic bed, and four fiducial reference markers were affixed. Fiducial markers consisted of 200 μl PCR tubes containing 1 μCi of [18F]FDG and 10 μl Omnipaque (iohexal) nonionic iodinated contrast solution. The mouse was scanned on a microPET scanner built at UCLA [8] using seven bed positions at 4 min/bed. Immediately after, a two-bed position, CT scan with 196 views/bed was acquired using an ImTek microCAT scanner [9], with the X-ray tube at 50 kVp, 300 mA, and 1.0 mm aluminum filtration. All animal care and euthanasia was performed with the approval of the University of California Animal Research Committee. The validation cylinder consisted of a 37-mm-diameter polysulfone cylinder filled with 262 μCi of [18F]FDG in 70 ml water and was scanned in a single bed position for 4 hr.
Times Needed for Performing Various Functions in AMIDE Listed for a 128 × 128 × 159 PET Image on a 750 MHz i686 Class Computer with 384 MB RAM

After loading the data sets into AMIDE, the four fiducial reference markers were located for each of the two scans, and the data sets were aligned using a rigid body alignment. Results of this alignment are shown in Figures 3 and 4. The calculated fiducial reference error for this alignment was 0.2 mm/reference point.
Main window of AMIDE shown in three cursor mode with two aligned data sets loaded and displayed on coronal views. The right view shows an [18F]FDG image of a mouse centered around the left ventricle in an inverted hot metal color scale. The left view displays the corresponding CT scan in gray scale. The center view shows the fused images. The heart is on the left because the animal was scanned in the prone position. The spots of activity exterior to the mouse are fiducial reference markers. The PET data set has a voxel size of 0.4 × 0.4 × 0.7 mm, while the CT data set has a voxel size of 0.2 × 0.2 × 0.2 mm. Example of fused data sets rendered stereoscopically by AMIDE using the VolPack volume rendering library. The CT scan is shown in gray scale with the [18F]FDG PET scan shown in inverse hot metal.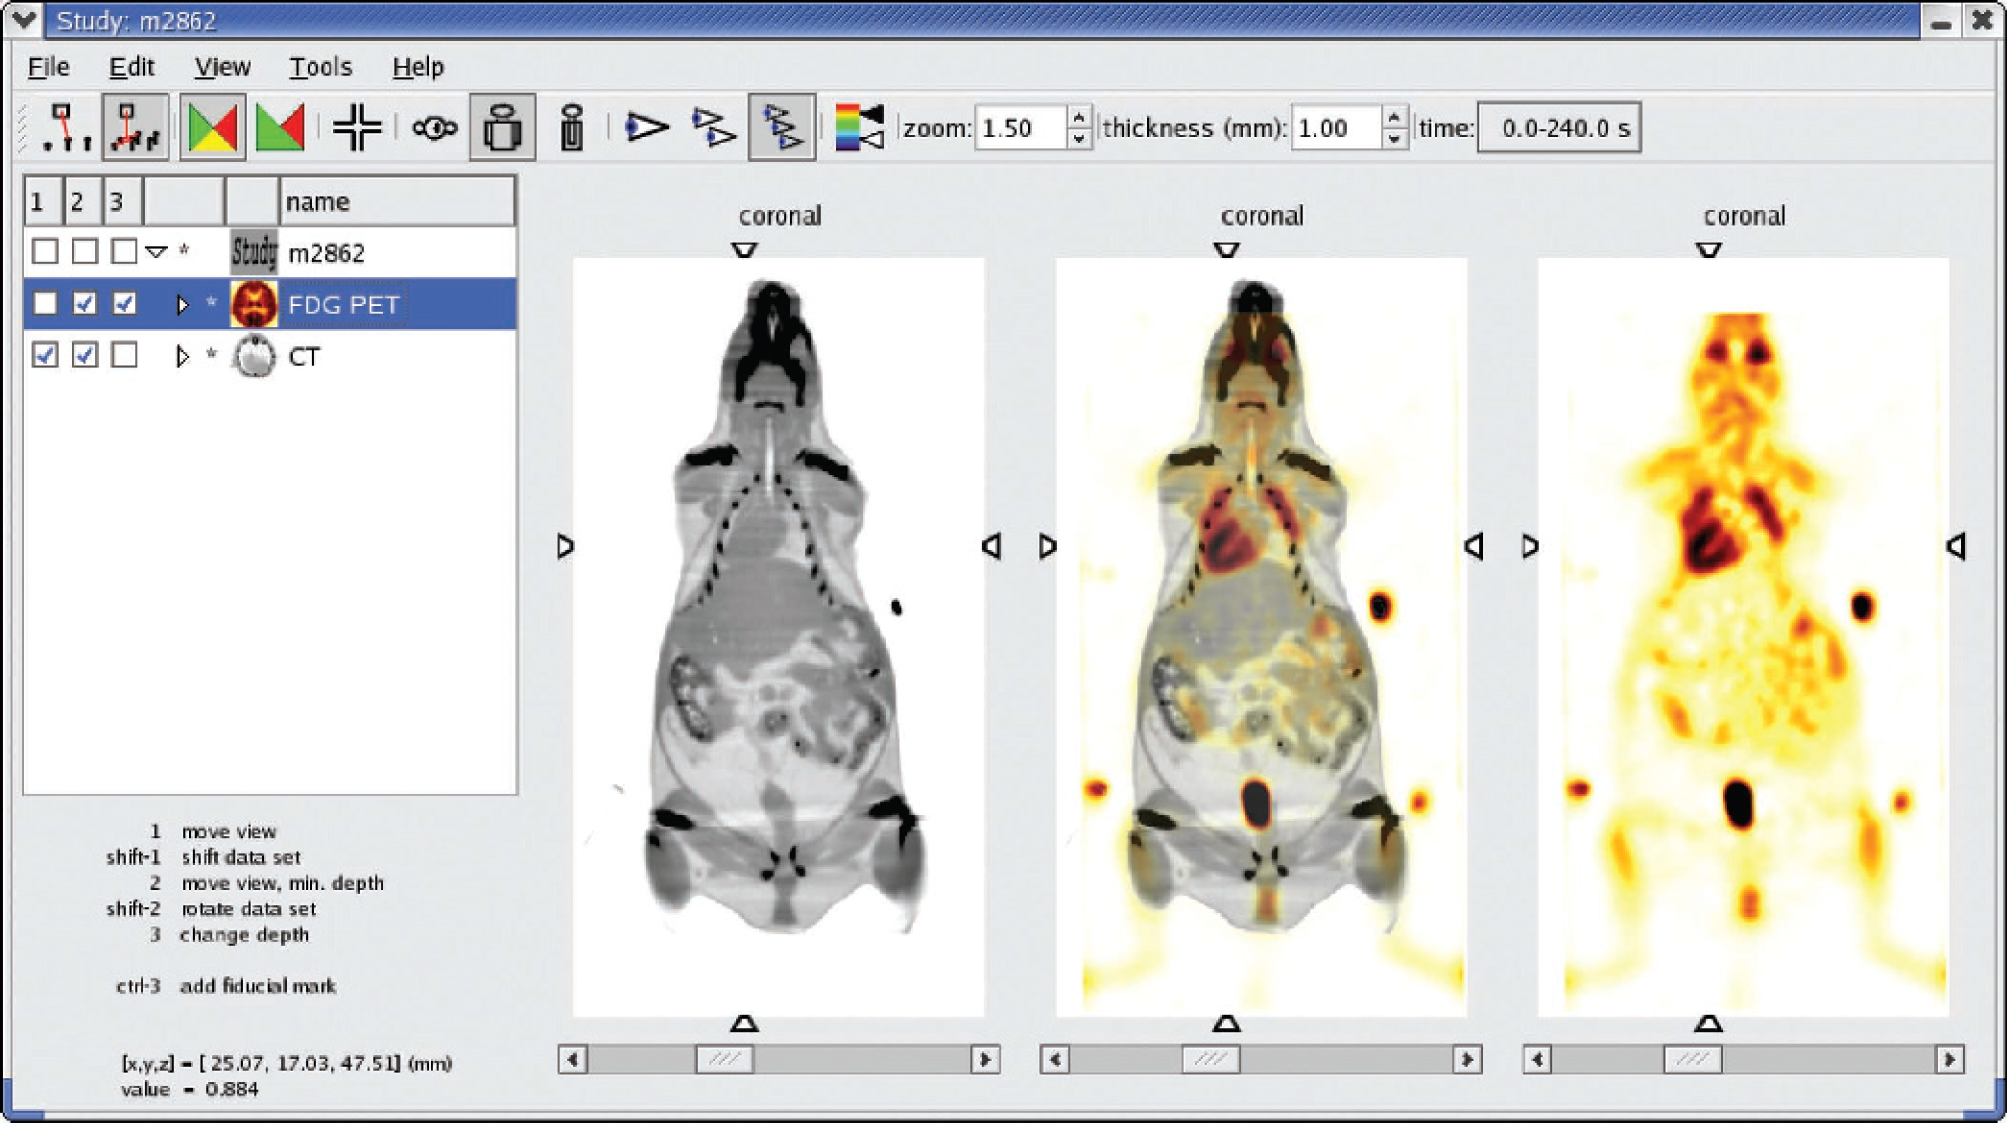

For validation of the ROI statistics, similar ROIs were drawn in AMIDE, CTI's Clinical Applications Programming Package (CAPP), Mediman [11], MRIcro, and CRIIISP, an IDL-based image package developed previously in our laboratory. The results are shown in Table 2. The values generated by AMIDE were not significantly different from any of the other packages when compared using a two-tailed paired t test at a significance level of p <0.2.
Availability/Requirements
All required source code and installation instructions can be found through the AMIDE website (amide.sf.net), along with binaries for Linux/i386, Macintosh OS X (Apple Computer, Cupertino, CA), and Microsoft Windows (Microsoft, Redmond, WA) platforms. The Macintosh version relies on the freely available Fink (fink.sf net) add-on distribution.
There are no strict hardware requirements for running AMIDE, but the computer will need to have at least as much memory available as the cumulative size of the loaded data sets. Additionally, because the continuous reslicing approach is computationally expensive, a modern processor (≥ 500 MHz) is recommended when working with larger (5123) data sets. Representative computational times needed for various functions are shown in Table 3.
Walk-Through
Figure 2 points out the most important elements of the AMIDE user interface. A brief walkthrough follows to explain how to use the program.
On program startup, the user is presented with a blank study and can then import the requisite medical images into the program. Most medical image formats are correctly detected by the program (e.g., DICOM, Analyze, Concorde, ECAT 7, InterFile). If the format cannot be determined, the user is allowed to explicitly specify the import file type. After importing data, the entire study can be saved in AMIDE's native file format for direct loading in subsequent sessions. The data sets will now appear as objects in the study's tree. Left-clicking on an object will select it for appearance in the three orthogonal views, and a check will appear in the corresponding checkbox. Right-clicking on any object in the tree will bring up a dialog for changing parameters relevant to that object, such as voxel sizes, scale factors, and thresholds. Note that one of the data sets in Figure 2 is highlighted, which indicates that this data set is the “active” object. When operations are performed which can logically apply to only one data set, the active object is the one chosen. For instance, pressing the thresholding tool button will bring up the thresholding dialog for the active object. The middle mouse button can be used for switching the active object. Context-sensitive help is displayed in the lower left corner of the application to explain what the different mouse buttons and key strokes will do at any given point. Complete documentation is also available from the Help menu. Moving through the data set is accomplished by directly clicking on any of the orthogonal views. For instance, clicking on the transverse view will update the coronal and sagittal views to correspond to the chosen point. In Figure 2, all three orthogonal views are shown, although the viewer can select fewer views by toggling the view selector buttons on the toolbar. The active data set can be shifted or rotated with respect to the other objects in the study by using the shift key together with the left or middle mouse buttons, respectively. The zoom and the thickness of the viewed slices can be altered by using the corresponding entries on the toolbar. For dynamic studies, clicking the “frame selector” button will pop up a dialog for frame selection purposes. Also on the toolbar is a set of toggle buttons for switching between single and multiple (linked) cursor mode viewing. An example of three cursor mode is shown in Figure 3. ROIs are added to the study either from the menu, or by directly clicking in the tree. After an ROI has been added to the tree, the next mouse click on any of the views will initiate the process of drawing an ROI, with the left button initiating edge-to-edge drawing and the middle button initiating center-out drawing. Subsequent modifications of the ROI can be done by clicking on the ROI in any of the views. Shifting, rotating, and scaling are accomplished by the left, middle, and right mouse buttons, respectively. Statistics for ROIs are generated by selecting “ROI Statistics” underneath the tools menu. Underneath the view menu are options for generating series of slices and volume renderings of the currently selected data sets. Both of these options will pop up separate windows for the corresponding purpose. Series of slices can be displayed over space or time. From the volume rendering dialog, animated movies can be generated and saved as MPEG-1 files. An example of a stereoscopically rendered fusion data set generated inside AMIDE is shown in Figure 4. Entries under the tools menu start wizards for various functions such as filtering, rigid body alignment, cropping of data sets, and fly through movie generation. Examples of both fly through and rendered movies can be found at the AMIDE website (amide.sf.net/output.html).
Discussion
With the increasing prevalence of multimodality imaging in the research community, a need has arisen for new, more sophisticated software tools that can handle and analyze these increasingly complex data sets. AMIDE provides such a tool, and AMIDE's capability for manipulating multiple, nonorthogonal data sets will become increasingly critical as multimodality image analysis becomes more common.
While a handful of proprietary tools exist that provide relatively comparable feature sets, to our knowledge AMIDE is the only freely available and open-source software package in its class. Because the source code is available, researchers are not only free to use the program but can also study and expand upon the program as fits their needs and interests. Furthermore, as the code is unencumbered by restrictive licensing users are free to redistribute both the code and any modifications made to it, although modified versions must be appropriately marked as such.
For the novice user, additional advantages of AMIDE are the simplified interface and unit handling. Continuous beta testing and feedback over the last 2 years from three basic science researchers with minimal imaging experience has been incorporated into the development of the user interface in order to make program interaction as intuitive as possible. Units in the program are, whenever practicable, specified in terms of real world values, and the underlying digital representation of the data is, to a great extent, divorced from the user. For instance, in the slices viewed from the data set, the thickness is not restricted to integer multiples of the voxel size. As another example, given the correct conversion constants, the program can present data and statistics to the user directly in terms of %ID/g or SUVs.
The continuous reslicing approach adapted by AMIDE has proven itself to be flexible from a development aspect and crucial for the arbitrary image fusion abilities of the package. It makes movement, scaling, and rotation of data sets essentially free from a computational standpoint while avoiding destructive interpolation of the original data set. The trade-off is that the computational expense of slice generation is greatly increased compared to an orthogonal slice based approach. In practice, it has been found that modern processors (≥ 500 MHz) are powerful enough that the added computational expense of this approach does not impact the user experience for standard sized data sets (≤ 5123).
AMIDE now encompasses the core set of features needed for bringing multimodality medical image analysis to the molecular imaging research community. Further work is shifting towards extending upon these core facilities, particularly in providing interactive “wizard” interfaces for making advanced medical imaging algorithms (e.g., factor analysis, cardiac polar maps) more accessible to the casual research user. It is hoped that not only will the package be a valuable addition to the molecular and medical imaging software toolkit, but that other research groups will seize upon the availability and extensibility of the package's source code and choose AMIDE as a platform upon which their ideas and algorithms can be readily disseminated to the molecular and medical imaging research community as a whole.
Footnotes
Acknowledgments
The authors thank all the beta testers of the software, most notably Dr. Anna M. Wu, Dr. Christophe Deroose, and Helen Su. Dr. Gobalakrishnan Sundaresan aided with the acquisition of the PET/CT data sets used in the examples.
This work was supported in part by a Department of Defense NDSEG Fellowship (AML), NIH MSTP training grant GM08042 (AML), the Aesculapians Fund of the UCLA School of Medicine (AML), Department of Energy Contract DE-FC03-87ER60615 (SSG), and NIH grants P50 CA 86306 (SSG), R0-1 CA82214 (SSG), and SAIRP R24 CA92865 (SSG).