
Abstract
Malondialdehyde (MDA) is used for the estimation of damage by reactive oxygen species. MDA is a major reactive aldehyde resulting from the peroxidation of biological membranes. The most common method used to assess MDA production is the thiobarbituric acid (TBARS) assay. However, the value of this method is curbed by low specificity and has been criticized for its use in human studies. In the present study we have used an alternative method for the estimation of MDA production i.e. reaction of MDA with a chromogenic agent 1-methyl-2-phenylindole at 45°C. The paper describes the method of preparing standards for the estimation of MDA (lipid peroxidation) after the treatment with an oxidative stress inducing agent hydrogen peroxide (H2O2). In the present study, the treatments of 1, 5, 10, 20, 50, 100, 150 and 200 μM of H2O2 induced significant increase in lipid peroxidation as compared to the untreated ones. The results suggest that the present method can be used to measure the lipid peroxidation in cultured human peripheral blood lymphocytes and is specific for MDA estimation.
INTRODUCTION
The major reactive aldehyde resulting from the peroxidation of biological membranes is malondialdehyde (MDA) (Vaca et al., 1988). It is used as an indicator of tissue damage by a series of chain reactions (Ohkawa et al., 1979). Figure 1 demonstrates the steps of lipid peroxidation (Alessio, 2000). MDA reacts with thiobarbituric acid to produce a red colored product. The direct assessment and measurement of free radicals is hampered by their brief half-lives, the higher relativity and short migration distance (Bergendi et al., 1999). Indirect methods, such as the measurement of products resulting from the peroxidative decomposition of PUFA e.g. 4-hydroxynonenal (4HNE) and malondialdehyde (MDA) are used for the estimation of the damage by reactive oxygen species (Esterbauer and Cheeseman, 1990). Lipid oxidation products, such as 4HNE, is cytotoxic, hepatotoxic, mutagenic and genotoxic. MDA reacts with DNA and forms adducts with deoxyguanosine and deoxyadenosine (Marnett 1999). It can also modify RNA, proteins and other biomolecules (Esterbauer and Cheeseman, 1990). The production of MDA is estimated by the thiobarbituric acid reactive substances assay (TBARS) (Esterbauer and Cheeseman, 1990; Marnett, 1999). However, the value of this method is reduced by low specificity and the possible reaction of malondialdehyde with other cellular constituents (Drapper and Hadley, 1990; Esterbauer and Cheeseman, 1990; Livingstone et al., 1990). Thus developing an assay MDA with an alternative method of higher specificity may prove useful in assessing lipid peroxidation. One such method of MDA determination involves the reaction of a chromogenic agent 1-methyl-2-phenylindole, with MDA at 45°C. Two molecules of 1-methyl-2-phenylindole react with one molecule of MDA to form a stable chromophore having maximal absorbance at 586 nm (Gerard-Monnier et al., 1998). In the present study, we have estimated the lipid peroxidation which is induced by hydrogen peroxide in cultured human lymphocytes.
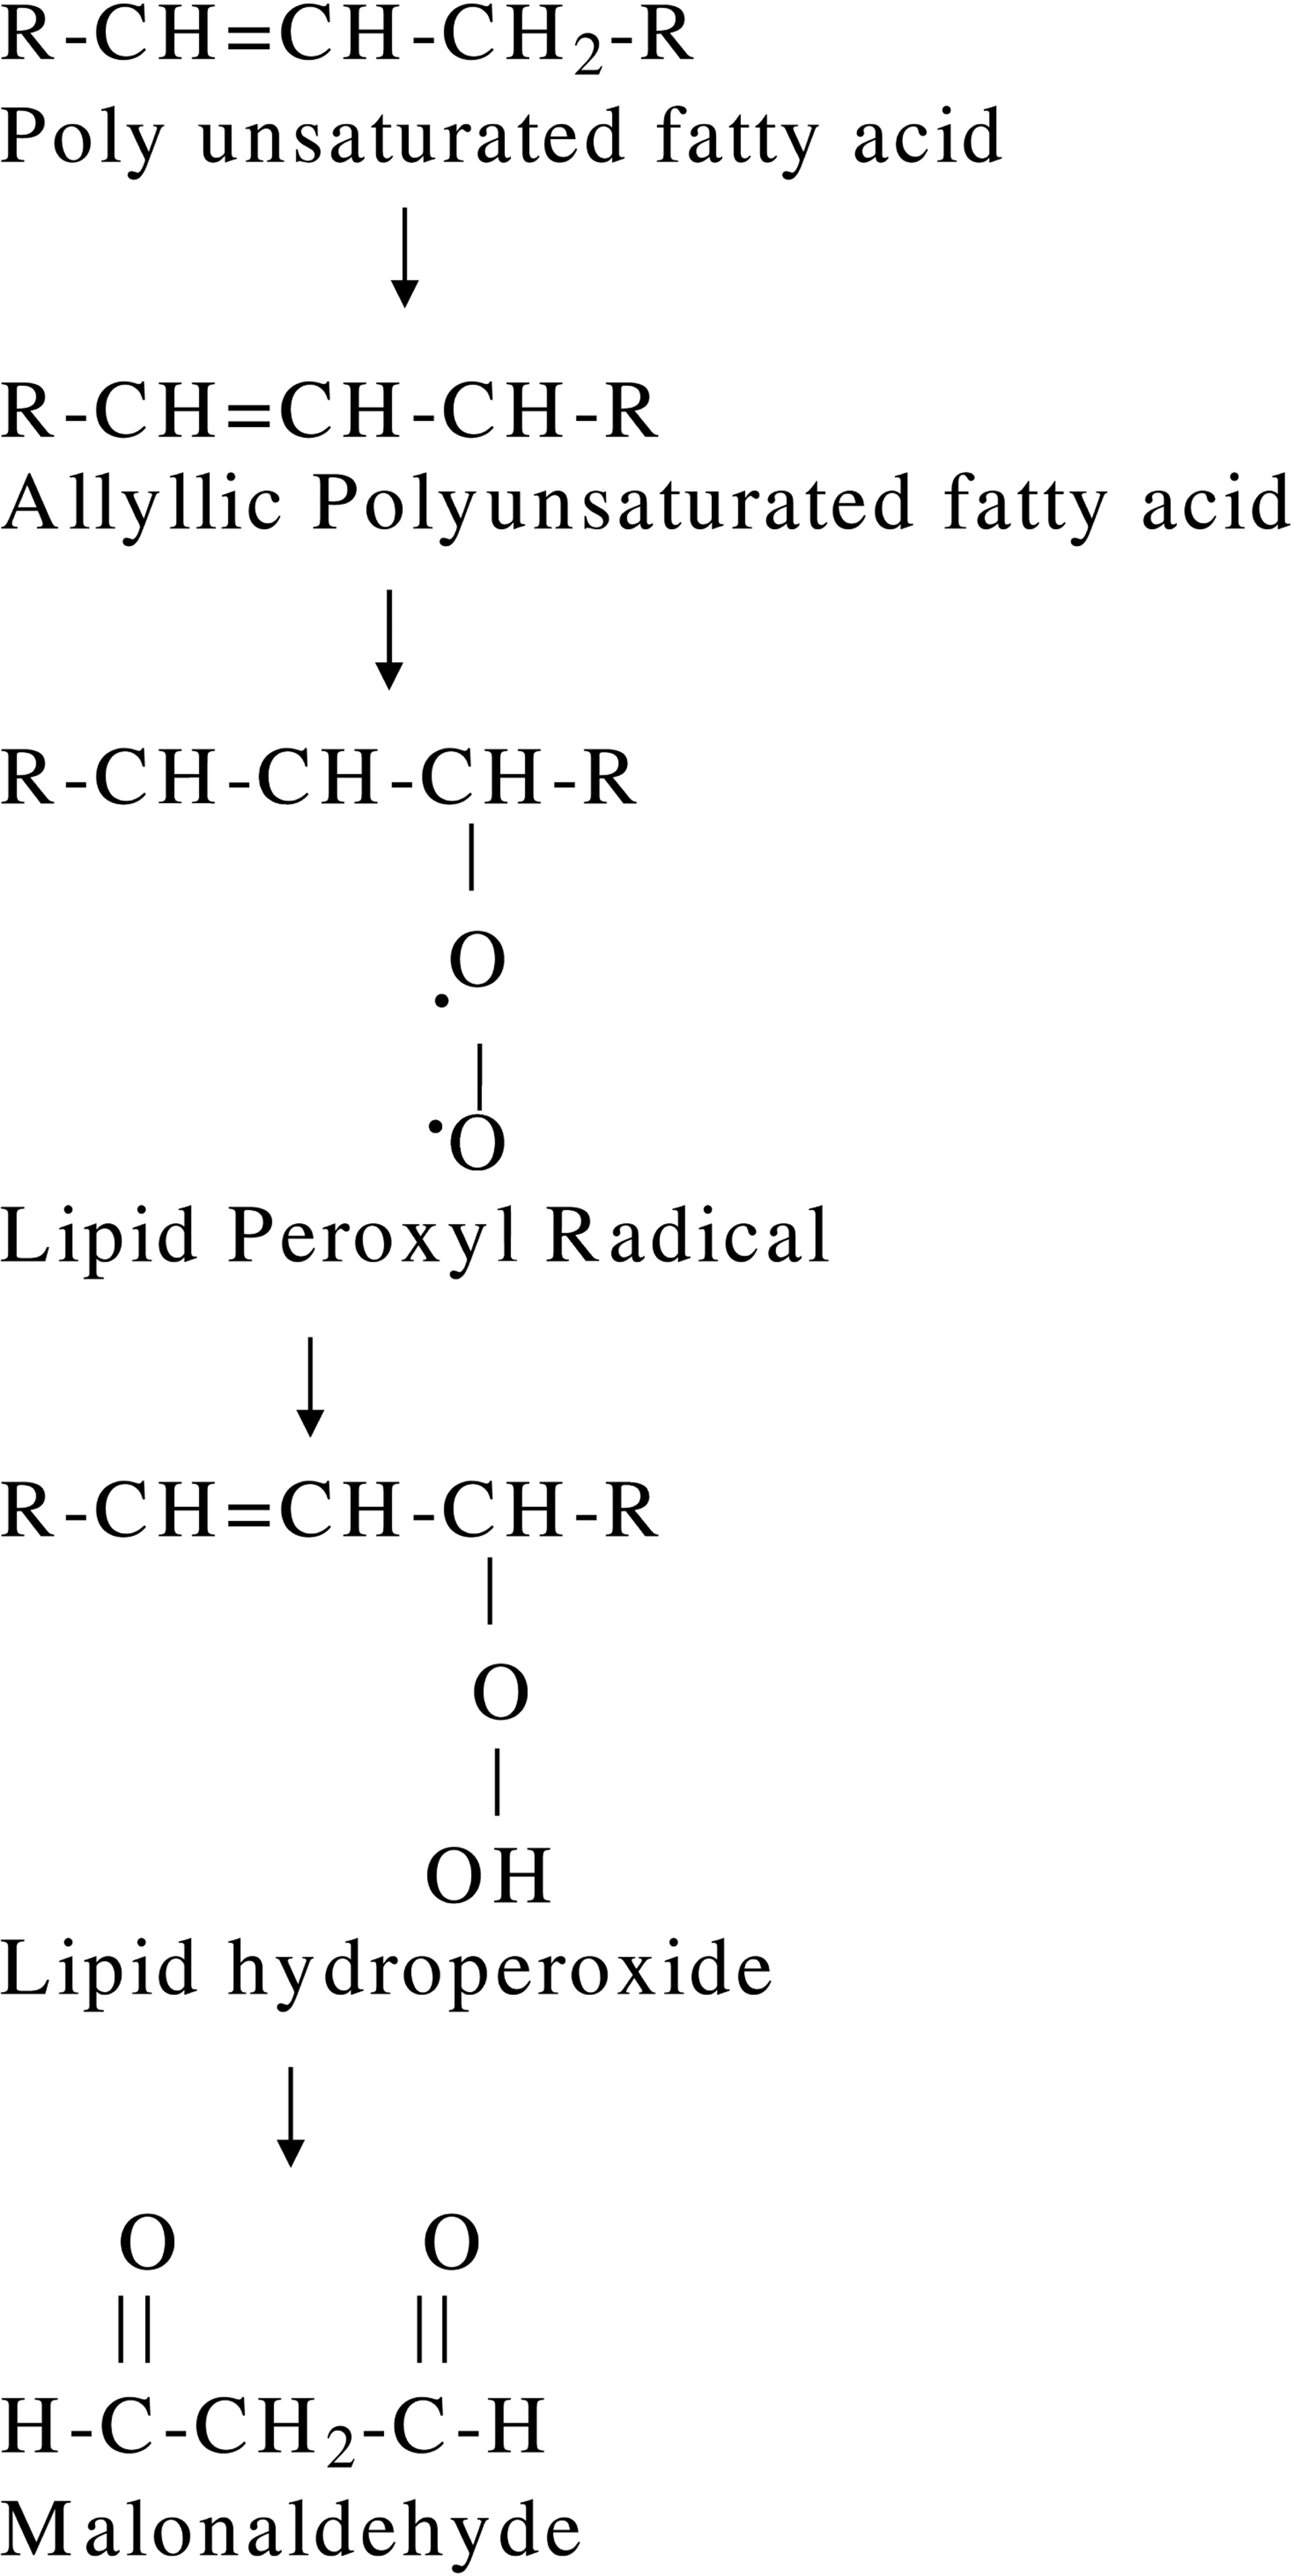
Steps of lipid peroxidation (Alessio, 2000).
MATERIALS AND METHODS
Chemicals
1-methyl-2-phenylindole and 1,1,3,3, tetra methoxypropane were purchased from Sigma. Acetonitrile and TRIS were purchased from SRL, India. Methanol and HCl were purched from Qualigens, India. RPMI 1640, phytohaemagglutinin-M, antibiotic (Penicillin G sodium & Streptomycin) – antimycotic (amphotericin B) mixture (CAT No. 15240-096) and fetal calf serum were purchased from Gibco. All chemicals were of analytical grade.
Human lymphocyte culture and lipid peroxidation assay
Triplicate peripheral blood cultures were performed according to Carballo et al. (1993). Peripheral blood samples were aseptically collected in heparinized sterile glass tubes from three healthy individuals (22 – 25 years old). A haemocytometer was used to count the number of viable cells. Typically, each culture consisted of an initial density of 0.5×10⁶ cells in 1 mL of culture medium. 0.5 mL of blood was supplemented with 5 mL of culture medium (RPMI – 1640), 1.5 mL of fetal calf serum, 0.1 mL of antibiotic (1000 units/ml Penicillin G sodium and 10,000 μg/ml Streptomycin sulphate) – antimycotic (25 μg/ml amphotericin B) mixture and 0.1 mL of phytohaemagglutinin in glass culture tubes. Cells were incubated at 37°C for 24 h.
Treatment of cells
After 24 h, the cells were treated with 1, 5, 10, 20, 50, 100, 150 and 200 μM of hydrogen peroxide and were kept in the incubator at 37°C for another 24 and 48 h. Untreated and negative controls (200μL distilled water) were also run simultaneously.
Preparation of buffers
Reagent 1 (R1)was prepared by dissolving 0.064g of 1-methyl-2-phenylindole into 30 mL of acetonitrile to which 10 mL of methanol was added to bring the volume to 40 ml. The preparation of 37% HCl served as the reagent R2.
Preparation of Standard
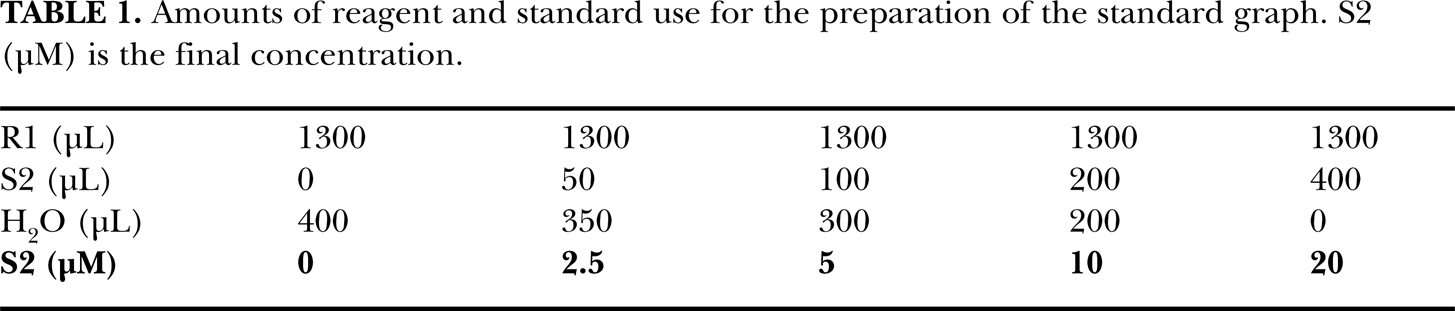
The standard (S2) was prepared by dissolving 16.5μl of 1,1, 3,3-tetramethoxypropane in 10 ml of 20mM Tris HCl (0.242g of Tris HCl in 100ml H2O DW). The solution S2 was diluted to 1:100 in H2O (DW) (i.e. 20 μL of S2 was added to 2 mL of H2O). The final volumes were measured into 2 mL microcentrifuge tubes, as shown in Table 1. The tubes were vortexed and 300 μL of R2 was added to each tube. The vortexed tubes were further incubated at 45°C for 40 min. After incubation, tubes were cooled in ice and centrifuged at 15000 g for 10 min. All samples were read on a double beam spectrophotometer (Analyticajena specord 5.0) at 586 nm.
Amounts of reagent and standard use for the preparation of the standard graph. S2 (μM) is the final concentration.
Procedure for treated cells
After incubation for 24 h, the treated blood cultures were centrifuged at 3000 g for 20 min, and subsequently the supernatants were collected. In a microcentrifuge tube 1300 μL of R1 was taken. 1 mL of supernatant was diluted 10 times with Tris HCl and 200 μL of this diluted supernatant from each culture was added to 200 μL of distilled water and vortexed. 300 μL of R2 to each tube, which were then vortexed and incubated at 45°C for 40 min. After incubation, the tubes were cooled in ice and centrifuged at 15000 g for 10 min at 4°C. All samples were read on a double beam spectrophotometer (Analyticajena specord 5.0) at 586 nm. The same procedure was adopted for the treated cells for 48 h duration.
Statistical analysis
The statistical analyses were done using Statistica Soft Inc. The student's t-test was applied to observe the significant difference between treatments and controls. Regression analysis was performed using Statistica Soft Inc.
RESULTS
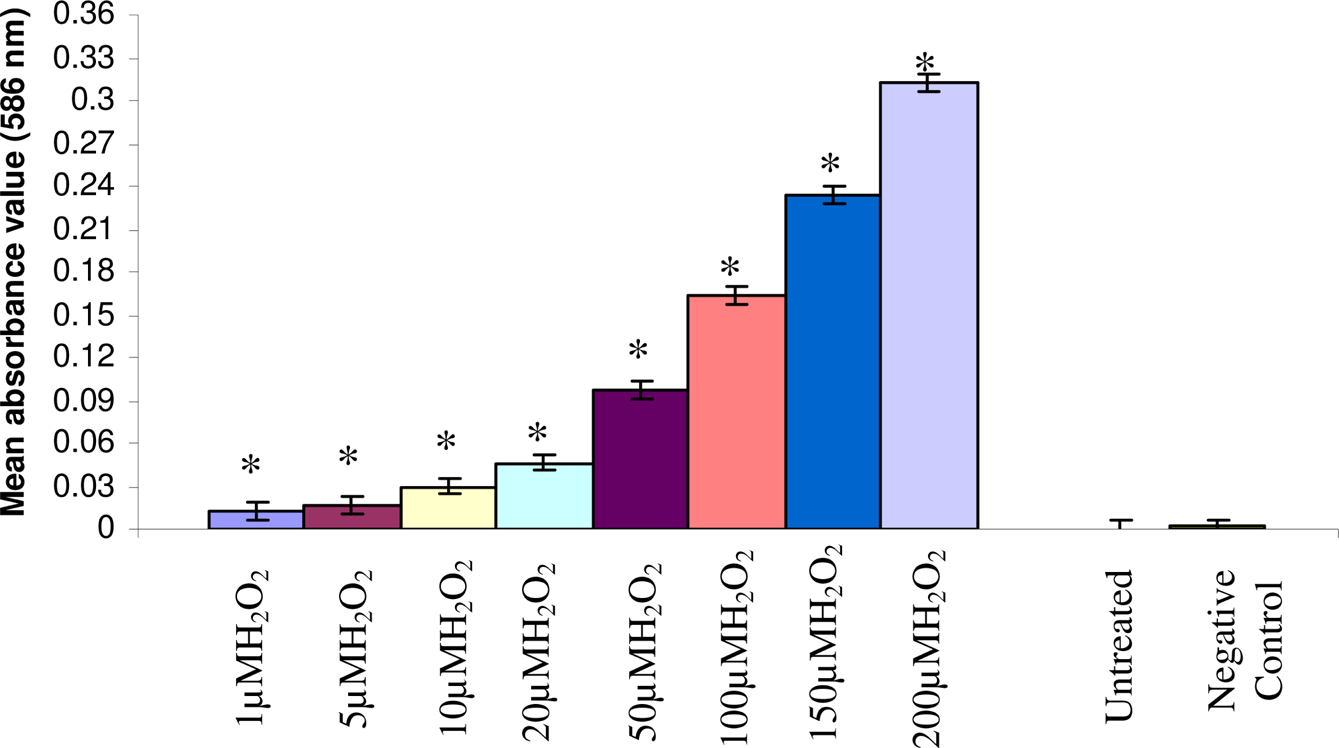
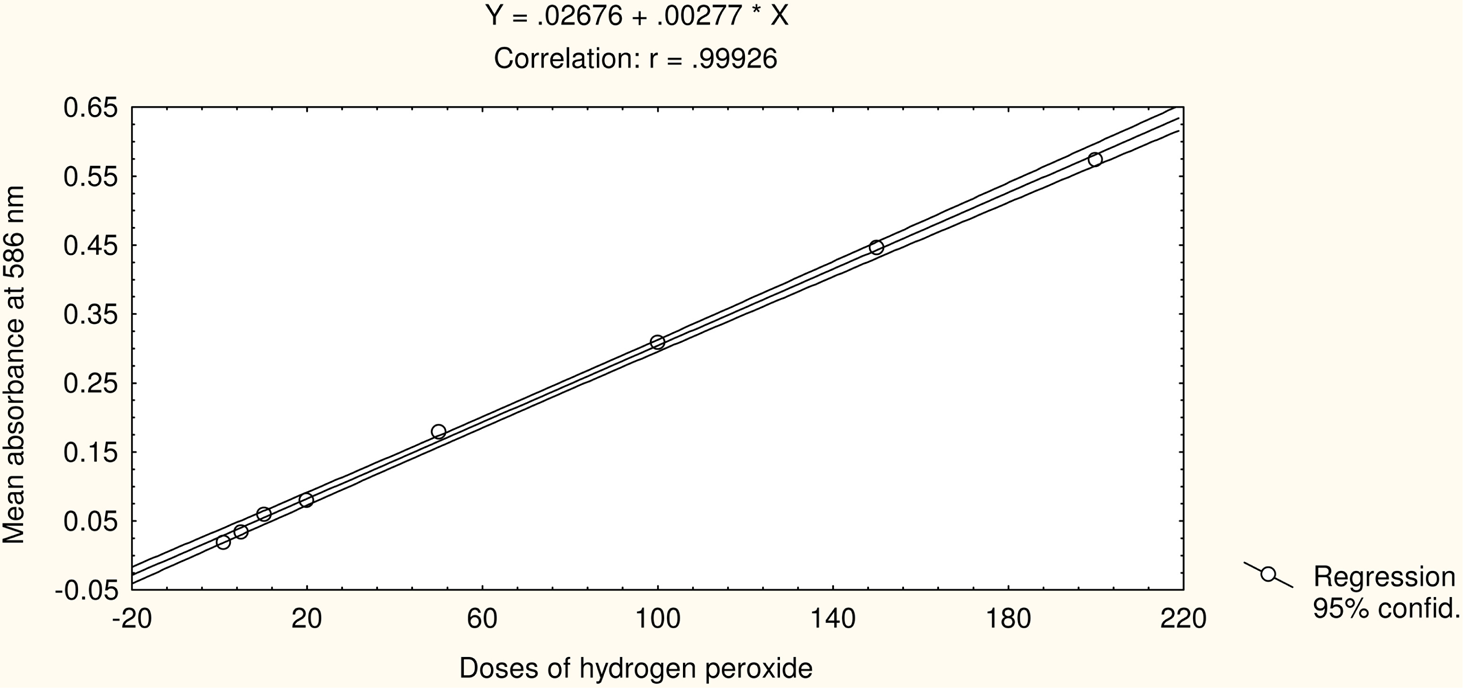
Figure 2 shows the standard curve for MDA estimation. Figure 3 shows the mean absorbance value 24h after the treatments of 1, 5, 10, 20, 50, 100, 150 and 200 μM of H2O2 in cultured human lymphocytes. The significant values are denoted herewith (*) as compared to the untreated (Fig. 3). The treatments with 1, 5, 10, 20, 50, 100, 150 and 200 μM of H2O2 correspond with the mean absorbance values of 0.0198 ± 0.005, 0.0346 ± 0.008, 0.0588 ± 0.010, 0.0798 ± 0.012, 0.1792 ± 0.015, 0.3094 ± 0.032, 0.4462 ± 0.039 and 0.5734 ± 0.048, respectively. The untreated and negative controls correspond with the mean absorbance values of 0.0011 ± 0.0001 and 0.0013 ± 0.0002 respectively. Similarly, the treatments of 1, 5, 10, 20, 50, 100, 150 and 200 μM of H2O2 in cultured lymphocytes after 48 hr correspond with the mean absorbance values of 0.0123 ± 0.001, 0.0163 ± 0.003, 0.0300 ± 0.006, 0.0464 ± 0.009, 0.0976 ± 0.013, 0.1636 ± 0.017, 0.2338 ± 0.028 and 0.3123 ± 0.030, respectively (Fig 4). The untreated and negative controls correspond with the mean absorbance values of 0.0010 ± 0.0001 and 0.0011 ± 0.0001, respectively. Regression analysis was used to study the dose-time relationship of the effects of H2O2 following 24 and 48 h of treatments based on the mean absorbance values in cultured human peripheral blood lymphocytes. An increase in the slope of linear regression lines (P< 0.005; r = 0.99) was observed due to the increase in the doses of the H2O2 (Fig 5 and 6).

Standard graph for the estimation of lipid peroxidation in cultured human peripheral blood lymphocytes.

Lipid peroxidation after 24 h treatment of the H2O2 on cultured human lymphocytes (*p<0.05).
Lipid peroxidation after 48h treatment of the H2O2 on cultured human lymphocytes (*p<0.05).

Effect of hydrogen peroxide treatment on the mean absorbance at 586 nm in cultured human peripheral blood lymphocytes after 24 h.
DISCUSSION
The results of the present study reveal a clear dose dependent increase in the production of MDA upon treatment with hydrogen peroxide. Ion radicals generated during oxidative stress leads to a chain reaction called lipid peroxidation. Aldehydes generated from lipid peroxidation forms the DNA adducts and lipid hydroperoxides (LOOH) that result in extensive single and double strand breaks in DNA (Devipriya et al., 2008). Other compounds, such as Arochlor 1254, menadione, cabon tetrachloride, cadmium, copper, paraquat and certain nitroaromatic compounds can also increase lipid peroxidation (Digiulio et al., 1989; Halliwell and Gutteridge, 1984). Among aldehydes, malondialdehyde is used as the marker of oxidative stress (Alessio, 2000). The common method used to assess the changes in MDA production is thiobarbituric acid (TBARS) assay. This method is useful in defined membrane systems, such as microsome in vitro (Halliwell and Chirico, 1993), but the method has been criticized for its use in human studies of oxidative stress owing to its low specificity. This assay also shows reaction with saturated and unsaturated non-functional aldehydes, carbohydrates and prostaglandins (Alessio, 2000). Hydrogen peroxide (H2O2) is the most effective species for cellular injury (Rao et al., 1996). Reactive oxygen species i.e. H2O2 generated during oxidative stress is known to cause damage to proteins, nucleic acids, and cell membranes and has also been associated with cancer, aging and several chronic neurodegenerative diseases (Kellogg and Fridovich, 1975; Daroui et al., 2004). H2O2 gives a Fenton reaction in the presence of Fe2+. Similar reaction is involved in the presence of other transition elements such as Cu, Co and Ni.
Effect of hydrogen peroxide treatment on the mean absorbance at 586 nm in cultured human peripheral blood lymphocytes after 48 h.

The product can also react with O2 to initiate Haber-Weiss reaction producing *OH in the presence of Fe+2.

It has been observed that certain estrogen metabolites are involved in carcinogenesis wherein H2O2 plays an important role. H2O2 has been associated with the induction of cancer and hence has been reported as mutagenic (Shamberger, 1972; Pryor, 1986). The compound H2O2 is reported to induce DNA damage (Thibodeau and Paquette, 1999), chromosomal aberration (Sofni and Ishidate, 1984) and sister chromatid exchanges (MacRae and Stich, 1979). In the present study, we have estimated the lipid peroxidation in terms of quantifying malondialdehyde (MDA) level. The lipid peroxidation products of PUFAs are considered to be important for genotoxic effects (Pryor and Porter, 1990; Comporti 1989; Esterbauer et al., 1990; Eder et al., 2008). Various reactive oxygen species can induce lipid peroxidation, whereas peroxidative fatty-acid fragments and their radicals can lead to the formation of reactive oxygen species (Eder et al., 2008). Thus Malondialdehyde (MDA) and 4-hydroxy-2-noneal (HNE) are the two most prominent lipid peroxidative products (Esterbauer et al., 1990. Esterbauer et al., 1982; 1991). The present method, that we have established as a lipid peroxidation assay, gives negligible reaction with 4-hydroxynonenal. In the presence of hydrochloric acid, Malondialdehyde reacts with two molecules of 1-methyl-2-phenylindole to yield a stable chromophore having intense maximal absorbance at 586 nm (Gerard-Monnier et al., 1998). This assay performed in hydrochloric acid based medium enables one to have specific measurement of MDA in the presence of 4-hydroxyalkenals, as in the presence of hydrochloric acid, 4-hydroxyalkenals undergo an irreversible cyclizatioin reaction (Gerard Monnier et al., 1998). In the present study, a clear dose dependent and significant increase in the concentration of MDA was obtained following H2O2 treatment after 24h, though after 48h of treatment, the mean absorbance values were decreased. This may be due to the reduced short half life of H2O2 or due to the internal protection mechanism of the cell. Hence, it is concluded that H2O2 is potent enough to induce lipid peroxidation in cultured human lymphocytes and the above method, therefore, is recommended for the estimation of lipid peroxidation in blood cells in culture.
Footnotes
ACKNOWLEDGEMENTS
Thanks are due to DST, New Delhi for the project No SR/LS-003/2007 under Fast Track Scheme to the author (YHS) and to the Chairman, Department of Zoology, AMU Aligarh for laboratory facilities. The organizers of the Indo-UK Workshop “Application of Biomarkers to Protect Human and Environmental Health”, under Indo-UK Science Network (DST-Royal Society, Cytogenetics Laboratory, Department of Zoology, CAS, BHU, Varanasi, September 1–5, 2004, are also acknowledged.