
Abstract
Since the publication of the BEIR VI (1999) report on health risks from radon, a significant amount of new data has been published showing various mechanisms that may affect the ultimate assessment of radon as a carcinogen, in particular the potentially deleterious Bystander Effect (BE) and the potentially beneficial Adaptive Response radio-protection (AR). The case-control radon lung cancer risk data of the pooled 13 European countries radon study (Darby et al 2005, 2006) and the 8 North American pooled study (Krewski et al 2005, 2006) have been evaluated. The large variation in the odds ratios of lung cancer from radon risk is reconciled, based on the large variation in geological and ecological conditions and variation in the degree of adaptive response radio-protection against the bystander effect induced lung damage. The analysis clearly shows Bystander Effect radon lung cancer induction and Adaptive Response reduction in lung cancer in some geographical regions. It is estimated that for radon levels up to about 400 Bq m−3 there is about a 30% probability that no human lung cancer risk from radon will be experienced and a 20% probability that the risk is below the zero-radon, endogenic spontaneous or perhaps even genetically inheritable lung cancer risk rate. The BEIR VI (1999) and EPA (2003) estimates of human lung cancer deaths from radon are most likely significantly excessive. The assumption of linearity of risk, by the Linear No-Threshold Model, with increasing radon exposure is invalid.
1. INTRODUCTION
1.1 Microdose Analysis of Case-Control Studies
Radon lung cancer studies have been performed using the case-control method of data collection and analysis. BEIR VI (1999) provides lung cancer risk data from some of the early case-control studies in their Figure 3–2. These studies involve the matching of each human lung cancer case with one or more non-cancer cohorts with similar demographic characteristics. In these studies, both cases and controls are matched with exposures to similar levels of low Radon concentrations. Such studies have been performed in Europe (13 studies) and North America (8 studies) with these data recently being pooled by several analysis groups to provide more statistical power (Darby et al 2005, 2006, Krewski et al 2005, 2006). The pooling of data from these studies is based on the assumption that between-site differences seen in the observed relationship between lung cancer risk and radon exposure are due to random measurement variability and the true relationship is independent of site locality and only dependent on the carcinogenic sensitivity of human lung tissue to alpha radiation, which both Darby et al (2005, 2006) assumed to be Linear No-Threshold (LNT) compatible with BEIR VI (1999). BEIR VI (1999) summarized their justification of LNT for human lung cancer risk as follows: “The choice was to use a linear relationship between risk and low doses of radon progeny without a threshold. The choice was based primarily on considerations related to the stochastic nature of the energy deposition by alpha particles; at low doses, a decrease in dose simply results in a decrease in the number of cells subjected to the same insult. That observation, combined with the evidence that a single alpha particle can cause substantial permanent damage to a cell and that most cancers are of monoclonal origin, provides the mechanistic basis of the use of a linear model at low doses. In addition, as discussed in the report, exposure-response relationships estimated from the observational data in miners with low exposures, and from the case-control studies of indoor radon, are consistent with linearity.”
Of considerable significance is the very recent case-control lung cancer epidemiological study of Thompson et al (2008), for Worcester County, Massachusetts (making now a total of 9 North America studies), showing a significant reduction of lung cancer incidence with increasing residential Radon concentrations. Since the BEIR VI (1999) was issued, a large amount of new research data has been published about low level radiation dose response, primarily sponsored by the United States Department of Energy Low Radiation Dose Research Program. We here report Part III of a three part study of the combined influence from the deleterious behavior of the Bystander Effect (BE) and from the radio-protective behavior of Adaptive Response (AR), on the human health risks from radon. In the separate Part I of this study (Leonard et al 2010a), we have shown that cellular dose response from radon progeny and other similar high LET alpha particles, in the absence of any low LET radiation inducing AR, can be typified by a representative alpha particle dose response shape and accurately characterized by a modified microdose BaD Bystander Model (with some minor modifications given in Part I) first proposed by Brenner et al (2001). It is shown, for radon concentrations at human domestic and workplace levels, as provided by the BEIR VI (1999) report, that the carcinogen causing cellular chromosome damage in the human lung must be from Bystander Damage to neighboring cells adjacent to directly hit cells. This is based on the latest evaluation of the human lung cells alpha particle “hit” (traversal) rate per Bq m−3 of radon exposure provided by James et al (2004). The Bystander Damage dose response, from broad-beam and micro-beam in vitro data, is shown to be non-monotonic concave downward in shape for human domestic level, low radon exposures. Only at the higher radon levels received by the underground miners would the dose response be from cellular/alpha particle Direct Damage and linear or linear-quadratic as provided by many other published alpha dose response data. This representative dose response shape is provided in Part I as Figure 10 (Leonard et al 2010a) and the explicit shapes in the low radon residential bystander region is given in Figure 16B. It is concluded that the dose response for lung cancer risks from radon should not be expected to be Linear No-Threshold, contrary to Figure 3-2 of BEIR VI (1999) (see the bottom panel of Figure 1, Part I), and contrary to the pooled linear fits to the European and North American case-control data analysis shown in Figure 2 of Part I (Leonard et al 2010a) and provided herein as Figure 1. The basic evidence presented in Part I, from in vitro data, is that the Bystander Effect from radon and progeny alpha particles is dominant in inducing lung cancer in humans from radon at residential levels.
Conversely in the separate Part II (Leonard et al 2010b), we examined the potential influence of combined deleterious Bystander Effects and Adaptive Response radio-protection by assuming, based also on a very large amount of in vitro BE and AR data, that AR is operable for low LET ionizing radiations that humans routinely receive from natural background and man-made radiations. Significant to the Part II study of potential Adaptive Response effects on the human lung cancer risks from radon is the fact that single low LET radiation induced charged particle tracks through sensitive regions of cells induces an AR protection of 40 to 70 % against chromosome damage. This has been evidenced after the Poisson threshold transition region of AR dose response data such as that of Azzam et al (1996) and Redpath et al (2001, 2003) [see Figures 2A and 2B of Leonard (2007a)]. Further, Sawant et al (2001) and Zhou et al (2003) have shown that low LET X-ray priming doses can reduce the transformation frequency rate and level of chromosome aberrations from alpha particle exposures (see Figures 3A and 3B of Part II). The adaptive response protection is found to be independent of the type of radiations, from 28 keV mammogram X-rays to 232 Mev cosmic ray protons, and independent of cell species for five different cell species although the level of protection and the dose range of the protection does vary somewhat dependent on the specific energy deposition of the single low LET charged particle traversals [see Figure 9 of Leonard (2008b]. In examining whether Adaptive Response may induce radio-protection against the alpha particle induced human lung damage, we used the United Nations Scientific Committee on the Effects of Atomic Radiations (UNSCEAR 2000) estimated human exposures to ionizing radiations as the AR inducing radiation sources. It was found, at the world-wide mean radiation levels, that about 30% of the human lung cells should experience AR radio-protection and at the high UNSCEAR (2000) levels 100% of human lung cells should receive AR protection. From Parts I (Leonard et al 2010a) and II (Leonard et al 2010b), we show that the human lung cancer risk dose response should be non-linear from alpha particle cell damage and further, different ecological and geographical environments world-wide should impose a large range Adaptive Response radio-protection and a wide range of observed odds ratios of lung cancer risk as is indeed observed in the European (13 studies) and North American (8 studies) case-control studies as seen in Figure 1. This is supportive of the non-linear premises of Morgan (2006). Based on these premises, in this Part III, we examine the odds ratio data for these 21 pooled studies, the very recent Massachusetts study of Thompson et al (2008) and the China study of Blot et al (1990) for non-linear lung cancer risks as expected from the results of Parts I and II.

Linear fits of individual studies in two pooled case-control radon studies. Panel A - Radon relative risks for 13 pooled European case-control studies. From Darby et al (2005, 2006) with permission. Panel B – Radon relative risks for 8 pooled North American case-control studies. From Krewski et al (2005, 2006) with permission.
2. MATERIALS AND METHODS
2.1 Method - Recent Case-Control Studies May Provide Insight Into the Variation of Bystander Damage and Adaptive Response Radio-Protection From Human Lung Cancer
We provide as Figure 1 the reproduction of the graphs of data and their linearized fits for the Darby et al (2005, 2006) pooled 13 European case-control and the Krewski et al (2005, 2006) pooled 8 North American case-control studies. It was most likely a large disappointment for the participants in the pooled studies to find such a very large variation in the Odds Ratio Relative Lung Cancer Risks as a function of increasing radon concentration for the different geographical localities. In the Results Section herein, we analyze these 21 data sets plus the Shengyang, China (Blot et al 1990) study and the very recent Massachusetts (MA) (Thompson et al 2008) study. We first examine the validity of the assumption of linearity that was assumed to produce Figure 1, where a very wide range in linearized slopes is observed for both the Krewski etal (2005, 2006) and Darby et al (2005, 2006) pooled data with some showing negative lung cancer risks with increasing radon levels. Due to this wide range, we then divided the data into two groups, i.e. positive sloped (high risk group) and negative sloped (low risk group) sets, and performed single linear fits. Because our Part I and II analysis concludes that radon lung cancer risks should not be expected to be Linear No-Threshold, we next considered, without imposing explicitly any adaptive response criteria, that there may be more than the Linear No-Threshold mechanisms affecting the dose responses. The well known Papworth Poisson Validation Test (Papworth 1975, Savage and Papworth 2000) was applied and revealed that a single linear mechanism premise to be invalid, showing over-dispersion of the data for a hypothesis of a single linear cancer risk mechanism. To examine a hypothesis, premised from the Part I and II results, that BE and AR influence should produce non-linear human lung cancer risk behavior, both the Darby et al (2005, 2006) plus China (Blot et al 1990) and the Krewski et al (2005, 2006) plus MA (Thpmpson et al 2008) data low risk group and the high risk group sets were each trial fit to 3rd, 4th and 5th degree polynomials. With the suspect that they may reflect minimal radon induced lung cancer response, the three lowest risk data sets of the Krewski et al (2005, 2006) plus Massachusetts (MA) data sets, i.e. the Massachusetts (MA). New Jersey (NJ) and Missouri (MO-IIa) data in Table 1, were then individually fit to the basic Microdose Model for adaptive response protection (Leonard 2007a), given as Equation (3) of Part II, i.e. neglecting any bystander lung damage, with excellent success. These three lung cancer risk sets thus show a net AR protection against lung cancer with increasing radon levels which significantly reflects also a reduction in naturally occurring, spontaneous lung cancers from non-radon causes by being below the zero radon cancer incident rates.
Adjusted Odds Ratios (SE) and Corresponding 95% Confidence Interval as a Function of Radon Exposure Categories for the Eight North American Sites Study (Krewski et al 2005, 2006) and the Thompson et al (2008) MA Study. Values in Brackets are 95%CLs.
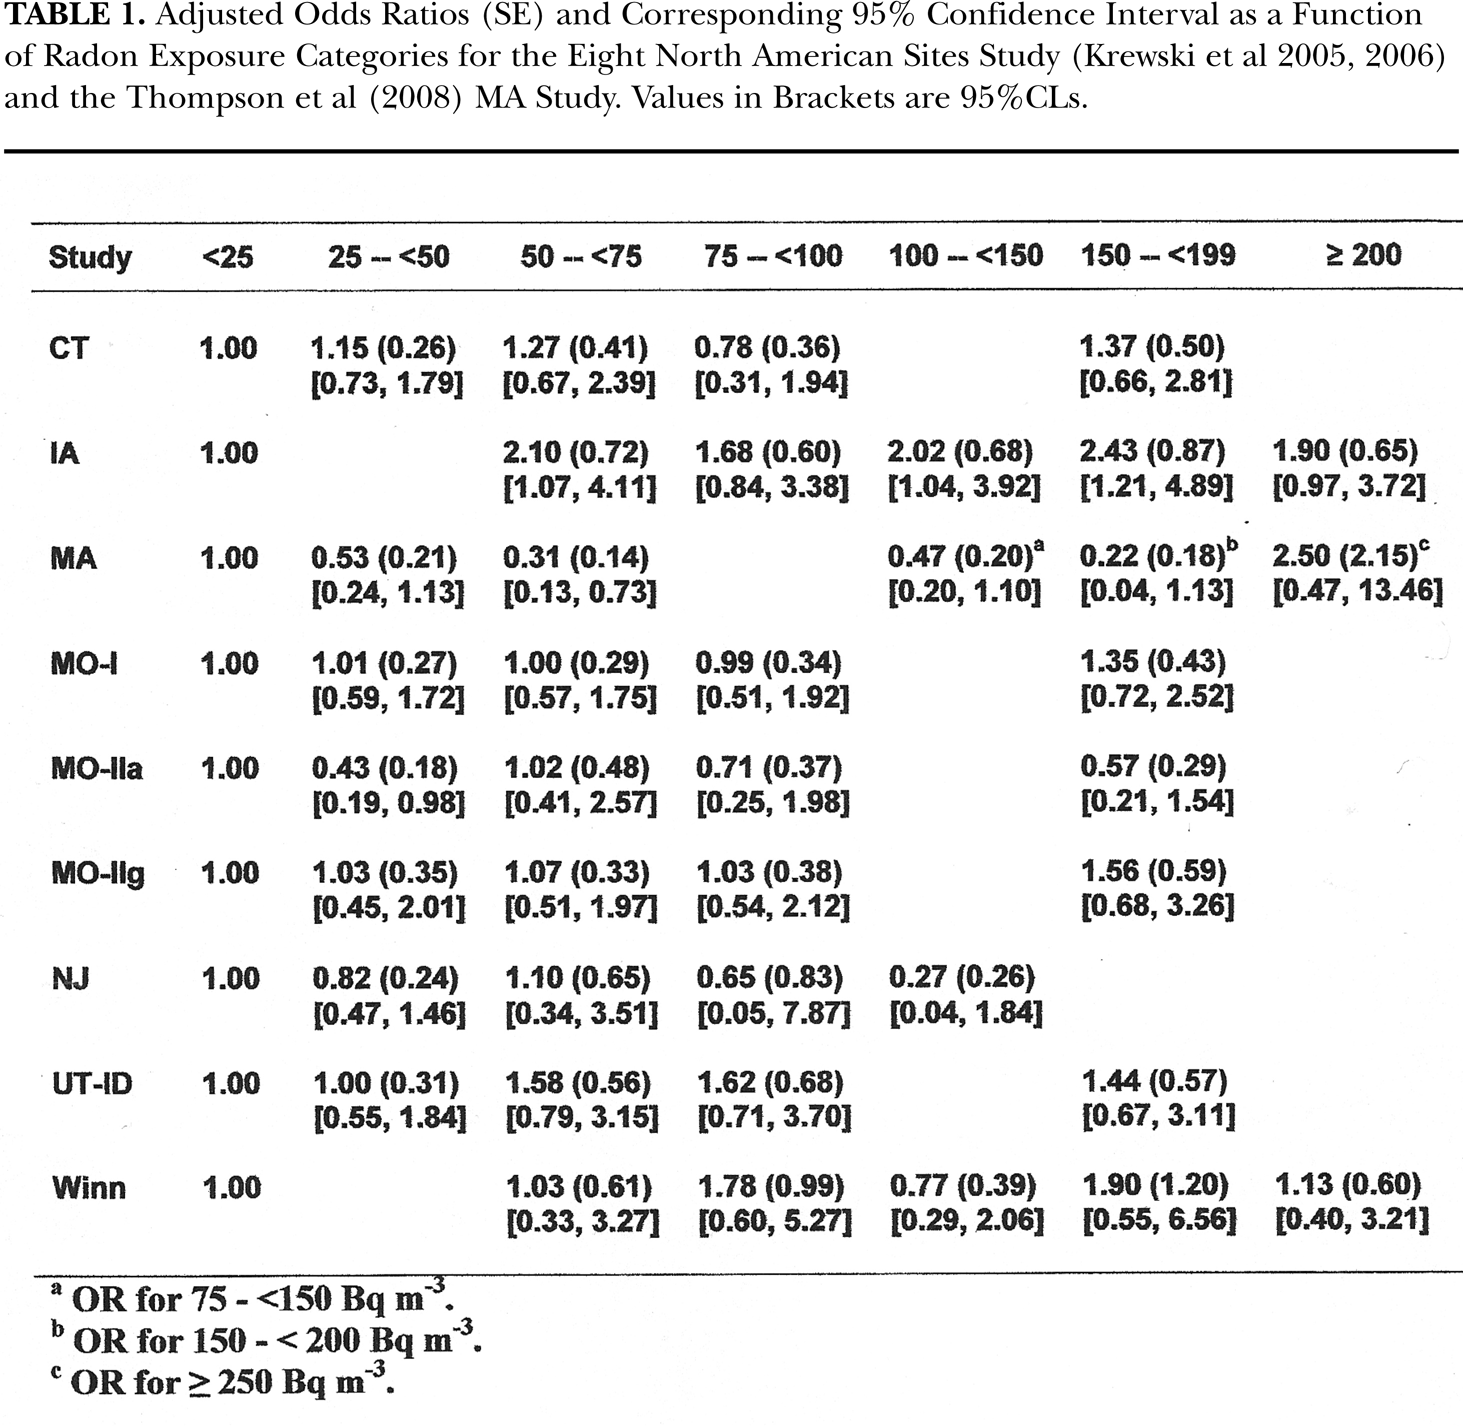
OR for 75 - <150 Bq m−3.
OR for 150 - <200 Bq m−3.
OR for >250 Bq m−3.
In the Analysis and Discussion Sections, we discuss the validity of in vitro data to predict in vivo human dose response and provide recent in vivo data of live mammalian examples of adaptive response protection.
3. RESULTS
3.1 Linear Analysis of Krewski et al (2005, 2006) and Darby et al (2005, 2006) Case-Control Data
Table 1 provides the numerical values for the odds ratios of lung cancer risks for the radon concentrations reported by Krewski et al (2005, 2006) and MA (Thompson et al 2008) studies. At the request of the Darby et al (2005, 2006) group, we only provide their graphical presentation in Figure 1A but used their numerical data in our analysis herein. What is very apparent, from the Figure 1A from Darby et al (2005, 2006) and Figure 1B from Krewski et al (2005, 2006), is that there is a very large variation in the linearized odds ratios slopes in lung cancer risks from the respective 13 different European and 9 different geographical locations in North America. In particular, the behavior of the 2 data sets, from New Jersey – NJ (Schoenberg et al 1990, 1992) and Missouri – MO-IIa (Alavanja et al 1994, 1999), show very clearly a strongly non-conforming negative behavior. The odds ratios in the Thompson et al (2008) MA data shown in their Figure 2 compliments the NJ and MO-IIa negative risk results for radon exposure values below about 200 Bq m−3. The extreme differences suggests that more than one dose response mechanism may be present in the induction, and other cases of lack of induction, of radon induced lung cancer in humans, contrary to BEIR VI (1999) and Krewski et al (2005, 2006) and Darby (2005, 2006) premises.
First it is appropriate to more carefully assess the likelihood that the 9 North America lung cancer risk data in Table 1 represent a linear cancer induction mechanism as premised by the Linear No-Threshold hypothesis and shown in Figure 3-2 of BEIR VI (1999) and the bottom panel of Figure 1, Part I. The BEIR VI (1999) lung cancer Relative Risk is given by Equation (1), Section 3 of BEIR VI (1999) i.e.

where w is the radon exposure and β estimates the increment in excess relative risk (ERR) for unit change in exposure. For their Figure 3-2, a value of about β = 0.0019 per Bq m−3 is used. Table 1 provides the odds ratio, standard error and 95%CL data values reported from Krewski et al (2005, 2006) and the values from Thompson et al (2008). As Figure 2A, we show our linearized best fit, obtained using the Method of Maximum Likelihood Estimation (Savage and Papworth 2000), for each of the 8 Krewski et al (2005, 2006) North American case-control studies and the new MA data of Thompson et al (2008) i.e. the data in Table 1. We see an extreme variation in the linear slopes for the individual sets when premised by the Linear No-Threshold (LNT) hypothesis. We obtained a range of values of β's from −0.0043 per Bq m−3 for NJ to +0.0049 per Bq m−3 for Iowa (IA). It does not seem plausible, if the data indeed reflects the lung cancer incidence rate from radon, that there would be negative risk with increasing radon concentration, if indeed world-wide the true lung cancer risk is given by a single value of β. We have next separated the Krewski et al (2005, 2006) data sets into two groups, one group including all the positive sloped, high risk data sets i.e. CT, IA, M)-I, MO-IIg, UT-ID and Winn. The second low risk group includes the three negative responding sets i.e. the MA, MO-IIa and the NJ sets. We have pooled each group and provide the high risk group linear fit as Figure 2B and the linear fit for the low risk group as Figure 2C.

Linear best fit of Krewski (Krewski et al 2005, 2006) plus MA (Thompson et al 2008) and Darby (Darby et al 2005, 2006) plus China (Blot et al 1990) data. Panel A - Use of the Method of Maximum Likelihood (MLE) to obtain a linear best fit to each of the eight North American lung cancer case-control studies pooled by Krewski et al (2005, 2006) and the Thompson et al (2008) case-control study for Worcester County, Massachusetts. Panel B – Use of MML to fit the high risk pooled group, i.e. CT, IA, UT-ID, MO-I, MO-IIg and Winn, to linear best fit. Panel C – Use of MML to fit the low risk North American pooled group (Krewski et al 2005, 2006) i.e. NJ, MA and MO-IIa to linear best fit. Panel D – The MML linear best fit of each data set of the Darby et al (2005, 2006) and China (Blot et al 1990) 14 data sets. Panel E - Use of MML to fit the Darby (Darby et al 2005, 2006) high risk pooled group, to a linear best fit. Panel F - Use of MML to fit the low risk Darby (Darby et al 2005, 2006) and China (Blot et all 1990) pooled group i.e. United Kingdom, Spain, Western Germany and China to linear best fit.
The Darby et al (2005, 2006) pooled data have also been examined in the same way. As Figure 2D, we provide the linearized fit to each of the 13 European data sets and the China data set. Again we find a very large range for the Excess Relative Risk slopes. We again divided the Darby et al (2005, 2006) data into a positive sloped, high risk group (Austria, France, Czech Republic, Eastern Germany, Sweden Nationwide, Sweden never-smokers, Sweden Stockholm, Southern Finland and Italy). The low risk group, containing the negative responding and negligible risk results of Spain, United Kingdom, Western Germany, Finland Nationwide and China. As Figures 2E and 2F, we show the pooled linear fits to these two groups.
3.2 Statistical Considerations Relative to the Excessive Odds Ratios – A Poisson Fit Test
We have cited in the Introduction section the BEIR VI (1999) summary statement premising linearity of lung cancer risks from radon. Both the Krewski et al (2005, 2006) and the Darby et al (2005, 2006) studies are premised that “The pooling of data from these studies is based on the assumption that between-site differences seen in the observed relationship between lung cancer risk and radon exposure are due to random measurement variability and the true relationship is independent of site locality and only dependent on the carcinogenic sensitivity of human lung tissue to alpha radiation.” These two pooled studies encompass a very large amount of case-control data. The following are the case and control data values for the noted case/control studies; Krewski et al (2005, 2006) 4081 and 5281 persons, Darby et al (2005, 2006) 7148 and 14208 persons, Thompson et al (2008) 209 and 397 persons, Shenyang, China (Blot et al 1990) 308 and 356 persons comprising a total of 11746 cases and 20242 controls. Analysis of the net population and of the two separate groups i.e. North America including MA data and the European plus China data for linearity should provide a reasonable estimate of the “true” linear slope constant, β, in Equation (1) for human lung cancer risk versus radon exposure concentration. Thus for each radon concentration data point, the deviation from the linearized risk curve should be from “radom measurement variability” (thus Poisson distribution) and, due to the large populations in the studies, the linearized risk curve should represent the “true relationship (which) is independent of site locality”. Thus, a “universal” lung cancer risk. if it exists? The fits clearly show a very large variation in the lung cancer incidence rates from the various geographical locations in North America, Europe and China. Our evaluation, from odds ratio studies shown in Figure 2, is that a statistically significant difference in the slopes between the sites with a positive Excess Odds Ratios (EOR) and the sites with negative EOR provides evidence to reject, as a null hypothesis, the premise that the EOR's obtained from all the sites estimate one underlying single linear association between lung cancer risk and radon concentrations. We statistically evaluate the hypothesis.
Papworth (1975) was one of the first to observe that, if experimental data represented a physical process containing a mean value, then the distribution of data about the mean value should be Poisson distributed about this mean value if the data variations are related to only random variations in data collection and assessment i.e. in the case here, radon data taking processes in obtaining the case-control values. A Poisson Validation Test is standard procedure in evaluating the validity of chromosome assay data in radiation biology. The Cytogenetic Analysis for radiation dose assessment applies the Poisson Validation Test in the data analysis related to human overexposures in accident situations (IAEA 2001). For each dose data point on the dose response calibration, thousands of cells are scored for chromosome aberration frequency at each calibration dose data point. The distribution of these scored values about the mean value are tested for Poisson conformity. If the variance to mean ratio is large the data are considered to be over-dispersed. Figure 3A illustrates the distribution behavior about the data points on a cytogenetic dose response calibration curve, reproduced from Figure 3 of Szluinska et al (2005). For the Excessive Odds Ratio Lung Cancer Risk data, if the cancer risk rate is indeed linear and independent of any other mechanisms other than Linear No-Threshold dose response for radon human lung cancer risks, then the best fit slope predicted by each radon concentration dose point on the dose response curve should be an assessment of the true linear curve. So for each case-control data point in each data set i.e. Spain, United Kingdom, France, etc. an experimental estimated value for the true slope is provided by the relation


Statistical evaluation of the case-control data sets for validity of the data. Panel A – Schematic illustration of the data distribution about individual data points in a chromosome aberration dose response curve, where each data point is a result of scoring a large number of cells, exposed to the same dose, for aberrations to obtain a statistical Mean Value for that dose point. The aberration distribution from the scoring is tested [Papworth (1975) Poisson Validation Test] for validity by fitting to a Poisson Distribution about the Mean Value. Panel B – The frequency distribution of the slopes of the Krewski et al (2005, 2006) plus MA (Thompson et al 2008) data and fit to a Normal Distribution, showing the very large variation about the Mean Value of 0.00085 per Bq m−3. Panel C – The frequency distribution of the slopes of the Darby et al (2005, 2006) plus China (Blot et al 1990) data and fit to a Normal Distribution with a Mean Value of 0.00063 per Bq m−3. Panel D – The frequency distributions of the slopes of all the individual data from all the 23 case-control studies encompassing 109 data points of Odds Ratio Lung Cancer Relative Risks. The Mean Value is 0.00079 per Bq m−3.
Then pooling the case-control data sets should provide a number of independent Slope Estimates. If Lung Cancer Risk is indeed independent of geographical location, as must have been premised by the participants in the two pooled studies, then the experimental βexp values must form a Poisson distribution about the true linear slope value for human lung cancer risk from radon. We have used the computer “U-Test for Poisson” program of the Poisson Test system “CTAMPOISS” from the United Kingdom Health Protection Agency (HPA 2008). We show the results in Figures 3B and 3C. We have graphically examined the frequency distribution of the Slope Estimate data points given by Equation (2). Figure 3B provides the distribution of the Equation (2) slope values for all the Krewski (2005, 2006) plus the Thompson et al (2008) MA data. The mean value of the slopes is 0.00085 per Bq m−3 of radon with a very large standard error (SE) of 0.00616. This is a lower slope than the 0.0011 per Bq m−3 value obtained by Krewski et al (2005, 2006) but we have included the Thompson et al (2008) MA negatively responding data. Similarly, shown in Figure 3C, we performed the same analysis for the Darby et al (2005, 2006) plus China (Blot et al 1990) data, again obtaining a lower slope value equal to 0.00063 per Bq m−3 slope value due to the China data, with a large SE of 0.00629, compared to 0.0011 for the Darby et al (2005, 2006) data. The CTAMPOISS Poisson Validation Test concludes that both the Krewski et al (2005, 2006) and Darby et al (2005, 2006) slope data set distributions are over-dispersed and were, on a technical basis, statistically rejected as being from a single mechanism and “contaminated” from outlier influence. We performed a similar test of the entire pooled data of Krewski et al (2005, 2006), Darby et al (2005, 2006), MA (Thompson et al 2008) and China (Blot et al 1990). This is presented as Figure 3D showing a Mean Value of 0.00079 per Bq m-3 with a large SE of 0.00617. The spread of the Normal distribution is due to the large negative and positive slope values about the overall mean as shown by the data. In all the slope analysis the standard errors were 7 to 10 times larger than the Mean Slopes, supporting the overall purely statistical conclusion, provided by the Papworth (1975) Poisson Tests, that 1.) a simple linear fit to all the pooled data sets is inadequate and the a priori assumption of LNT can not yield a reasonable, single linear dose response between lung cancer risk and radon exposure at domestic and workplace levels 2.) there are other mechanisms affecting the Human Lung Cancer Risks as determined by the case-control studies. We also used a second, more recent, Poisson Validation program, NETA also based on Edwards et al (1979), available through the Inter-net and obtained the same results and conclusions.
3.3 The Fit of the Krewski et al (2005, 2006) and the Darby et al (2005, 2006) Case-Control Lung Cancer Studies Data to Polynomials
Allowing for non-linearity, without a presumption that it be from adaptive response radio-protection, we have then used MML to trial fits of all the data sets to 3rd, 4th and 5th degree polynomials, a + bX + cX2 + dX3 + eX4 + fX5, which thus allows for considerable non-linearity if the data so dictates. We have fit the Darby et al (2005, 2006) data plus China (Blot et al 1990) data to these polynomials. The best fits to the data sets are shown in Figure 4 with the 95% confidence limits. For the high risk data set, a 5th degree polynomial gave the best results with the polynomial coefficients: a = 0.93, b = 4.84 E-04, c = 4.87 E-05, d= −2.74 E-07, e= 5.03 E-10, and f = −2.97E-13, with an adjusted R2 = 0.420. These are shown as Figure 4A, for the high risk group. In Figure 4B, for the low risk group, we found a 5th degree polynomial provided the best fit with a = 0.836, b = 1.07 E-03, c = 4.85 E-05. e = 9.23 E-10 and f= −6.56 E-13, with an adjusted R2 = 0.254. For the overall Darby et al (2005, 2006) data, we find a = 0.94, b = −9.28 E-04, c = 6.59 E-05, d = −3.67 E-07, e = 6.72 E-10, and f = −3.94 E-13 with an adjusted R2 = 0.392. We see a significant resemblance to the alpha particle dose response data presented and analyzed in Appendix A of Part I and low radon concentration region of the representative alpha particle dose response shape in Figure 10 of Part I. We analyze this in more detail in Section 4.1.
For both the high and low risk group Krewski et al (2005, 2006) plus MA (Thompson et al 2008) polynomial fits, we found that a 2nd degree polynomial provided the best fit because their data only goes to about 300 Bq m−3.(i.e. >200) in Table 1. As Figure 4C, we show the pooled CT, UT-ID, MO-I, MO-IIg, Winn and IA positive sloped high risk data sets, with the polynomial coefficients a = 0.987, b = 4.14 E-03, c = 9.51 E-05, d = −2.15 E-07, e = 1.22 E-09, and f = −2.02 E-12, with an adjusted R2 = 0.223. As Figure 4D, we show the 2nd degree MML fit for the low risk pooled MA, NJ and MO-IIa negative responding sets. The coefficients are a = 0.94, b = −4.69 E-02, c = 8.07 E-06, with an adjusted R2 = 0.326. Again we see a best fit curve in Figure 4C that resembles the representative alpha particle dose response shape in Figure 10 of Part I. For both the Darby et al (2005, 2006) plus China (Blot et al 1990) and Krewski et al (2005, 2006) plus MA (Thompson et al 2008), we see the non-linear downward concave behavior expected for Bystander Damage predicted by the microdose BaD Model [Equation (2) and Figure 3 of Part I].

Two pooled data sets, from Table 1 and Figure 1, fit to polynomials using the Method of Maximum Likelihood. Panel A – Fit of 5th degree polynomial to all of the Darby et al (2005, 2006) and China (Blot et al 1990) case-control data. Panel B – The positive, high risks case-control data sets (Darby et al 2005, 2006) (Austria, France, Czech Republic, Eastern Germany, Sweden nationwide, Sweden Stockholm, Sweden never-smokers, Southern Finland and Italy) fit to 4th degree polynomials. Panel C – The pooled data fit for the low risk Darby (Darby et al 2005, 2006) data sets (United Kingdom, Western Germany, Spain, Finland nationwide and also China (Blot et al 1990)) to 3rd degree polynomials. Panel D – The North American (Krewski et al 2005, 2006) positive, high risks case-control data sets (CT, MO-I, MO-IIg, IA, UT-ID and Winn) fit to 4th degree polynomials. Panel E – The pooled data fit for the low risk North American (Krews wkiet al 2005, 2006) data sets (MA, NJ and MO-IIa) to 3rd degree polynomials.
3.4 The Fit of the Case-Control Lung Cancer Studies Data for MA, NJ and MO-IIa to the Microdose Model
Using the original basic Microdose Model for adaptive response radio-protection (Leonard 2007a), it has been shown, with some examples given above in Figure 1 of Part II, for numerous Adaptive Response behaving dose response data sets (Leonard 2008b), that when AR is activated by a Poisson distributed single low LET induced charged particle tracks through each cell, the AR protection dominates the response with a dose response level below the zero dose level or below a Relative Risk of unity in the AR Microdose Model Equation (3) in Part II. It would be very significant if radon induced human lung cancer is indeed sensitive to Adaptive Response radio-protection mechanisms from the low LET natural background and man-made human radiation exposures. For this reason, in our study it was important to examine any possible direct correlation providing evidence of this. To date, no justifiable reason has been shown for the very large variation in the incidence of human lung cancer with residential radon levels based on the case-control studies as we have shown in Figures 2A through 2F. We, in Figures 5A through 5F, show the use of the original basic Adaptive Response Microdose Model [Equation (3) of Part II] to evaluate Adaptive Response radio-protection as a possible and probable cause of the non-linear, “U” shaped negative response seen in the MA, NJ and MO-IIa data. Shown in the fits are the linearized dose response as predicted by the BEIR VI (1999) Report (slope 0.19 per 100 Bq m−3) and the linearized response obtained by Krewski et al (2005) (slope 0.176 per 100 Bq m−3). We have used a linear coefficient of 0.00176 for the α in Equation (3) of Part II i.e. α = 0.00176 lung cancers per Bq m−3 of radon. Shown are two graphs for each of the MA, NJ and MO-IIa data for low radon exposure levels to 250 Bq m−3 and for a high radon range showing the transition to a linear response dictated by the value of α. Referring to Figure 2 of Part II and the three damage regions, Bystander Effect Region, Adaptive Response Region and Direct Damage Region that were so useful in evaluation of AR protection for mammogram and diagnostic X-rays (Leonard and Leonard 2008), for lack of data, we simply estimated the Direct Damage threshold and transition to the high radon linear region. We also assumed that at high radon levels that the Adaptive Response protection is dissipated i.e. f(M) → 0 in Equation (3) of Part II as observed in earlier evaluated data. There are not enough data to distinguish between AR protection for the spontaneous, priming dose and radon cancer incidence. As discussed in detail in Leonard (2008b), this has been the case for other Microdose Model analysis. Also, the data is insufficient to detect any possible very low level Bystander Effects, either deleterious or protective [although the low part of the negative responses could be protective Bystander as observed in Leonard (2008a, 2008b)]. The resolved best fit parameters, to ± 31%SD, for MA in Figures 5A and 5B are: S related to a threshold of 34 Bq m−3, Pprot-pr∞ = 0.76 (76% AR protection) and α = 0.00176 per Bq m−3 [note that the Thompson et al (2008) ≥ 250 Bq m−3 data point provides a good fit to α]. For NJ in Figure 5C and 5D, the resolved best fit parameters, ± 11%SD, are: S is related to a threshold of 80 Bq m−3, Pprot-s∞ = 0.49 (49% AR protection) and assumed α = 0.00176 per Bq m−3. For MO-IIa in Figures 5E and 5F, the resolved parameters, to ± 10%SD, are: S related to a threshold of 82 Bq m−3, Pprot-s∞ = 0.78 (78% AR protection) and assumed α = 0.00176 per Bq m−3. We use the term “related to” for the values of S since in Part I we have found that a Normal Distribution is needed for the threshold. We have shown a possible correlation between low LET external terrestrial, internal Radon progeny beta and 40K and external cosmic radiations. What is apparent, from these case-control data analysis presented here, is that the data show that there must be more than just the Linear No-Threshold dose response mechanism affecting human lung cancer risks. This other mechanism must be the protective mechanism provided by the adaptive response effect as a result of the wide variation in geological and ecological conditions existing worldwide as shown by the large variations in natural background and man-made radiations predicted in Section 3.1 and Figures 8 through 12 of Part II.

Adaptive Response Micodose Model fit to MA (Panel A and Panel B), NJ (Panel C and Panel D) and MO-IIa (Panel E and Panel F) data (Krewski et al 2005, 2006). Shown are the Poisson Thresholds for activation of the adaptive response protection and the linear slopes from Krewski et al (2005, 2006) and the BEIR VI (1999) Lung Cancer Relative Risk.
4. ANALYSIS
4.1 Recent Case-Control Studies and Pooled Data – Variability of Human Lung Cancer Risks from Radon
We have used Figures 2A through 2F to show the very large range of results, fit to a linear model, for the European pooled data of Darby et al (2005, 2006) and Shengyang, China (Blot et al 1990) (Figure 2A – 2C) data and the North American pooled data of Krewski et al (2005, 2006) and Thompson et al (2008) (Figures 2D – 2F). Due to the very large variations in the linear fits to both pooled data sets, we have used the Papworth (1975) Poisson Validation Test to statistically analyze the data We refer to the Poisson Validation Test relative to Papworth because he was one of the first to propose the Method of Maximum Likelihood procedure for fitting experimental data and the Poisson Test to validate the data sets (Papworth 1975, Savage and Papworth 2000, Edwards et al 1979). The Papworth Poisson Validation Test indicated that both the pooled data of Krewski et al (2005, 2006) and Darby et al (2005, 2006) to be over-dispersed and assessed to be “contaminated” by other auxiliary influences, as shown in Figure 3. Allowing for non-linearity, without a presumption that it be from adaptive response radio-protection, we have then used MML to trial fit to all the data sets to 3rd, 4th and 5th degree polynomials, a + bX + cX2 + dX3 + eX4 + fX5, showing considerable non-linearity. These polynomial fits are shown in Figure 4 showing very significant resemblance to the non-linear representative alpha particle dose response shape of Figure 10 of Part I and in particular the Bystander Damage Region. As we noted above, in the pooling of data from these studies, the pool participants basically applied a crucial assumption that between-site differences seen in the observed relationship between lung cancer risk and radon exposure are due to random measurement variability and the true relationship is independent of site locality and only dependent on the carcinogenic sensitivity of human lung tissue to alpha radiation (which is assumed to be an invariant and Linear with No-Threshold). The polynomial fits to these case-control data conclusively shows that their assumption is invalid. The fit of the original basic AR Microdose Model, in Figure 5, to the negative responding data from the MA, NJ and MO-IIa studies indicates that there is negligible lung cancer risks and the presence of a dominating adaptive response radio-protection from any radon progeny inducing lung cancer and naturally occurring spontaneous (non-radon) lung cancers.

The polynomial Method of Maximum Likelihood fits to the high risk groups data for both thr Krewski et al (2005, 2006) plus MA (Thompson et al 2008) and the Darby et al (2005, 2006) plus China (Blot et al 1990) data. Panel A – The 5th degree polynomial fit to both the Darby/China (Darby et al 2005, 2006, Blot et al 1990) and the Krewski/MA (Krewski et al 2005, 2006, Thompson et al 2008) high risk group data. The circled area, labeled “1” is the low region where the low data shows minimal increase in risk. The area labeled “2” is most probably where the Threshold and Transition to the Direct Damage response occurs. The Darby (Darby et al 2005, 2006) high and low risk groups required 5th degree polynomial fits. The Krewski (Krewski et al 2005, 2006) plus MA (Thompson et al 2008) high risk group data fit to a 3rd degree polynomial. Only a 3rd degree fit was needed since the data extends only to within the Bystander Damage Region to 250 Bq m−3.
As Figure 6, we examine the polynomial fits to the high risk groups for the Darby et al (2005, 2006) and the Krewski et al (2005, 2006) data. The Figure 6A Darby et al (2005, 2006) high risk group polynomial fit shows very similar characteristics to the alpha particle dose response data analyzed in Part I, the representative alpha particle shape curves in Figure 10 of Part I and the composite BE and AR Microdose Model estimates in Figures 16 and 17 of Part II considering Adaptive Response protection from lung cancer from natural background and man-made radiations. We thus label the three response regions i.e. Bystander Damage Region, Threshold Region and Direct Damage Region as we have done in our other BE and AR studies (Leonard 2008a, 2008b, Leonard and Leonard 2008). Two areas are worthy of noting as 1 and 2 on the Figure 6A graph. Area 1 shows a flat region in the beginning caused by the lowest radon category, where most values are 1.00, designated as slightly above zero radon, but technically should be considered as a data point at zero radon level. Correlating with the representative Figure 8, Part I curve, the area 2 is most likely the single to double alpha traversal threshold and transition region into the Direct Damage Region (see Section 4.1.a of Part I). We have included in the graph the curve from Figure 16A, Part II (as “BE Microdose Model”), which is the estimated Relative Lung Cancer Risk at the UNSCEAR (2000) worldwide average human background, low LET exposure. Significantly, the Figure 16A, Part II curve was shifted slightly to provide a good correlation and gives an indication of the radon concentration level that the radon cancer Direct Damage begins in the dose response. Figure 6B provides the high risk group polynomial fit from the pooled North American (Krewski et al 2005, 2006) data. Their data points only extend to 250 Bq m−3, so they provide just the Bystander Damage Region cancer risk. Figure 6C shows, with both the Darby et al (2005, 2006) plus China (Blot et al 1990) and Krewski et al (2005, 2006) plus MA (Thompson et al 2008) high risks fits, that the two are in extremely good agreement.
The two low risk data groups polynomial fits are shown in Figures 4C and 4E. The low risk fit for the North American (Krewski et al 2005, 2006) data for MA, NJ and MO-IIa, in Figure 5, show a very large adaptive response protection and no resemblance of a Bystander Damage Region, Threshold Region or Direct Damage Region (although the Direct Damage would not be seen for the highest 250 Bq m−3 data points). This suggests a complete adaptive response protection that negates the alpha particle lung damage, but further provides beneficial protection from naturally occurring, spontaneous (non-radon) lung cancer risk from endogenic toxic chromosome damage or hereditary lung cancers (since they are lower than the zero radon concentration risks). The Darby et al (2005, 2006) low risk data fit shown in Figure 4C, which includes Western Germany, Spain, Finland nationwide and China, shows the same characteristics of a combined Bystander and AR protection as the Figure 4B for the high risk data but lower in lung cancer risk. To compare the two further, we show them together in Figure 7A where we see a distinct greater adaptive response protection for the low risk group (as would be expected). In Figure 7B, we show fits to the Figure 8, Part I representative shape curve but imposing an additional AR protection reduction seen by the blue solid curves. We show the high risk curve for the equivalent Darby et al (2005, 2006) and Krewski et al (2005, 2006) data (solid black) and the Darby et al (2005, 2006) low risk curve (solid red) together in Figure 7C, indicating various degrees of adaptive response protection as compared to the risk without any AR protection (top curve). Based on our calculations in Part II, we estimate that the high Darby et al (2005, 2006) and Krewski et al (2005, 2006) data show an adaptive response radio-protection of about 27%. For the low Darby et al (2005, 2006) data there is an AR protection of about 72% and for the low Krewski et al (2005, 2006) plus MA (Thompson et al 2008) data the protection is about 100%. In Panel D of Figure 7, we show for the Darby et al (2005, 2006) data why a 5th degree polynomial was required for the best fit. Five different slopes were encompassed in the fit to the Odds Ratio data.

Analysis of the MML polynomial fits. Panel A – Shown are the high and low risk group fits for the Darby/China (Darby et al 2005, 2006, Blot et al 1990) data. Both curves show the behavior depicted by the Representative Shape Microdose Model in Figure 10 of Part I. The lower cuvre is from reduction of cancer risk by adaptive response suppression. Panel B – We show the Representative Shape from Figure 10 of Part I superposition on the high risk data fits. Here we show that the Darby/China (Darby et al 2005, 2006, Blot et al 1990) low risk curve also conforms to the same shape behavior but at further reduced levels. We estimate the relative lung cancer risk. The top curve would be with no adaptive response protection. The two middle curves are the observed high risk and low risk Darby/China (Darby et al 2005, 2006, Blot et al 1990) fits showing relative adaptive response protection. Panel C – The polynomial fits to the case-control data show excellent agreement with the Representative Shape composite Bystander and Adaptive Response Microdose Model given in Figure 10 of Part I, which is primarily based on relative chromosome aberration incidence rates. The “U” shaped behavior of the case-control data provides an indication of the radon concentration at which the single hit occurs for lung cancer induction. James et al (2004) provides estimates of the correlation between single alpha particle traversals per kBq m−3 of indoor radon exposure per 30 lung cell mitotic cycle. They provide data for both the nucleus and separately the entire cell (cytoplasm hits). It would be expected that this single hit cancer induction level, shown to be at about 490 Bq m−3, would be greater than the James et al (2004) values. We show in Panel C the James et al (2004) radon concentration single hit values for the indicated traversals for the indicated lung cells. Only the single hits for the Bronchial and Bronchiolar Secretory cells are below the Estimated Single Hit Cancer Induction concentration. This suggests that the sensitive volume for the human lung cells for lung cancer induction may be the entire cell. Based on the adaptive response analysis presented in Appendix B and Section 3.2, all data groups suggest some AR protection i.e. the Darby/China (Darby et al 2005, 2006, Blot et al 1990) and Krewski/MA (Krewski et al 2005, 2006, Thompson et al 2008) high risk groups 27%, the Darby/China (Darby et al 2005, 2006, Blot et al 1990) low group about 72% protection and the Krewski/MA (Krewski et al 2005, 2006, Thompson et al 2008) low group about 100% protections. Panel D – Illustration as to why a 3rd degree polynomial was adequate for the Krewski/MA fit and a 5th degree polynomial was needed for the Darby/China (Darby et al 2005, 2006, Blot et al 1990) data. In the Bystander Damage Region the concave curvature is easily fit with 3 different slopes, whereas for the Darby/China (Darby et al 2005, 2006, Blot et al 1990) data extending to the Direct Damage Region the three Bystander Region slopes are needed but a slope for the Threshold, the Transition and the final Direct Damage slope.
4.2 New Evidence About the Cellular Sensitive Volume for Human Lung Cancer Induction From Radon
We have cited the recent reassessment of the alpha particle dosimetry for the BEIR VI (1999) report by James et al (2004) in Part I. The important 30 day lung cell mitotic cycle single particle hit probabilities are given in their Table 12. The ICRP (1994) Report 66 values as given in James et al (2004) Table 12 are 0.36, 1.4 and 0.51 hits per Basal, Bronchial Secretrory and Bronchiolar Secretory cells respectively per kBq m−3 of radon for cell nucleus hits and 1.0, 16, and 4.0 hits per Basal, Bronchial Secretrory and Bronchiolar Secretory cells respectively per kBq m−3 of radon for cell cytoplasm hits (entire cell as “target”). As Figure 4 of Part I, we have provided graphs of the variation in single alpha hit probabilities for the three primarily alpha induced cancer sensitive cells in the lung i.e. the Bronchial Basal, the Bronchial Secretory and the Bronchiolar Secretory cells. In Figure 10 of Part I, we provide the correlation between radon concentrations and Specific Energy Hits for these three cell species for the nucleus and entire cell volumes relative to the representative alpha particle dose response shape response. In Figure 10 of Part I, we show the alpha traversal rates for the BEIR VI (1999) radon concentration frequency distribution in US homes and in Figure 12 of Part I, we show the sensitive cells hit rates for the BEIR VI (1999), Figure 3-2 lung cancer relative risks. The Figure 7, Panels A, B and C show that the “U” shaped Direct Damage Threshold and Transition Region occurs at a radon concentration of about 450 Bq m−3. This radon concentration value then can be deemed as approximately the single to double hit transition for Direct Damage lung cancer induction concentration. In Figure 7C, we show this accordingly as the “Estimated Single Hit Cancer Induction” level. From the analysis of the alpha particle micro-beam and broad-beam data in Appendix A of Part I, we developed a representative alpha particle dose response shape in Figure 10 of Part I which we felt typifies alpha particle produced neoplastic transformation and chromosome aberration production for the 6.00 and 7.69 MeV radon progeny alphas. We have marked the Bronchial Secretory cytroplasm, the Bronchiolar Secretory cytoplasm, the Bronchial Secretory nucleus and the Basal cytoplasm on the Figure 7C graph, from James et al (2004) Table 12. In Figure 10 of Part I, we have also provided different abscissa scales for conversion to effective radon concentrations for hits to the three sensitive cells and separately as to whether the nucleus or the cytoplasm are hit in the 30 day mitotic cycle. The Basal nucleus and Bronchiolar Secretory nucleus are 2778 Bq m−3 and 1960 Bq m−3 and would be off scale on the Figure 7C graph. By basic definition of the Direct Damage Region and the Direct Damage Threshold, we would expect that one or more alpha particle traversals to occur to produce the threshold for Direct Damage production of lung cancer in humans. We would expect that the radon concentration for the single hits per kBq m−3 values to fall below the estimated lung cancer single hit lung cancer induction value in the “U” shaped region. We therefore must significantly conclude that either the estimated single hit values for nucleus traversals from ICRP (1994) Report 66 and James et al (2004) are incorrect or the sensitive “target” for lung cancer induction is larger than just the cell nucleus. Wu et al (1999) and Shao et al (2008) have observed induction of bystander responses by targeting the cytoplasm. Based on Figure 7C, our analysis of the case-control studies supports their work that the sensitive cell volume for lung cancer induction in humans may be the entire cell of the three sensitive lung cell species.
4.3 Mechanisms and Responses for a Non-Linear Human Lung Cancer Risk
We have shown that most probably there is a significant role of the Adaptrive Response radio-protective mechanism in explaining the very large variation in dose response results for human lung cancer risk from case-control studies world-wide. Leonard (2008b) extensively reviews the data showing that low LET radiation induced, Poisson distributed, single charged particle traversals though target cells activates the protective mechanism against potentially carcinogenic, exogenic large radiation challenge dose damage and also against non-radon, endogenic, toxic, naturally occurring, spontaneous chromosome damage. The radon progeny alpha particle damage can be viewed as exogenic challenge dose damage. The fact that some case-control data, such as the MA, NJ and MO-IIa data, show a reduction below the zero radon, natural spontaneous level means that the human low LET background and man-made radiations also provide protection against the endogenic toxic spontaneous chromosome damage in the lung tissue.
Much is not known to explain the protective behavior. It is well confirmed that single traversals activate AR. Redpath and Elmore (2007) report that the Reactive Oxygen Species concentration is reduced during AR protection, so perhaps the very small amount of free radicals from the single traversal activates the production of cell chemicals that quench the spontaneous and radiation produced radicals such as hydrogen peroxide. It is known that in AR protection ATM is activated and a G2 arrest is initiated. The distinction between the type of chromosome damages by the bystander signals and from direct alpha hits are not clearly known. Also, is there a distinction between the type chromosome damage from an alpha particle traversal through the cell nucleus and the cytoplasm? Cancer development involves a multi-stage process so the off-set between the alpha particle hit rates and cancer induction suggested in Figure 7C may be reconciled.
5. DISCUSSION
5.1 Use of the Papworth (1975) Poisson Validation Test
One can argue that it is inappropriate to apply the Papworth (1975) Poisson Validation Test to the case-control data by use the risk data points variation from the linearized slope curve, which is a continuous function of radon concentration. In Section 3.2, we have argued that with the very large case and control populations justifies the assumption that the linearized curve represents a very accurate quantitative estimate of the “true relationship (between human lung cancer risk and radon concentration) independent of site locality”.
5.2 Validity of In Vitro Dose Response Studies in Predicting In Vivo Radiation Effects
There is always the question of validity of in vitro cellular dose response results, when applied to anticipated radiation dose response in humans. Tissue cultures first came into use in the study of radiation dose response relative to cancer radiation therapy. For radio-therapy, of particular concern was the cell killing radiosensitivity and cell recovery (repair) capability of tumor and peripheral tissue and organs. In the 1970s with newly developed in vitro cellular techniques, the research group at Columbia University directed by Dr. Eric Hall (Hall 2000) performed in vitro dose and dose rate dependent studies of a number of new mammalian cell species. Dr. Halls (Hall 2000) group was meticulous to obtain many different dose rates data sets with dose rate data as low as 10 cGy h−1. These data were found to be useful in our “Inverse” Dose Rate Effect studies (Leonard 2000, 2007a, Leonard and Lucas 2008, 2009). The cell species studied were V79 log phase, V79 plateau phase, HeLa log phase, C3H 10T1/2 plateau phase, C3H 10T1/2 log phase, CHF-F log phase, rat kangaroo, Munt Jac, pig kidney and L-P59 cells. As more human in vitro cell strains became available, in vitro dose rate response studies were possible with direct human application to continuous protracted (brachytherapy) and fractionated radiotherapy. Thus, in the 1980s, there were dose and dose rate surviving fraction in vitro dose response measurements on numerous human cell tissues, many of them by Dr. Gordon Steel (Steel et al 1987) and his radio-biology research group. In a review article by Steel et al (1987), the dose response of human tumor cell lines were summarized i.e. HX34 melonoma, RT112 bladder, HX118 melonoma, HX142 neuroblastoma, HX156 cervix carcinoma, HX138 neuroblastoma, GCT27 testis, HX58 pancreas, WX67 bladder and HX143 neuroblastoma.
In support of the Hall (Hall 2000) and Steel (Steel et al 1987) groups work, the dose and dose rate analytical models of Thames (1985) (Incomplete Repair - IR) and Curtis (1986) (Lethal Potential Lethal – LPL) Models (see Table II Steel et al 1987) were developed. Only two or three separate dose rates were sufficient to determine the α (single hit L-Q damage rate per unit dose), the β (double hit L-Q damage rate per square of dose) and the mean repair half-time, T1/2 (in hours). A more complete list of these parameters for 38 cells of human origin is provided in Table 1 of Brenner and Hall (1991). Small numbers of dose rate data sets were adequate to determine these three parameters. For example in terms of dose rate data sets, Kelland and Steel (1986) provided data for four human tumors with only two dose rates (acute 150 cGy/min and 1.6 cGy/min) for HX58 and HX32 (both pancreatic carcinoma) and only three dose rates (acute 1.50 Gy/min, 7.6 cGy/min and 1.6 cGy/min) for HX118 melonoma and HX99 breast carcinoma. Similarly, McMillan et al (1989) provided two dose rate data sets for the human neuroblastoma cells HX142 and HX138 (acute 1.8 Gy/min and 1 cGy/min). Cassoni et al (1992) obtained only two dose rate data sets for four human lung carcinomas (two small-cell and two non-small cell, HC12, HX149, HX147A7 and HX148G7. Stephens et al (1987) provided 4 dose rate data sets for HX34 human melanoma and 6 data sets for MT mouse mammary carcinoma which we were able to use with their isodose curves in our earlier studies (Leonard 2000, 2007a) as non-IDRE responding cells. Furre et al (1999) only provided three dose rate data sets for the human cervix carcinoma cell line NHIK 3025, but fortunately the lowest dose rate data set at 33 cGy h−1 showed a significant hyper-radiosensitivity as compared to a higher dose rate of 94 cGy h−1.
There are several tools, developed in the late 1980's and 1990's, that have been used by radiotherapists for evaluation of human tissue dose rate effects primarily for low dose rate (LDR) and high dose rate (HDR) brachytherapy treatments and high dose rate fractionation. They are first the isoeffect dose rate curves for constant surviving fraction which were utilized early in radiotherapy analysis. The second major tool was the dose and dose rate dependent cell radiation response models cited above. From these modeling sources, various parameters are obtained from fit of these models to laboratory measured in vitro dose rate response data i.e. α / β ratios for the linear-quadratic model and the biological effective dose (BED) (Jones et al 2001). Due to dose rate effects, it has been known that there is a therapeutic advantage between tumor control and normal tissue complications for fractionation or protraction (brachytherapy). For example, it has been found that typically high α / β ratios, determined from model fitting to in vitro data, are characteristic of normal peripheral tissues that show an early deleterious response in fractionated treatments (see Chapter 22, Hall 2000). Recent analysis of α / β ratios for prostate carcinoma cells are reported (Brenner et al 2002, Carlson et al 2004) that show low α / β ratios and high radio-sensitivity similar to late responding tissue. In Figure 3 of Brenner (1997), a distinction is made between early responding and late responding human tissues (steeper slopes) using isoeffect curves for brachytherapy as well as for fractionation. In vitro cellular dose response measurements and the application of the BED, IR and LPL Models are still extensively used in radio-therapy treatment planning (Hall 2000, Brenner et al 2002, Jones et al 2001).
Hyper-radiosensitivity to cell-killing at very low doses was first observed from in vitro cellular dose response data and is now extensively studied with respect to radio-therapy of solid tumor treatment (Marples et al 2004). This effect has been labeled Hyper-Radiosensitivity and Induced Radio-Resistance (HRS/IRR). It has been found, with the in vitro studies, that about 80% of cell species studied (Dasu and Denekamp 2000) experience HRS/IRR. This is found to be true for 45 human cell species (Joiner et al 2001). In radiotherapy, this very low dose hyper-radiosensitivity is being examined for possible therapeutic gain by the use of ultra-fractionated dose from 0.5 to 1.5 Gy instead of the fractionated doses of 2.0 Gy in conventional radiotherapy treatment regimes (Slonina et al 2007, Harney et al 2004a, 2004b). Conclusive in vitro benefits for head and neck cancers have been shown and potential benefits for brain glioma cancers are suggested (Dey et al 2003, Tome and Howard 2007). The University of Kentucky Markey Cancer Center has recruited head and neck tumor patients for a bi-weekly combined gemcitabine and paclitaxel and low-dose radiation treatment program using 50 to 80 cGy twice daily (4 hours apart) radiation exposures (see internet ClinicalTrials.gov Identifier NCT00176241). From in vitro data correlating IDRE with the HRS/IRR hyper-radiosensitivity (Leonard 2000, 2007d), it is suggested that the “Inverse” Dose Rate Effect hyper-radiosensitivity may cause excessive cell killing in LDR brachytherapy of preferential tissues and organs but also may have a therapeutic gain if tumor cells undergo IDRE (Leonard and Lucas 2008, 2009).
In the last 25 years, on the order of thousands of oncogenic neoplastic transformation and chromosome aberration in vitro studies have been reported with the presumption of a correlation of in vitro data with human carcinogenesis. Based on the extensive studies of in vitro alpha particle cellular dose response to ionizing radiations (Miller et al 1995, 1999, Zhou et al 2001, 2004, Nagasawa and Little 1999, 2002, Nagasawa et al 2003, Hei et al 1997, Sawant et al 2001) and analyzed in Part I, there has been a presumption that the Bystander Effect is experienced by humans in the induction of radon induced lung cancer (Zhou et al 2001, Brenner et al 2001, Brenner and Sachs 2002, Little and Wakeford 2001, Little 2004). The extensive Adaptive Response in vitro research cited here (Azzam et al 1996, Elmore et al 2006, 2008, Ko et al 2004, Redpath et al 2001, 2003, Redpath and Antoniono 1998, Shadley and Wiencke 1989, Shadley and Wolff 1987, Shadley et al 1987, Wiencke et al 1986, Wolff et al 1989, 1991) and analyzed with the composite AR and BE Microdose Model (Leonard 2005, 2007a, 2007b, 2008a, 2008b, Leonard and Leonard 2008) is supportive of humans experiencing Adaptive Response radio-protection from low LET radiation exposures. As shown in the next section, there are more in vivo relatively new data supporting AR protection than BE damage in humans. It is generally accepted that the induction of carcinogenesis in the human anatomy can be predictable by in vitro observation of cellular damage mechanisms.
5.3 In Vivo Examples of Adaptive Response Radio-protective Dose Response to Ionizing Radiations
Although we have in the previous section given examples of how in vitro dose response data have assisted radio-biologist and radio-therapist in anticipating human dose response to radiation and suggested that these data support a premise of in vitro data that there are bystander and adaptive response effects in humans, some critics have noted that little in vivo data are available. We offer the following relatively recent in vivo results. A number of animal laboratory exposures to ionizing radiations have shown the ability of cells, tissues and organs to exhibit adaptive response radio-protection from low doses. There are also some examples of AR reduction effects for human exposures. We here cite a few of these cases. Perhaps the most directly applicable case to AR reduction in lung cancer incidence is the analysis conducted by Rossi and Zaider (1997) of about 14,000 women that had received radio-therapy treatment for breast cancer (we show their dose response data as Figure 8A, reproduced from Figure 3B of Leonard (2007a). The epidemiological data of Cohen (1997), presented here as Figure 8B, showing a reduction in lung cancer incidence in the US with increasing radon levels, has generated 20 years of controversy. His response curve is even shown in the BEIR VI (1999) Figure 3-2 reproduced in our Figures 1C and 15 of Part I. Two non-radiation case-control studies (Levin et al 1987, Astrakianakis et al 2007), the data shown in Figure 8C for textile workers in Shanghai, China, found a reduction in lung cancer risk of about 30% with increasing endotoxin exposure. The first study involved 1405 cancer cases and 1495 controls. Dr. Blot, who did the Shengyang, China radon case-control study (Blot et al 1990), was a participant in this study. The more recent study involved 628 cancer cases and 3184 controls. These AR reduction findings are similar to that of US textile workers (Henderson and Enterline 1973). Although the studies did not involve radiation as the toxigen, it does suggest an ability of lung tissue to activate protective mechanisms under stress conditions.

Examples of reduction in lung cancer incidence below the zero-radon spontaneous level. The red curves show the estimated Poisson distributed adaptive response activation. Panel A – The data of Rossi and Zaider (1997) (Rossi 1999) of reduction in lung cancer for women treated for breast cancer with radio-therapy. Panel B = The epidemiological data of Cohen (1997) of lung cancer incidence by counties in the US. Panel C - The observed lung cancer risk in a case=control study of textile workers in Shanghai, China exposed to toxic textile chemicals (Astrakianakis et al 2007, Levin et al 1987).
The most recent, and believed to be most significant, studies have been with live whole-body exposures of mice. Wang and Cai (2000) irradiated live mice to a 6 Gy challenge dose and found that with administering a priming dose of 0.5 Gy 48 hours prior to the challenge dose, the effect on red blood count, white blood count and platelet count was reduced by 90%. Day et al (2006) exposed live pKZ1 mice prostate gland to challenge doses of 1000 mGy of X-rays and measured the chromosome inversion frequency. By pre-exposing the mice to very low doses of X-rays (0.001 to 10 mGy), a reduction of from 50 to 70% was observed with the greatest reduction for the 0.001 mGy exposure. Two research groups have examined the effect of low dose rate exposures, at rates comparable to human dose rates. Ina and Sakai (2005) exposed MRL-lpr/lpr mice to a chronic dose rate of 1.2 mGy/h for a series of prolonged exposure experiments and studied the life-span effect. For life-long exposures, they observed what has to be considered a remarkable result. The median life-span of 134 days of unexposed mice was extended to 502 days from these continuous exposures. At the dose rate used the exposed mice received the equivalent annual NRC permitted dose for nuclear workers in 2 days, and yet they survived for 502 days. With a series of experiments with cancer proned, Trp53 heterozygous mice, the dose rates were at levels that occupational nuclear workers would be expected to receive under normal work conditions at sub-NRC levels. What has been shown is that for these mice in vivo, such low doses induce an adaptive response that increases tumor latency and increases the life span as shown in Figures 9A and 9B (from Mitchel et al 2003). These data show the adaptive response radio-protection from endogenic, spontaneous, genetically inheritable tumor development. A low-dose threshold exists for the adaptive response protection against chronic ulcerative dermatitis, a spontaneous, autoimmune-type age-related disease in the C57BL/6 mice (Mitchel 2007b). For that non-cancer disease, these very low-dose fractionated exposures induced a protective adaptive response in both Trp53 normal and heteroztgous mice, but a lower threshold level of exposure had to be exceeded. This shows that low doses of low LET radiation can activate tumor protective mechanisms, but with a minimum threshold, just as we have seen in the in vitro AR data in Figure 1 of Part II and our other work. But also, there is a high dose threshold where the Direct Damage dominates the AR protection., as also we have seen in our analysis of the in vitro data and shown in Figure 5A of Part II at around 10 cGy of priming dose.
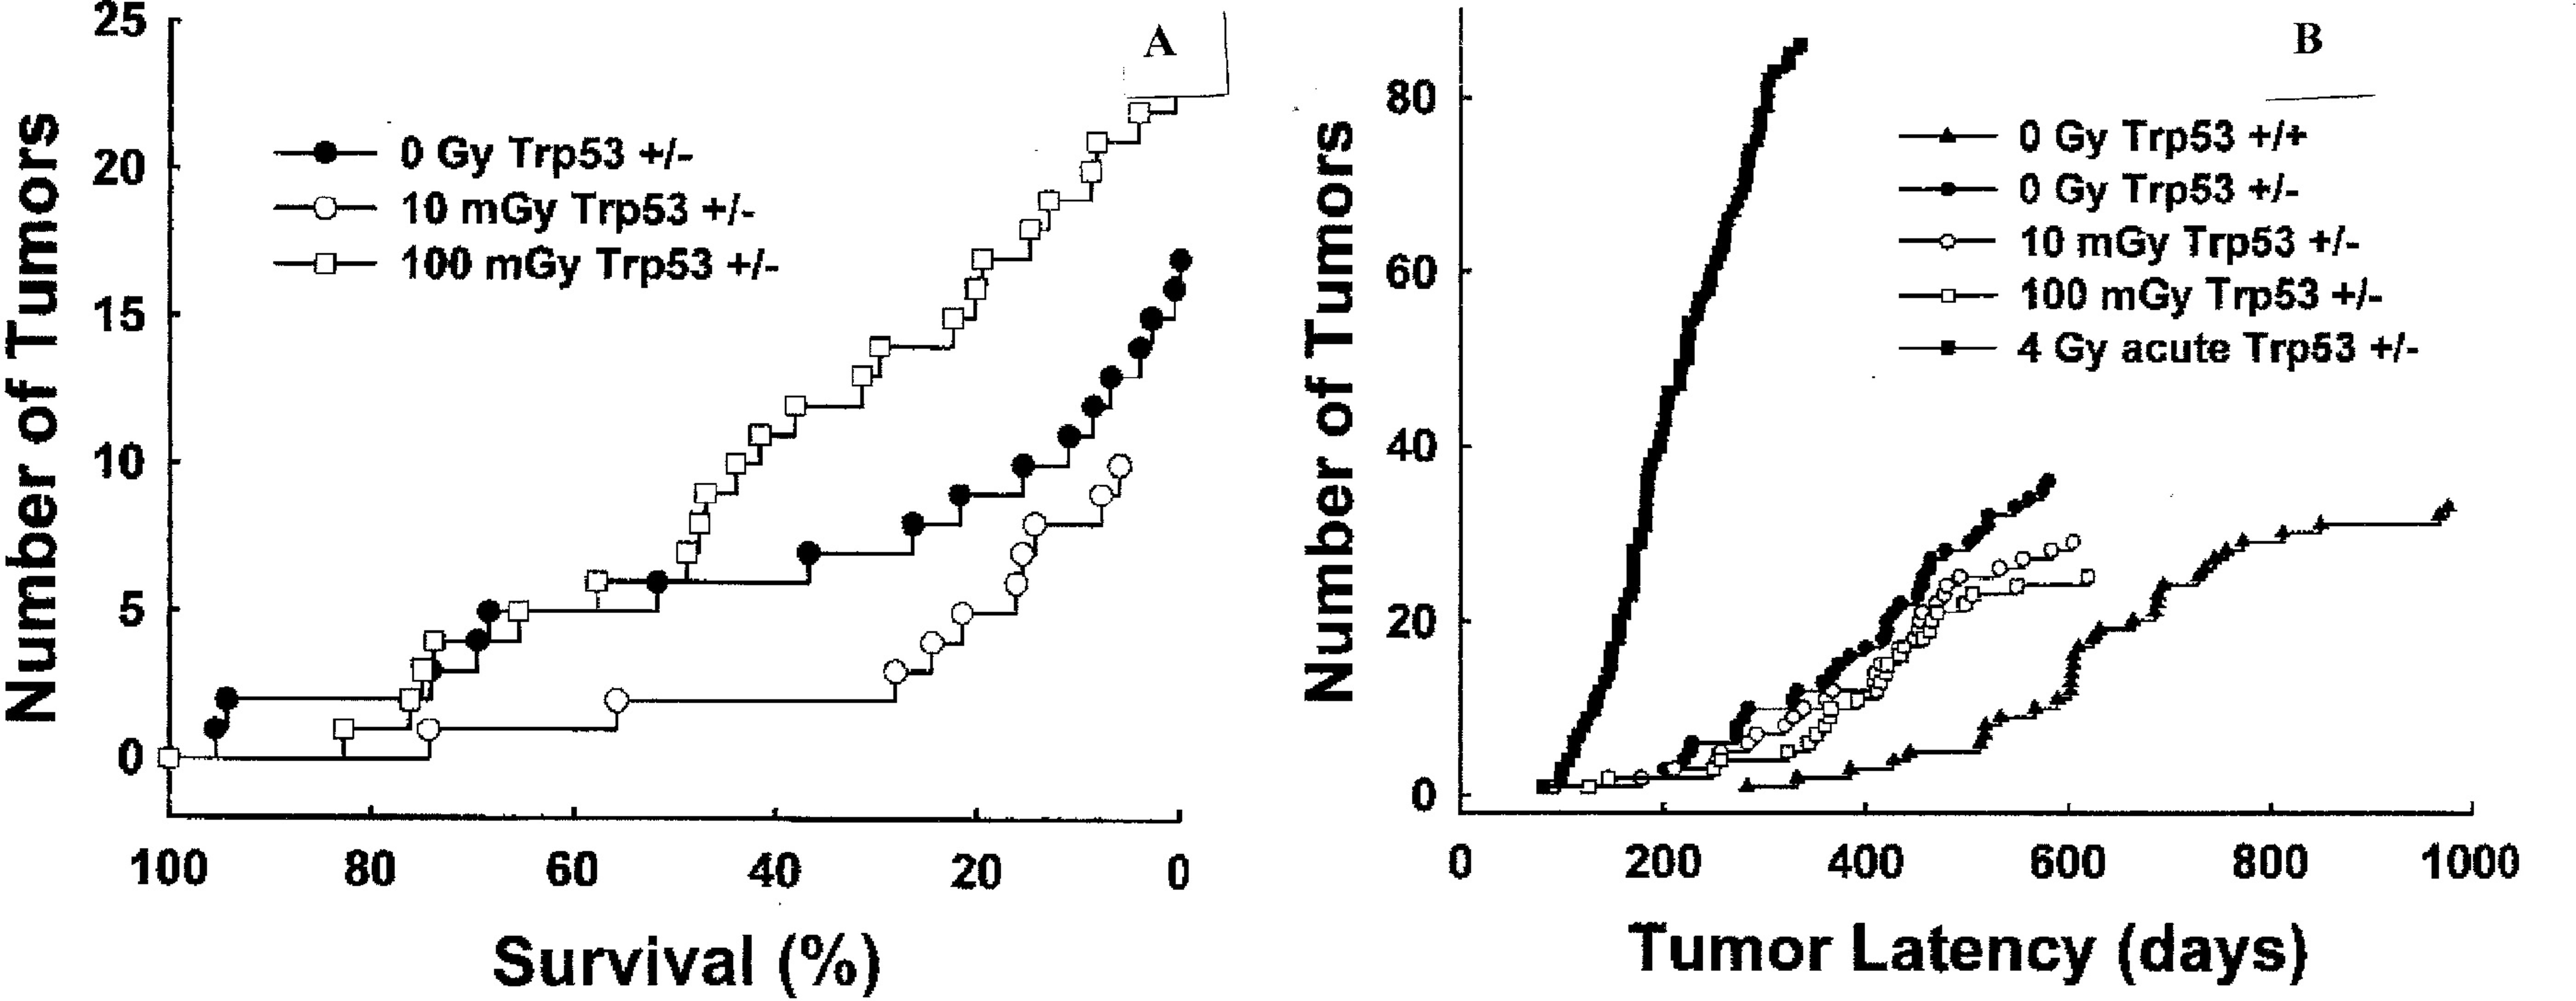
Study of low dose rate induction of adaptive response radio-protection (Mitchel et al 2003). Panel A – The appearance of spinal osteosarcomas associated with paralysis in Trp53 heterozygous mice (+/-) at low occupational level dose rate. Panel B – Tumor latency of lymphomas appearing in unexposed Trp53 normal (+/+) and Trp53 heterozygous (+/-) mice exposed to indicated doses of 60Co radiation.
5.4 Some Special Considerations Relative to the Combined Bystander and Adaptive Response Lung Dose Response
In a recent Dose-Response Journal review article (Leonard 2008b), the various circumstances under which adaptive response protection can be experienced was presented. In Section 2.3 of Part II, we have summarized key AR responding data relative to protection from large “challenge” doses of radiation and from naturally occurring, potentially carcinogenic, spontaneous cellular damage. What occurs in the human lung from radon progeny alpha particles can be perceived as alpha particle “challenge” dose damage, which we have shown is modulated by the AR from the continual human low LET exposures. In the laboratory, a “challenge” dose experiment, such as those performed by the Shadley, Wiencke and Wolff research group (Shadley and Wiencke 1989, Shadley and Wolff 1987, Shadley et al 1987, Wiencke et al 1986, Wolff et al 1989, 1991), is with a single large “challenge” dose. In assessing human cancer risk from radon, we are examining a continuum of exposure data over a wide range of alpha particle exposures to the lung. The analysis of the Pohl-Ruling (1988) radon exposure data involved a case where the radon progeny beta rays provided the low LET adaptive response protection. There then was a case of a continuum of beta ray AR protection with increasing radon exposure. We have included this beta source in our analysis here in Part II. We have also had to consider, in Part II, the variable increase in the Uranium terrestrial background radiation as a second continuum source to AR protection.
5.5 Measurement of Indoor Gamma Ray Dose in Case-control Studies
The fact that underground miners lung cancer data may not be directly applicable to human lung cancer incidence at domestic and workplace radon levels means that case-control studies may be more significant in the assessment of lung cancer risks from radon. The evidence of adaptive response reduction of lung cancer risks from human exposure to low LET radio-protection suggests that planners for future case-control studies should consider the measurement of the indoor gamma and beta ray exposure levels as well as the radon concentration exposures in residences to assess AR protection. This would require portable gamma ray spectrometer systems. There are basically two type spectrometers that have been used. Clouvas et al (2001) used a high resolution Germanium solid state detector system that yields gamma spectrum data similar to that shown in Figure A1A of Part II. The USGS and DOE aerial monitoring systems use a large NaI crystal as their detector (DOE 2002). This has a much higher detection efficiency than the much smaller Germanium detector and has been found to provide adequate resolution. The Germanium system requires then longer counting times to obtain a good spectrum. Portable automatic analyzer systems to resolve the individual gamma rays and their intensities are available for both.
5.6 Uncertainties in the Estimation of Combined BE and AR Effects on the Lung Cancer Risks from Radon
It has been found that the magnitude of the adaptive response protection below the zero priming dose response “challenge” damage or spontaneous damage level varies between about 50% to about 80%. We have used a 65% reduction for the priming dose reduction parameter Pprot-pr [see Equation (3) and then Appendix A of Part II for the definition]. The relative sensitivities of the three lung cell species to carcinogenesis is not accurately known (NRC 1991). It is suspected that the basal cells may have greater sensitivity than the other two, but not conclusively confirmed. We have here considered the three cells sensitivities as equal. There are uncertainties relative to the size of these cells as targets for charged particle traversal of both alphas and low LET traversals. We have used the BEIR VI (1999) values as have others (Little and Wakeford 2001, Brenner et al 2001, Little 2004, Brenner and Sachs 2002).
The compilation of lung cell Specific Energy traversals is conservative in that the external beta rays from the terrestrial radiations are not included, the 0.511 MeV annihilation gamma rays are neglected in the internal Potassium-40 activities, only the cosmic ray high energy protons are considered neglecting the approximately 10% high energy helium ions and neutrons and also any variation in Thorium terrestrial gammas with increasing radon concentration is neglected (USGS has only, so far, provided in the NURE report the Uranium terrestrial data). We have not considered any protective bystander effects even though there is evidence from recent work presented in Section 2.3.b and Figure 2 of Part II. Its presence would reduce the dose response at the very low dose region of the radon dose response curve.
In Figures 1 and 5A of Part II, it is shown that the domination of the Direct Damage component from priming doses in the adaptive response experiments begins at about 10 cGy of low LET primer dose. It is also shown throughout this work that the threshold for the adaptive response protection begins with a Poisson distributed mean single Specific Energy Hit. For the radiations tabulated in Table A1 of the Appendix A of Part II, this would occur on an average at about 0.10 cGy such that the Adaptive Response Region extends from about 0.10 cGy to about 10.0 cGy. With the UNSCEAR (2000) worldwide average human low LET exposure at about 1.7 mSv (see Table 1), a significant fraction of the human lung cells will have received a single low LET radiation induced charged particle traversal, activating the AR against the radon progeny alpha deleterious Bystander Damage.
The use of the modified BaD Model concave Bystander Damage dose response for the domestic region radon alpha induced Radon Lung Cancer Risk, without the presence of AR protection, provides an average for the domestic region, in Figure 13B of Part I, which is higher than provided by the approximately 0.0020 ERR/Bq m−3 BEIR VI (1999) estimate. For the radon range from zero to 400 Bq m−3 the average ERR using the concave Bystander Damage dose response in Figure 13B, Part I is 0.818 compared to the BEIR VI (1999) average ERR of 0.676 for the same range, meaning about a 20% higher lung cancer induction without AR protection being considered.
We have shown that the 13 European case- control studies [plus the Blot et al (1990) study in Shenyang, China] and the 8 North American studies [plus the Thompson et al (2008) MA study] show such an extreme variation, that either the case-control methodology is totally invalid (which most radiobiologist and the BEIR committees are reluctant to premise) or that there are one or more other dose response mechanisms other than the Linear No-Threshold mechanism. It is significant to note that Krewski et al (2005, 2006), in their analysis of their study, indicates that if the Iowa data is removed from the North American pooling, then any statistically positive association between radon and lung cancer disappears [e.g. the dose response slope, beta (95% CL) in our Equation (C1), reduces to 0.04 (−0.04, 0.19) per 100 Bq m−3] (see their page 578). Also, Darby et al (2005) shows no statistically significant Relative Risk below 100 Bq m−3 as compared to the reference value below 25 Bq m−3 (see their Table 2) and they suggest a possible threshold at 150 Bq m−3 (see their paragraph 1, page 224). There seems to be considerable uncertainty in their analysis and results. Another example is the case-control study in Spain where Darby et al (2005) reports a negative slope whereas the original publication (Barros et al 2002) reports a positive slope for beta in Equation (1). The Spanish study of Llorca et al (2007) showing no correlation between radon and lung cancer was not reported. There is a subsequent China case-control report for the Gansu Province of China (Wang et al 2002) that shows a positive Odds Ratio above 150 Bq m−3 but was not included here. From Figures 16 and 17 of Part II, the mean and maximum and minimum human lung dose responses from combined radon progeny particles and low LET human radiation charged particle traversals are shown.
Research data is emerging in support of abnormal cells as being a key property of carcinogenesis and higher levels of organization such as tissues and organs play an important role. The extensive in vivo mice studies (Mitchel et al (1999, 2002, 2003, 2004, Mitchel 2006, 2007a, 2007b, 2008), show that adaptive response protection impacts on tumor development and progression. Cancer does not however develop at the tissue or organ level. It is universally accepted that cancers, including lung cancer, starts in a single cell. BEIR VI (1999) acknowledges this. We take the liberty to quote from the “Executive Summary” statement for DOE's Low Dose Radiation Research Program (DOE 1999). The summary begins “Each and every cell in the human body is constantly engaged in a life and death struggle to survive “in spite of itself”.” Later in the second paragraph in bold print it states “Thus, a crucial, yet unanswered, question in radiobiology is whether the biological damage induced by low doses and low dose rates of radiation is repaired by the same cellular processes and with the same efficiency as normal oxidative damage that is a way of life for every living cell”. Even later in the summary it states “The research program will build on advances in modern molecular biology and instrumentation, not available during the previous 50 years of radiation biology research, to address the effects of very low levels of exposure to ionizing radiation. It will concentrate on understanding the relationship that exists between normal endogenous processes that deal with oxidative damage and processes responsible for the detection and repair of low levels of radiation-induced damage.” It is universally understood that the damage inducing carcinogenesis begins solely within the cell, not tissue or organ, although these are impacted by tumor development and metastasis.
This work highlights future research needs. Neither alpha particle bystander nor low LET adaptive response or combined in vitro experiments have been conducted, to a reasonable extent, directly with the basal and secretory lung cells. The alpha particle LET and RBE broad-beam in vitro experiments of Miller et al (1995) need to be repeated with immortalized basal and secretory cells. Similarly, the low LET adaptive response experiments of Dr. Redpaths group need to be repeated with the immortalized basal and secretory cells. Very low doses should be used, below the AR threshold z1 values to examine protective bystander effects. It is not known if there is a distinction between chromosome damage from bystander signals and from Direct Damage.
With the hundreds of thousands of mice that have been sacrificed for radon studies, none have involved simultaneous exposure to internal radon progeny alpha lung and external low level low LET radiations, to look for AR, as compared to just internal radon as controls [similar to Dr. Mitchels priming exposures (Mitchel et al 1999, 2002, 2003, 2004, Mitchel 2006, 2007a, 2007b, 2008) examining AR for other biological “end-points”]. The problem however is that at the higher radon concentrations, such as used by Cross (1988), to accelerate cancer induction in the animals, the doses are in the Direct Damage Region above the Adaptive Response Region and even in the EDE region.
5.7 Use of Underground Miners Lung Cancer Risk Data for Domestic and Workplace Radon Levels
From the work presented here, it would appear that extrapolation from underground miners lung cancer risks (Lubin et al 1995a, 1995b) to lower domestic radon level risks may be fundamentally inappropriate due to the different type cellular damage involved i.e. Bystander Effect Damage at domestic levels and Direct Damage at underground mine levels (See Section 4.2.e of Part I). In Figures 10 and 12 of Part I and the case-control results, it is shown that radon lung cancer induction at human domestic and workplace radon levels is from bystander lung cell damage. Based on our analysis, only above about 500 Bq m−3 of radon is there evidence of Direct Damage induction of human lung cancer from the case-control studies. In Figure 10, it is shown that the underground miners were exposed to radon levels where multiple lung cell alpha traversal were prevalent during the 30 day mitotic cycle and thus Direct Damage and a different dose response shaped curve is experienced as evidenced by Figures 10 and 12 of Part I. In fact the depth of the “U” shaped behavior is deeper for the case-control, high risk response, indicating different lung cancer sensitivity for the two regions than predicted by the representative shape curve in Figure 10 of Part I.

Based on underground miners exposures presented in Figure 13A of Leonard (2007c), We show Panel A – The percentile of mine workstations where one lung cell alpha particle traversal will occur in the 30 day cycle. Panel B – Percentile of workstations where multiple traversals will occur. Thus for the underground miners their lung cancer risks are from Direct Damage alpha particle traversals not from Bystander Damage.
5.8 Implications Relative to Human Radiation Exposures for the General Public and Radiation Workers
The study has shown that low LET radiation exposures from environmental and man-made sources and normal human activities can induce cancer preventive adaptive response radio-protection mechanisms in human lung tissues. These exposures are mostly whole body exposures with doses on the order of fractions of a mGy per cell cycle for most cells within the human body. The LET of the radiations as shown in Tables A1 and A2 of Part II are such that a significant portion of human cells throughout the body will receive at least one radiation induced charged particle traversal per cycle and thus experience a reduction in potentially carcinogenic spontaneous cellular damage and damage from external radiations, particular for radiation workers. We have, from Figure 1B, Part I and Table 1 of the nuclear workers study by Cardis et al (2007), examined the dose distributions of the cohorts included in their study. We reproduce, as Figure 11A, the Cardis et al (2007) data for Excess Relative Risk for cancer from three categories i.e. All Excluding Leukemia, All Excluding Leukemia, Lung and Pleura, and Leukemia less CCL. Below about 70 mSv exposure it is shown that there is either no risk or a negative risk for all three categories. Figure 11B shows that 96% of all workers received a lifetime occupational dose of less than 100 mSv (10 Rem). If we exclude those below 5 mSv, which may be clerical staff that do not enter Radiation Areas, the value is 86%. In our past analysis of adaptive response (see Figure 1 of Part II), we found that the threshold for the Direct Damage component for neoplastic transformation and chromosome aberration production begins at about 100 mGy.
5.9 The Ecological Concept for Population Weighting of Radon Radiation Risks
We have shown that ecological and geographical conditions most probably result, in some instances, a reduction in human lung cancer risks from radon, below the natural occurring zero radon level. We have included all the data in the 23 case-control studies and averaged the cancer risks in the radon exposure range from 0 to 400 Bq m−3 considered. Although it is conclusive from the high risk data of Krewski et al (2005, 2006) and Darby et al (2005, 2006) that high levels of radon can cause lung cancer it is also evident from the low risk data that a combination of ecological and geological conditions can result in an epidemiological decrease in lung cancers below the spontaneous, zero radon, level for many of the worlds populations. Population weighing of the beneficial with the deleterious aspects of radon may mean radon imposes negligible risk to humans.

The Cardis et al (2007) nuclear workers study. Panel A – The low worker dose region showing the Linear No-Threshold Model to be a poor assumption below about 60 mSv. Panel B = Graph of Percent of total workers above the indicated dose showing 96% below 100 mSv and 89% below 100 mSv if the < 5 mSv is neglected.
5.10 A Threshold and Transition Behavior for Initiation of the Direct Damage Region for Alpha Particles
From the application of the composite Microdose Model in Part I alpha particle dose response data, it is found that single alpha particle traversals through the cell do not appear to induce neoplastic transformation or chromosome aberrations. The fit of the model demands that there be a threshold and transition involving a second alpha particle traversal through the cell with increasing alpha particle fluence. The idea that more than single hits are necessary to activate the direct damage was first suggested by Miller et al (1999) and here we use the Normal Distribution simply to empirically shape the dose response curve in the modified bystander BaD Model. Other causes such as a reduction in the spontaneous damage level by single hits may be the plausible mechanism. The best fit to nine separate data sets in Appendix A, Part I found that a Normal Distribution accumulation function with a Mean value of 1.68 traversals and a Standard Deviation of the distribution of 0.62 traversals provides this threshold and transition. Miller et al (1999) first observed this characteristic in comparing single alpha particle microbeam exposures with broadbeam exposures of 10T1/2 fibroblast cells. We have confirmed that multiple traversals are necessary to induce cellular Direct Damage. Miller et al (1999) commented that this may mean an overestimate of risk at low doses using LNT would occur. We see however that bystander damage occurs below multiple traversals, at domestic levels, but is, as they note, non-linear and not accurate by LNT extrapolation. We see in the analysis of the case-control studies of Krewski et al (2005, 2006) and Darby et al (2005, 2006) that there is indeed a “U” shaped behavior in their Odds Ratio Lung Cancer Risk curves as determined by our composite Microdose Model analysis. The analysis of the Miller et al (1999) by Brenner et al (2001) and Little and Wakeford (2001) is inappropriate as shown in Figure 12 since a well-defined Bystander Damage Region would be observed if exposures are performed in that region. This well-defined behavior is clearly seen in Figures 10 and 16 of Part I.
6. SUMMARY
We believe that this three part study (Leonard et al 2010a, Leonard et al 2010b and this Part III) provides the first direct evidence of bystander and adaptive response effects on humans.
6.1 Summary of Parts I and II
We can tabulate the significant results of the prior Parts I and II analysis;
BEIR VI (1999) and Pooled Case-Control Studies Assumption of Linearity for Human Lung Cancer Risks from Radon
The BEIR VI (1999) assessment of linearity for human lung cancer risks from radon is summarized in their Figure 3-2 and their Executive Summary statement, repeated again here from the Introduction Section as follows: “The choice was to use a linear relationship between risk and low doses of radon progeny without a threshold. The choice was based primarily on considerations related to the stochastic nature of the energy deposition by alpha particles; at low doses, a decrease in dose simply results in a decrease in the number of cells subjected to the same insult. That observation, combined with the evidence that a single alpha particle can cause substantial permanent damage to a cell and that most cancers are of monoclonal origin, provides the mechanistic basis of the use of a linear model at low doses. In addition, as discussed in the report, exposure-response relationships estimated from the observational data in miners with low exposures, and from the case-control studies of indoor radon, are consistent with linearity.” The BEIR VI (1999) Figure 3-2 is provided as Figure 1C in the Introduction of Part I.
This assumption of linearity of risk is considered basic by the participants in the recent North American (Krewski et al 2005, 2006) and European (Darby et al 2005, 2006) pooled case-control studies with their premise that “The pooling of data from these studies is based on the assumption that between-site differences seen in the observed relationship between lung cancer risk and radon exposure are due to random measurement variability and the true relationship is independent of site locality and only dependent on the carcinogenic sensitivity of human lung tissue to alpha radiation.”, which both the Darby et al (2005, 2006) and Krewski et al (2005, 2006) groups assumed to be Linear No-Threshold (LNT) compatible with BEIR VI (1999). We show their linear best fits in Figure 2 of Part I and Figure 1 herein.
Analysis of Micro-beam and Broad-beam Alpha Particle In Vitro Measurements
The micro-beam and broad-beam alpha particle in vitro dose response measurements, primarily at the Columbia University accelerator, show that at low radon levels human lung cancers should be from Bystander Damage in human lung tissue (see Figure 10 and 16 of Part I). Thus the lung cancer Relative Risks dose response should be non-linear according to the bystander BaD Model and not as premised in 1. above by BEIR VI (1999) and Darby et al (2005, 2006) and Krewski et al (2005, 2006).
Adaptive Response Radio-protection from Natural Background and Man-made Radiation as Cause of the Very Large Variation in the Pooled Case-Control Human Lung Cancer Studies
We have noted that low LET induced single charged particle traversals through cells activates adaptive response radio-protection against alpha particle chromosome damage and spontaneous cell damage (see Figures 3 of Part II). Humans are exposed to low LET radiations from natural background and man-made radiations. Using the UNSCEAR (2000) estimate for these radiations given in Table 1 of Part II, it is shown in Tables A1, A2 and A3 of Part II, that sufficient lung cell traversals can occur to induce an adaptive response reduction in human lung cancer risks. The very large range of the radiations, world-wide, is sufficient to justify the very large variation in lung cancer risks from the case-control studies by a very wide range of AR protections.
A Papworth (1975) Poisson Validation Test for Linearity for the Pooled Case-Control Data
In examining the case-control linear best fits in Figure 2 of Part I, one can only conclude that either 1.) the Odds Ratio method of evaluating lung cancer risk is a very poor method of analysis or 2.) that the above stated premise of “only carcinogenic sensitivity of the human lung” is invalid. For this reason, in Section 3.2 we have applied the Papworth Poisson Validation Test for Linearity (Papworth 1975, Savage and Papworth 2000) to the pooled data with the determination that the data does not reflect a single linear behavior and is over-dispersed when tested for a Poisson distribution about a single linear function – thus reflecting other ancillary influences causing the over-dispersion.
Adaptive Response Radio-Protection as the Only Plausible Ancillary Influence
In Part I, we have shown that Bystander Damage should be the dominant cause of radon progeny induced human lung cancers at domestic and workplace radon levels. Without any external, ancillary influences, the BEIR VI (1999) and pooled case-control data should indeed reflect a single carcinogenic response, not linearly but following the shape of the bystander BaD Model illustrated in Figure 3 of Part I. Morgan (2006) and others have suggested that human response to ionizing radiations should be non-linear and primarily influenced by the Bystander Effect and Adaptive Response radio-protection. The only plausible influence that could cause such a very large range, world-wide, of lung cancer risks from the case-control studies must be AR protection. Adaptive response radio-protection is noted in other dose response instances (Redpath and Mitchel 2006, Redpath 2007, Redpath and Elmore 2007).
The Radiation Sources for the Activation of Adaptive Response Protection in Lung Tissue
It is known that Poisson accumulated, low LET radiation induced, single charged particle traversals through the cell nucleus activates the adaptive response protective mechanisms. This is found to be independent of the type low LET radiation from X-rays, gamma rays, beta rays, electrons and even high energy protons. Thus all the low LET natural background and man-made radiations, estimated in the United Nations Table 1, will activate adaptive response protection. The degree of protection simply depends on the fraction of lung cells receiving charged particle traversals as tabulated in Tables A1, A2 and A3 of the Appendix A of Part II. At the UNSCEAR (2000) world-wide average human low LET exposures Table A3 and Figure 16 of Part II estimates that a 40% reduction in lung cancer risks occurs at a radon concentration of 400 Bq m−3. At the UNSCEAR (2000) Table 1 (of Part II) minimum and maximum human natural background and man-made radiation levels, it is estimated that 20% and 80% reduction occurs, respectively. Thus, as the pooled case-control studies indicate, a very wide range of human lung cancer risks from radon should be expected world-wide.

For reasons not presently known, the microbeam and broadbeam alpha particle dose response data examined in Appendix A requires more than single alpha particle hits to initiate the Direct Damage induced neoplastic transformation and chromosome aberrations. Below the single alpha traversals the data shows a well-defined Bystander Damage response such as in Figure A1F. Panels A and B – The data of Miller et al (1999) for microbeam and broadbeam exposures of 10T1/2 cells showing no Direct Damage for single microbeam hits. Bottom two Panels – Examination and analysis by Brenner et al (2001) and Little and Wakeford (2001) showing inappropriate evaluation of the Bystander Regions.
6.2 Summary of Part III
We have analyzed the data from the North American (Krewski et al 2005, 2006) pooled study, the European (Darby et al 2005, 2006) pooled study, the Massachusetts (Thompson et al 2008) study and the China (Blot et al 1990). The North American study included 3662 lung cancer cases and 4966 controls. The European study included 7148 cases and 14269 controls. Altogether our analysis encompassed over 11000 cases and 20000 controls. By applying the Papworth (1975) Poisson Validation Test for linear correlation it is shown that the basic premises of Krewski et al (2005, 2006) and Darby et al (2005, 2006) that “between-site differences seen in the observed relationship between lung cancer risk and radon exposure are due to random measurement variability and the true relationship is independent of site locality and only dependent on the carcinogenic sensitivity of human lung tissue to alpha radiation” in conclusively invalid. Case-control studies show zero and negative lung cancer risks with increasing human radon exposure. By dividing the studies into two groups. those showing positive risks (high groups) and those showing zero or negative risks (low groups), polynomial fits were performed to the data. The curves obtained for the high and low Darby et al (2005, 2006) groups (Figures 4A and 4B) displayed non-coincidental, strong similarity to the expected curves obtained from Figures 10 and 16 of Part I and Figures 16, 17 and 18 of Part II. The Part II expected curves were derived from the bystander BaD Model, reflecting primarily Bystander Damage as the inductive damage for domestic and workplace radon lung cancers. The polynomial fit for the Krewski et al (2005, 2006) high group matched that for the Darby et al (2005, 2006) high group and the fit to the low Krewski et al (2005, 2006) group showed no radon lung cancer risk and a large reduction in the zero radon natural spontaneous risks. In Figure 7B, we estimate an adaptive response reduction of about 27% for the Darby et al (2005, 2006) and Krewski et al (2005, 2006) high groups, about a 72% AR reduction for the low Darby et al (2005, 2006) group and a 100% AR reduction for the Krewski et al (2005, 2006) low group.
6. CONCLUSIONS
The human lung cancer risk from radon is not linear with increasing radon concentration exposure for two primary reasons. First, the neoplastic transformation frequency and the chromosome aberration rates of cellular damage from alpha particles originates from bystander effect damage at normal domestic and workplace radon levels, which has a concave response structure with increasing radon. At about 450 Bq m−3 concentration, the cellular damage behavior and lung cancer risk experiences a district transition to a quasi-linear-quadratic response with a “U” shaped behavior in this transition region. Second, lung cancer incidence from radon is suppressed by adaptive response radio-protection by natural background and man-made low LET radiations routinely experienced by humans. This adaptive response protection on a cell-by-cell basis, when experienced in human cells from these whole body exposures, dominates the potential carcinogenic risks from the radon progeny alpha particles. This results in a very large variation in population averaged human lung cancer risks from radon as evidenced by the case-control studies. For human exposures to radon up to about 400 Bq m−3 in Europe and North American, and perhaps worldwide depending on geological and ecological conditions, humans have about a 30% chance that there is no lung cancer risk from radon and a 20% chance that the adaptive response protection produces a reduced lung cancer risk below the natural, non-radon, spontaneous level. This protection must be afforded to humans with respect to other carcinogens and diseases There is evidence that the cellular sensitive volume for radon induction of lung cancer is the entire cell region (nucleus and cytoplasm) for the basal and secretory cells.