
Abstract
Since the publication of the BEIR VI report in 1999 on health risks from radon, a significant amount of new data has been published showing various mechanisms that may affect the ultimate assessment of radon as a carcinogen, at low domestic and workplace radon levels, in particular the Bystander Effect (BE) and the Adaptive Response radio-protection (AR). We analyzed the microbeam and broadbeam alpha particle data of Miller et al. (1995, 1999), Zhou et al. (2001, 2003, 2004), Nagasawa and Little (1999, 2002), Hei et al. (1999), Sawant et al. (2001a) and found that the shape of the cellular response to alphas is relatively independent of cell species and LET of the alphas. The same alpha particle traversal dose response behavior should be true for human lung tissue exposure to radon progeny alpha particles. In the Bystander Damage Region of the alpha particle response, there is a variation of RBE from about 10 to 35. There is a transition region between the Bystander Damage Region and Direct Damage Region of between one and two microdose alpha particle traversals indicating that perhaps two alpha particle “hits” are necessary to produce the direct damage. Extrapolation of underground miners lung cancer risks to human risks at domestic and workplace levels may not be valid.
1. INTRODUCTION
A number of radio-biologists have posed the question, “What if the Bystander Effect from radon alpha particles is operative within the human lung and is a major cause of lung cancer?” This has prompted studies to examine the potential magnitude and consequences of the radon produced Bystander Effect in human lung tissue (Little and Wakeford 2001, Little 2004, Brenner and Sachs 2002, 2003, Brenner et at 2001). Based on considerable radio-biology research completed since the issuance of BEIR VI (1999), primarily sponsored by the United States (US) Department of Energy Low Dose Research Program, we here in Part I, of a three part study, examine the potential influence of the Bystander Effect on human lung cancer risks from radon. In a separate Part II (Leonard et al. 2010a), we then pose a similar question, “What if the human lung tissue is responsive to both the deleterious Bystander Effect and also a beneficial Adaptive Response radio-protection with respect to human lung cancer risk from radon?”. In Part III, we apply the results of the Part I Bystander Effect analysis and the Part II combined Adaptive Response and Bystander Effect analysis to the case-control studies of Odds Ratio Radon Induced Relative Lung Cancer Risks in North America (9 studies), Europe (13 studies) and China (1 study). In this Part I, we are able to show that the alpha particle traversal dose response for transformation frequency and chromosome aberration cell damage is independent of cell species and LET in the LET range for radon progeny alpha particles. In the radon concentration levels to which humans are exposed in the domestic and workplace environment, the carcinogenic producing lung tissue cellular damage from the alpha particles is predominantly from Bystander Effect chromosome damage. Thus, a representative Bystander Effect dose response shape is obtained for radon exposure at domestic levels and it is premised that the lung cancer risk dose response, depicted in Figure 3-2 of BEIR VI (1999), should not be linear but concave downward from Bystander Effect cell damage. In Part III of this work we show that analysis of sub-sets of the case-control radon pooled lung cancer risk data of Krewski et al. (2006) and Darby et al. (2006) reflect this concave downward dose response behavior and in some instances show that human exposure to increased radon concentrations suggests a protection against lung cancer incidence.
1.1 The Linear No-Threshold Hypothesis as the Conventional Model for Human Dose Response to Ionizing Radiations
Soon after the perfection of the X-ray machine by Wilhelm Roentgen and the isolation of the naturally radioactive element Radium by Marie and Pierre Curie, it was realized that ionizing radiation can cause solid malignant tumors. It was also found that these sources of radiation can, in some instances, provide a cure for solid tumor cancers by the radiations cell killing properties. England, France and Sweden became the early leaders in radio-therapy cancer treatment. Due to radiations harmful aspects, various radiation related agencies were established, and still exist, to recommend and set exposure limit standards [i.e. the International Commission on Radiological Protection (ICRP) and the United States (US) National Council on Radiation Protection and Measurements (NCRP)] and to formulate radiation quantities, units and measurement standards [i.e. the International Commission on Radiation Units and Measurements (ICRU)]. As more was learned about radiation effects, the recommended exposure limits were, for some period of time, in a state of steady reduction. In the US, first the Atomic Energy Commission regulated occupation exposures and now the Nuclear Regulatory Commission sets the exposure dose equivalent limits for nuclear workers at 5 mSv (1 mSv = 1 milli-Severt = 1 Rem) per annum. Primarily from radiobiology studies and the use of radiation in cancer therapy, it was early hypothesized that the deleterious effects of ionizing radiations varied linearly with tissue dose. This linear hypothesis has been re-inforced into a Linear No-Threshold hypothesis (LNT), based primarily on the study of the thousands of radiation exposed human cohorts from the 1945 Japanese A-bomb events. As Figure 1A, we provide the most recent linear assessment of the Excess Relative Risk (ERR) of Human Solid Cancer Dose Response (Preston et al. 2007) based on updated Japanese A-bomb survivor data compiled by the specially formed Radiation Effects Research Foundation (RERF). This premise of linearity prevails in almost every study of human dose response to ionizing radiations such as the recent study of the human radiation risks encompassing radiation workers in 15 countries (Cardis et al. 2007). We show their Excess Relative Risk data as Figure 1B. During the past 3 decades the US National Academy of Sciences (NAS) National Research Council (NRC) has been evaluating the risks to human health following exposure to ionizing radiation. A series of reports have been issued on biological effects of ionizing radiation beginning with the BEAR I report (BEAR I 1956). Subsequent NAS assessments by committees on the Biological Effects of Ionizing Radiations have been issued as BEIR III (1980), BEIR V (1990) and BEIR VII (2006) including all ionizing radiation sources, each supporting the LNT hypothesis.

Application of linear dose response modeling. Panel A – Latest evaluation of radiation risks based on the RERF study of Japanese A-bomb survivors. Excess relative risk of human solid cancers. Reproduced from Preston et al. (2007) with permission. The thick solid line is the fitted linear gender-averaged Excess Relative Risk, the thick dashed line is a nonparametric smoothed category-specific estimate and the upper and lower dashed lines are the standard errors. Panel B – Excessive relative risk from 15 country study of nuclear workers for all cancers excluding leukemia; all cancers excluding leukemia, lung and pleural cancers; and leukemia excluding chronic lymphocytic leukemia. Reproduced from Cardis et al. (2007) with permission. The solid squares are for all cancers excluding leukemia, the solid diamonds are for all cancers excluding leukemia, lung and pleura and the solid circles are for leukemia excluding chronic lymphocytic leukemia (CCL). The solid line is the ERR best linear fit for all cancers excluding leukemia with slope 0.97 ERR/Sv. Panel C – Summary of relative risks from meta-analysis of indoor-radon studies and from pooled analysis of underground miner studies. The solid squares are data from indoor case-control studies and the open squares are the data from underground miners studies. The thick solid line is the log-linear fit to the indoor data with slope of about 0.0020 ERR/Bq m−3 of radon. Reproduced from BEIR VI (1999) with permission.
1.2 Dose Response for Human Lung Cancer Risks from Radon and its Progeny
It became apparent from the high lung cancer incident rate for underground miners observed in the 1950s and 1960s, that alpha particle emissions to the lung from high levels of radon and its progeny was inducing the lung cancers. Both the US National Academy of Sciences National Research Council and the Environmental Protection Agency (EPA) have evaluated the lung cancer risks from radon. NAS has issued two reports on human health risks for radon and radon progeny exposures also specifying a linearity in dose response, as BEIR IV (1988) and BEIR VI (1999). They also have issued a dosimetry analysis of radon dose response of the underground miners and humans at domestic radon levels (NRC 1991). The recent EPA (2003) report basically is in agreement with the BEIR VI (1999) report findings but provides a higher estimate for annual deaths from radon induced lung cancers. Figure 1C provides the summary of Relative Risks (RR) from Figure 3-2 of the BEIR VI (1999) report. The BEIR VI committee stated that “the choice was to use a linear relationship between risk and low doses of radon progeny without a threshold. The choice was based primarily on considerations related to the stochastic nature of the energy deposition by alpha particles; at low doses, a decrease in dose simply results in a decrease in the number of cells subjected to the same insult. That observation, combined with the evidence that a single alpha particle can cause substantial permanent damage to a cell and that most cancers are of monoclonal origin, provides the mechanistic basis of the use of a linear model at low doses. In addition, as discussed in the report, exposure-response relationships estimated from the observational data in miners with low exposures, and from the case-control studies of indoor radon, are consistent with linearity.” The tendency for assumption of linearity has prevailed in the most recent case-control studies and two recent European (Darby et al. 2005, 2006) and North American (Krewski et al. 2005, 2006) pooled studies. We show their linearized dose response estimates as Figures 2A and 2B.

Linear fits of individual studies in two pooled case-control radon studies. Panel A – Radon relative risks for 13 pooled European case-control studies. From Darby et al. (2005, 2006) with permission. Panel B – Radon relative risks for 8 pooled North American case-control studies. From Krewski et al. (2005, 2006) with permission.
Some prior low LET, alpha particle and radon alpha dose response and “hit” probability data based on biodosimetry studies of organs and systems are cited in BEIR VI (1999). Jostes et al. (1993), using the single-cell gel technique, measured cell “hit” probabilities for Chinese hamster and AL cells from unirradiated, and x-ray and radon alpha exposures showing a Poisson distributed “hit” probability. Brooks et al. (1994) measured the effectiveness of radon with respect to 60Co radiations for the induction of micronuclei in rat lung fibroblast (RLF) and Chinese ovary cells in both in vitro and in vivo (live male Wistar rats). Linear dose responses were estimated. For both in vitro and in vivo, a Relative Biological Effectiveness of 10.6 ± 1.0 was obtained between radon and 60Co in rat lung fibroblasts. In one of the first reported microbeam alpha particle irradiations, Nelson et al. (1996) reported use of the Pacific Northwest Laboratories microbeam facility to irradiate CHO-K1 cells to specific numbers of 3.2 MeV alpha particles. It was found that single alpha particle cell traversals produce micronuclei. The dose response was estimated to be linear for a range from single traversals to five traversals. Significant was the observation that with increased numbers of alpha particles there was a decrease in the ratio of binucleated to mononucleated cells of 3.5% per hit, suggesting that alpha particles induced dose-dependent, adaptive response type protective, mitotic delay. Mitchel et al. (1999, 2002, 2003, Mitchel 2006, 2007a, 2007b, 2008) have shown adaptive response type protection for a number of organs and systems. These will be discussed in Part II and Part III (Leonard et al. 2010a, 2010b). Directly related to dose response of the respiratory tract to radon and progeny alpha particles is the work of Brooks et al. (1997) where they applied biological dosimetry. In vivo biodosimetry were applied to male Wastar rats exposure to deep lung epithelial cells, deep lung fibroblasts, tracheal epithelial cells and nasal epithelial cells. The relative micronuclei radio-sensitivities were determined and the micronuclei dose responses were estimated to be linear.
1.3 New Evidence of Non-Linear Human Dose Response Since BEIR VI (1999)
In general, the entire concept of the Linear No-Threshold hypothesis has recently been put into question by a number of significant radiobiology studies. At the 2008 annual meeting of NCRP, the results of an international survey of scientists world-wide was reported (Jenkins-Smith et al. 2008) where 70% of those polled believed that the Linear No-Threshold concept should be modified to express possible non-linearity at the very low doses to which humans are nominally exposed. The Health Physics Society has issued a policy statement to the effect that exposures below 50 mSv per year should be considered irrelevant to human health risks (HPS 2004). The French National Academy of Science has issued guidelines for the French nuclear industry stating that human response to low level radiation exposure should be expected to be non-linear (Tubiana et al. 2005, 2006, 2007). Even BEIR VII (2006) cites the two independent measurements of dose response of human lymphocytes from X-rays (Lloyd et al. 1988, Pohl-Ruling et al. 1992) as only conclusively becoming linear above 20 mGy (see Figure 2-5, BEIR VII 2006).
A 10 year, $220 million US Department of Energy (DOE) Low Dose Radiation Research Program was initiated in 2000 to study the various dose response mechanisms that exist at low doses. Primary mechanisms that have been studied are the potentially deleterious Bystander Effect (BE), the potentially beneficial Adaptive Response (AR) effect, the combined low dose hyper-radiosensitivity (HRS) and high dose induced radio-resistance (IRR) as HRS/IRR, the low LET “inverse” dose rate effect (IDRE), the high LET (alpha particle induced) underground miners “inverse” dose rate effect, genomic instability and apoptosis. In particular, the effect of genomic instability in progeny of irradiated cells is not well understood at present. Morgan (2003a, 2003b) provides assessment of how genomic instability could be a major factor in radiation induced carcinogenesis. Morgan (2006) however suggests that the bystander effect and adaptive response will play the major roles in the future shape of the dose response curve for ionizing radiations. As of December 2008, the DOE Low Dose Radiation Research Program cites 241 and 230 journal papers on adaptive response and bystander effects, respectively, published since BEIR VI (1999) was issued.
Using microbeam single cell alpha particle exposures, primarily from the Radiological Research Accelerator Facility at Columbia University (Randers-Pehrson et al. 2001), the Tandem Van de Graaff Accelerator at Brookhaven National laboratory (Miller et al. 1995) and the Gray Laboratory (Folkard et al. 1997) microbeam facilities, the bystander effect for alpha particles has been conclusively confirmed (Miller et al. 1995, 1999, Zhou et al. 2001, 2003, 2004, Nagasawa and Little 1999, 2002, Hei et al. 1999, Sawant et al. 2001a, 2001b) for a number of cell species. It has also been shown, with a Microdose Model, that single radiation induced low LET charged particle traversals through the cell nucleus provides the Poisson distributed activation of adaptive response protection (Leonard 2000, 2005, 2007a, 2007b, 2008a, 2008b, Leonard and Leonard 2008). This conclusion is based on the microdose analysis of a number of low LET dose response studies (Azzam et al. 1996, Elmore et al. 2006, 2008, Ko et al. 2004, Redpath et al. 2001, 2003, Redpath and Antoniono 1998, Shadley and Wiencke 1989, Shadley and Wolff 1987, Shadley et al. 1987, Wiencke et al. 1986, Wolff et al. 1989, 1991). We shall here, in the Results Section, present the most recent microbeam and broadbeam alpha particle bystander data. In the later sections, we will examine how the new experimental data and modeling methods developed since BEIR VI (1999) may provide a more cognizant estimate of human lung cancer risks from radon progeny considering the new evidence relative to the bystander effect and adaptive response radio-protection.
2. MATERIALS AND METHODS
2.1 Distinction Between Adaptive Response and the Bystander Effect
To evaluate the potential effects of BE and AR at the microdose level, it is first appropriate to explicitly define bystander effect and adaptive response for the benefit of our analysis in the following sections and Parts II and III. For consistency, we here repeat our earlier description of BE and AR (Leonard 2008a, 2008b). Relative to the Bystander and Adaptive Response effects, distinction entails the examination of the basic definitions of the BE and AR at the microdosimetry level (ICRU 1983). Eric Hall, a very early contributor to Bystander Effects research with his group at Columbia University, recently defined (Hall 2003) the Bystander Effect as “the induction of biological effects in cells that are not directly traversed by a charged particle, but are in the close proximity to cells that are.” Morgan (2006) provided a similar conventional definition of the Bystander Effect behavior as “those effects occurring in cells that were not hit i.e., traversed by an ionizing particle, but were neighbors of cells that were irradiated”. Investigations have encompassed both deleterious and beneficial results in un-hit cells as Bystander Effects.
Adaptive Response, to many, has meant the reduction in the biological effects of large doses of ionizing radiation by activation of cellular protective mechanisms with the prior exposure to low doses of radiation. The prior low dose is usually called the “primer” dose and the subsequent large dose the “challenge” dose. However, recent work has shown the priming dose can also result in a reduction of endogenic spontaneous, naturally occurring, potentially carcinogenic cellular damage. Azzam et al. (1996), Redpath et al. (2001) and others have logically considered the spontaneous damage priming dose protection also as Adaptive Response. The AR protection seen in endogenic spontaneously occurring damage of course has far greater human radiation risks implications. In general, the Adaptive Response term currently applies to the protective effects in cells directly hit by the priming radiations. Deleterious damage to cells directly hit has conventionally been called Direct Damage. To get more specific, the fundamental question then becomes, “When does charged particle traversals become classified as protective Bystander?”. We would first say that any charged particle traversal to any part of a cell, including the cytoplasm and the nucleus, causing a beneficial effect on that specific cell would be considered Adaptive Response. Then what would we call a biological effect to a cell from a traversal through the adjacent intracellular medium? The medium transfer studies of Mothersill and Seymour (1997) is currently considered a Bystander Effect. In a separate joint paper, Mothersill and Seymour (2005) point out that the bystander effect could offer beneficial as well as deleterious influences. For low LET radiations, it has been shown that human HeLa x skin cells exhibit a protective bystander transformation frequency suppression from exposure to low LET 28 kVp mammogram and 60 kVp diagnostic X-rays (Leonard and Leonard 2008, Redpath et al. 2003, Ko et al. 2004). Hooker et al. (2004) have shown that for inversions in pKZ1 mice spleen in vivo that an adaptive response protection is afforded when only a small number of cells are hit, which can be interpreted as a bystander protection based on the above conventional definition of the Bystander Effect. The supernatant transfer experiment of Iyer and Lehnert (2002) for alpha particle exposure has been interpreted as a protective Bystander Effect although one can as easily interpret the results as Adaptive Response protection of alpha particle damage by priming doses to the supernatant medium. Technically, however, since the intercellular medium was irradiated and not the cell itself, the effect must be considered a bystander effect.
2.2 The Brenner et al. (2001) BaD Model for Bystander Effect Dose Response Behavior
In the following sections we will provide the bystander BaD Model of Brenner et al. (2001) which will then be used with empirical modifications, in the Results Section, to analyze both microbeam and broadbeam data involving only alpha particle irradiations which would be expected to be absent of any adaptive response influences since AR is found to be primarily induced by low LET radiations.
2.2.a Emperically Modified BaD Model Analysis of Alpha Particle Studies Relative to Radon Progeny Dose Response in Humans
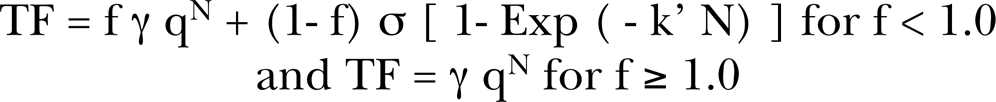
As mentioned above, there have been a number of studies of the dose response from both microbeam and broadbeam exposures of human tissue to alpha particles (Miller et al. 1995, 1999, Zhou et al. 2001, Nagasawa and Little 1999, 2002, Hei et al. 1999, Sawant et al. 2001a, 2001b). In the Results Section, we present detailed analysis of these data for the purpose of identifying explicit characteristics of alpha particle induced, potentially carcinogenic, cellular damage as they impact on the human health risks from radon. It has been an a priori assumption that both Bystander Damage and Direct Damage from radon and progeny alpha particles cause human lung cancers. To adequately anticipate human risk, there is the need for evaluating broadbeam in vivo exposure responses (a whole body exposure as received by a nuclear worker would be considered “broadbeam”) experienced by human exposures by extrapolation from the microbeam in vitro data. Brenner et al. (2001) – (see their Figure 3a) – have made a direct comparison of the bystander effect between single-cell microbeam and broadbeam cell population exposures in vitro. Fundamentally, there is a distinction between microbeam and broadbeam exposures. For microbeam in vitro exposures, exact numbers of alpha particles are injected into the cell population, one cell at a time. Then if all the cell population has received at least one microbeam alpha injection, there is no chance of Bystander Effect damage. For broadbeam in vitro or in vivo exposures, the alpha particle traversals are Poisson distributed such that there is a distribution of alpha particle traversals around a Poisson distributed mean number of traversals. Thus, some cells may have zero alpha traversals (and thus subject to Bystander Effect cell damage alone) and some cells with traversals much greater than the mean based on Poisson statistics. Brenner et al. (2001) have thus modeled the dose response behavior for the bystander effect for both single-particle (microbeam) in vitro and what may be predicted for Poisson distributed particle broadbeam exposures in vivo and in vitro laboratory exposures. From Equation (9) of Brenner et al. (2001), we provide the BaD Model equation for microbeam exposures given, for transformation frequency TF, by

Illustration of the bystander BaD Model showing bystander and direct cellular damage (Brenner et al. 2001).

f is the fraction of cells hit by microbeam alpha particles, N is the exact number of hits per cell, q is the probability of a cell surviving a single alpha particle traversal of its nucleus, γ then is the direct damage production rate of oncogenic transformations per surviving cell that has experienced an alpha particle traversal. σ = the fraction of cells that are hypersensitive to oncogenic transformation (or prevention of transformations for protective bystander mechanisms, in which case use of a negative σ would be required, but not to imply a negative population of cells only that the hypersensitivity produces a negative response which could be for example from the reduction of natural, spontaneous damage). F(N) is the bystander killing term. In the case of the Sawant et al. (2001a, 2001b) exposures represented by Equation (9) of Brenner et al. (2001), f = 0.1 or 1 in 10 cells. There is no term for the spontaneous transformation frequency in the present microbeam BaD Model or the broadbeam BaD model given below. Little and Wakeford (2001) added a constant spontaneous term in their examination of radon induced lung cancer [see their Equation (4)]. A simplified version for the Brenner et al. (2001) broadbeam, BaD Model [see their Equation (13)], relation is

As Figure 3, we provide a reproduction of their Figure 4 illustration of the broadbeam BaD bystander model given by Equation (2) for broadbeam exposures. Page 259 of Hall (2000) provides a description of the methods for transformation frequency analysis. Brenner et al. (2001) define γ q as the slope of the direct damage dose response for oncogenic transformation for a Poisson distributed mean number of alpha particle traversals <N> and thus is the direct damage oncogenic transformation production rate per mean alpha particle traversal, In Equation (2), <N> is the Poisson distributed mean number of alpha particle nucleus traversals, by the bystander signal and k is the number of the unirradiated neighbor cells that receive a bystander responsive signal (Brenner et al. 2001). The first term in Equations (1) and (2) is the linear direct damage term as shown in Figure 3. As noted by Brenner et al. (2001), since <N> is proportional to dose [in our composite model (Leonard 2008a), which was applied to in vitro broadbeam exposures, we have included both linear and quadratic direct damage although at low doses the behavior is primarily linear], this corresponds to the α D linear term in the conventional linear-quadratic dose response equation (Kellerer and Rossi 1972). The second term in Equations (1) and (2) is the bystander damage contribution to the transformation frequency. Brenner et al. (2001) proposes that the bystander effect is as a result of a small population of hypersensitive bystander receptor cells such that the [exp (− q <N>)] “Depletion” transition function in Equation (2) characterizes the depletion of these hypersensitive cells by inactivation by hits from the direct damage. The [1- exp (− k <N>)] “Hit probability” transition function provides the probability that at least one cell is directly hit where, as noted, k is the number of unirradiated neighbor cells receiving the bystander signal. In Figure 3A, we show how these two functions behave with increased dose (and alpha charged particle track traversals) and combine as the product [1- exp (− k <N>)] [exp (− q <N>)] to facilitate the total Bystander Damage component of broadbeam BaD Model. As noted above, this broadbeam BaD Model Equation (2) has been applied to high LET radon dose response (Little and Wakeford 2001, Brenner et al. 2001, Little 2004, Brenner and Sachs 2002). In earlier work, we have used the empirically modified BaD Model to examine bystander behavior for the broadbeam alpha particle data of Miller et al. (1999) and Nagasawa and Little (1999) [see Figure 7a and 7b, Leonard (2007a)] In section 3.1.b below, we show the analysis of the microbeam human-hamster hybrid (CHO K1) exposure data of Hei et al. (1999) and Zhou et al. (2001) for low exposures (hits) of 5, 10, 20 and 100% (as well as 1, 2, 4 and 8 exact hits to 100%) of the cell populations. Other work has shown that the range of the bystander signal in tissue is approximately 210 μm (Leonard 2009, Belyakov et al. 2005) and the diameter of CHO cells approximately 12,5 μm (Jostes et al. 1993) such that, for those percentages, Equation (2) may be used to compare the Hei et al. (1999) and Zhou et al. (2001) data in Section 3.1.b with the Nagasawa and Little (1999) data in Section 3.1.c as far as Bystander and Direct Damage response. Further, we have noted above that in the Poisson distributed broadbeam exposures, the Poisson distribution will predict a finite number of cells in any population that receives no alpha traversals. This is why the depletion function is exponential in behavior in Equation (2), accounting for the “residual” non-hit cells for greater than a mean cell hits of unity i.e. <N> ≥ 1.0. Here as was true for others (Little and Wakeford 2001, Brenner et al. 2001, Little 2004, Brenner and Sachs 2002) we have used the cell nucleus as the sensitive volume. The mean number of nucleus traversals can be approximated by the division of the tissue absorbed dose in cGy by the specific energy deposited per nucleus traversal (hits per cGy), <z1> (assuming a contiguous cell population) [see Equation (4) Section 2.3.b].
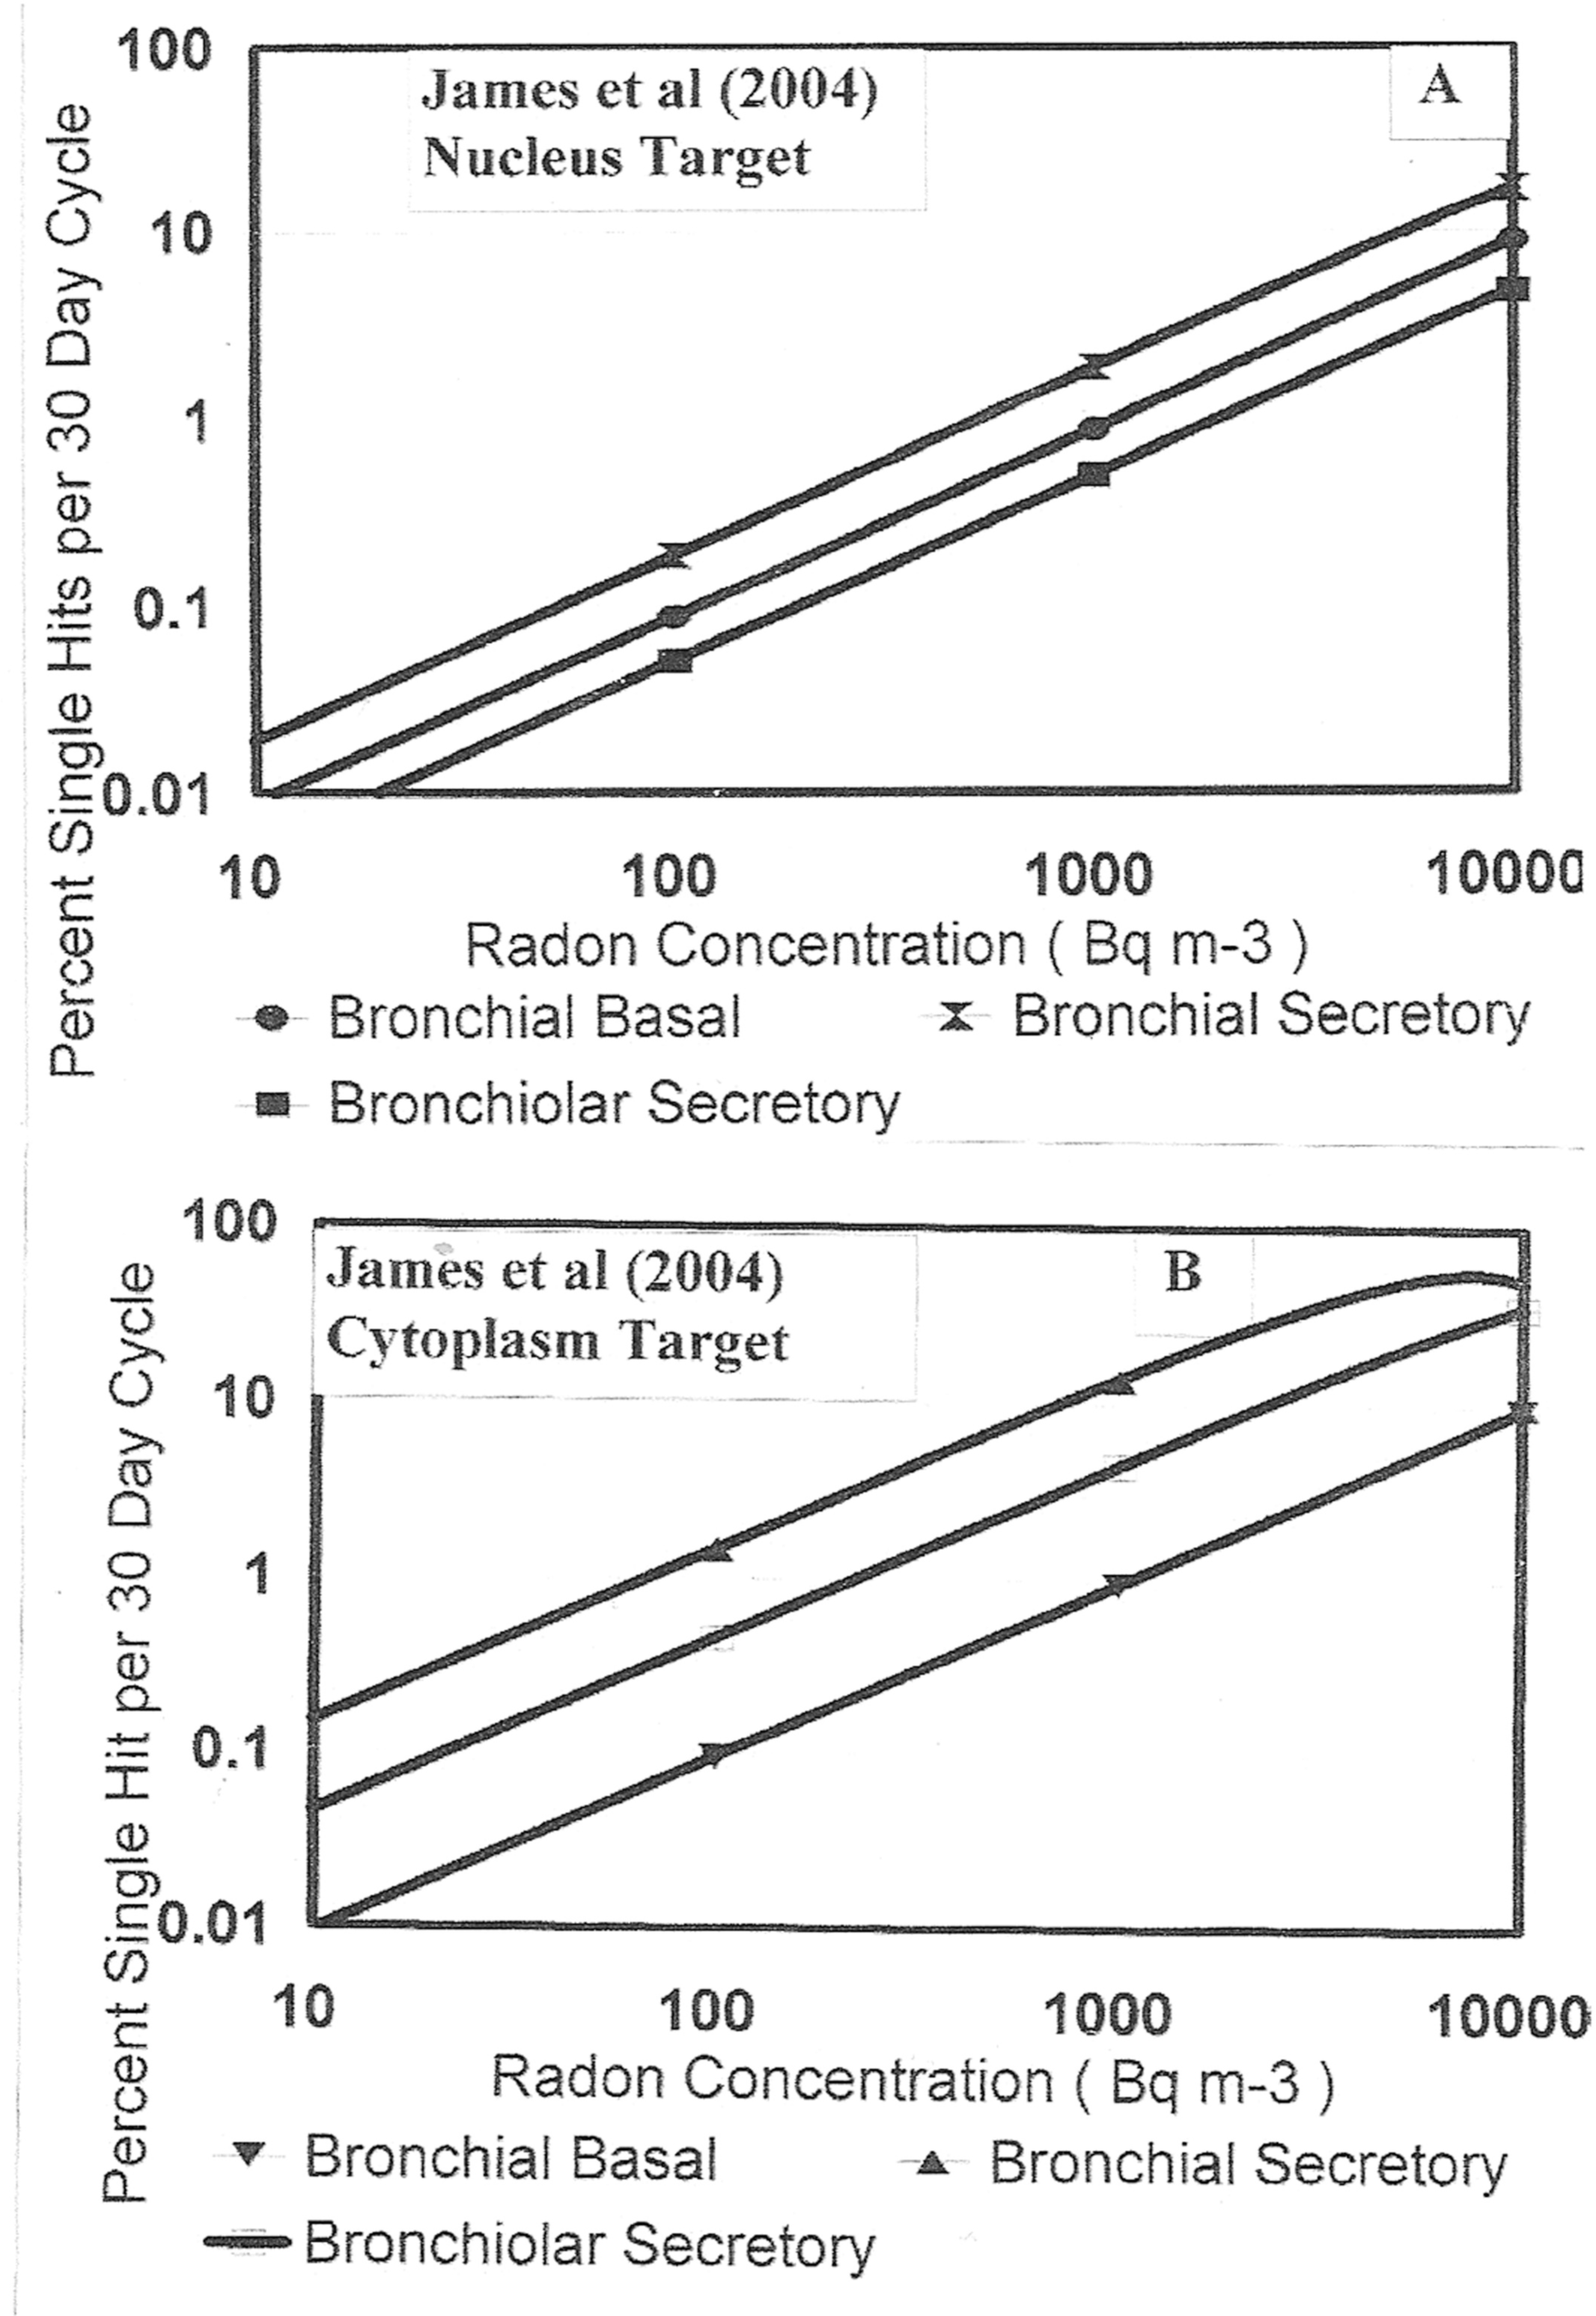
The James et al. (2004) radon alpha particle hit probabilities during the 30 day mitotic cycle for human lung cells. Panel A – bronchial basal and secretory and bronchiolar secretory with cell nucleus as target. Panel B – Same as Panel A, but for cell cytoplasm as target.
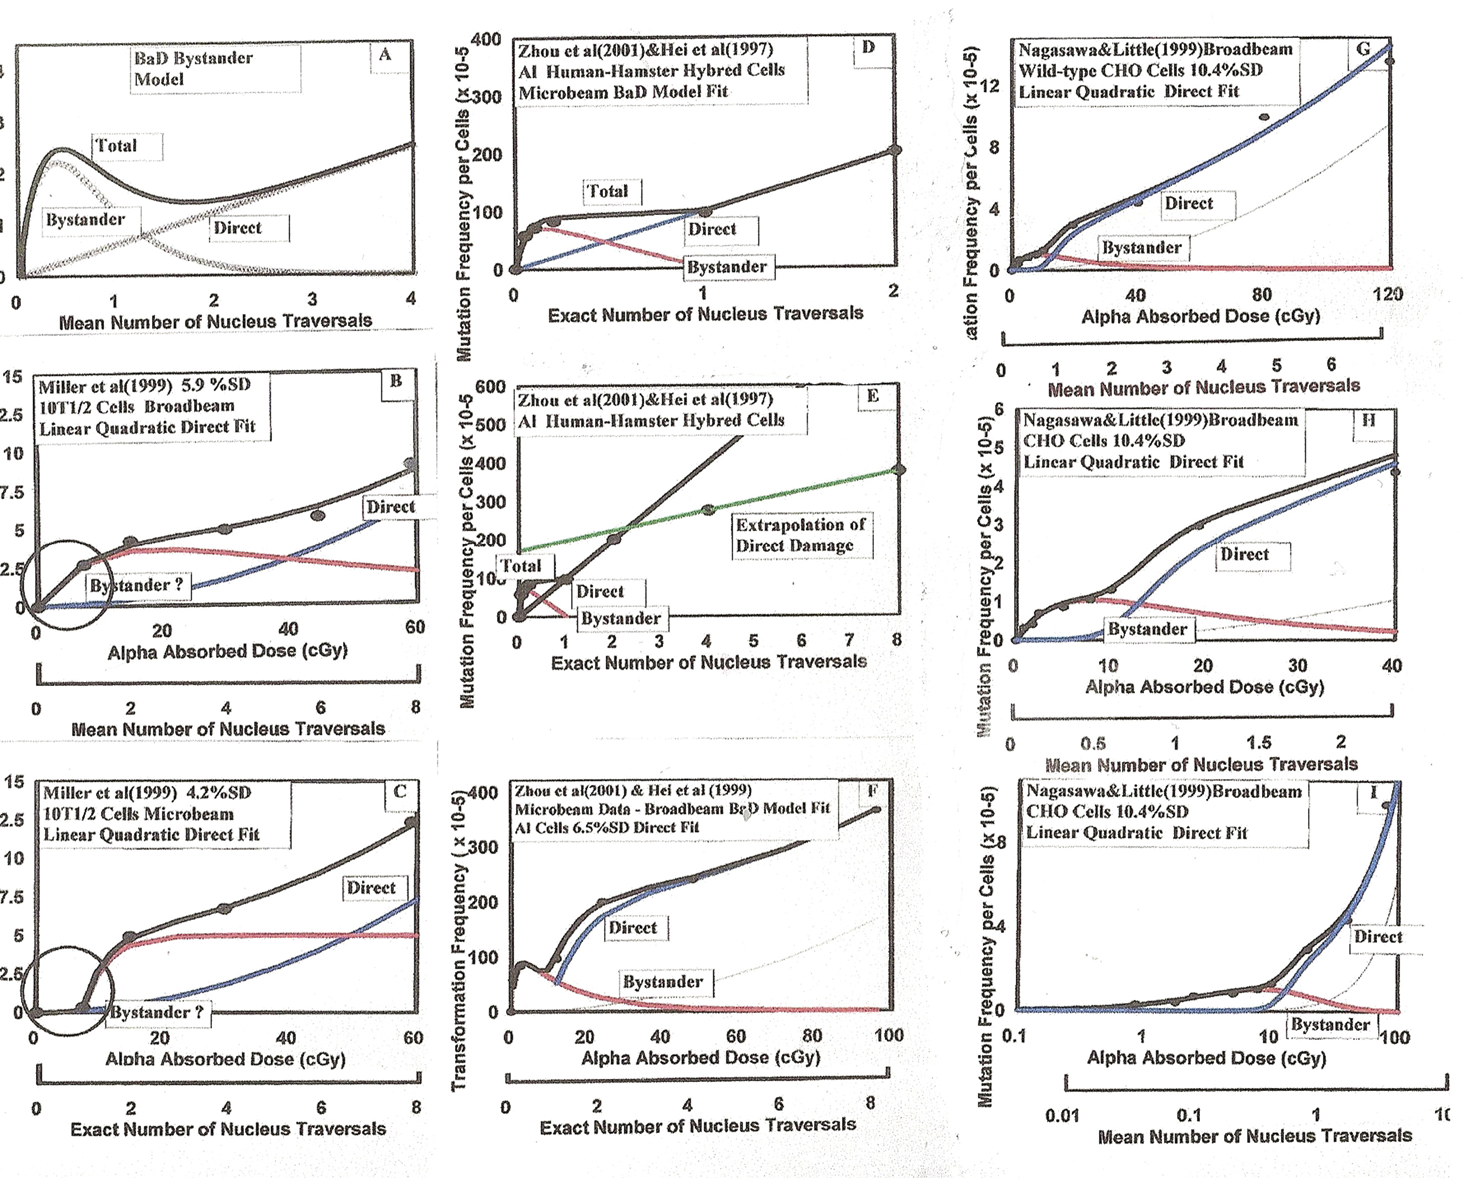
The modified BaD Model best fit to the alpha particle microbeam and broadbeam exposure data of Miller et al. (1999), Zhou et al. (2001), Hei et al. (1999) and Nagasawa and Little (1999, 2003). Described in Sections 3.1.a, 3.1.b and 3.1.c. Best fit parameter values are given in Table 1.
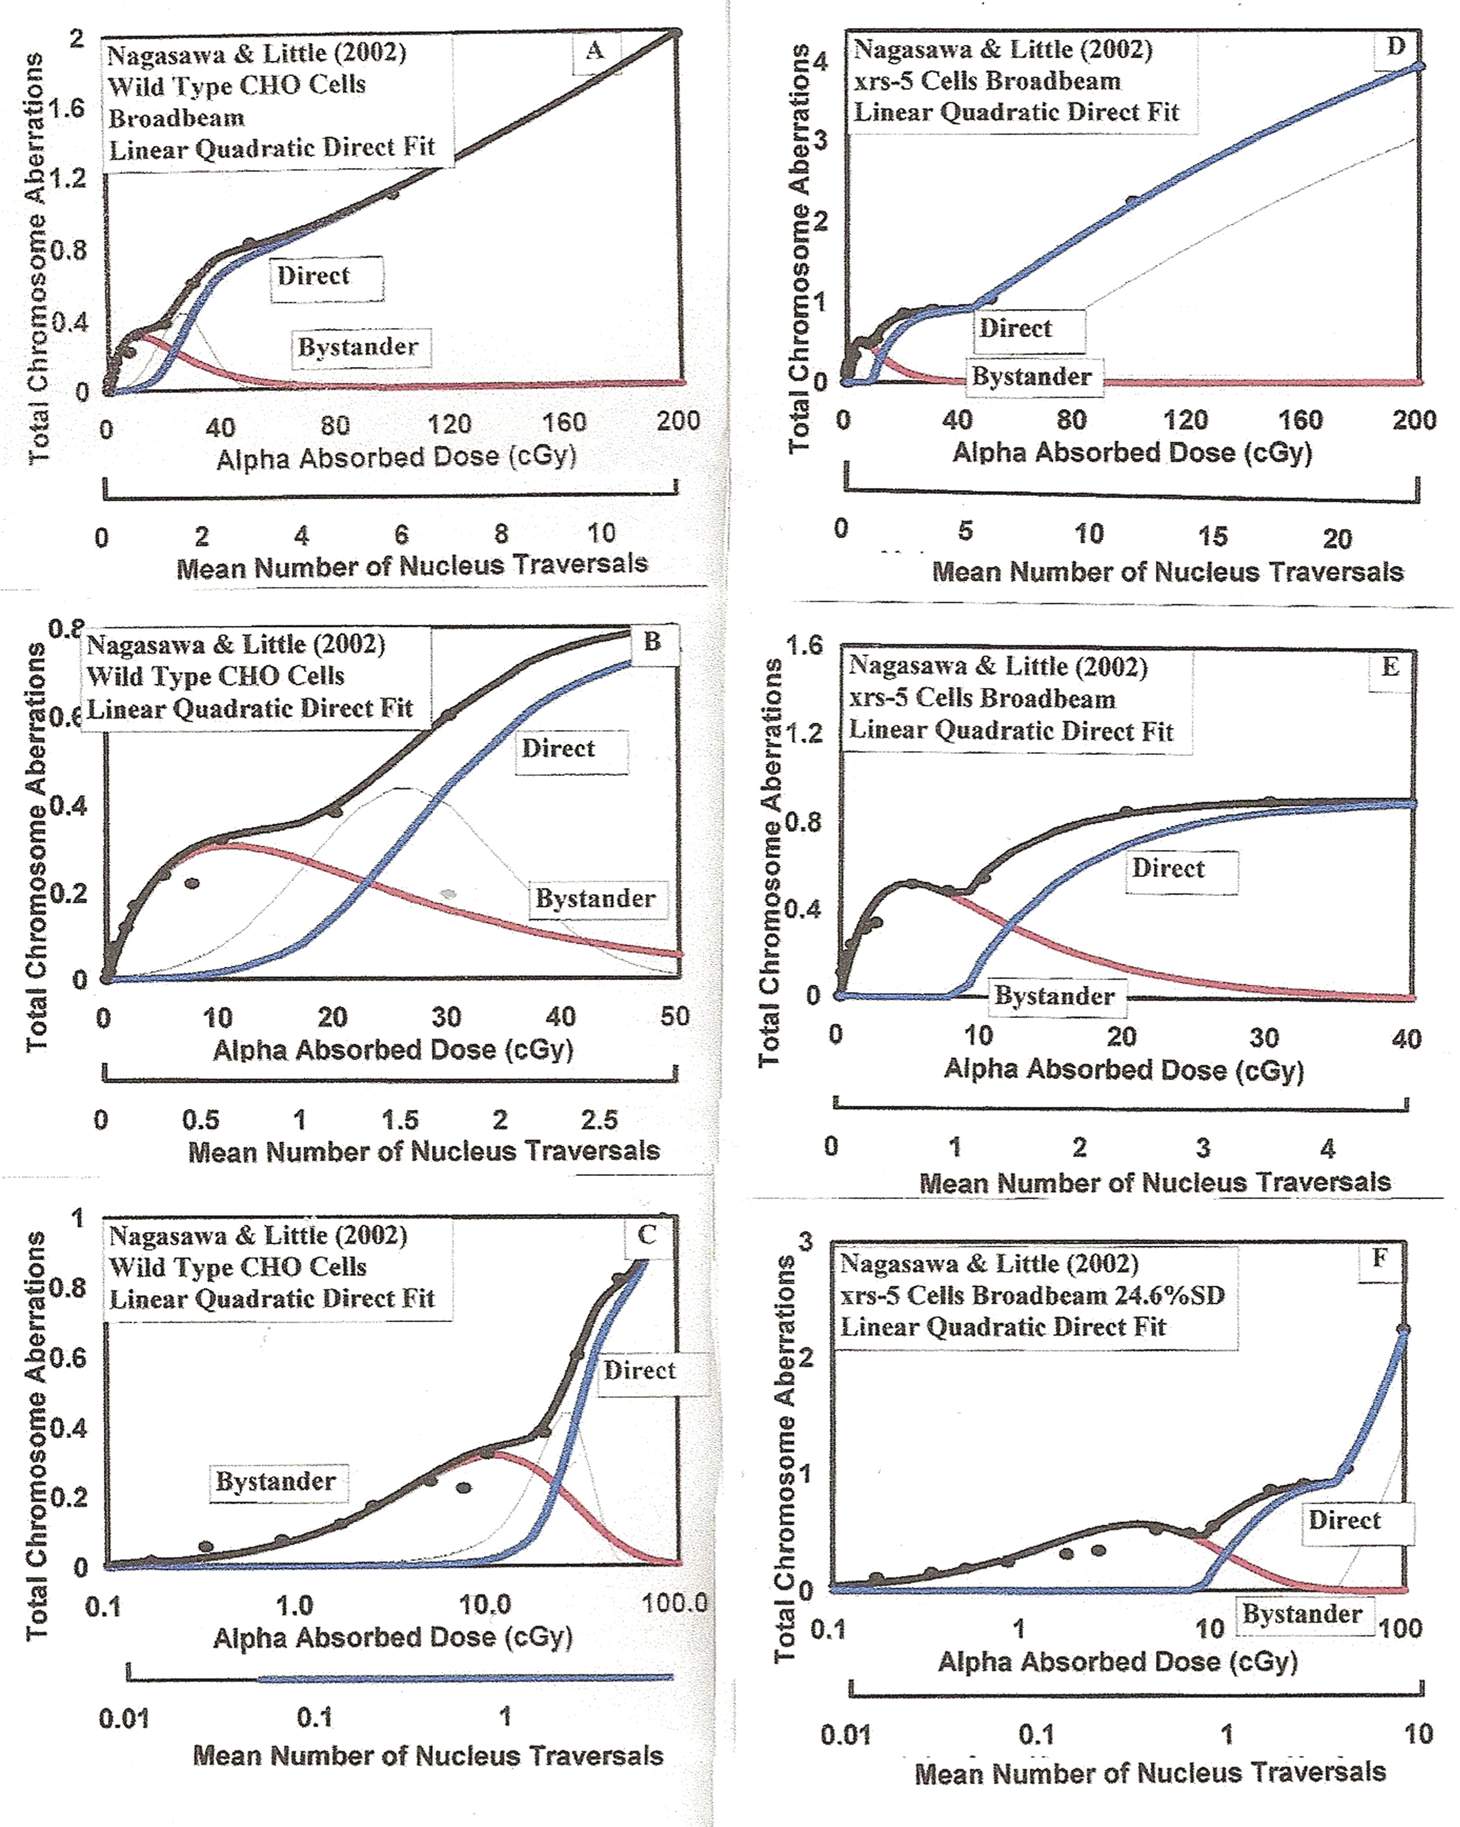
The modified BaD Model best fit to the Nagasawa and Little (2002) chromosome aberration data for exposure of wild-type CHO and repair deficient xxr-5 cells to 3.7 MeV alphas. Experiments are described in Section 3.1.d and best fit parameters are given in Table.
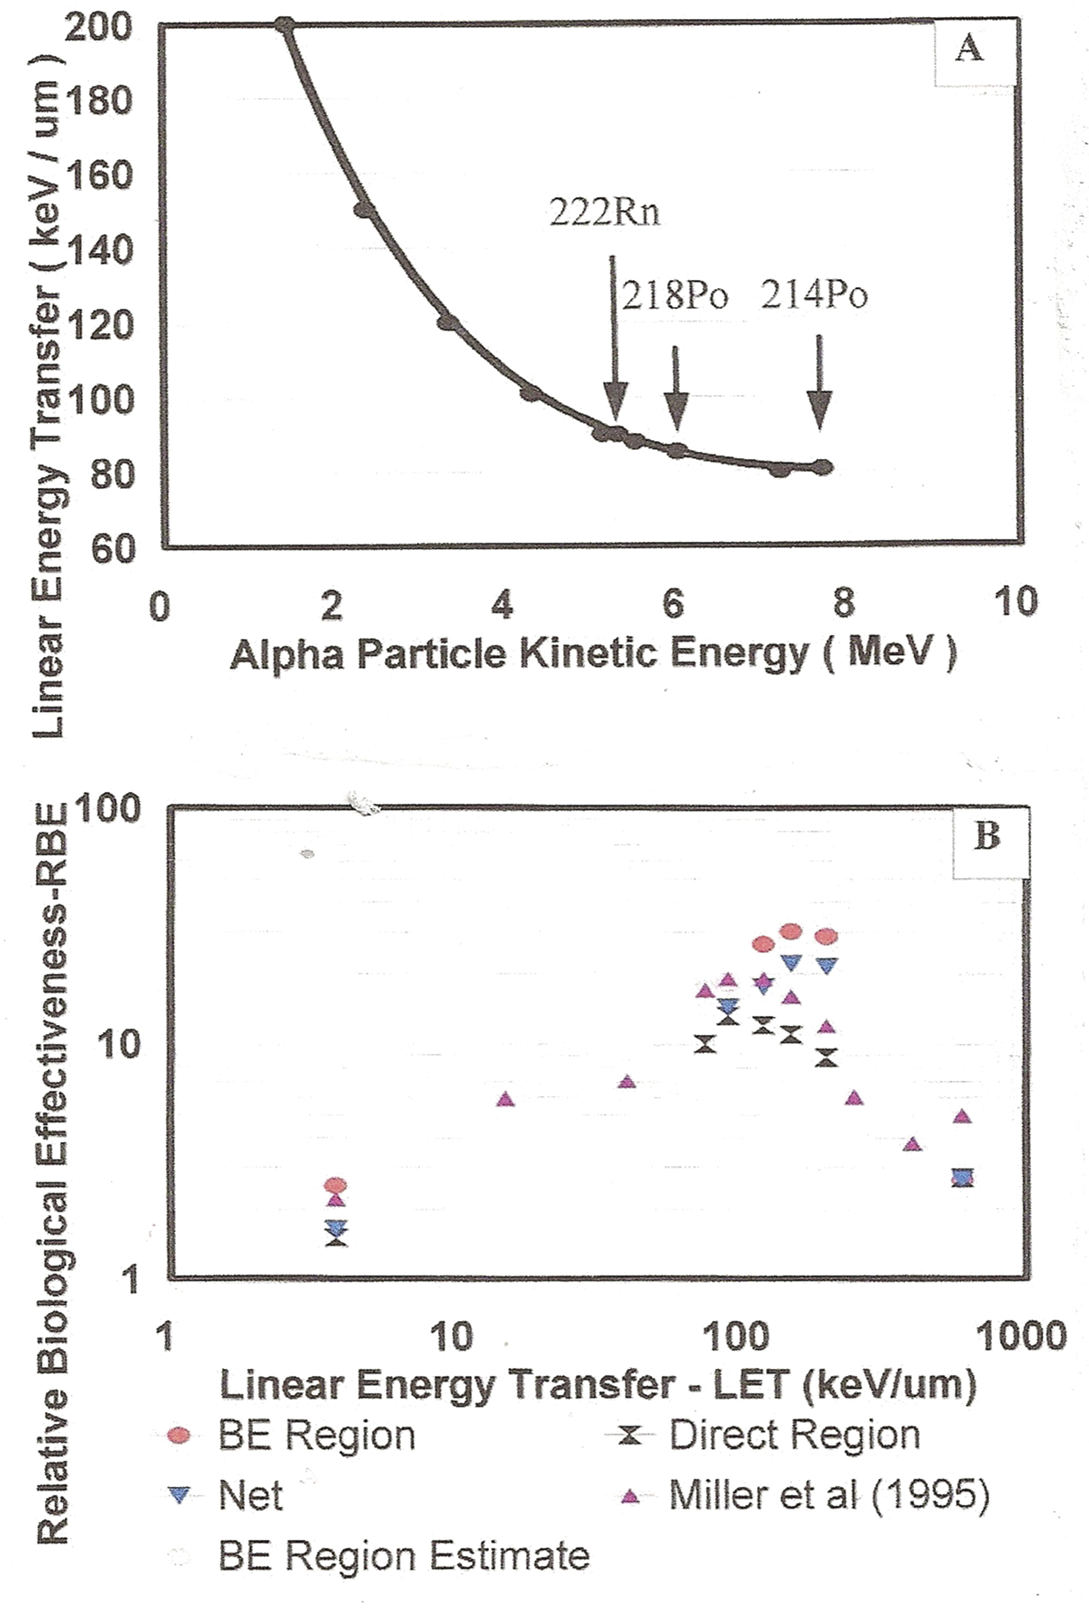
Alpha particle energies, LETs and RBE. Panel A – The variation in LET as a function of alpha particle kinetic energy. Shown are the value for 222Rn, 218Po and 214Po radon and progeny alphas. Panel B – In analyzing the Miller et al. (1995) 10T1/2 cell dose response data for a range of LETs, it is found due to the two distinct dose response regions i.e. Bystander and Direct Damage Regions, there are hence two distinct RBE values for the alpha particles relative to low LET radiation (see Figure 8 for two averages marked in red and green). Shown are the average RBEs in the BE Region and the Direct Damage Region along with Miller et al. (1995) net RBE values. The data is discussed in Sections 3.1.e and 4.1.c.
In the special case for microbeam exposures where fractions, f, of the cell population are injected with equal number of alpha particles, we can write the microbeam Equation (1) as
We see that the second, bystander term becomes zero when 100% of cells are hit based on the premise by Brenner et al. (2001) that a directly hit cell becomes insensitive to the bystander effect. Figure 3B illustrates this case. Appendix A provides explicit definitions for the parameters for the empirically modified BaD Model.
2.3 The Human Lung Cells as “Targets” for High and Low LET Traversals and Subsequent Energy Depositions per Traversal
It is recognized that the traversal of radiation induced charged particles (hits) to exposed cells involves the microscopic statistical accumulation of these hits. In particular, Kellerer and Rossi (1972), Bond et al. (1985), Varma et al. (1981), ICRU Report 36 (ICRU 1983) and Rossi and Zaider (1996) have greatly contributed to the basic microdosimetry concepts of tissue micromass, a microdose, the stochastic specific energy deposition, z1, and the fluence derived non-stochastic quantity mean Specific Energy Deposition per Charged Particle Traversal (hit), <z1> used in our modeling here. We respectfully refer to the Leonard (2007a) sections “Energy depositions and activation of response events at very low doses at the microscopic level”, “A Poisson distributed accumulation threshold function” and Figure 1 of Leonard (2007a), (Regarding the Poisson function provides the distribution for “at least 1 hit”, “at least 2 hits”, “at least 3 hits”, etc.) in the Materials and Methods Section therein.
2.3.a The Size of the Human Lung Target Cells Susceptible to Carcinogenesis
Simmons and Richards (1988) provide the volume of the human lung cell to be 78 μm3 using an image analyzer. Obviously, since there are three human lung cell species that are known to be sensitive to radon induced lung cancer i.e. bronchial basal, bronchial secretory and Bronchiolar Secretory (BEIR VI 1999, NRC 1991), it is naive to suggest a single representative lung cell diameter for lung cancer studies. It is well known that even for a given cell species within a given tissue there is a wide variation in size. Others have found that these three human lung cell types each vary in size and hence present different target sizes for radiation microdose “Hits” from the radon progeny alpha particles and the low LET AR inducing radiations. Table 2-1 of BEIR VI (1999) shows that the bronchial secretory cells are much larger in diameter than the bronchial basal cells. Little and Wakeford (2001) used these data to estimate annual lung cell “Hit” rates per Bq m−3 of radon. Brenner and Sachs (2002) uses a cell cross-section area of 25 μm2 for the bronchial basal cell nucleus and notes that a radon concentration of 100 Bq m−3 produces 0.3 alpha particle traversals in 60 years of exposure. From these numbers, for our analysis we estimate the three cell diameters to be 9.0, 17.7 and 10.7 μm for the bronchial basal, bronchial secretory and the bronchiolar secretory cells, respectively. These are for flattened, spheroid shaped in vitro cell measurements. These are in agreement with the BEIR VI (1999) Table 2-1 data and the same data used by Little and Wakeford (2001). We use these diameters in Table A1, A2 and A3 of Part II to estimate the Specific Energy Deposition per Nucleus Traversals for the low LET radiations received by the lung from human exposures at the UNSCEAR (2000) world average low LET human exposure levels.
2.3.b Method for Determination of the Mean Specific Energy per Sensitive Volume Hit - <z1>
The amount of radiation energy deposited, on a microdose level, into the cells sensitive volume by a charged particle traversal is dependent on the dose-averaged linear energy transfer, LD (in units of keV / micrometer) and the mean chord length, ℓ (in units of μm), traversed through the sensitive volume. As was the case in the earlier works (Leonard 2005, 2007a, 2007b, 2008a, 2008b, Leonard and Leonard 2008) the sensitive volume here is chosen to be the nucleus for the three human lung cell species, based on the microbeam measurements by Miller et al. (1999) where it was found that the cytoplasm is insensitive to alpha particle traversals. Others have suggested that the cytoplasm is also sensitive to bystander responses (Shao et al. 2004, Wu et al. 1999). In all our AR Microdose Model examinations use of the nucleus has been found to provide the best fit of the model to the empirical data. BEIR VI (1999) and James et al. (2004) in their analysis with respect to alpha particle traversals consider the nucleus as the sensitive region for lung cancer induction. The dose-averaged LET of the radiation in tissue and chord length traversed provides the energy deposited into the sensitive volume per traversal (Hit). Absorbed dose is energy deposited per unit mass of tissue. Knowing the diameter of the sensitive volume, the volume and the mass, m(g), of the sensitive volume may be obtained using a mean cell density of 1.04 g cm−3 (Attix 1986). This provides the energy deposited per unit mass, E(keV g−1) = LD ℓ / m for a single charged particle track across the sensitive volume. With the energy to absorbed dose conversion factor (1.6022 × 10⁻¹¹ cGy g keV−1), we have <z1> = D(cGy per hit) = 1.6022 × 10⁻¹¹ (cGy g keV−1) × E(keV g−1 per hit). Thus,

Several investigators have examined the chord length problem (Kellerer 1984, Ellett and Braby 1972, Enns and Ehlers 1993). By considering the mean chord length per cell cross-section area, an analytical approximation for <z1> was offered by Kellerer and Rossi (1972) as a function of spherical critical volume diameter, d, and the dose-averaged linear energy transfer, LD, of the radiation, i.e.

where ρ = density of cell tissue (see Equation 4.2, Kellerer and Rossi 1972).
We estimate the accuracy in determining the cell nucleus diameters to be about ± 20 %SD, based on direct experience with microscope images and observed variation of cell size. The overall accuracy of <z1> is thus about ± 30 %SD due to uncertainties in LD also. The impact of this on the use of the model is addressed in Leonard (2008b).
2.3.c New Evidence About the Cellular Sensitive Volume and Alpha Particle Hit Rates for Human Lung Cancer Induction From Radon
A reassessment of the alpha particle dosimetry for the BEIR VI (1999) report has recently been provided by James et al. (2004). The important 30 day lung cell mitotic cycle single particle hit probabilities are given in their Table 12 (The three lung cell species that are known to be cancer sensitive are known to have approximately 30 day mitotic cycles.). The ICRP (1994) Report 66 reassessed values as given in James et al. (2004) Table 12 are 0.36, 1.4 and 0.51 hits per Basal, Bronchial Secretrory and Bronchiolar Secretory cells respectively per kBq m−3 of radon for cell nucleus hits and 1.0, 16, and 4.0 hits per Basal, Bronchial Secretrory and Bronchiolar Secretory cells respectively per kBq m−3 of radon for cell cytoplasm hits (entire cell as “target”). As Figure 4 herein, we have provided graphs of the variation in single alpha hit probabilities for the three primarily alpha induced cancer sensitive cells in the lung i.e. as indicated in the legend - the Bronchial Basal, the Bronchial Secretory and the Bronchiolar Secretory cells.
2.3.d The Emperically Modified BaD Model for Alpha Particle Nucleus Traversals and Dose Response Analysis
To examine the basic properties of broadbeam cellular dose response to alpha particles in the very low dose range, we must include the bystander and direct damage components encompassed by the Brenner et al. (2001) BaD Model. Thus, as a starting point in developing an analytical formulation for the dose response we begin with the BaD Model. Unlike the microbeam BaD Model equation which provides discrete response for intergers of exact numbers of traversals, the broadbeam BaD Model analytical equation provides a continuos function of broadbeam mean number of traversals, <N>, derived from the alpha particle exposure fluence and corresponding tissue absorbed dose, D. We showed in Section 2.3.b that D is energy deposited per unit mass of tissue in cGy. For individual cells exposed in vitro, Kellerer and Rossi (1972) showed that the amount of energy deposited is proportional to the area of the nucleus. Then the mean number of alpha nucleus traversals is given by

where <z1> is the specific energy deposition per nucleus traversal (hit), in mean cGy per traversal as defined above. As was the case for low LET charged particle traversals in our adaptive response analysis (Leonard 2007a, 2007b), the Poisson distributed mean number of traversals is a continuous function since dose is a continuous function. In Section 4.1.a, the introduction of the Normal Distribution function to fit the transition from bystander to direct damage experimental data for the mean traversals in that region is non-conventional, unlike the conventional approach where one models the dose-response finction using N as the independent variable, then averages the function over the microdose distribution to get a result applicable to broadbeam or radon exposures. We have used the results that have been derived for the broadbeam exposures and then modified these results with the empirical Normal Distribution function to fit the shape of the experimental response. The Normal Distribution function is a continuous function compatible with dose and mean number of traversals but, at present, with no biological meaning.
2.4.a Method - Alpha Particle Dose Response in the Absence of Low LET Adaptive Response Inducing Radiation
We use the emperically modified BaD Microdose Model to examine what has been learned about cellular response to alpha particles, from both microbeam and broadbeam studies. What will be found is that cellular response to only alpha particles (no low LET radiations present) have a specific dose response behavior and, as proposed in the earlier work (Leonard 2008a, 2008b, Leonard and Leonard 2008), there are two distinct regions, a Bystander Damage Region and a Direct Damage Region, exactly as predicted by the bystander BaD Model presented above and shown in Figure 3. But we also find evidence that there is a threshold and transition dose response region between the Bystander Damage Region and the Direct Damage Region and make an empirical modification to the model.
3. RESULTS
3.1 Examination and Modeling For Alpha Particle microbeam and broadbeam Dose Response Data
We here examine a number of different experimental data sets involving microbeam and broadbeam exposures of different cell species to alpha particle radiation. In particular we use a modified version of the bystander BaD Model originally provided by Brenner et al. (2001) given by Equation (7) below. Through the course of the modeling we have found that the dose response consistently exhibits a threshold for the Direct Damage component. We also find that the high dose Direct Damage behavior is linear-quadratic for both induction of neoplastic transformation (TF) and chromitid and chromotine chromosome aberrations (CA). Thus, these minor modifications, provided by Equation (7), has been made to the basic BaD Model and the composite Adaptive Response and Bystander Microdose Model (Leonard 2008a). We find that the TF and CA data are in agreement that bystander damage is consistently experienced in the number of cell species studied.
3.1.a Comparison Between Single and Broadbeam Alpha Charged Particle Traversal Induction of Neoplastic Transformation and Chromosome Aberrations
Radiation damage production of neoplastic transformation and chromosome aberrations are believed to be direct indications of ionizing radiations ability to produce carcinogens in human tissue. We use the empirically modified BaD bystander dose response model of Brenner et al. (2001) to analyze alpha particle dose response data provided primarily by Dr. Halls group at Columbia University. For direct correlation, we repeat the illustrative BaD Model as Figure 5A. In the experimental data shown in Figures 5B through 5I, we show the transformation frequency as a function of both Alpha Absorbed Dose and microdose alpha particle nucleus traversals. In Figures 5B and 5C as a comparison between broadbeam and microbeam alpha particle response, we present the data of Miller et al. (1999) for broadbeam (5B) and microbeam (5C) exposures of C310T1/2 cells to 5.3 MeV alpha particles. For the broadbeam exposures, the alpha fluence was sufficient to deliver a Poisson mean of one alpha particle per cell at the lowest exposure level. In the Figure 5C, they injected exact numbers of alpha particle per cell with the lowest number being one alpha per cell to 100% of the cells. We have not fit the BaD Model parameters to the data, because there are no data in the bystander dose response region. Since, by definition of bystander effects, no data was for less than one traversal, there can be no observed bystander effect and thus no values were obtained for the BaD Model parameters σ, ξ γ, and k in the Table 1 summary of model parameters. We have circled the region between 0 and 1 specific energy hits where BE would be observed, as we will see in the other Figures 5D through 5I given below in Section 3.1.b from other Dr. Halls group data, where exposures were indeed made in the bystander region. We have fit an empirical function to the data, which, as we will discuss below in Section 4.1.a, suggests a minimal Normal Distribution accumulation of 2 alpha traversals to achieve a quasi-linear-quadratic direct damage response. The fact that zero transformations occur for exactly one traversal in Figure 8C supports this premise. The idea that more than single hits are necessary to activate the direct damage was first suggested by Miller et al. (1999) and here we use the Normal Distribution simply to empirically shape the dose response curve. Other causes such as a reduction in the spontaneous damage level by single hits may be the plausible mechanism. The Normal Distribution function threshold and α and β linear-quadratic parameters to the least squares best fit are given in Table 1. As appropriate, no values for the parameters σ, ξ, γ, and k are given.
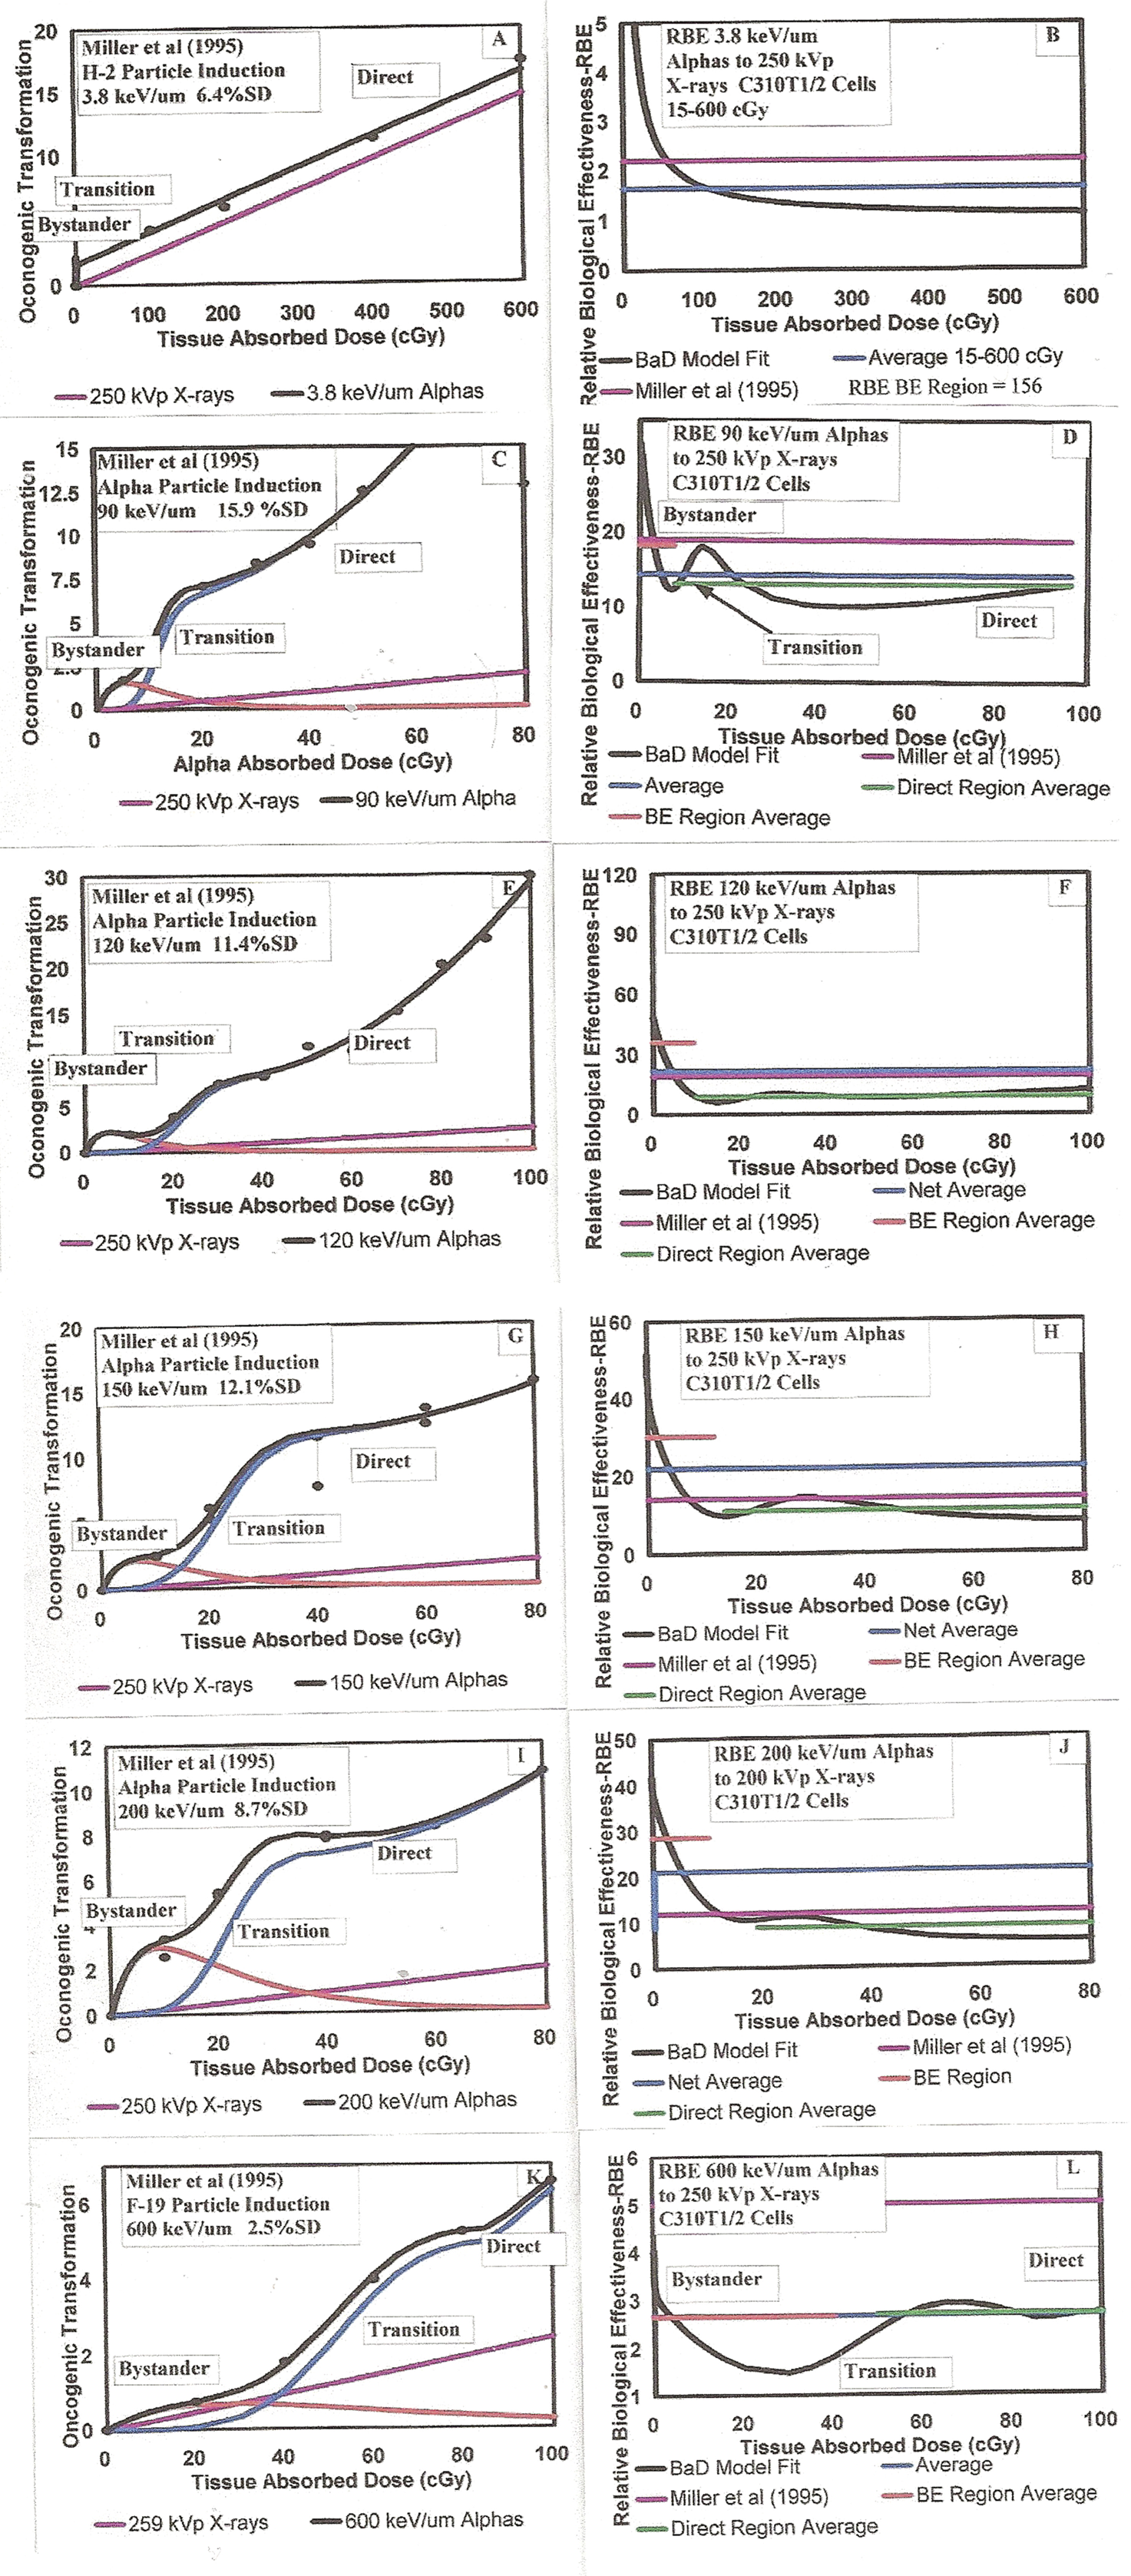
The modified BaD Model best fit to the Miller et al. (1995) exposure of C3H 10T1/2 cells to alpha particles of indicated range of LETs. Experiments are described in Section 3.1.e and 4.1.c and best fit parameters are given in Table 1.
Values of Best Fit Parameters for the Modified BaD Bystander Model to the Indicated microbeam and broadbeam Alpha Particle Studies.
3.1.b The Alpha Exposures of Zhou et al. (2001) and Hei et al. (1999) for AL Cells
Two separate experiments used human-hamster hybrid AL (CHO K1) cells to study mutagenesis from alpha particle irradiations. Hei et al. (1999) used the Columbia University microbeam facility to irradiate the AL cells with 1, 2, 4 and 8 exact numbers of 5.5 MeV alpha particles. These data, as were the Miller et al. (1999) data in Figures 5B and 5C, of course would not reflect bystander behavior. Later, Zhou et al. (2001) used the microbeam facility to inject lower percentages of alpha particles to the in vitro AL cells, i.e. 5, 10, 20 and 100%. The combined dose response results are given in Figures 5D through 5F. With these three graphs, we present the data with both Alpha Absorbed Dose and Exact Number of Nucleus Traversals for the full range of data (Figure 5D), for the low dose bystander region (Figure 5E) and the full range on log scale (Figure 5F). We obtained a good fit to the low region using the empirically modified BaD Model best fit parameters for σ, ξ, γ, and k given in Table 1. Again, as with the Miller et al. (1999) data, we had to use an empirical function to describe the behavior for the threshold of the direct damage region. These fit parameter values are also given in Table 1.
3.1.c Mutation Frequency for Alpha Particle Exposure of Wild-Type CHO Cells (Nagasawa and Little 1999, 2003)
Nagasawa and Little (1999, 2003) performed broadbeam alpha particle exposures of wild-type CHO cells and their repair deficient mutant xxr-5 cells, measuring mutation frequencies, in the bystander dose range using 3.7 MeV alpha particles from a 238Pu source in a special irradiator (Metting et al. 1995). They also measured the frequency of chromosome aberrations with the same source and cell species (Nagasawa and Little 2002), which will be examined in Figure 8 herein. We did not analyze the mutation xxr-5 data because their data only covered the bystander dose region. As Figures 5G through 5I, we provide the analysis of the mutation wild-type CHO data which extends to 120 cGy, well within the direct damage region for the 3.7 MeV alpha particles. Again we obtained a good least squares fit of the modified broadbeam BaD Model parameters to the low region bystander data region. The best fit values for σ, ξ, γ, and k are given in Table 1. The same effect, suggestive of a threshold, was again observed for the initial direct damage region from 1 to 3 alpha particle traversals where a transition occurs into the direct damage linear-quadratic dose response behavior region. This is compatible with the threshold effect suggested by Miller et al. (1999) but there is presently no experimental verification of this. The values for the threshold transition function and linear-quadratic σ and β parameters are given in Table 1.
3.1.d Alpha Particle Induced Chromosome Aberrations for Wild-Type CHO and Repair Deficient xxr-5 Cells (Nagasawa and Little 2002)
The Nagasawa and Little (2002) measurements of chromosome aberrations in the same wild-type CHO cells provides a direct comparison to the mutation frequency data, in Section 3.1.c above, relative to bystander and direct damage sensitivities. Figures 6A through 6C provide the full range, low dose range and log scale presentation of the CHO data and the least squares fit, as was done above for the other alpha response data in Figure 5. The best fit parameter values are given in Table 1. As Figures 6D through 6F, we provide the similar data and best fits to the xxr-5 data of Nagasawa and Little (2002), the parameters given in Table 1. For the CHO and xxr-5 cells, we again see the model suggestion of a distinct transition between the bystander damage to the direct damage with a threshold transition between about 1 and 3 alpha particle specific energy hits to the nucleus.
3.1.e The Relative Biological Effectiveness (RBE) of Alpha Particles
Martin et al. (1995) and Miller et al. (1995), using two positive ion accelerator facilities i.e. the Radiological Research Accelerator at Columbia University and the Tandem Van de Graaff Accelerator at Brookhaven National Laboratories, performed extensive measurements of oncogenic transformation frequencies for SHE Syrian hamster embryo (Martin et al. 1995) and C3H 10T1/2 (Miller et al. 1999) cells for a large range of ion LETs using 2H, 3He, 4He and 19F ions. We have chosen to examine the LET data of Miller et al. (1999) for LET values of 3.8, 75, 90, 120, 150, 200 and 600 keV/μm. We have chosen these because their data sets provide for the alpha dose response in the low dose range where bystander effects would be present and also the higher dose range where the Direct Damage would be present. Both Martin et al. (1995) and Miller et al. (1999) analyzed the data by comparing the alpha dose response of the cells to low LET X-rays [300 kVp for Martin et al. (1995) and 250 kVp for Miller et al. (1999)] to assess the relative biological effectiveness of the alpha particles at the different high LETs of the ions including alpha particles (4He ions). Their accelerator measurement of oncogenic transformation were over a range of ion particle doses ranging from 0.1 to 6.0 Gy. The RBE values, as presented in their Figure 3, were assessed by linearly graphing their dose response data and computing the slopes compared to the X-rays slope in their Figure 2. For alpha particles, the LET decreases mono-tonically with increasing alpha particle energy. Figure 7A provides the LET in keV/μm for alpha particles as a function of alpha kinetic energy in MeV. We show the alpha particles for 222Rn and the progeny 218Po and 214Po. Figure 8 panels A, C, E, G, I and K provides the fits of the Equation (7) modified BaD Model to the Miller et al. (1999) data in terms of charged particle specific energy hits per nucleus (which is linear with dose). Due to the two separate response components experienced by the cells i.e. bystander and direct damage as provided in the empirically modified BaD Model, the fits are not at all amenable to a constant slope linear fit These region averaged RBE values are given in Figure 7B i.e. the average RBE values averaged separately over the Bystander Effect Damage Region and the Direct Damage Region, along with the RBE values reported by Miller et al. (1995) in their Figure 3. We show a significant difference between the Bystander and Direct Damage values and between these and the Miller et al. (1995) values. In Figure 8, panels B, D, F, H, J and L, we provide the RBEs as a function of Tissue Absorbed Dose. In these Figure 8 RBE panels, we show in red the RBE average over the Bystander Damage Region and in green the average over the Direct Damage Region. Further analysis will be presented in Section 4.1.a.3. The best fit values of the empirically modified BaD Model parameters are given in Table 1.
3.1.f Summary of Alpha Particle Dose Response Studies and a Representative Alpha Particle Dose Response Shape
To examine the comparison between the data sets, in Figure 9A, we provide the modified broadbeam BaD Model best fits to the data of Miller et al. (1995) obtained in all of their LET studies with the Mean Number of Nucleus Traversals as the abscissa scale. As Figure 9B with the same abscissa scale, we present the alpha particle modified broadbeam BaD Model best fits to the wild type CHO TF data of Nagasawa and Little (1999, 2003), the CHO and xxr-5 cell chromosome aberration data of Nagasawa and Little (2002) and the C3H 10T1/2 cell data of Miller et al. (1999). In all of these, the best fit was by using a Normal Distribution accumulation function in the transition region between the Bystander Damage Region and the Direct Damage Region of dose response. The average of the mean values, in Table 1, for the transition is 1.68 alpha particle traversals with a transition width of 0.62 hits. From these consistent data in terms of alpha particle mean number of nucleus traversals for a number of different cell species and alpha LETs, we conclude that the dose response of alpha particles is relatively independent of cell species and the dose delivered per specific energy hit is principally dependent on the frequency of the hits, with there being two endogenic effects from the exogenic alphas i.e. a Bystander Damage effect below one alpha particle traversal and the Direct Damage effect above about two alpha traversals. We also show in Figure 9B the AL transformation frequency (TF) data of Zhou et al. (2001) and Hei et al. (1999), which shows for exact numbers of traversals, a similar, consistant behavior. We can therefore premise that the incidence of carcinogenic producing neoplastic transformations and chromosome aberrations within human lung tissue must follow the same micro-dosimetric dose response with alpha particle traversals through the nucleus of the sensitive human lung cells. With this premise, as Figure 10, we provide a representative shape for alpha particle dose response as a function of Mean Number of Nucleus Traversals. In the low radon domestic dose region, the response will be concave from the Bystander effect and linear with a moderate quadratic component in the high radon underground miners exposure region.

Summary of the alpha particle dose response data examined in the Results Section. Panel A – The dose responses for different alpha and other charged particles at different LETs as given in thr legend. Shown is a consistent Bystander Damage Region, a Threshold and Transition Region and a Direct Damage Region. The modified BaD Model parameters are given in Table 1. The magnitude of the Bystander Damage Region is shown to vary with LET similar to RBE. Panel B – The alpha particle dose response for four cell species and for transformation frequency and chromosome aberration production. A consistency is again shown when analyzed with respect to alpha particle Specific Energy Hits per cell Nucleus.

A representative alpha particle dose response for production of neoplastic tramsformation and induced chromosome aberrations based on the Table 1 averaged parameters for alpha particles with LET values near those for radon progeny alpha LETs shown in Figure 7. Also shown are abscissa scales for conversion to radon concentration (in Bq m−3) for hits to the nucleus and cytoplasm, based on James et al. (2004) values, for the three lung cells sensitive to lung cancer induction. Panel A – Nucleus hits. Panel B – Cytoplasm hits.
Since there are two distinctly shaped dose response regions, there are two distinct region averaged RBEs for the alpha particles relative to low LET radiations as seen in the Figure 8 panels and Figure 7B. In actuality, there are a continuous distribution of RBEs as the alpha dose response varies non-linearly and the low LET response varies approximately linearly. In the LET region for radon and progeny alpha particles (70 to 100 kev/μm) the difference is seen to range from about a factor of 1.7 to 3.2.
4. ANALYSIS
4.1. Summary of the Emperically Modified BaD Model Fit to Alpha Particle Dose Response Data, a Threshold and a Two Region Shape
4.1.a A Multiple Hit Threshold for Alpha Particle Activation of Direct Damage in Cells
In our analysis of published data of alpha particle induction of neoplastic transformation and chromosome aberrations, it was necessary to modify the basic bystander broadbeam BaD Model, which we presented as Equation (2) above, to accommodate the observed dose response data for the broadbeam experiments. The basic problem was that a single alpha particle traversal through the cell does not initiate the Direct Damage dose response that should be expected since an alpha traversal deposits a relatively large amount of energy to the cell. The data of Miller et al. (1999) in Figure 5C shows that a single alpha particle traversal does not initiate noticeable cell transformations and does not show a linear dose response for the first several alpha traversals per cell, as has been found to be true for alpha particle cell survival data. Past research has not as yet explained this behavior and this work also fails to do so. Our modification to the BaD Model was accomplished in the transition region with the use of the Normal Distribution accumulation function in Equation (4) below. All the alpha particle data examined in the Results Section show a distinct alpha particle threshold for initiation of the Direct Damage, between one to two alpha particle traversals. In the Figure 5 panels, we show Miller et al. (1999) both the broadbeam and single alpha microbeam data. We above noted that the microbeam single alpha particle exposure is shown to have minimal cellular damage effect. This was noted by Miller et al. (1999). We have tried introducing an alpha particle Poisson accumulation threshold transition function, as was done for the Direct Damage component of the composite AR and BE Microdose Model. We found that for various mean values from 1 to 3 Poisson distributed alpha particle mean specific energy hits that the fit was very unsatisfactory. Figure 11A shows the fit for a Poisson distributed threshold mean of two alpha particle traversals to ± 40.1%SD for the Nagasawa and Little (2002) CHO data. The fit for a threshold of 1 alpha traversal was worse, the problem being that the Poisson function is too broad a function about the mean values. We next tried a Normal Distribution accumulation function, N(M,V,SD), with the property of a mean value, V, and a standard deviation (width at 1/2 maximum - SD) – again M is the mean hit as a function of alpha dose i.e. M = D / <z1>. This Normal Distribution accumulation function, like the Poisson accumulation function, varies from 0 to unity as M (hits) increases. We found that the best fit value of the mean number of alpha particles to model the threshold was 1.68 hits with a SD of 0.62 hits (this being the average values of V and SD in Table 1). Figure 11B provides the best fit for the Nagasawa and Little (2002) data to ± 8.6%SD using the Normal distribution function for the threshold. For the analysis of all the alpha particle broadbeam dose response data reported here, from Equation (2) we have used an emperically modified broadbeam BaD Model given by

A threshold and transition function for induction of Direct Damage from alpha particles. It is found in the fit of the bystander BaD Model that a mean of single alpha particle traversals do not activate the Direct Damage component. Panel A – A Poisson accumulation transition function tried with minimal success. Panel B – A normal distribution accumulation function provides a good fit in modeling the threshold transition from the Bystander Damage Region and the Direct Damage Region.

using M = <N> and with the normal distribution function N(M,V,SD) in the modified broadbeam BaD Model Direct Damage component and the other parameters defined above and in Appendix B. We do not offer an empirical or analytical explanation for the need of this modification nor did Miller et al. (1999) for their observations. One thought is that bystander cell killing could eliminate spontaneous transformants and lead to a reduction in the overall transformation frequency after low fluences of alpha particles and the response becomes linear at the higher fluences.
4.1.b Use of the Broadbeam BaD Model Equation for Analysis of Experimental Alpha Dose Response Measurements
The broadbeam BaD Model Equation (2) is derived by Brenner et al. (2001) from the microbeam Equation (1) using standard microdosimetric principals, taking into account the microdosimetric fluctuations conditional on a given absorbed dose. This involves averaging over a Poisson distribution of hits for a fixed absorbed dose level. We have here used the mean specific energy deposition constant for nucleus traversals, <z1> (units cGy per hit), to estimate the mean number of alpha particle nucleus traversals to the cell nuclei by division of the tissue absorbed dose (units of cGy) by <z1>. This provides the independent variable Mean Number of Nucleus Traversals used in our analysis. We have essentially averaged away the microdosimetric fluctuations and any impact on biological responses before their use of their empirical model in Equation (5). Others (Little and Wakeford 2001, Little 2004, Brenner and Sachs 2002, 2003, Brenner et at 2001) have estimated the size of the cell nuclei and alpha LET values to estimate <z1> in using the broadbeam Equation (2) in examining Bystander Effects although technically not microdosimetrically correct either.
The BaD Model and our subsequent non-conventional modifications here have acquired the empirically derived functions in our Equation (7). Neither the model and our Equation (7) consider the fact that the types of chromosome aberrations and mutations produced by the bystander cells are different from those produced by the direct radiation damage. Direct damage produces chromosome type of aberrations and deletion type mutations while bystander damage produces chromatid type aberrations This suggests that the bystander damage may also be protective by the protective apoptosis and cell death to eliminate transformed cells such as spontaneous transformants. As noted, this may explain the low microbeam dose response observed by Miller et al. (1999) and, at least empirically, the need for two hits to activate the Direct Damage component of our broadbeam data fits. The Equation (7) functions have thus been successfully used to capture the complexity of the dose-response experimental data examined here and as discussed in the following section 4.1.c, obtain a representative alpha particle dose response behavior in terms of bystander and direct damage.
4.1.c A Representative Microdose Alpha Particle Dose Response Relative to Increasing Alpha Charged Particle Traversals in the Absence of Adaptive Response
In our extensive study of adaptive response dose response behavior with the Microdose Model, it was found for over 25 cell species dose response data sets, that certain properties of the response were invariant. In simple words, the AR dose response had a representative behavior. One was that the threshold and transition to the adaptive response protective state occurred at the dose value of <z1> (thus single hit “triggering”) by Poisson accumulation of the hits. The other was that the adaptive response protection effect became diminished at about 10 cGy of low LET priming dose where the deleterious Direct Damage began to dominate. These properties are shown in Figures 1 through 5 and discussed in Section 2.3 of Part II (Leonard et al. 2010a).
Similarly, there have been speculation about the eventual shape of the dose response curve for ionizing radiation (Morgan 2006). Figure 12A is a reproduction of Figure 4A from Brenner and Sachs (2002) for Excess Relative Risk where generally a linear cancer risk is shown. The non-linear curvature at the high radon levels is from the presumed high radon “inverse” dose rate effect (IDRE) affecting the underground miners. In a later paper, considering the prospects that hormesis type protective behavior (curve e) may occur in some instances and the potential for deleterious bystander effects (curve b), the Figure 12B provides a dose response graph reproduced from Figure 3 of Brenner and Sachs (2003). These possibilities are in concert with the alternatives presented by Morgan (2006) relative to the ultimate roles of the bystander effect and adaptive response radio-protection. Since human exposures to radon are broadbeam exposures, from our Results Section evaluation with the modified bystander broadbeam BaD Model, we can estimate a possible invariant, representative relative risk dose response by the simple assumption that alpha particle induction of human lung cancer should behave similar to the production of neoplastic transformation and chromosome aberration shown for a number of cell species for alpha particles in panels in Figures 5, 6 and 8. As Figure 9A, we have shown the emperically modified broadbeam BaD Model fit curves for the six data sets of Miller et al. (1995) in their LET and RBE study from Figure 8. In Figure 9B, we have shown the emperically modified broadbeam BaD Model fit curves for the data sets in Figure 5 and 6 panels for the different cell species studied. Both Figure 9A and 9B show the broadbeam curves plotted in terms of Mean Number of Nucleus Traversals. The broadbeam curves in Figure 9B for different cell species and two biological “endpoints” are very similar, with the deviations most likely from experimental variances. The broadbeam curves in Figure 9A appear to only vary in a systematic way with LET. The LETs of the exposures are given in Table 1 and in the legend of Figure 9A for the Miller et al. (1995) data. The LETs of the radon and progeny alphas are approximately 90 keV/μm. In Part I of Table 1, we see that the LET of the Nagasawa and Little (1999, 2002) experiments is 112 keV/μm. We have computed the average and variances of the Bystander Damage and Direct Damage parameters given for the three Nagasawa and Little (1999, 2002) sets in Part I and the 90 and 120 keV/μm sets of Miller et al. (1995) in Part II of Table 1. Figure 10 provides a resulting representative composite alpha particle dose response based on these analysis of the broadbeam dose response data. We use the average empirically modified broadbeam BaD Model parameter values for Equation (7) i.e. σ = 2.8, q = 1.00 per hit, k = 1.9 per hit, ξ = 1.00, Nu (α) = 0.10, β = 0.144, V = 1.68 hits and SD = 0.62 hits obtained from Table 1. We show that, since residential radon levels would induce damage primarily in the Bystander Damage Region to the lung, the dose response curve should be expected to have a downward concave curvature as shown in Figure 10 - similar to curve b of Brenner and Sachs (2003) of our Figure 12B. The BEIR VI (1999) Figure 3–2 (our Figure 1C) and the dose response curves of the case-control studies in Figure 2 herein fail to, of course, reflect this concavity due to the LNT assumption.

The human lung cancer risk response curves. Panel A – The suggested Excess Relative Risk for human lung cancer from radon as suggested by Brenner and Sachs (2002). Panel B – Possible shapes of the lung cancer radiation risks based on non-linear premises from bystander, adaptive response and other cellular mechanism effects (Brenner et al. 2003). – Both reproduced with permission.
With this premise of a representative alpha particle dose response curve with respect to alpha particle traversals per nucleus as the independent variable parameter, we use a concave response curve as a starting point in the residential radon level region (Bystander Damage Region) and estimate a more realistic general dose response curve than in Figures 12A and 12B. We can hypothesize that the alpha particle dose response of the lung cells for lung cancer risk must have the overall shape similar to the Figure 10, with respect to alpha particle traversals per nucleus. Then, with this representative shape, the Figure 10 curve needs to be normalized to the spontaneous risk of lung cancer in consideration of the relative shape values of Figure 10. Since these will be important in evaluating, in Part III (Leonard et al. 2010b), the radon lung cancer risk data from the case-control studies shown in Figures 2A and 2B, we provide in the abscissa in Figure 10, separate scales for the effective radon concentrations for alpha particle hits to the potential lung “target” cells i.e. basal, bronchial secretory and bronchiolar secretory cells and for the nucleus and entire cell (nucleus and cytoplasm. Panels A and B). These are based on the traversals to radon concentration conversions provided by James et al. (2004) (our Figure 4). We thus have obtained an estimate, without the presence of any low LET radiations to activate adaptive response protective effects that may influence the overall human lung cancer risk curve (which will be examined in Part II). We will see that we also must consider the high radon IDRE effect at the high radon levels in developing a relative risk curve encompassing the high alpha dose data in the Appendix A when applied to the underground miners. But the IDRE occurs above normal domestic and workplace radon levels for humans.
4.1.d A Significantly Variable RBE for Alpha Particles with Dose and Alpha Traversals, Especially for the Low Residential Radon Levels
We further examine the results of the analysis with respect to LET. For the Miller et al. (1995) RBE data, it is found in Section 3.1.e of the Results Section that although the shapes are the same, as noted above, the relative magnitudes of the Bystander Damage and the Direct Damage components varies with LET of the high LET radiation. In Figure 8, we show, on the left as Panels A, C, E, G, I and K, the Microdose Model best fit to the Miller et al. (1995) LET and RBE study. In these left panels, we provide the 250 kVp X-ray response that Miller et al. (1995) used to compute the RBEs. Side-by=side for ready reference, the right panels provide the computed RBEs as a function of alpha particle Tissue Absorbed Dose, as the solid black curve, the simple ratio of alpha dose response to X-ray dose response (the ratio of the two dose response curves). It is clear that there is no reasonably constant effective RBE for the entire range of doses as was estimated and reported by Miller et al. (1995). We have computed the averages over the two separate Bystander and Direct Damage Regions using the single alpha traversal Direct Damage threshold as the boundary, These are shown in solid red and green on the graphs. As Figure 8F, we see that the RBE varies from about 35 to about 10 for 90 keV/μm LET alpha particles. Figure 7A shows the variation of LET with alpha particle kinetic energy. Figure 7B shows, for all the Miller et al. (1995) LET data sets, the magnitudes of the average RBEs for the Bystander Damage and Direct Damage Regions (from Figure 8) for the Miller et al. (1995) LETs showing the large variation. The LETs of the three radon alpha particles for 5.49 MeV 222Rn, 6.00 MeV 218Po and 7.69 MeV 214Po are 88, 85.2 and 80.5 keV/μm, respectively. For the radon progeny alpha particles, the RBE is very large at very low radon concentrations and decreases by a factor of about 3.5 at higher radon levels, so can not reasonably be represented by a single RBE value as Miller et al. (1995) reported.
4.1.e The Best Fit Modified Broadbeam BaD Model Parameters for the Alpha Dose Response Data
Using the emperically modified broadbeam BaD Model, Equation (7), to analyze the alpha particle dose response data presented in the Results Section, we have provided the best fit parameters given in Table 1. Given are the best fit least squares standard deviations. It is found that the modified broadbeam BaD Model provides an excellent analytical tool in describing the dose response of the four cell species (CHO, C3H 10T1/2, AL and xxr-5) dose response to alpha radiation and adequately depicts the Bystander Effects broadbeam bio-physical behavior.
4.2 Correlation Between Alpha Particle Traversals Through Lung Tissue and Indoor Radon Concentration
4.2.a Traversals of Alpha Particles and Specifically Radon Alpha Particle Exposure to Human Lung Tissue
Since the issuance of BEIR VI (1999), James et al. (2004), as noted above, has provided a new assessment of the effect of radon alpha particle traversals (hits) through human lung tissue with some changes in the effects as a function of radon concentrations (in kBq m−3 units) for residential and underground miners exposures. This re-assessment thus supplements the International Commission on Radiological Protection (ICRP) Report 66, Human Respiratory Tract Model for Radiological Protection (ICRP 1994). They provide, in tabular form, the probabilities of single and multiple alpha particle hits, as a function of radon concentration, for the three most sensitive human lung cells i.e. bronchial basal, bronchial secretory and bronchiolar secretory cells. It is generally accepted (BEIR VI 1999, James et al. 2004) that lung epithelial cells are responsive to potentially carcinogenic damage over the 30 day mitotic cycle. Figure 4A and 4B provide graphs of the probabilities of single alpha particle hits to the cell nucleus and to the cytoplasm (entire cell) during a 30 day exposure for the three cell species. It is the consensus that the sensitive region of the cell, with respect to radiation induced chromosome damage, is the cell nucleus, so we have used the nucleus in our evaluations as we have done in the past for adaptive response radio-protection studies.
The James et al. (2004) re-analysis of alpha particle lung cell traversals allows us to correlate the alpha particle dose response data studied in the Results Section and the representative alpha particle traversal response shape in Figure 10 to human radon exposure concentrations. From the James et al. (2004) hit rate values, we provide the correlation between radon concentrations to inflict the alpha particle Specific Energy hits for the representative shape model in Figure 10 with radon concentration abscissa scales for the three cell species. We are interested in estimating the number of specific energy hits that human lung cells receive in the residential radon setting and that the underground miners receive in their mine workspace setting, based on US radon surveys. Figure 13 provides a reproduction of Figure 1–4 of BEIR VI (1999) showing the distribution of radon concentrations in US homes, but with added ordinate axis scales for alpha particle traversals to the three lung cell species. We see that only fractions of traversals occur to the lung cells at radon levels experienced in US homes during the 30 day cell cycles. Various studies have reported radon concentration distributions in the underground miners workspaces. In earlier work, as Figure 13A of Leonard (2007c), we have tabulated the underground miners radon concentration distribution from reports of underground miners workspace measurements conducted by Andria George and his group at the US Environmental Measurements Laboratory. Figure 14A herein provides graphs of the percentile of miners workstations with cell traversals above the abscissa Single Cell Traversal for a 30 Day Cycle for the three lung cell species. As Figure 14B, we show the Percentiles for Multiple Cell Traversals. The vertical solid black line is for 1 traversal in the 30 day period. We see for single traversals that at least 95% of all miners workstations would result in at least one cell traversal per cell cycle. About 50% would receive at least 3 traversals to the bronchial basal and bronchiolar secretory cells and at least 50% of the bronchial secretory cells would receive 7 cell traversals. Thus, humans exposed to radon in the residential setting will receive lung cell alpha particle damage via the Bystander Effect and underground miners will receive lung cell alpha particle damage via direct alpha particle traversals - Direct Damage Effect. For the miners, multiple alpha particle traversals are experienced in inducing the observed lung cancer events.

Reproduction of the BEIR VI Figure 1–4 distribution of radon concentrations in US homes. Added are scales of alpha particle traversals to the three radon sensitive human lung cells from James et al. (2004). This shows that during the 30 day cycle only fractions of hits occur per cell and human lung cancer risks are from Bystander Damage effects. Reproduced with permission.

Based on underground miners exposures presented in Figure 13A of Leonard (2007c), We show Panel A – The percentile of mine workstations where one lung cell alpha particle traversal will occur in the 30 day cycle. Panel B – Percentile of workstations where multiple traversals will occur. Thus for the underground miners their lung cancer risks are from Direct Damage alpha particle traversals not from Bystander Damage.
4.2.b The Representative Alpha Particle Dose Response in Assessing Human Lung Cancer Risks from Residential Level and Underground Miners Radon Concentrations – Excluding Adaptive Response Radio-protection Effects
The BEIR VI (1999) Committee has summarized their assessment of human lung cancer risks as a function of radon concentration in their Figure 3–2 of BEIR VI (1999) shown here as Figure 1C. The Relative Risks are estimated to have a slope of about 0.20 per 100 Bq m−3 of indoor radon. For the underground miners data alone, they provide a slightly lower Relative Risk of about 0.18 per 100 Bq m−3. Figure 15 reproduces their Figure 3–2 with also the lung cell traversals based on the James et al. (2004) data. This again shows that the cellular damage induced by the alpha particles from radon at residential levels must be almost solely from alpha particle bystander damage from fractions of traversals per cell, since such a small fraction are directly hit. Based on the large amount of dose response data examined in the Results Section relative to cellular sensitivity to the bystander effect, we can estimate a more realistic Relative Risk curve than given by the BEIR VI (1999) Figure 3–2. If we assume that the indoor case-control studies and the low exposure underground miners data in the radon concentration around 400 Bq m−3 are reasonably accurate, we can provide an improvement over previous premises such as shown in Figure 10.

Reproduction of BEIR VI Relative Risk Figure 3–2. Added are the James et al. (2004) traversal data for the lung cell nucleus as target as abscissa scales, showing that humans at domestic radon levels receive fractions of traversal per cell per cycle.
James et al. (2004) has stated that presently the relative lung cancer carcinogenesis for the three lung cell species is not known and recommends use of an average. We have converted the adjusted representative alpha particle traversal data in Figure 10 to Radon Exposure Concentration. In Figure 10, we, as separate abscissa scales, provide the equivalent radon concentrations separately for the three cells using James et al. (2004) Table 12 values of 0.00036, 0.0014 and 0.00051 single traversals per Bq m−3 of radon per 30 day cell mitotic cycles. We show scales for nucleus and total (cytoplasm) traversals.
4.2.c Normalization of the Representative Radon Alpha Particle Dose Response to Radon Relative Lung Cancer Risks
We wish to offer a more realistic general dose response curve for lung tissue exposure to radon progeny alpha particles than the options in Figures 12A and 12B. As noted above, without a more accurate re-assessment of human lung cancer Relative Risk data since BEIR VI (1999), in applying the representative shape curve to radon exposures, a conservative approach is to normalize the Figure 10 curve to the BEIR VI (1999) Figure 3–2 RR at the 400 Bq m−3 radon level since the higher values are believed to be more accurate. As Figure 16A, we show the alpha particle dose response from Figure 10, up tp high radon levels, for Radon Exposure Concentration and Alpha Specific Energy Hits per Nucleus, with also the BEIR VI (1999) residential estimate in red and the BEIR VI underground miners estimate in blue. [We must remember that the representative shape curve is for alpha particle production of chromosome aberrations and not directed applicable to human cancer risk. We will address that issue when the dose response data for radon case-control studies are examined in Part III of our study.] We show a very large difference in the high radon region in Figure 16A. As Figure 16B for low radon levels, we show the normalized curve, reflecting bystander damage concave dose response in the residential range of human radon exposure. Figures 16C and 16D provide the response with an estimate of the high radon region accounting for reduction from the “inverse” dose rate effect as was done in Figure 12B. In Figure 16D, we show the dose response in the mid-range where the transition between Bystander Effect Damage and Direct Damage occurs and show also the high radon range relative to underground miners exposures. Section 4.2.d will consider the radon “inverse” dose rate effect (IDRE) and the Enhanced Deposition Effect (EDE) with respect to the high radon regions of Figures 16A, 16C and 16D.

A “standard” dose response model, based on the representative dose response in Figure 10, for alpha particle induction of lung cancer cellular damage to humans from radon based on Specific Energy Hits to the lung bronchial basal, bronchial secretory and bronchiolar secretory cells sensitivity given by James et al. (2004). Panel A – the dose response over the entire range of alpha particle traversals from domestic to underground miner levels. Panel B – Normalization of the “standard” model to the BEIR VI Radon Lung Cancer Risk at 400 Bq M-3. Panel C – Presentation of the low and middle dose response region showing the Bystander Damage Region and the Transition Region into the Direct Damage Region. Panel D – The full dose response range showing the correction for the nasal and oral breathing passage Enhanced Deposition Effect (EDE) causing the radon “Inverse” Dose Rate Effect. Panel E – The EDE correction at high radon levels. Reproduced from Leonard (2007c) with permission. Reproduced from Leonard (2008c) with permission.
4.2.d Consideration of the High Radon “Inverse” Dose Rate Effect
Lubin et al. (1995), in evaluating underground miners lung cancer incidence rates, found that at high radon levels the lung cancer Relative Risk decreased at high radon concentrations, referred to as the “inverse” dose rate effect (IDRE). We show the Relative Risk reduction from IDRE as Figure 16. In radon modeling, BEIR VI (1999) has included a correction factor for IDRE, as shown in Figure 13D, for this effect in their Relative Risk model. No radio-biological basis had been premised for the effect. In studying radon progeny depositions in a radon test chamber, Leonard (1996) observed an excessive surface deposition on the chamber walls at high radon levels. In subsequent measurements, it was found, consistent with the results of Porstendorfer (2001) that at high radon levels above about 20 kBq m−3 the airborne radon progeny disassociates from its aerosol attachment creating a highly mobile unattached particulate. It was shown that the smaller diameter progeny experiences enhanced deposition to the nasal and oral breathing passages, thus reducing the radon reaching the lung. This is referred to as the nasal and oral passage enhanced deposition effect (EDE). Figure 16 shows the Lung Radon Concentration relative to the air radon concentration within the mine for un-ventilated and all mine work areas. This IDRE effect will occur for the high alpha particle doses in the underground miners radon levels.
Using the alpha adjusted dose response data for representative alpha particles in Figure 8 and the EDE corrections in Figure 16E, we have corrected the high dose relative risk data, above 20 kBq m-3, for the EDE as shown in Figure 16. We show the overall Relative Lung Cancer Risk for the residential levels and underground miners. This then we consider our best estimate of radon Relative Lung Cancer Risk, without the presence of AR protective low LET radiations, taking into account that residential level human lung exposures are from Bystander Damage and underground miners are from alpha particle Direct Damage including the “inverse” dose rate effect correction from the enhanced deposition effect influencing the underground miners exposure above about 20 kBq m−3 of radon.
4.2.e Differences in Type Chromosome Damage Between Bystander and Direct Cellular Damage from Alpha Particle Ionizing Radiation
Ward (1985, 1988, 1995) was one of the first investigators to examine the distinct types of chromosome damage produced by ionizing radiation. It is now known that there is a distinct difference in the damage products from bystander signal damage and from direct alpha particle damage. Morgan (2003a, 2003b) has discussed various damage effects including genomic instability for bystander and direct damage. The nature of the communication that is involved in producing these bystander responses is not known, there is strong evidence for chemical signaling processes, oxidative metabolism and gap-junction mediated cell-to-cell communication processes play roles in the bystander phenomenon. There is evidence that bystander cell damage produces an enhanced frequency of chromatid-type aberrations compared to chromosome-type aberrations (Schmid and Roos 2008). Irradiated medium has been found to produce chromatid aberrations when transferred to hamster hybrid (AL) cells (Suzuki et al. 2004). Jostes et al. (1994) found a difference between bystander and targeted induced mutations. Huo et al. (2001) found that cells damaged by the bystander effect from alpha particles resulted in primarily point mutations versus deletions at high alpha fluences suggesting their induction by different mechanisms. Schollinberger et al. 2006) have modeled the induction on chromosome aberrations for direct and bystander mechanisms. It is quite certain then that the carcinogenic potential of bystander and direct alpha traversed chromosome damage must be different. Since the underground miners primarily receive direct traversed damage and humans exposed to domestic and workplace level radon receive primarily bystander cellular damage, then the cancer risk can not be directly compared on a chromosome aberration, mutation or transformation frequency basis. Thus the underground miners dose response data may not be usuable for low level radon cancer risks in the radon concentration range presented in BEIR VI (1999) Figure 3–2 (our Figure 1C).
4.2.f Use of Brenner et al. (2001) Emperically Modified Broadbeam BaD Model Equation (6) Herein
The Brenner et al. (2001) BaD Model broadbeam equation [Equation (2) herein] was used in the work of Little and Wakeford (2001), Little (2004), Brenner and Sachs (2002, 2003), Brenner et al. (2001) in examining the broadbeam data relative to underground miner and domestic level radon cancer risks. The primarily object here in this Part I analysis was to obtain a representative dose response shape applicable to potentially carcinogenic chromosome aberration, mutation and transformation frequency cellular damage in the radon concentration levels related to human domestic level radon exposure. Based on the analysis, we showed that the representative shape is relatively independent of cell species, for the cell species examined, and alpha particle LET in the range of the LETs of the radon progeny alpha particles. We used a non-conventional, empirically modified broadbeam BaD Model Equation (6) to perform this analysis. Most significant was the need for the use of a Normal Distribution transition function in the region where bystander damage diminishes and the direct damage begin to dominate. The need for this is not known, Miller et al. (1999) premised that perhaps two alpha traversals per cell are necessary to produce the Direct Damage. The real reason is not known. Other possibilities are a reduction in the spontaneous damage, the killing off of cells by apoptosis or some other unknown. The Normal Distribution transition function provided the proper dose response shape behavior in that region with a mean number of 1.68 hits and a transitrion region between one and two alpha particle hits.
5. SUMMARY
Since the publication of the BEIR VI (1999) report in 1999 on health risks from radon, a significant amount of new data has been published showing various mechanisms that may affect the ultimate assessment of radon as a carcinogen, at low domestic and workplace radon levels, in particular the potentially deleterious Bystander Effect (BE) and the potentially beneficial Adaptive Response radio-protection (AR). Although most of the BE research has been studying in vitro radiation dose responses using microbeam single alpha particle irradiations, it has been readily premised that human lung cancer is caused, at least partially, by BE damage to lung cells. Recent analysis of AR research results with a Microdose Model has shown that single low LET induced radiation charged particles traversals through the cell nucleus activates AR protection. In a three part study, we have conducted an analysis based on what is presently known and what new research is needed that can assist in the further evaluation human cancer risks from radon. Using a modified version of the Brenner et al. (2001) bystander broadbeam BaD Model merged into a composite BE and AR Microdose Model, published as a review article in Dose-Response Journal, we here have analyzed the microbeam alpha particle data of Miller et al. (1999) and Zhou et al. (2001) and the broadbeam alpha particle data of others and show that, in terms of alpha particle traversals, the shape of the cellular response to alphas is relatively independent of cell species and LET of the alphas in the range of radon progeny alpha energies. The result is that the same broadbeam alpha particle traversal dose response should be true for human broadbeam lung tissue exposure to radon progeny alpha particles. A representative dose response shape is obtained and provided as Figure 10 relative to the radon concentrations for the three lung cancer sensitive human lung cells. In the Bystander Damage Region of the alpha particle response there is not a single alpha particle RBE but a variation from about 10 to 35. There is a transition region between the Bystander Damage Region and Direct Damage Region of between one and two alpha particle traversals indicating that perhaps two alpha particle “hits” are necessary to produce the direct damage. We show that extrapolation of underground miners lung cancer risks to human risks at domestic and workplace levels may not be valid, due to the obvious different mechanisms for cellular damage i.e. Bystander Damage for residential exposures and Direct Damage for underground miners exposures.
Some will premise that the extensive in vitro data strongly supporting the bystander effect is not valid for in vivo, broadbeam human exposures. We have cited, here and in Part III, a number of in vivo data, primarily from Dr. Mitchels research group (Mitchel et al. 1999, 2002, 2003, Mitchel 2006, 2008), showing an adaptive response effect in Part III (Leonard et al. 2010b) of our studies. In vitro data has been extremely valuable in obtaining dose response parameters for human radio-therapy treatment regimes. If in vitro data supporting AR is invalid when applied to human lung exposures, then all the alpha particle in vitro data supporting the bystander effect can not justifiably be applied to human lung exposures. Without the premise of the in vitro bystander effect data being valid with respect to in vivo lung cancer risks, lung carcinogenesis could only start at radon levels where single alpha particle tracks begin, as shown in the Miller et al. (1999) data presented as Figure 5C, i.e. from James et al. (2004), at Poisson distributed, initial single track radon levels of about 2.8, 0.71 and 1.97 kBq m−3 for the three cancer sensitive lung cell species. In our three part study, we have here reasonably assumed the validity of both the bystander effect and adaptive response radio-protection as mechanisms that occur in vivo within the human lung. In some instances, it will be shown in the Part II and III studies that the overall effect can result in a decrease in human lung cancer risks below the natural spontaneous level even in the absence of radon.
6. CONCLUSIONS
Our findings here in Part I, for alpha particle bystander effect influence on human lung cancer risk, are as follows:
A common alpha particle dose response for production of deleterious oncogenic neoplastic transformations and chromosome aberrations exists in terms of alpha particle charged particle traversals through the cells nucleus. The alpha particle hit response, basically independent of cell species and the small range of LETs for the radon and progeny alphas, consist of two distinct regions i.e. a Bystander Damage Region and a Direct Damage Region with a transition region between one and two alpha traversals.
A representative alpha particle dose response shape can be estimated encompassing the low, residential radon level Bystander Effects Region and the high, underground miner radon level Direct Damage Region.
The radon progeny alpha particle cellular response of human lung tissue relative to the potential carcinogenic neoplastic transformation and chromosome aberrations is similar and then so should the human lung cancer risks from radon. The shape of the human lung cancer risk curves for case-control studies should be non-linear and similar to the representative alpha particle dose response shape.
Underground miners lung cancer risk data may not be applicable to low domestic level radon human lung cancer risks due to different cellular damage mechanisms.