
Abstract
Textiles and garments are increasingly being included in life cycle assessment (LCA) studies because the use of chemicals in industrial production of these items has potential environmental impacts. The USEtox model, characterized by ecotoxicity characterization factors based on abundant data, is a useful tool for assessing the toxicity of chemical pollutants. The objectives of this study were to estimate characterization factors of cotton fabric-related chemicals based on data from a quantitative structure–activity relationship (QSAR) model and assess the ecotoxicological impact of cotton woven fabric. The research boundary ranged from fabric production to wet treatment. Wet treatment was found to contribute more to ecotoxicity than fabric production did, with primary alcohol ethoxylate and sodium hydroxide being the main pollutants.
Introduction
The textile and garment industry is one of the largest sectors globally in terms of production and employment. 1 In 2017, textiles and clothing contributed an estimated 4% to world merchandise exports. 2 The high output of textiles and clothing means that a large amount of chemicals are used in their production. According to the China National Textile and Apparel Council, the global annual output of textile chemicals is approximately 6.4 million tons, accounting for 25% of the total global chemical production. 3 Textile chemicals have been found in all environments, including water, air, and soil. Approximately 30%–35% of textile chemicals are discharged into the environment as a result of textile processing, such as dyeing and finishing. 4 In addition, hazardous chemicals are found in finished garments, which can be harmful to consumers. 5
Cotton products are important in the textile and clothing industry. The heavy use of chemicals in cotton product manufacturing, which may be toxic to the environment, has been of increasing concern. Roos and Peter adopted three different methods to assess the toxicity of a wet treatment process for cotton T-shirts. 6 Zhang et al. assessed the ecotoxicological impact of a piece of Chinese cotton short-sleeved T-shirt based on background data of dyes and auxiliaries in European contexts, and a small number of commonly-used chemicals were also considered. 7 Esteve-Turrillas and Guardia evaluated the environmental impact of cotton yarn production from recovered cotton and showed that recovered cotton yarn production was greener, as it avoided the growing and dyeing of cotton. 8
In life cycle assessment (LCA) frameworks, ecotoxicity characterization factors (CFs) represent how chemicals contribute to ecotoxicity. USEtox is an environmental assessment model for calculating CFs that was developed after extensive comparison of existing LCA methods for toxicity impact assessment. 9 Although the latest USEtox database covers more than 3000 chemicals, most cotton fabric-related chemicals are not included. The omission of these substances will likely result in the incomplete and inaccurate evaluation of toxicological impacts of discharged chemicals.
A major challenge in calculating the CF of cotton fabric-related chemicals is the difficult and time-consuming collection of experimental parameters. Furthermore, data sources may be fuzzy, especially in light of sparse experimental data. CF results depend on the selection parameters of the data source. 10 Quantitative structure–activity relationship (QSAR) models are a tool for studying the quantitative relationship between molecular structure and the activity of chemicals. Ortiz de García et al. calculated the CFs of 27 pharmaceutical and personal care products, with some data estimated from QSAR models without extra processing. 11 Therefore, the properties of substances can provide estimated values for CF calculation to cover textile-related substances.
The aim of this study was to more conveniently and reliably estimate CFs using QSAR models and to extend the cotton fabric–related chemical CF database. Consequently, ecotoxicological impact assessment of cotton woven fabric was used as a case study to explain the results. This method of estimating CFs can be used and provide reference data.
Methods
Use of USEtox
In USEtox, CFs were applied to turn chemicals (i) and emissions (E) into potential ecotoxicological impacts (1) using Eq. 1. 6

USEtox describes how chemicals move among and are transformed within compartments through a series of transport and transformation processes. Ecotoxicity CFs of chemicals synthetically consider the fate, exposure, and effects of a chemical, and emission compartment-specific CFs are calculated from the product of matrices comprising the fate factor (FF), exposure factor (XF), and effect factor (EF) by Eq. 2.

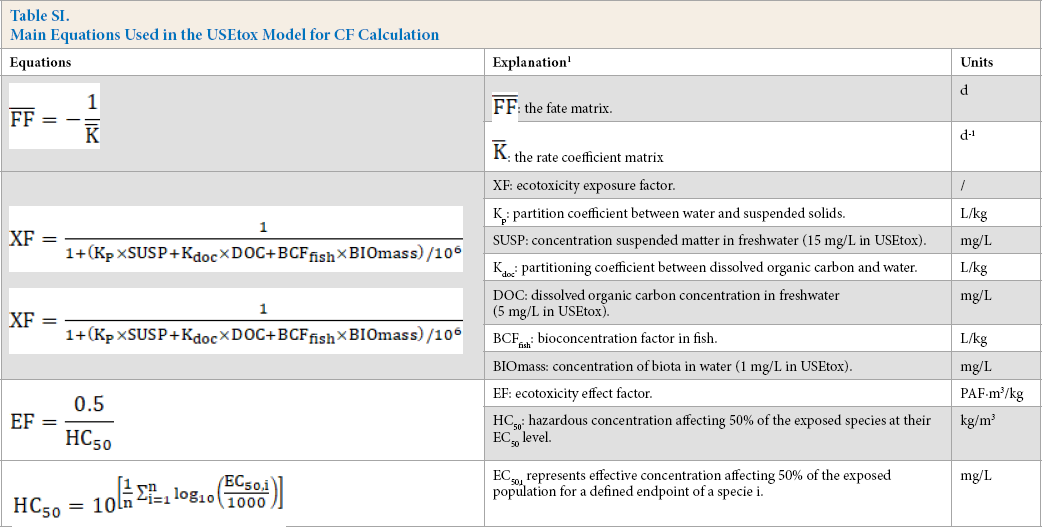
Fate factors represent the residence time of a chemical in a specific compartment and quantify the contaminants dispersion in the environment; they are directly connected to the degradation capabilities. The fate matrix indicates the mass of the chemicals in each compartment. Exposure factors represent the fraction of chemicals transferred to the receiver in a specific time. For ecotoxicity, exposure factors are calculated by the average of the log-values of the species-specific ecotoxicity data (avlogEC50). Equations for the three factors are given in Table SI.
Main Equations Used in the USEtox Model for CF Calculation
Calculation Boundary
In this study, the calculation boundary for cotton woven fabrics ranged from spinning to wet treatment (Fig. 1). The boundary included wastewater and gas generated in the production, rather than the ultimate discharge of the ingredients to the environment. Solid residue was excluded in the boundary. Direct emissions of pollutants from fuel combustion and production of chemicals were not considered, nor was the impact on water and energy consumption.
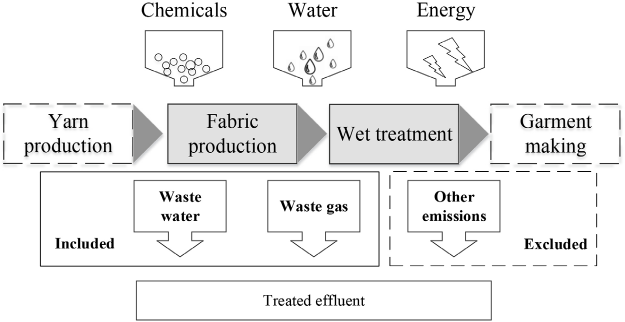
The calculation boundary of the case.
Data
Chemical Inventory
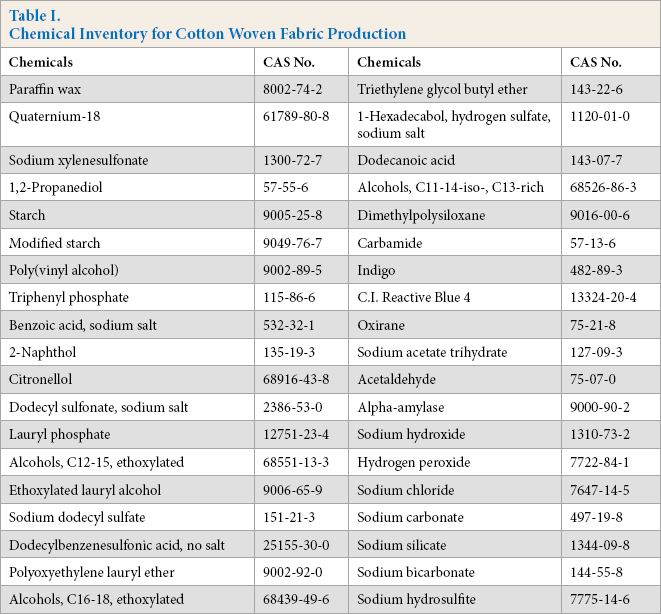
The chemical inventory in the boundary, as applicable to most cotton fabrics, rather than a specific cotton fabric product, is shown in Table I. The inventory of chemicals that are commonly used in the production of most cotton fabrics was organized in documents,12,13 and could be selected and grouped flexibly. Thirty-eight substances were included in the chemical inventory, including sizes, surfactants, and bases.
Chemical Inventory for Cotton Woven Fabric Production
Input Data
Input parameters, which were needed to calculate the ecotoxicity CFs, are listed in Table II.
Parameters for CF Calculation
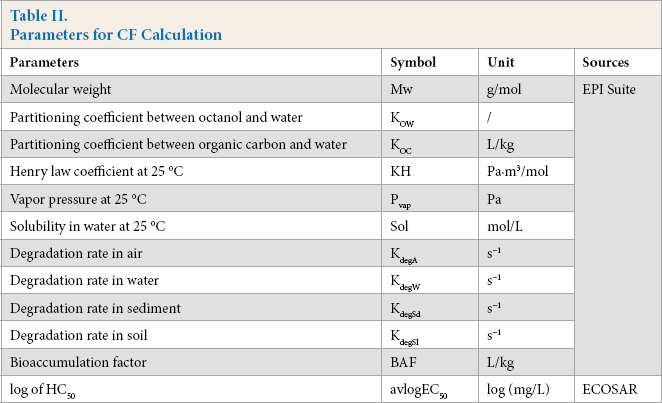
Physical-chemical properties and bioaccumulation factor (BAF) were used in the US Environmental Protection Agency Estimation Program Interface (EPI) Suite, version 4.11, as recommended by the USEtox team. 14 The degradation rates in water, soil, and sediment were estimated using biodegradation half-lives in the EPI Suite. The degradation rates for air were equal to the second-order constant rate for hydroxyl (KOH) times the hydroxyl radical concentration in units of molecules per cm3 ([·OH]). KOH amount was estimated in EPI Suite, and the default [·OH] was set at 1.5 × 10⁶ molecules (radicals) per cm3 per 12 h of daylight. 14
The aquatic ecotoxicity of chemicals was estimated using Ecological Structure Activity Relationships (ECOSAR), version 1.11, which is included in the EPI Suite package. Except for sodium hydroxide and sodium silicate, the ECOSAR model covered all the substances in this study. The values of input parameters are given in Table SII.
Values of Input Parameters
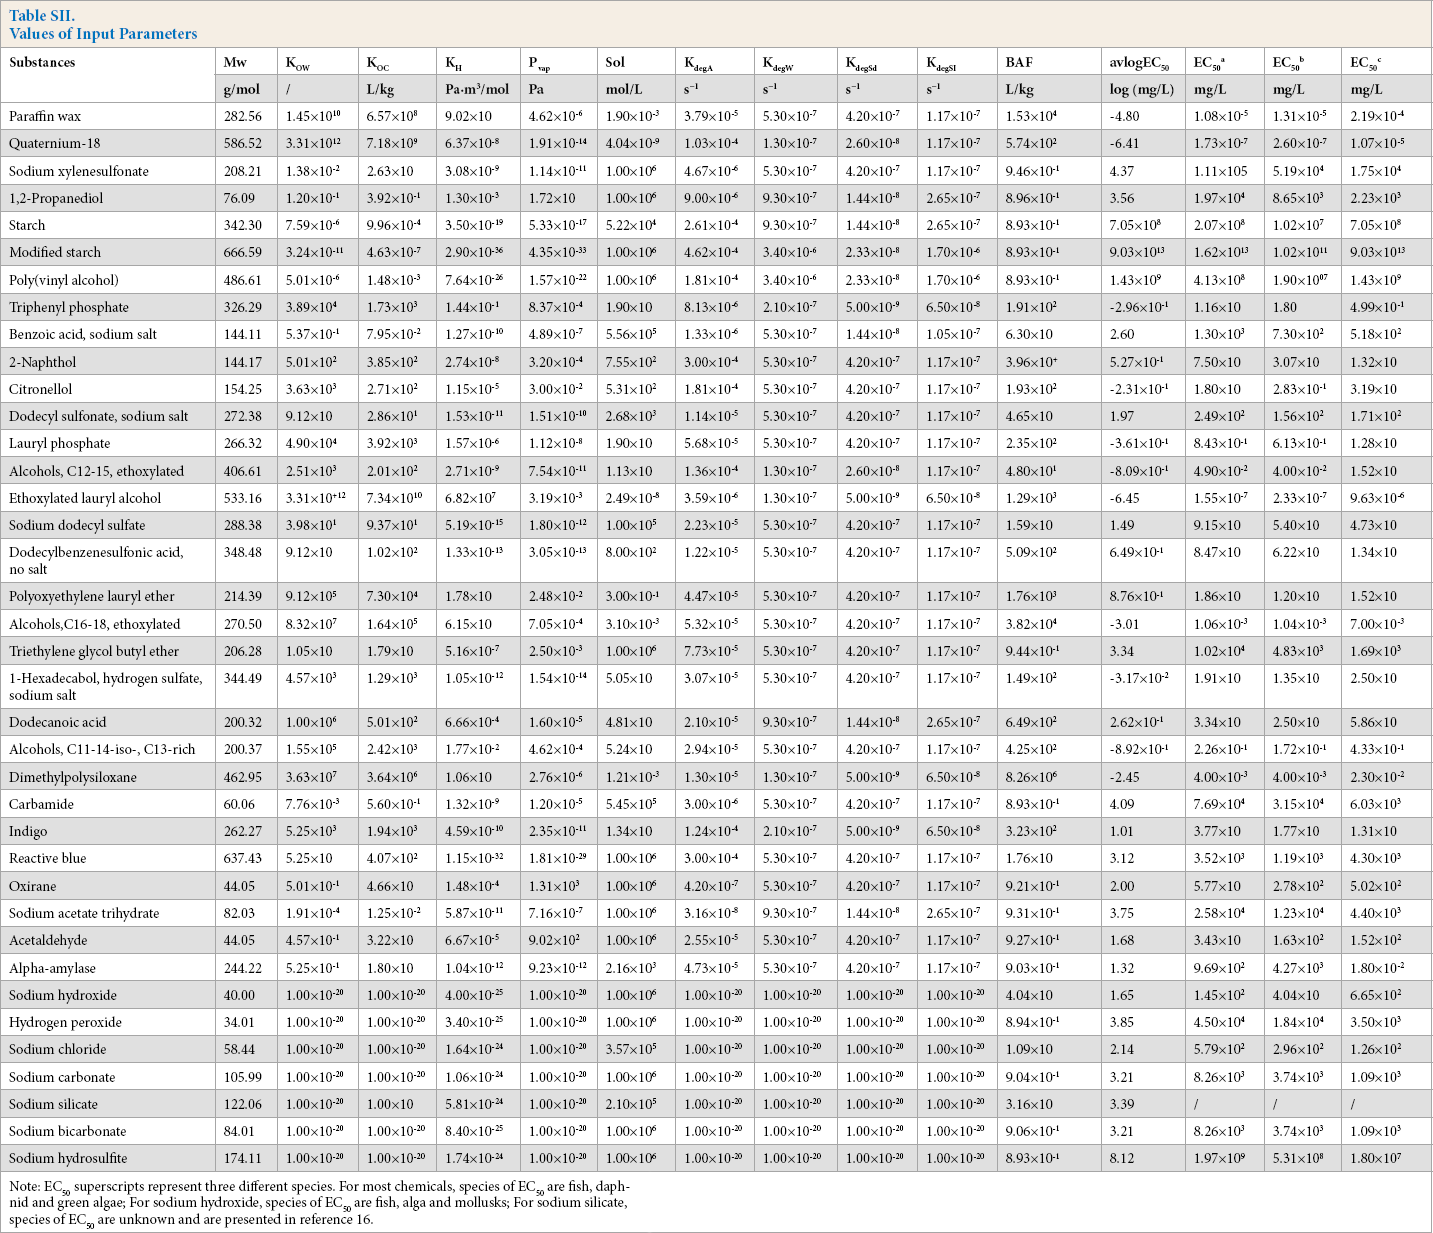
Note: EC50 superscripts represent three different species. For most chemicals, species of EC50 are fish, daphnid and green algae; For sodium hydroxide, species of EC50 are fish, alga and mollusks; For sodium silicate, species of EC50 are unknown and are presented in reference 16.
The USEtox model and EPI Suite are mainly designed for organic chemicals, as some parameters are unique to organic matter. To obtain the CFs for inorganic chemicals, the values of KOW, KOC, vapor pressure, and degradation rates were equal to 0 and set to 1×10–20 in the model.
Results and Discussion
Ecotoxicity CFs Based on QSAR Models
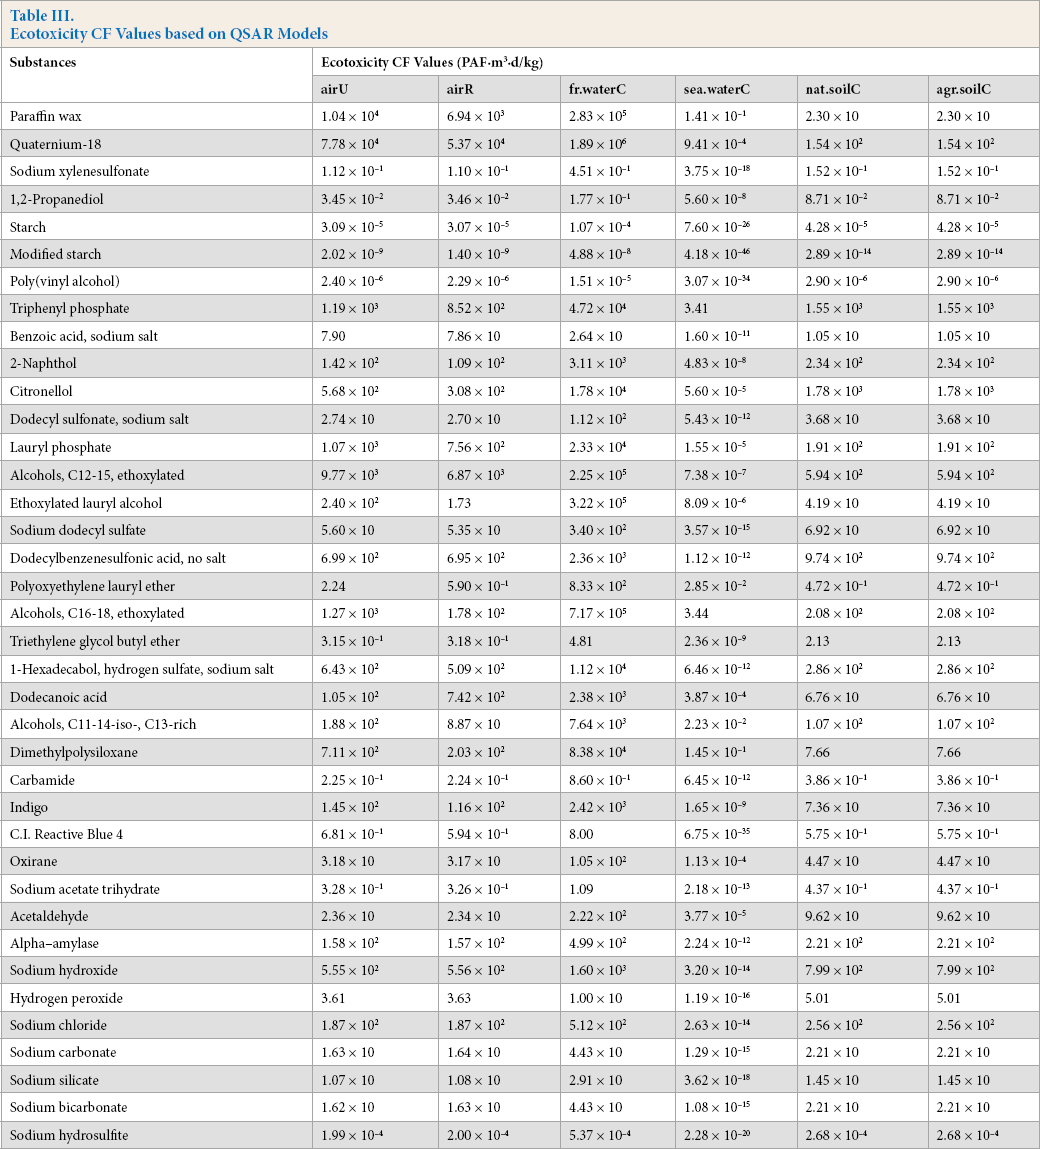
Based on QSAR models, the ecotoxicity CFs of 38 chemicals involved in cotton woven fabric production were calculated (Table III). The compartments airU, airR, fr.waterC, sea.waterC, nat.soilC, and agr. soilC, represented chemicals discharged into continental urban air, continental rural air, continental freshwater, continental seawater, continental natural soil, and continental agricultural soil, respectively.
Ecotoxicity CF Values based on QSAR Models
Correlations
In the USEtox 2.1 database, only 16 substances, including dodecylbenzenesulfonic acid, no organic salt, 1,2-propane-diol, triphenyl phosphate, dodecyl sulfonate, sodium salt, sodium acetate trihydrate, and benzoic acid, were found, with their ecotoxicity CFs calculated using the USEtox database. 15 Large variations between the self-calculated CFs and USEtox CFs were evident. The two kinds of CF had a significant linear correlation with respect to sea.waterC, and the decisive coefficients were 99.9%. In the other five environmental compartments, the logarithms of the two kinds of CFs were linearly positively correlated, and the explained variance ranged from 62% to 73% (Fig. 2).
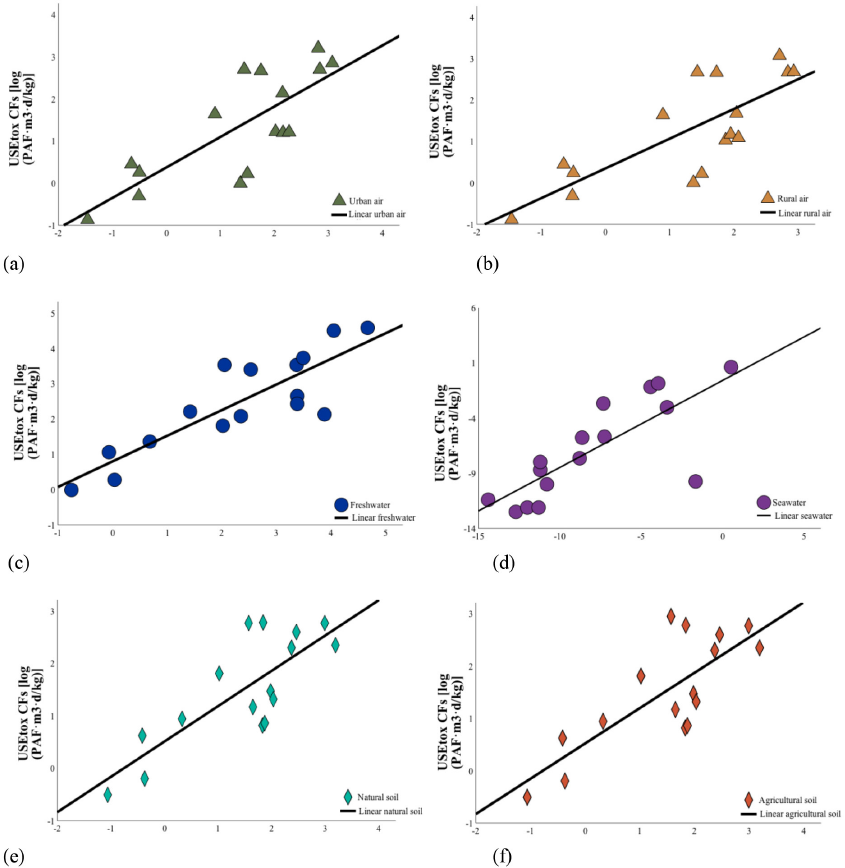
Correlation between self-calculated CFs and USEtox CFs. (a) Emission into urban air, (b) emission into rural air, (c) emission into freshwater, (d) emission into seawater, (e) emission into natural soil, and (f) emission into agricultural soil.
The regressions of the log-transformed data are shown in Eqs. 3–8.


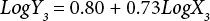
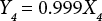


X is the self-calculated CF (PAF·m3·d), Y is the USEtox CF (PAF·m3·d), and the subscripts for X and Y indicate the six compartments. Based on Eqs. 3–8, the ecotoxicity CFs based on QSAR models were revised. Table IV shows the final ecotoxicity CFs.
Ecotoxicity CF Values after Revision
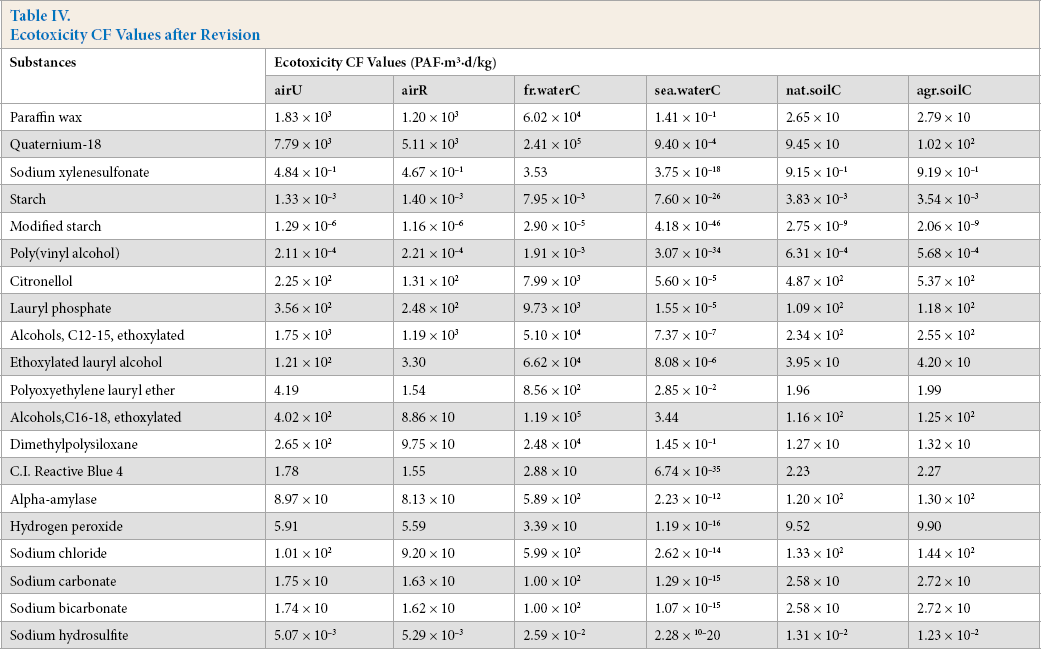
The results showed that the CFs of chemicals discharged into continental air, freshwater, seawater, and soil were 1.29 × 10⁻⁶ to 7.79 × 10³, 2.90 × 10⁻⁵ to 2.41 × 10⁵, 4.18 × 10–46 to 3.44, and 1.09 × 10⁻² to 1.08 × 10³ PAF·m3·d/kg, respectively. Tough there were no significant differences in magnitude between the CFs of the organic and inorganic chemicals, the results indicated that the CFs of the former were higher than those of the latter, with similar EC50 values.
The CFs of different media parameters and environmental compartments varied considerably; those for emission into freshwater were the highest, and those for emission into seawater were the lowest. This illustrated that CF values were mainly related to the degree of direct contact between the emission source and affected compartment. 11 Among the abovementioned 20 substances listed in Table IV, the CFs of three kinds of sizing agents were much lower than those of other chemicals in all compartments, mainly because their EC50 values were at least two orders of magnitude larger than other substances. The ecotoxicity of poly(vinyl alcohol) was negligible. Alcohols (C16–18, ethoxylated) and qua-ternium-18 had the highest CF values in all compartments, especially emissions in freshwater and air.
Self-calculated CFs based on QSAR models and USEtox CFs were considered equal in previous research.10,11 The coefficient of determination obtained by fitting showed that the relationship between self-calculated and USEtox CFs was neither simply linear nor equal. Self-calculated CFs after revision were more aligned with the USEtox model.
Assessed Ecotoxicity
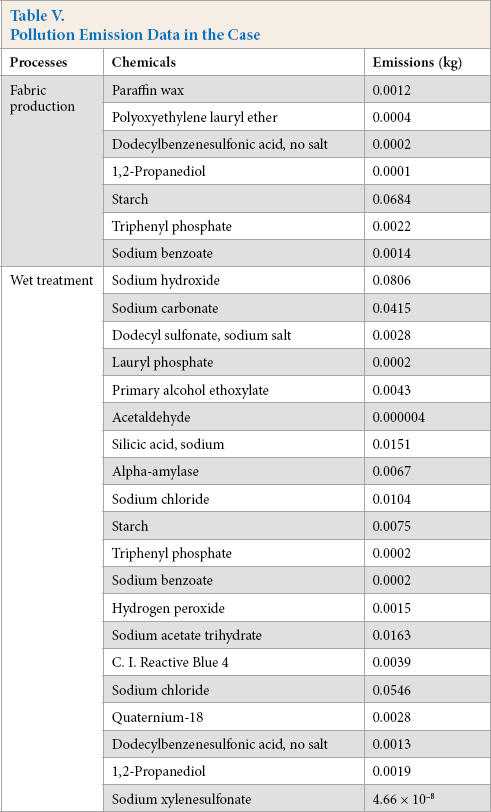
Based on the USEtox model, the ecotoxicity of 1 kg of cotton woven fabric is shown in Fig. 3. Considering the differences between organic and inorganic chemicals, substances were divided into three types, namely organic chemicals used in fabric production, organic chemicals used in wet treatment, and inorganic chemicals used in wet treatment. Inorganic chemicals were not present in the chemical inventory of fabric production. The pollution emission data were provided by two Chinese enterprises representing the processes of fabric production and wet treatment segments. To ensure the quality and representativeness of the data, these two enterprises were above the designated size and had stable upstream and downstream relations. The emissions are shown in Table V. The input parameters for the calculation of sodium silicate CFs were collected from the literature, 16 and experimental data for sodium hydroxide were used.
Pollution Emission Data in the Case
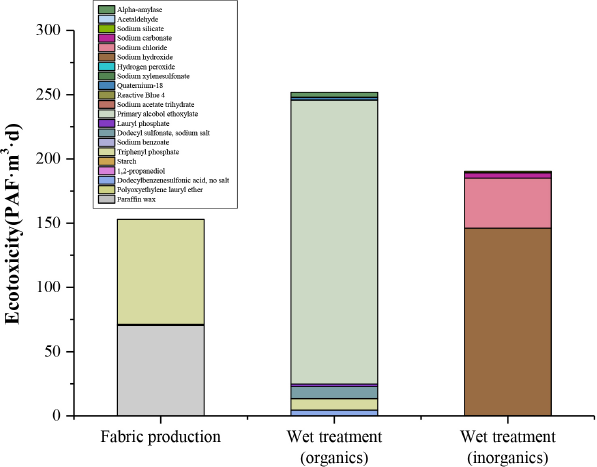
Ecotoxicity of the two processes.
The total ecotoxicity was 594.77 PAF·m3·d (Fig. 3). With respect to organic chemicals, the wet treatment process contributed more to ecotoxicity (251.55 PAF·m3·d) than the fabric production process (153.16 PAF·m3·d). The ecotoxicity caused by the use of inorganic chemicals was 190.06 PAF·m3·d, and that caused by organic chemicals in the wet treatment process was over 1.5 times as large as that caused by the fabric production process. Although large quantities of organic chemicals were used in the process, the ecotoxicity of most organic chemicals in the wet treatment, such as 1,2-propanediol, starch, and sodium xylenesulfonate, was negligible.
Among the organic chemicals, primary alcohol ethoxylate and triphenyl phosphate had a larger impact on ecotoxicity, and among the inorganic chemicals, the ecotoxicity of sodium hydroxide was the highest. Primary alcohol ethoxylate is considered an ecofriendly alternative to alkylphenol ethoxylates in terms of acute toxicity and degradability. However, used as an ecological alternative, primary alcohol ethoxylate is used almost 1.5 times as much as alkylphenol ethoxylates in the production process. 17 This means that the performance and stability of primary alcohol ethoxylate should be improved; otherwise, it is not truly ecofriendly. Triphenyl phosphate, which is used to improve the performance of starch, at certain doses, has a large ecotoxicological effect on aquatic organisms.18,19 Sodium hydroxide is the most important chemical agent used in cotton fabric production. 20
Conclusions
For the selected cotton fabric in this case study, the toxicity generated in wet treatment processes was much higher than that generated in fabric production. Among the organic chemicals, primary alcohol ethoxylate had the highest ecotoxicity, and the ecotoxicity of sodium hydroxide was the highest among the inorganic chemicals. Unit toxicity and quality were key factors in these results.
The self-calculated and USEtox CFs of the same chemical differed. By fitting, the logarithms of the two kinds of CFs were linearly positively correlated in continental rural air, urban air, freshwater, natural soil, and agricultural soil, as well as seawater; the two kinds of CF had one linear relationship, when the goodness of ft was highest. Ecotoxicity CFs based on QSAR models were greater than those in the USEtox database. Ecotoxicity CFs for emissions in continental freshwater had the highest values, whereas those for emissions in continental seawater were the lowest. The CFs of sizing agents were much lower than expected due to their EC50 values, especially for poly(vinyl alcohol). Alcohols (C16–18, ethoxylated), and quaternium-18 were more ecotoxic in the chemical inventory. The results of CFs after the revision matched the data in the USEtox model database, which were more convinced than using untreated QASR data for CF calculations. Thus, the estimated values of the QSAR models (EPI Suite and ECOSAR) can be used to calculate the CFs of textile-related chemicals when the USEtox database is limited or experimental values are missing.
Since the USEtox and EPI Suite models were mainly developed for organic chemicals, we recommend that these models be optimized to include more substances for future ecotoxicological impact assessments.
Footnotes
Acknowledgments
The authors are grateful to the National Key R&D Program of China (2018YFF0215703), the Zhejiang Provincial Natural Science Foundation (LY20G030001), and the National College Students’ Innovative Entrepreneurial Training Program of China (2020R406074) for providing funding support to this research.