
Abstract
Wood pulp-based wetlaid/spunlace (wetlace) materials had an in-use dry or wet strength, but relatively quickly breakdown in municipal sanitization systems without block, such as sewer or septic systems. In order to further study the mechanism and characterization of material dispersion process, the relationship between dispersion time and sample residual rate or dispersion rate was analyzed on the basis of previous research methods. Meanwhile, the crowding factor was introduced for evaluation and the material dispersion mechanism was comprehensively expounded. The dispersion properties of wood pulp-based wetlace materials with different Danufil length-to-diameter (L/D) ratios and contents could be clearly distinguished at the stirring rate of 220 rpm. Meanwhile, the crowding factor was between 14 and 60 when wetlace materials reached dispersion balance, and the increase in crowding factor of wood pulp/Danufil-water dispersion system resulted in increasing the required dispersion time. Overall, the dispersion process could be divided into four stages: stable state of relative dispersion rate (low level), rapid ascent phase, fast descent stage, and constant region again (high level).
Introduction
Currently, countless amounts of oils, fats, and grease were discharged into drains. 1 Meanwhile, with the recent popularity of hygienic wipes, non-decomposed wipes attached hardened grease were flushed down the toilet, which aggravated the drain blockage.2,3 There was no doubt that the disintegration of wiping materials in the sewer would increasingly be valued with the increasing emphasis on quality life.4,5
However, wood-based wetlace material was strengthened by physical entanglement among fibers, and had good dispersibility under certain flow field, which was related to the fact that material could not clog the urban sewer and affected the urban environment after being discarded.6–8 Therefore, it was expected to be widely used for dry or wet hygienic wipes.
Additionally, from 2008 to 2018, International Nonwovens Disposables Association (INDA) and European Disposables and Nonwovens Association (EDANA) issued the guidelines for GD1 through GD4 outlining a series of tests that wipes must pass to be considered “flushable.” 9 While these guidelines were available, many consumers and wastewater industry professionals had claimed that “flushable” wipes were still not disintegrating fast enough and still clogging sewers. 10 On the other hand, material flushability had a wide range, including washability, dispersibility, and biodegradability. Moreover, material washability was mainly related to the design size of material, and material biodegradability was forced on the fiber property of its own composition and material dispersibility was concentrated in disintegration of fiber assemblies. To evaluate the dispersibility of materials, there were rotor stirring method, 11 shaking box, 12 flask shaking, flush tube test,13,14 and water flushing measurement. 15 These methods could quickly evaluate the dispersion properties of materials. However, they were subjective ways in the process of material dispersion evaluation, and there was a gap with the dispersion and disintegration of the material after actual use, so it could not be a good real evaluation. So far there was no report on the effective measurement of dispersibility and the analysis of dispersion mechanism of wood pulp-based wetlace materials.
To study and evaluate material dispersibility in water, relative intuitive methods was used to analyze dispersion results. 16 Bhattacharyya and Ganesan17,18 successfully established an image texture analysis method for material dispersibility. Hendrarsakti 19 studied digital image methods to analyze the dispersibility of microfibers. Hemamalini and Giri Dev 20 introduced the comparison of several image analysis methods for fiber dispersion uniformity in water. At the same time, it had been reported that crowding factor (a method to predict the relative degree of flocculation) could be used to characterize dispersibility and flocculation of fibers in water. Huber et al. 21 demonstrated that crowding factor could be used to describe the flocculation state of long and short fibers in paper making. Das et al. 22 found the shorter cut length of fibers resulted in more uniform wet-lay nonwoven webs, which was explained in terms of the crowding factor. Hubbe and Koukoulas 23 made full use of crowding factor to reduce the flocculation tendency of fiber suspension by shortening fiber length. Nevertheless, the dispersibility of wood pulp-based wetlace materials composed of fiber entanglements had not been investigated through combining images with crowding factors.
In this study, on the basis of previous experiments on fiber bundle dispersion, a set of scheme for studying the dispersibility of wood pulp-based wetlace materials was designed by using digital image analysis method.24,25 In addition, wetlace materials with different Danufil content or L/D ratios were fabricated, and material dispersibility was investigated by means of three types of magnetic agitation shear fields, and the best magnetic agitation rate was found. Moreover, when analyzing and studying the dispersibility of wetlace materials, the crowding factor of fiber-water dispersion system was introduced to reveal the dispersion mechanism of wood pulp-based wetlace materials at each stage. This helped to understand the dispersion mechanism and characterization of wood pulp-based wetlace material, and guided the production of high value wetlace dispersible sanitary products.
Materials and methods
Raw materials
Wood pulp was obtained from Kamloops sulfate wood paddle board (Domtar Group, Canada). The average length was 2.2 mm and the width ranged from 27 to 42 μm. The average thickness and roughness were 1.08 µm and 15 mg/100 m, respectively. Meanwhile, Danufil was kindly supplied by Kelheim Fiber GmbH. 26 Its length was 8 or 10 mm, and its linear density was 0.9 or 1.7 dtex and its moisture regain was 100%. 27
As showed in Figure 1, six types of wood pulp-based wetlace materials with different Danufil L/D ratios (the ratio of Danufil length to diameter.) or contents were fabricated based on previous wetlace material preparation method, and detail parameters of samples were given in Table 1.6,28 The equipment of wetlaid part was provided by Vioth HydroFormer M1, and the spunlace and drying parts belonged to Fleissner AquaJet and Fleissner dryer, respectively. As for the wetlaid process, the beating consistency was 3%–5%, and the pressure difference between inlet and outlet of disk mill was controlled at 0.1 MPa, and the beating degree was set at 700–775 ml. The basis weight of sample was about 65 g/m2. Then samples were reinforced by multiple waterjet pressure, and the waterjet pressure were 30, 30, 30, 40, 30, and 30 bars, respectively. Meanwhile, the machine speed was 180 m/min and the dry room temperature was 130℃.

Preparation process of wood pulp-based wetlace materials.
Specifications of samples (S1–S6).

Properties measurement and characterization
Dispersion measurement
The determination of material dispersibility was based on the former self-improved measuring device. 6 The measuring system included a magnetic stirrer (REXIM RS-IDN), a flat bottom glass beaker, CED flat back-light, a dark box and camera (Nikon D7100) with wide angle lens. The sample size of 4 cm × 4 cm was used on the disperse test. In the dispersion process, each sample was disintegrated in the beaker containing 160 ml of water. The dispersion diagram of sample was recorded every 3 min until there was no change in the residual rate of sample. During the test, three types of magnet agitation rates (150, 220, and 300 rpm) were designed. The whole measurement process was in accordance with the previous method. 28 In addition, the dispersion process diagram of sample was processed in Adobe Photoshop CS6 software. Firstly, round clipping was performed on the original process record pictures, as showed in Figure 2(a). Secondly, color level of process pictures was adjusted by pressing Ctrl+L key and the gray, and highlight module was changed to appropriate positions, as illustrated in Figure 2(b). Next, process diagram was decolorized by means of pressing Ctrl+Shift+U key, as explained in Figure 2(c). Finally, image adjustment threshold tool was selected and the threshold was set at 128, which made the remaining sample pixels in the image turn black and the background turn white, as displayed in Figure 2(d). In addition, the pixels of remaining sample after each dispersion experiment was calculated, and the sample residual rate after dispersion experiment was obtained by the pixel value of remaining undispersed sample. Other sample dispersion was determined according to the same measurement method. The relationship between final sample dispersion time and residual rate was obtained.
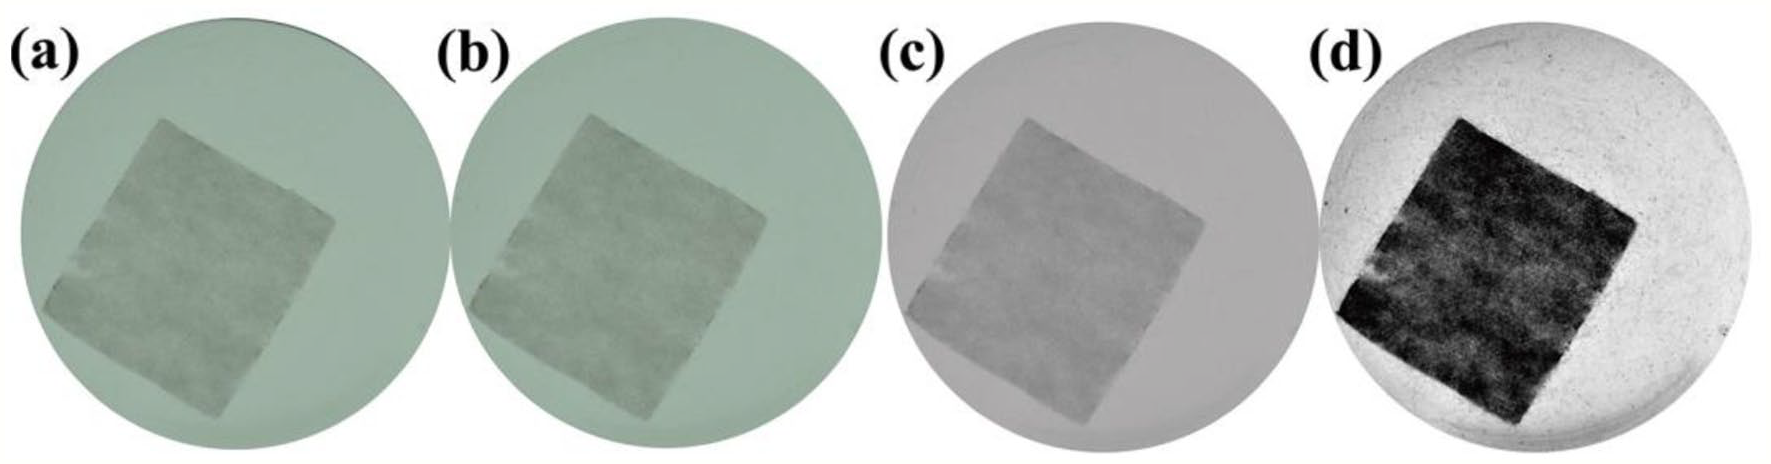
Picture processing: (a) original picture clipping, (b) color levels adjustment, (c) discoloration, and (d) threshold adjustment.
Crowding factor calculation
In the process of studying fiber-water dispersion system, Kerekes and Schell 29 jointly put forward crowding factor theory. The number of fibers in the spherical medium with a diameter of single fiber length was defined as crowding factor, reflecting the degree of contact among fibers. Crowding factor could be expressed by N, as described in formula (1):

where Cv was the fiber volume concentration, L was the fiber length, and D was the fiber diameter. Crowding factor N was used for evaluating the dispersion and flocculation of fibers, which could effectively reflect the contact degree among fibers in the dispersion medium and the tendency of fiber flocculation formation. 21 In other words, fiber dispersion state was influenced by the crowding factor of fiber-water dispersion system. For example, fiber length and diameter affected the size and strength of fibers flocculation, respectively. Wood pulp-based wetlace material was composed of long and short fiber entanglements, and material dispersion meant the disintegration of fiber aggregation. The degree of contact interaction among dispersed fibers could be reflected as crowding factor N of fiber-water dispersion system, and fibers were continuously dispersed from fiber aggregation, which led to enlarge the N. With the gradual change of dispersion process, the continuous increase of system N affected the disintegration and dispersion of fiber aggregation, but there had no study report in this regard.
Statistical analysis
Each experiment was repeated five times during all the tests, and its average value was calculated. One-way analysis of variance was adopted by experiment data and a 5% significance level was used for all analyses.
Results and discussion
Dispersibility at different stirring rates
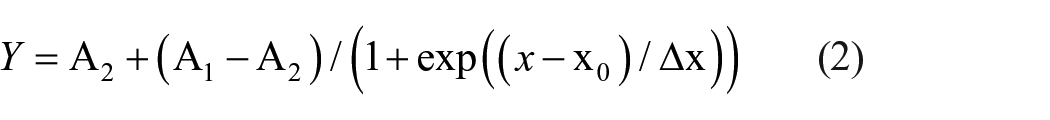
Figure 3(a) showed the relationship curve between dispersion time and residual rate of wetlace samples under the flow field with magnetic stirring rate of 150 rpm. To begin with sample residual rate would not change under the stirred flow field. However, it began to disintegrate at the seventh minute, and sample residual rate decreased rapidly. Sample dispersion ended in 17 min, and residual rate was stable at less than 20%. After calculation, the relationship between dispersion time and residual rate of six types of wetlace samples could be fitted by Boltzmann model, and the correlation was highly relevant as established in Formula (2) below.

Relationship between dispersion time and sample residue ratio (a), between dispersion time and relative dispersion rate (b) under 150 rpm stirring rate.
Where A1, A2, x0, and Δx were the constants, and Y was the sample residue ratio and x was the dispersion time. Although samples had different Danufil L/D ratio or contents, the fitting curves of dispersion time and sample residual rate were close to each other among different samples. That was, dispersion process of each sample was close with little differentiation. The main reason was that shear force of flow field had a weak effect on samples under the stirring field of 150 rpm, and samples disintegrated in a certain interval (7–17 min) under the force lasting for a long time. Eventually, sample residual ratios were all less than 20%. Table 2 indicated the variance analysis of samples. p values were less than 0.05, thus the results were statistically significant.
Variance analysis of samples (S1–S6) under 150 rpm strring rate.

Additionally, to obtain the dispersion rates of samples at different dispersion times, the first derivative was obtained by fitting the curve of dispersion time and residual rate. The relationship curves was illustrated in Figure 3(b), which could be fitted by Gaussian model equation and had high correlation degrees of fitting, as illustrated in Formula (3).
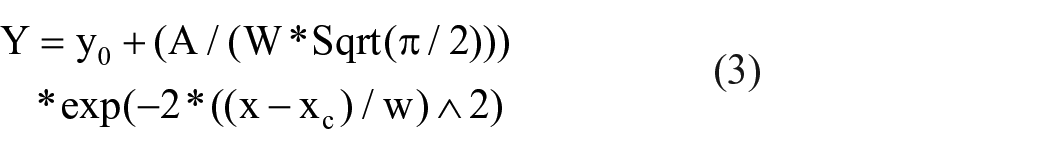
Where y0, xc, w, and A were all the constants. As dispersion time went on, relative dispersion rate of each sample was stable at first (high), and then rapidly increased to the peak value around the 13th minute. Relative dispersion rates of samples (S1–S6) were 10.7, 11.9, 11.2, 12, 10.8, 11.5, respectively. After that, relative dispersion rate gradually decreased and finally tended to be stable.
Figure 4(a) showed the relationship between dispersion time and residual rate of samples under the magnetic stirring rate of 220 rpm. Under the stirred flow field, the sample residual rate originally did not change and began to disperse at the third minute. Then it entered into the rapid dispersion stage about the sixth minute. By the 11th–21st minute, the sample dispersion tended to be stable and the residual rates were all stable at 20%. Notably, sample dispersion curves were still fitted by Boltzmann model and had highly correlation. Although the dispersion curve trend of each sample was similar from the initial dispersion residual rate to the final dispersed stable state, the differences of dispersion curves of samples were more significant under this agitation rate. Finally, sample residual ratios were about 20%. Figure 4(b) displayed the first derivative curve of sample fitting relation between dispersion time and residual rate. The relationship between the obtained sample dispersion time and residual rate could also be fitted by Gaussian model equation, and it also had highly correlation. The sample dispersion time of S1, S2, S3, S4, S5, S6 were 10.8, 8.3, 13.3, 9.2, 14.6, 10.2 min, and reach the peak of relative dispersion rate were 7.8, 8.8, 6.0, 7.1, 6.6, 7.1, respectively. The relationship between dispersion time and relative dispersion rate of different samples was also significantly different at the agitation rate of 220 rpm. Table 3 explained the variance analysis of samples. p values were less than 0.05, thus the results were statistically significant.

Relationship between dispersion time and sample residue ratio (a), between dispersion time and relative dispersion rate (b) under 220 rpm stirring rate.
Variance analysis of samples (S1–S6) under 220 rpm stirring rate.
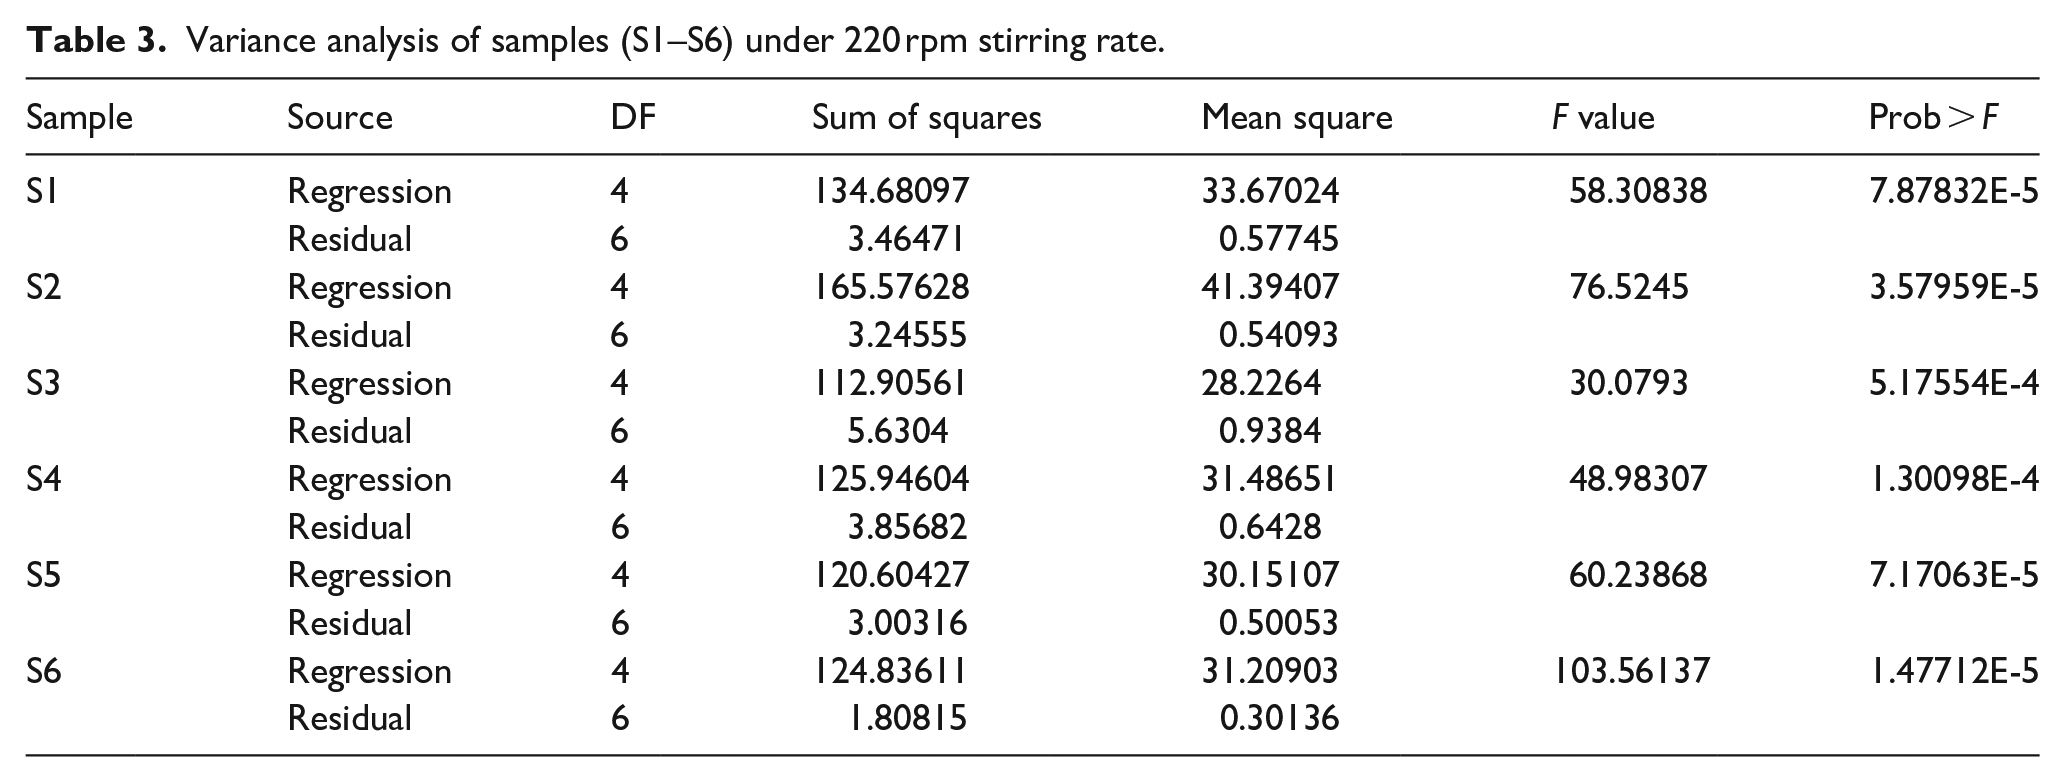
Figure 5(a) showed the relationship between dispersion time and residual rate of wetlace samples under the water flow field with magnetic stirring rate of 300 rpm. Figure 5(b) showed the first derivative curve of sample fitting relation between dispersion time and residual rate. The relationship between sample dispersion time and residual rate could also be fitted by Gaussian model equation, which also had highly correlation. Samples (S1–S6) reached the peak dispersion rate around the 11.5th minute, and corresponding dispersion time were 8, 6.8, 8.5, 7.2, 8.9, 7.5 min, respectively. Table 4 illustrated the variance analysis of samples. However, some p values were greater than 0.05, thus the results were insufficient statistically significant.

Relationship between dispersion time and sample residue ratio (a), between dispersion time and relative dispersion rate (b) under 300 rpm stirring rate.
Variance analysis of samples (S1–S6) under 300 rpm strring rate.

In a word, the increase in the agitation rate of magnet resulted in decreasing the sample dispersion time and the required dispersion time for sample to reach the maximum relative dispersion rate peak, and increasing the final sample residual rate. Because the growth in stirring rate of magnet would rise the destructive effect on fiber aggregation as well as the chance of flocculation among fibers. At the stirring rate of 220 rpm, the dispersion properties (dispersion rate and sample residual rate) of wetlace samples with different Danufil L/D ratios or contents could be clearly distinguished. Therefore, when discussing and studying the dispersibility of wetlace material, the stirring rate of magnet was 220 rpm.
In addition, the dispersion time sequence required for samples to achieve dispersion stability was S5 > S3 > S1 > S6 > S4 > S2. Wetlace samples possessed a wide range of dispersion time and sample dispersion was relatively flexible. Notably, sample dispersion time increased with the increase of Danufil content or L/D ratio. Because the growth in Danufil content or L/D ratio would rise the area of entanglement among fibers as well as the flow field action time of disintegrating fiber aggregation. 30 The required dispersion time of sample S1–S6 to the peak of relative dispersion rate was 10.8, 8.3, 13.3, 9.2, 14.6, 10.2 min, respectively, and the order was S5 > S3 > S1 > S6 > S4 > S2. When the peak value was substituted into the sample residual rate fitting curve, sample dispersion residual rate could be calculated as 61.1%, 59.3%, 60.9%, 62.8%, 59.2%, 62.25%, respectively. Thus, sample dispersion residual rate was controlled within 60% (i.e. sample dispersion amount was about 40%).
Crowding factor of fiber-water dispersion system
According to previous studies on crowding factor N, when N ⩽ 1, fibers in the fiber-water system could move freely with each other. Although there was occasional collision and temporary contact, it could achieve excellent dispersion effect. When 1 < N < 60, fibers were prone to contact, collision and entanglement, which inhibited the dispersion effect of fibers to a certain extent. When fiber L/D < 50, the distribution of fibers in water tended to be uniform with the increase of concentration. But if L/D > 50, the increasement of concentration resulted in the uneven fiber distribution, which formed the loose and discontinuous flocculants. 29 However, due to the high fluidity of fiber-water system, formed flocculants were easy to be dispersed by water flow force. 31
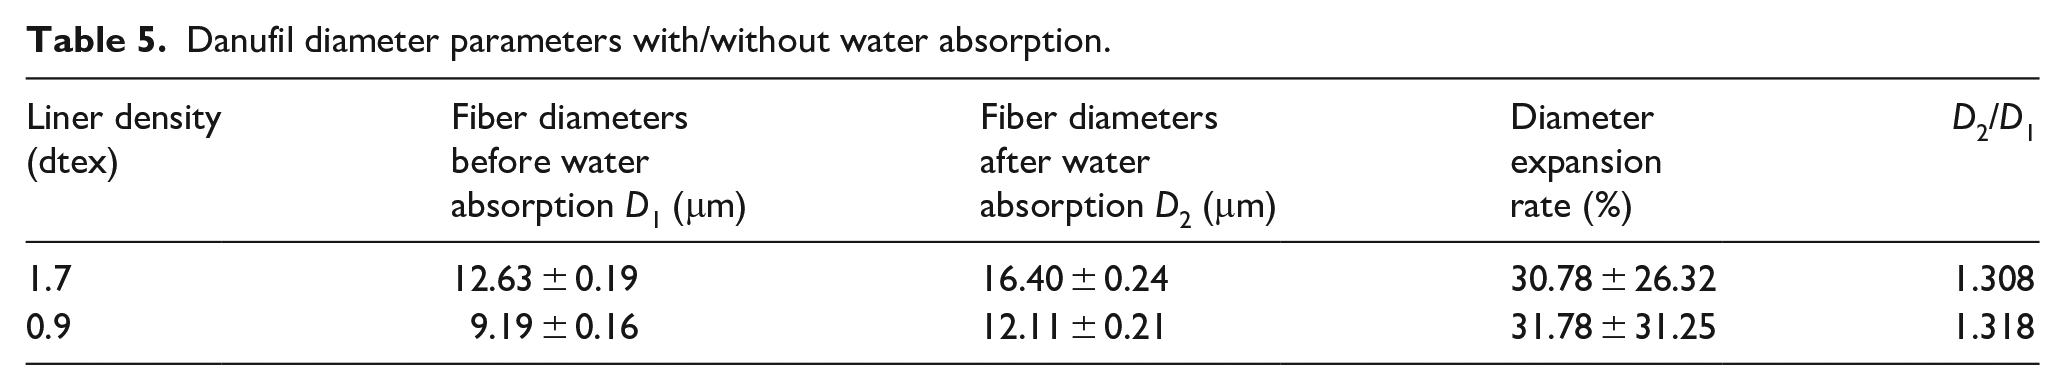
At present, China had made it mandatory that a case of flush toilet water did not exceed 6 l. The size of wipe paper had 15 cm × 15 cm, 15 cm × 18 cm, 18 cm × 20 cm, 20 cm × 20 cm, 20 cm × 23 cm, etc. However, the common size of sample was 15 cm × 18 cm. On the basis of sample dispersion experiment with improved design, water in 250 ml beaker was 160 ml and sample size was 4 cm × 4 cm. According to the calculation of material mass concentration, it was equivalent to the amount of two paper towels in the toilet bowl. The weight of wood pulp/Danufil wetlace samples was 65 g/m2, and the ratio of wood pulp/Danufil was calculated as 75/25. Thus, the wood pulp content of sample was 0.078 g, and the Danufil was 0.026 g. If the ratio of wood pulp/Danufil was calculated as 65/35, the content of wood pulp was 0.0676 g, and Danufil was 0.0364 g. According to Danufil density was 1.37 g/cm3, and wood pulp density was about 0.7 g/cm3. Therefore, the volumes of Danufil in the two types of samples were 0.0189 and 0.0266 cm3, and the volumes of wood pulp fiber were 0.1114 and 0.0966 cm3, respectively. In addition, Danufil would swell in water, and its diameter expansion rate was much higher than that of length direction after swelling. 32 Thus, it only needed to analyze the change in diameter of Danufil with/without water absorption. Table 5 showed the diameter parameters of Danufil with/without water absorption. The L/D ratios of three types of dry Danufil (1.7 dtex/10 mm, 0.9 dtex/8 mm, 0.9 dtex/9 mm) were 791.76, 870.51, 1088.14, respectively. Thus the L/D ratios became 609.12, 660.50, 825.64 after water absorption.
Danufil diameter parameters with/without water absorption.
According to the approximate cylinder of fiber-cross section, the volume calculation formula of fiber (4) was as follows:

Where V was the fiber volume, D was the fiber diameter, and L was the fiber length. The fiber volume with/without water absorption was set as V1 and V2, respectively. The ratio (5) of volume after water absorption to the volume before water absorption was as follows:

The volume ratio after and before water absorption was the square of ratio between diameter after and before water absorption. After calculation, Danufil volume content in wood pulp/Danufil (75/25, 65/35) changed from 0.0189 cm3, 0.0266 to 0.0322 cm3, 0.0456 cm3 after water absorption, and the corresponding fiber volume concentration was 0.0322/160 and 0.0456/160, respectively. Substitute into formula (5), the crowding factor N1 of completely dispersed Danufil could be obtained in each sample (S1–S6). Table 6 showed the parameters of wood pulp/Danufil wetlace samples.
Wood pulp/Danufil wetlace sample parameters.
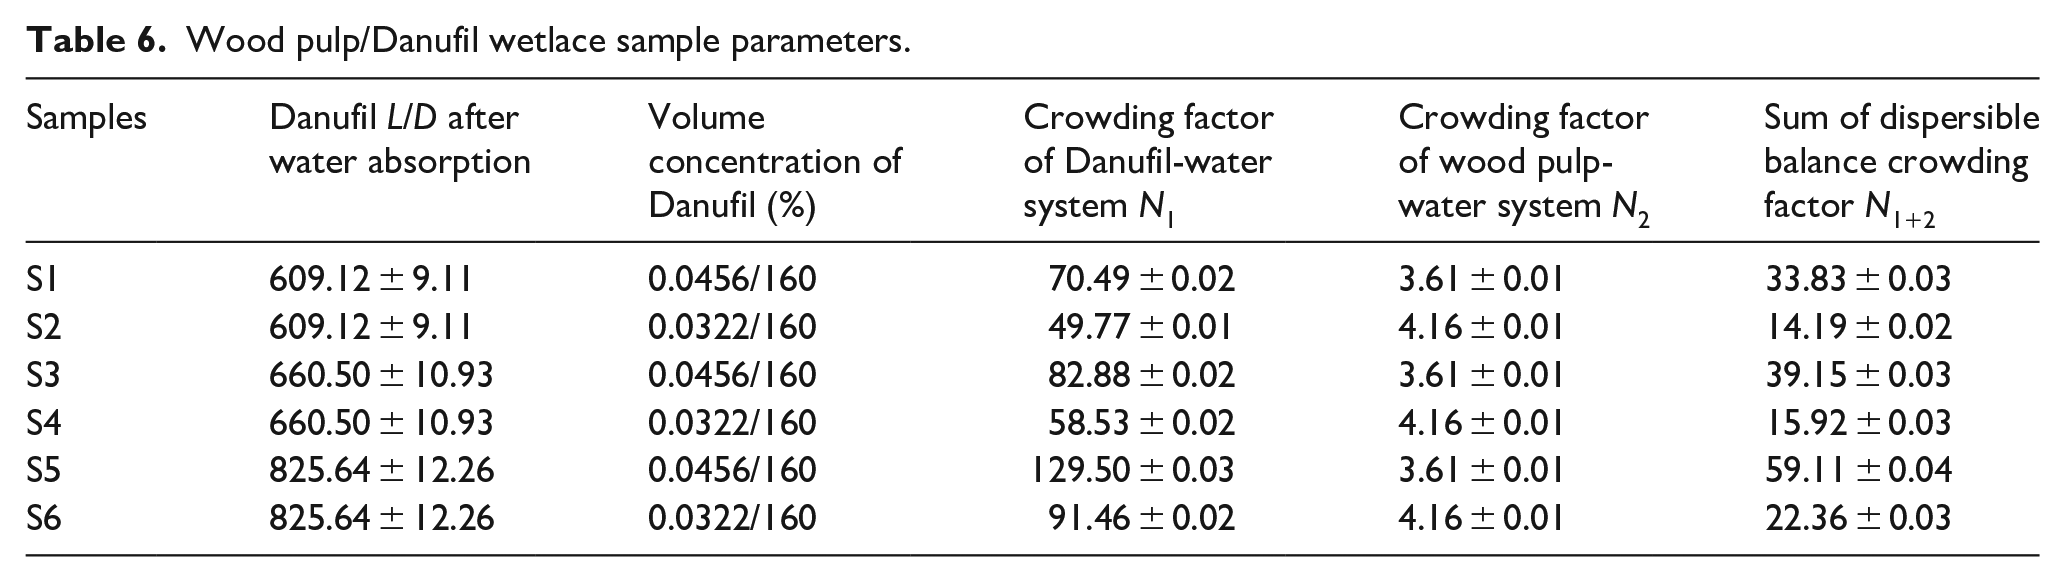
Wood pulp content in the samples composed of different fiber proportions (75/25, 65/35) was 0.078 and 0.0676 g, and the volume of wood pulp was 0.1114 cm3 and 0.0966 cm3, respectively. As the cross-section of wood pulp was flat and the radial width changed after water absorption, thus the swelling volume change of wood pulp in water was not easy to be determined. Referring to the swelling situation of Danufil, it was assumed that the swelling volume of wood pulp became twice of original, namely 0.2228 cm3 and 0.1932 cm3. Corresponding fiber volume concentrations were 0.2228/160 and 0.1932/160, respectively. Meanwhile, the L/D ratio of wood pulp was 52.4–81.5, and the average value was 66.95. As the wood pulp itself was short and had horizontal or vertical swelling, it was assumed that the L/D ratio changed slightly and was still the average value of 66.95. When wood pulp was completely dispersed, the calculated value of crowding factor N2 showed at the fifth column of Table 6 was 4.16 and 3.61, respectively.
Crowding factor was used to describe and study the fiber-water dispersion system, and the crowding factor calculated above was also based on whole single fiber dispersion in water. However, fibers including wood pulp and Danufil in the wetlace sample were entangled and cohered, leading to form fiber aggregation. According to the relationship curve between dispersion time and sample residual rate in Figure 4(a), firstly there was no dispersed fibers in the flow shear field, and the crowding factor of fiber-water system was zero. As dispersion time went on, wood pulp was easy to be disintegrated in the flow shear field. Because the bending stiffness and L/D ratio of wood pulp were smaller than that of Danufil. At the peak of relative dispersion rate, sample dispersion was mainly calculated by wood pulp and the amount was almost 40%, and the crowding factor N of corresponding fiber-water system was about 2.20. According to Figure 4, based on final dispersion stable system, there were still about 20% sample residual rate, thus the actual crowding factor of dispersion system was less than the calculated above. On the basis of the actual dispersion situation, it was assumed that 80% sample dispersion quantity including main wood pulp and part of Danufil was finally dispersed in the aqueous solution, forming a fiber-water stable dispersion system. The crowding factor N1 of Danufil-water system in the sample S1–S6 showed at the fourth column of Table 6, and the crowding factor N2 of wood pulp-water system were described at the fifth column of Table 6. Therefore, the sum of crowding factors N1+2 in the final sample S1–S6 dispersion system were illustrated at the sixth column of Table 6. The order of crowding factor of sample dispersion system was S5 > S3 > S1 > S6 > S4 > S2.
On the other hand, although the quality of wood pulp dominated the dispersion system, the crowding factor of fiber-water system was determined by Danufil. Under a certain flow shear field, the increase in the crowding factor N1+2 of formed wood pulp/Danufil-water dispersion system would increase the dispersion time required by the samples, and the order of dispersion time obtained was generally consistent with dispersion time sequence required for S1–S6 samples. Meanwhile, it could be seen that the sum of crowding factor N1+2 of fiber-water system ranged from 14 to 60 when samples S1–S6 were stable dispersion. It was known previously that when 1 < N < 60 and fiber L/D was greater than 50 in the dispersion process, fibers were easy to be contacted, flocculated and held together. However, it still had high displacement fluidity under the action of stirred water field, and the formed flocculation body was also easy to be dispersed by the action force of water field, which was consistent with the experimental fact that the final dispersible and stable residual rate of wetlace sample was 20%.
Figure 4(a) also could be concluded that the crowding factors of sample dispersion stability system had little effect on the final sample residual quantity. It was mainly due to the fact that the fiber parameters in these samples were close to each other, so there was little difference in crowding factors. At the same time, the relationship curves between dispersion time and sample residual rate were obtained by fitting. Moreover, there were errors in the conversion of sample residual rate by controlling the same image threshold for process image processing.
In addition, it could be seen from previous studies that the increase in magnet stirring rate would climb the residual rate of wetlace material. It might be due to the fact that the growth in agitation rate resulted in improving the displacement fluidity of fibers in the wood pulp/Danufil-water dispersion stabilization system and the mutual contact degree of wood pulp/Danufil in the water. Moreover, the crowding factor enlarged in the system, which hindered the further dispersion and disintegration of samples. Thus the residual rate of the final sample became relatively large.
Dispersion process and mechanism
As described previously, wood pulp/Danufil wetlace material was composed of long and short fiber entanglements and the gap rate of material layer decreased gradually from outside to inside. 6 At the same time, Figure 4 illustrated the fitting curve of relationship between dispersion time and sample residual rate, and relative dispersion rate. Moreover, the actual dispersion process diagram of wetlace material and the crowding factor sum of fiber-water dispersion system were also analyzed. Taking all these into account, the dispersion process of wood pulp/Danufil wetlace material could be divided into roughly four stages, as showed in Figure 6.

Wood pulp-based wetlace material dispersion process stages: (a) stable stage of relative dispersion rate (high level), (b) rapid increasing stage of relative dispersion rate, (c) rapid decreasing stage of relative dispersion rate, and (d) stable stage of relative dispersion rate (low level).
In the first stage (constant relative dispersion rate), sample dispersion rate tended to be 0, and residual rate basically remained unchanged. Fiber in the sample was water-absorbing and swelling, and water molecules gradually entered into the structure of fiber assemblies. The shear field formed by magnetic agitation constantly acted on the external fibers of sample. Although little quantity of wood pulp would be separated from sample, the crowding factor of external flow field could be approximately zero and sample was not dispersed as displayed in Figure 6(a).
In the second stage (relative dispersion rate decreases rapidly), with the constant action of shear force in the flow field on sample, wood pulp with short length and low bending stiffness was easy to overcome the entanglement and friction, and was firstly separated from the surface layer of sample. As a result, wood pulp position in the sample was vacant, and a lot of wood pulp was replaced by water in the flow field. The shear action of flow field gradually rose the disintegration and destruction of fiber aggregation in the sample. Then the whole bulk sample was changed into discontinuous small samples. In addition, the wood pulp and little quantity of Danufil inside the sample were disintegrated from sample. Sample relative dispersion rate grew rapidly and dispersion residual rate dropped rapidly, leading to the gradual growth of crowding factor of fiber-water system. At the stirring rate of 220 rpm, when sample reached the peak of relative dispersion rate, the critical crowding factor N of system dropped 2.20. At this stage, fibers in the flow field could move freely without any constraint contact, as illustrated in Figure 6(b).
In the third stage (relative dispersion rate decreases rapidly), continually suffering from flow shear field, a lot of wood pulp was separated from fiber aggregation. Danufil also began to be disentangled and separated from fiber assemblies, which rapidly rose fiber concentration in the flow field. During this period, dispersed wood pulp and Danufil gradually enlarged the spatial constraint of fibers. Mutual contact among fibers grew gradually, which limited the translational elastic rotation motion of fibers. 33 In addition, Danufil L/D ratio was much higher than that of wood pulp, and crowding factor N was proportional to fiber L/D ratio square in the fiber-water dispersion system. Thus, the crowding factor of system aggrandized sharply and the relative dispersion rate of sample decreased rapidly. Moreover, with the increase of fiber concentration in the flow shear field, the crowding factor reached a certain stage. The contact probability of dispersed fibers became sufficient large, and the formed mechanical force was easy to promote the flocculation or re-entangling of fibers. 34 However, sample dispersion or disintegration rate was still higher than flocculation rate, and sample relative dispersion rate still existed and sample residual rate decreased slowly, as showed in Figure 6(c).
In the fourth stage (constant relative dispersion rate), the disintegration rate of fiber assemblies was consistent with the fiber flocculation rate in the flow shear field, and the relative dispersion rate of sample tended to be zero. Meanwhile, sample residual rate did not change and the crowding factor of fiber-water dispersion system reached the maximum. Because wood pulp and Danufil both had a non-zero velocity gradient in a high concentration of fiber-water system, which rose the contact points among fibers. When fibers were relatively blocked within the narrow space, fluid power and friction force would make the adhesion strength of contact points among fibers enhanced. Fibers could disintegrate and disperse in the flow field, but they were also easy to be re-entangled, resulting in the balance and coexistence of dispersion and flocculation entanglement,35,36 as explained in Figure 6(d).
Conclusion
In this work, the relationship between dispersion time and dispersion residual rate of wood pulp-based wetlace materials could be fitted by Boltzmann model, while the relationship between dispersion rate and relative dispersion rate of materials could be fitted by Gaussian model. At 220 rpm of stirring rate, the dispersion properties of different Danufil with L/D ratios or content could be clearly distinguished, and the dispersion residual rate was stable at 20%. The growth in Danufil content or L/D ratio resulted in rising the sample dispersion time. The final sample residual rate increased with the increase of the agitation rate of magnet. Meanwhile, the crowding factor of material formed by wood pulp/Danufil-water stabilized dispersion system was within the range from 14 to 60, and the upward in the system crowding factor would add the required dispersion time. In short, the dispersion process of wood pulp-based wetlace material could be divided into four stages: Firstly, relative dispersion rate went to zero and residual rate was unchanged (high level). Secondly, relative dispersion rate decreased rapidly and residual rate decreased rapidly. Thirdly, relative dispersion rate decreased rapidly and residual rate decreased slowly. At last, relative dispersion rate returned to zero, and dispersion and flocculation were in equilibrium and coexistence (low level).
Footnotes
Acknowledgements
The author(s) wish to express their sincere gratitude to Hangzhou Hanford Technology Co., Ltd and Shaoxing Keqiao Maneng Nonwoen Co., Ltd for their support in providing the means for conducting experiments.
Declaration of conflicting interests
The author(s) declared no potential conflicts of interest with respect to the research, authorship, and/or publication of this article.
Funding
The author(s) disclosed receipt of the following financial support for the research, authorship, and/or publication of this article: This work was supported by the National Natural Science Foundation of China Youth Foud [grant number 51903156], the Lateral research of Shaoxing University [grant number 20012900000274], the Key Project of Shaoxing Keqiao [grant number 2020JBGS501], and the 2020 Student Scientific Research Project of Shaoxing University.