
Abstract
The production of colorful yarn dyed fabrics consumes a lot of dyes, auxiliaries, and water. It generates a plethora of chemical pollutants and will cause potential environmental problems. Defining the chemical footprint can transform the environmental risk caused by human activities into an intuitive form of toxicity measurement. Based on the chemical footprint methodology, this article calculated and evaluated the chemical footprints of a kind of yarn dyed fabric with the USEtox model. The results revealed that sodium hydroxide caused the most severe human toxicity, and di(hydrogenated tallow) alkyl dimethyl ammonium chloride caused the most severe ecotoxicity. The comprehensive evaluation of human toxicity and ecotoxicity with life cycle assessment polygon method showed that the preshrinking process had the largest environmental load. Selecting environmentally friendly softeners in the preshrinking process can alleviate the environmental impacts caused by the production of yarn dyed fabrics.
Introduction
There are many technologies to dye textile and garment products. Different dyeing technologies, such as fiber dyeing, yarn dyeing, and fabric dyeing, can bring different performances to textile and garment products. Fiber dyeing involves dyeing the fiber before spinning; yarn dyeing is dyeing the yarn before weaving and knitting; fabric dyeing involves directly dyeing the gray fabric. 1 No matter which kind of dyeing method is used, a large number of dyes are consumed. As a common dyed fabric, yarn dyed fabric not only consumes a lot of dyes during dyeing but also uses a lot of auxiliaries, alkali agents, finishing agents, and other textile chemicals in the finishing process. It causes serious pollution and severe impacts on human health and the ecosystem. 2
There are many methods to evaluate the potential environmental impacts caused by textile chemical consumption and related pollutant discharge.3,4 Determining the chemical footprint (ChF) is a method developed for environmental risk and sustainability assessment of chemical consumption and chemical pollutant discharge in recent years. 5 ChF was proposed by Panko and Hitchcock in 2011. 6 With the study of different researchers, the studies on ChF were gradually done, and the accounting methods of ChF have gradually increased. Among many accounting methods to calculate the ChF, the USEtox model is the most widely used.
Roos et al. 7 first introduced ChF methodology into the textile industry. They quantified the human toxicity effects and ecological toxicity effects of production processes of different textile products with the USEtox model and found that the human toxicity and ecotoxicity of bleached products were smaller than those of unbleached products. Tian et al. 8 argued that it was necessary to analyze the uncertainty of characteristic factors and optimize the USEtox model to improve the accuracy of ChF accounting results. Qian et al. 9 calculated the ChF of denim fabric in the dyeing and finishing processes and analyzed the human toxicity and ecotoxicity of different chemical pollutants. Li et al. 10 compared and analyzed the ecotoxicity footprint of three dyeing processes of a dress with the USEtox model. Ji et al. 11 used the assessment of the mean impact method to calculate and evaluate the ChF of dyed wool yarn in its life cycle and compared the ChF of each process. Qian et al. 12 quantified and evaluated the ChF of cotton fabric during wet processing with the USEtox method and comprehensively evaluated human toxicity and ecotoxicity with a multi-objective gray target decision-making model.
From these former research works, it can be seen that textiles’ ChFs were generally quantified with human toxicity (in Cases) and ecotoxicity (in PAF·m3·day) indicators. 13 It was difficult to conclude which kind of textile chemical or production process had less impact because the units of the two kinds of toxicity impacts were different. Studies reported in the literature had mainly focused on comparison of the same type of toxicity, leaving the comprehensive comparison incomplete. Therefore, a method was put forward to compare comprehensively the calculated ChF based on life cycle assessment (LCA) polygon in this article. This can fill the gap of comprehensive evaluation of human toxicity and ecotoxicity. A kind of yarn dyed fabric was selected as an example to illustrate the application of this method about environmental impact assessment of textile and clothing. This can provide a reference for the accounting and evaluation of the environmental impact caused by the use and emission of textile chemicals and for producers to reduce the impact of the use of dyes and chemicals.
Methods and Data
ChF Calculation Method
Toxic pollutants enter the human body through eating or breathing, causing human toxicity. On the other hand, toxic pollutants can also enter biological species, causing ecotoxicity. The USEtox model simulates the process of pollutant degradation, transformation, and migration. It provides a viable approach for calculating ChF with the characterization factor (CF) for human toxicity and ecoloxicity. 14 CFs of human toxicity and ecotoxicity are derived from the product of three matrices, including fate factors (FF), exposure factors (XF) and effect factors (EF): 15

where CF is the characteristic factor, in cases/kg for human toxicity or in PAF·m3·day/kg for ecotoxicity. FF is the fate factor (in day) and presents the residence time of chemicals in the environment. XF is the exposure factor (in day−1). For the human toxicity calculation, XF represents the rate at which pollutants are transferred from the environment to the human body through a series of exposure pathways, while for ecotoxicity calculation, XF represents the bioavailability of a certain chemical substance and is expressed by chemical solubility. EF is the effect factor, representing the toxicity of pollutants to human health in human toxicity or the toxicity of pollutants to aquatic organisms in ecotoxicity.
ChF is calculated based on the USEtox model as follows: 16

where f is the correction factor of the USEtox model and ChF, with the value of 290, E is the mass of chemical pollutants (in kg), and i is the type of chemical, whereas j is the environmental compartment for chemical emissions, 1 ⩽ j ⩽ 8. The environmental compartments include natural soil, agricultural soil, freshwater, sea water, household indoor air, industrial indoor air, urban air, and rural air.
LCA Polygon Method
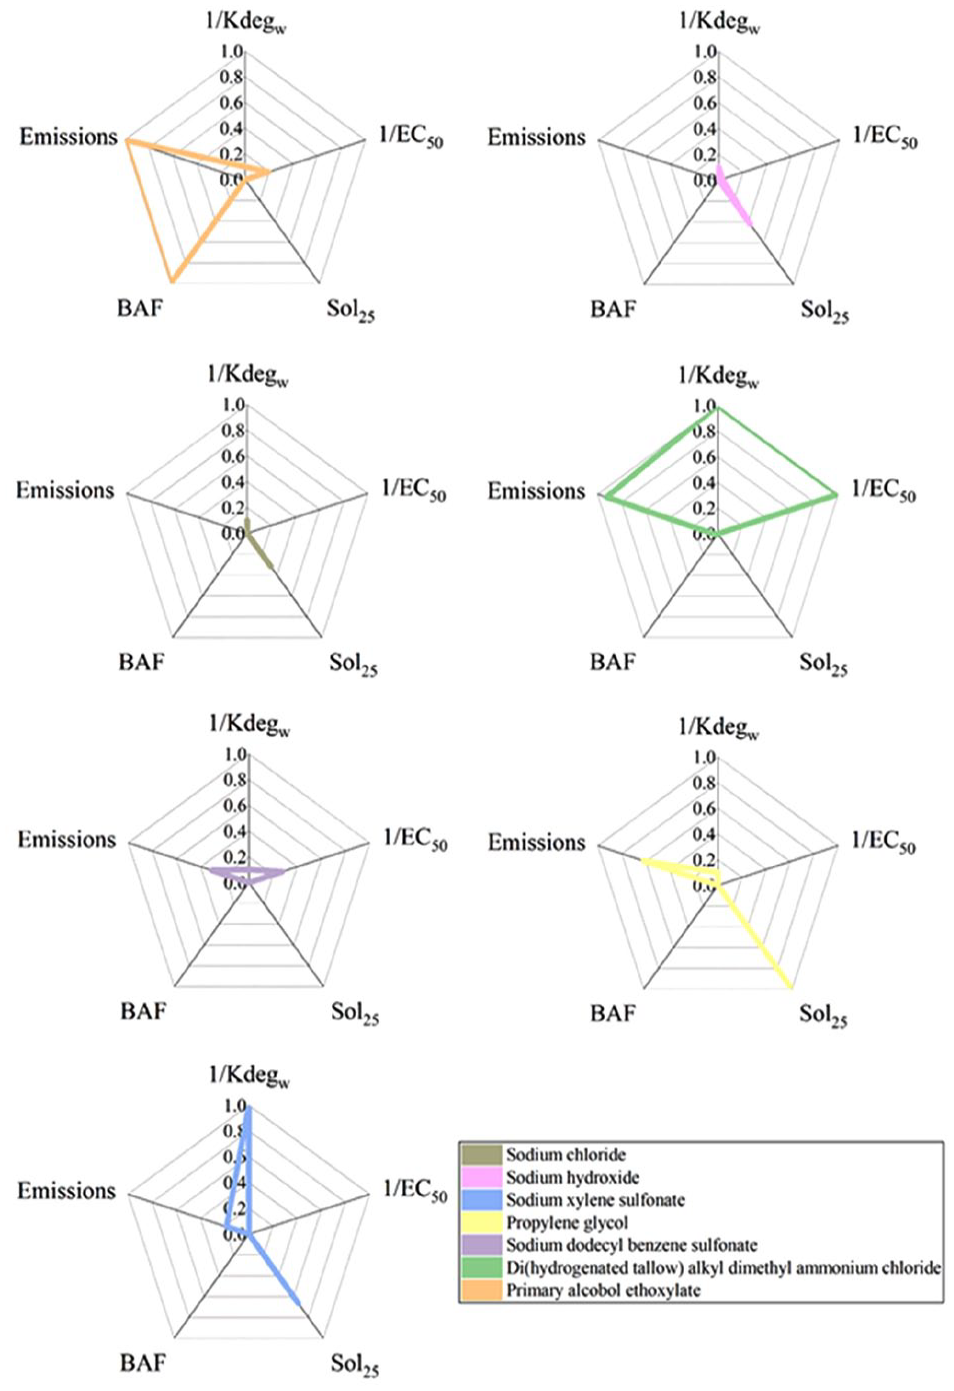
The initial amount of chemical pollutants discharged into the water is determined by the emissions of chemical pollutants. It is obvious that the higher emissions of chemical pollutants will have a greater impact on humans or ecology. Chemical pollutants will dissolve in water after entering the water, and chemical pollutants with high solubility (Sol25) will increase their content in water. 17 Chemical pollutants existing in water will be degraded over time, and the chemical pollutants with slow degradation rates (Kdegw) will stay longer in the water, which will have a long-term impact. 18 Chemical pollutants that have not been degraded will enter aquatic organisms and accumulate, causing serious harm. The extent of chemical bioaccumulation is usually expressed in the form of bioaccumulation factor of fish (BAF), which is the ratio of a chemical concentration in the organism and in the water at steady state. 19 In addition, EC50 is also a very important indicator reflecting the toxicity of chemical pollutants, which is expressed in the concentration of chemicals that cause 50% of individuals to react due to chemical toxicity. 20 Small values of EC50 indicate that a low concentration of chemical pollutants will cause 50% of individuals to react, which illustrates that chemical pollutants have great toxicity. The above five ecological parameters are a very important property for toxic chemicals and are very necessary parameters in ChF accounting, so these five ecological parameters were selected to quantify the ChF. ChF results can be compressed in an eco-profile consisting of these five ecological parameters. Although these ecological parameters are useful for the comparison of different pollutants’ ChFs, the comparison of the ChF results is ambiguous because the comparison leads to a clear result only when all of these four or five ecological parameters of a pollutant are simultaneously better (or worse) compared to the parameters of another pollutant.21,22 Expressing these five ecological parameters with an identical unit will solve the problem of incomparable values between the ChFs.
The LCA polygon method uses a single score for the comprehensive assessment of the environmental impact of different pollutants, and the results are objective and easy to understand. 22 Assume that r kinds of pollutants are under examination for comparison, and that the eco-profile of each pollutant consists of “m” ecological parameters. For every pollutant under examination and for each one of its ecological parameters EP j,k (j = 1, &, m and k =1, &, r), a relative grade is calculated as follows: 23
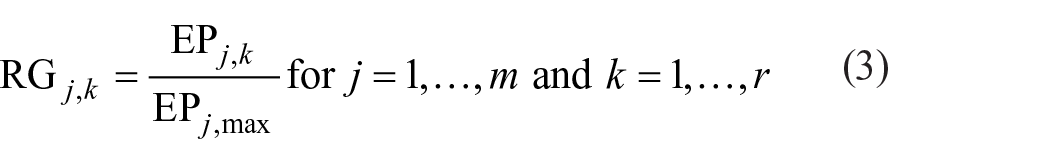
where RG j,k is the relative grade of the ecological parameter j for the pollutant k, EP j,k is the ecological parameter j of the pollutant k, and EPj,max is the largest ecological parameter j (i.e. EPj,max ⩾ EP j,k for k = 1, &, r).
For each examined pollutant k (k = 1, &, r) examined, its RG
j,k
values (j = 1, &, m) are put in a radar diagram in which each category has its own value axis radiating from a center point. In this article, each RG
j,k
has its own axis scaled from 0 to 1. Lines connect all the values forming a pentagon.
24
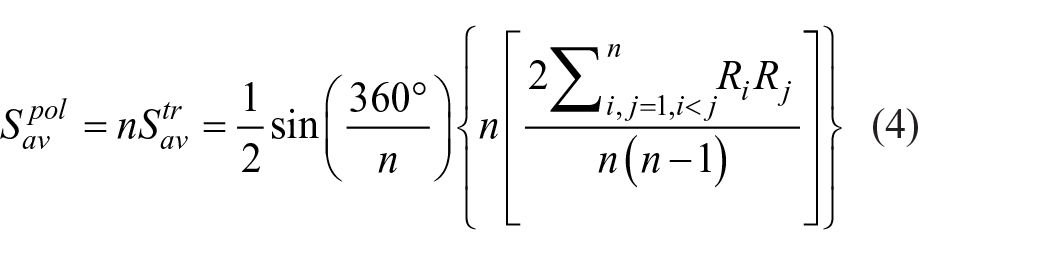
In general, a radar diagram compares the aggregate value of a number of data series. Therefore, the area of the LCA polygon is used to represent the comprehensive value of environmental impact. The larger the area, the greater the comprehensive impact of pollutants on the environment and the more unfriendly to the environment the substance is. On the contrary, the more environmentally friendly the substance is, the smaller polygon area it has. The arrangement order of various environmental influences in the radial system of the axis will affect the areas of polygons.
25
Therefore, it is more objective to calculate all possible multilateral areas and get the average value. The number of triangles with Ri and Ri+1 as side edges is
where
System Boundary
The consistency of calculation boundaries is the prerequisite for the comparison of ChF calculation results. 26 Yarn dyed fabric will consume a lot of dyes in the dyeing process, but a large number of textile auxiliaries will also be used in the finishing process. This article focuses on the finishing process of yarn dyed fabric. The finishing progress includes singeing, desizing, mercerizing, setting, and preshrinking, as shown in Figure 1. These processes use penetrating agents, caustic soda liquid, industrial salt, and softening agent and discharged primary alcohol ethoxylate, sodium hydroxide (NaOH), sodium chloride (NaCl), di(hydrogenated tallow) alkyl dimethyl ammonium chloride (DHTDMAC), sodium dodecyl benzene sulfonate (SDBS), propylene glycol (PG), and sodium xylene sulfonate. The functional unit in this research was 1 m2 yarn dyed fabric. The data of textile chemicals consumption used for ChF calculation were collected from a textile company in Zhangjiagang City, Jiangsu Province, China. The toxicity characteristic factors and ecological parameters of chemical substances were mainly derived from the USEtox database and the published literature. 9
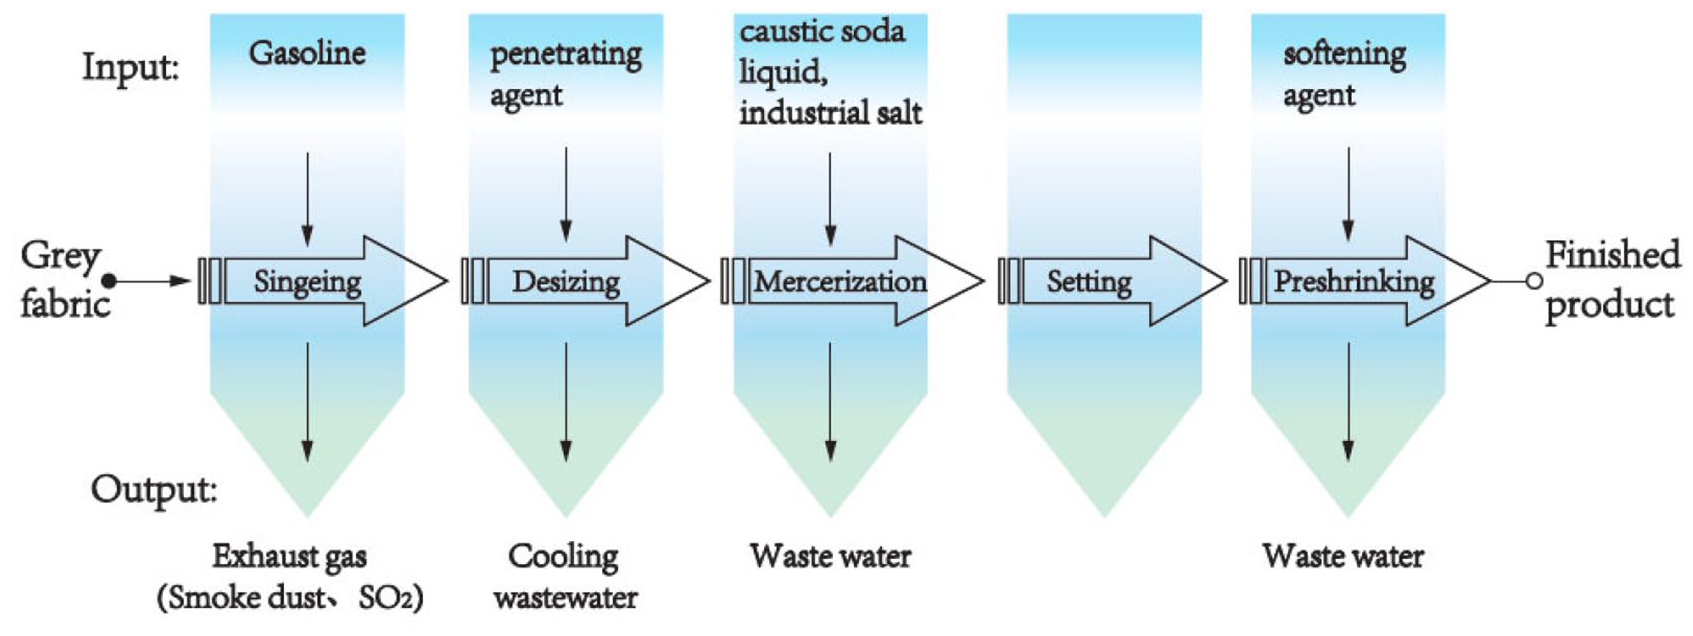
Finishing processes of yarn dyed fabric.
Results and Discussion
Human Toxicity of Finishing Processes
According to the calculated results of human toxicity described in Figure 2, the human toxicity of the mercerizing process was 2.09E+00 cases and accounted for 86.4% of the total human toxic of the whole finishing processes. Preshrinking caused the second larger human toxicity with a result of 3.30E−01 cases. The CFs of chemical pollutants discharged in the desizing process are missing at present, and the human toxicity of the desizing process cannot be calculated and was set to zero.
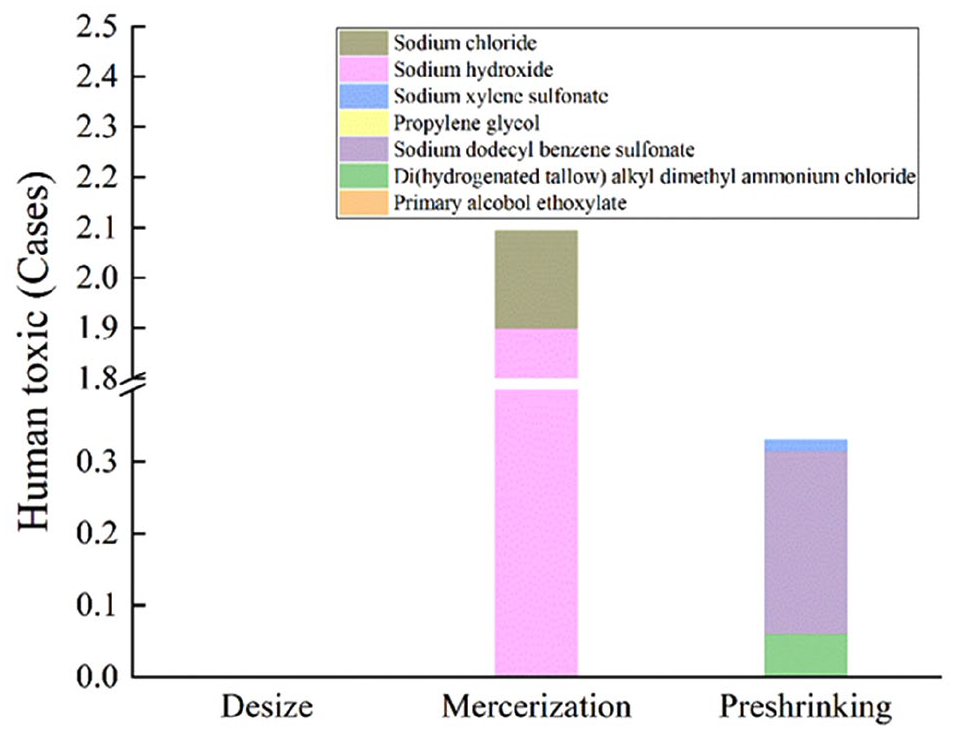
Human toxicity of finishing processes.
NaOH was the typical chemical that caused the largest human toxicity, especially in mercerizing processes. Mercerizing process with sodium hydroxide can improve the luster, strength, and extensibility of the fabric. In this process, only 10% of the added NaOH remained in the yarn dyed fabric. The other 90% of the added NaOH was washed into wastewater. NaCl acted as a stabilizer and did not participate in chemical reactions. It was all discharged with wastewater from the processing line. 27 The human toxic caused by NaCl was smaller than that of NaOH because NaCl had a much smaller human toxicity CF than NaOH. SDBS and DHTDMAC caused less severe human toxicity than NaOH and NaCl. This was because their human toxicity CFs were smaller though their emission quantities were larger.
Ecotoxic of Finishing Processes
According to the calculated results of ecotoxicity displayed in Figure 3, the preshrinking process exhibited the greatest impact on ecotoxicity. The ecotoxicity of mercerizing process was 1.25E+11 PAF·m3·day and accounted for 99.72% of the total ecotoxicity of the whole finishing processes, followed by the desizing process and the mercerizing process. There was an order of magnitude difference in ecotoxicity between the preshrinking process and other processes in the finishing of yarn dyed fabrics.
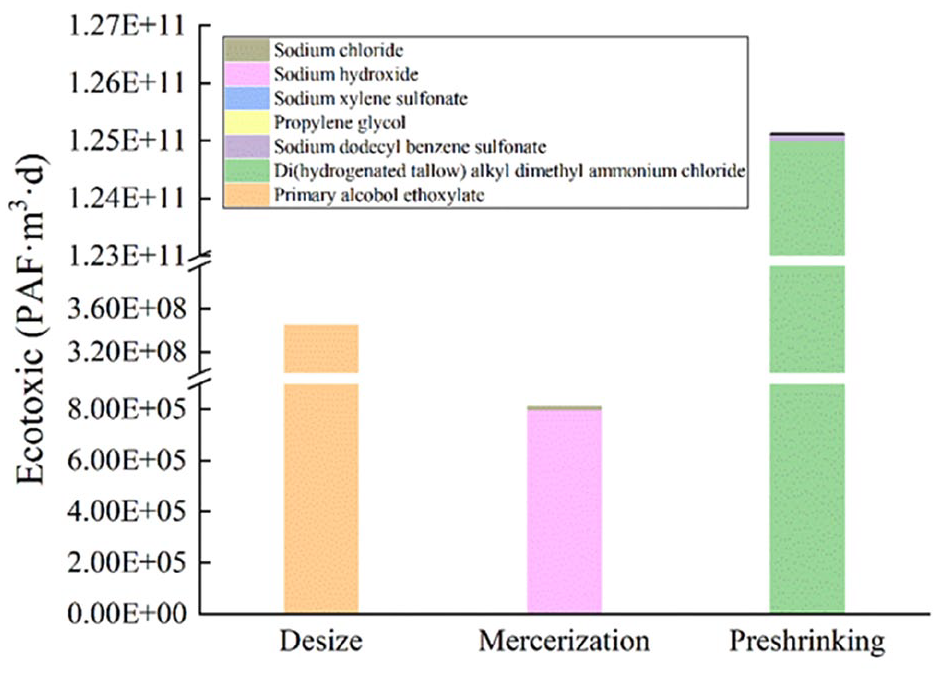
Ecotoxicity of finishing processes.
DHTDMAC is a quaternary ammonium salt-type cationic surfactant, which is mainly used as a fabric softener. It has great biological toxicity and poor biodegradability, and can be accumulated continuously in the natural environment.28 –30 Coupled with the larger emissions of DHTDMAC, its ecotoxicity accounted for 99.63% of the total ecotoxicity of the whole finishing processes. The primary alcohol ethoxylate had good penetration, wetting, and washing effect, and its biodegradability was better than that of DHTDMAC, so its ecotoxicity was less than that of DHTDMAC. SDBS, a kind of typical anion surfactant, is widely used as a proficient emulsifying agent. SDBS has acute toxicity, and NaOH is corrosive. 31 Even if their emissions were small, their ecotoxicity is second only to primary alcohol ethoxylate.
The LCA Polygon Area of Finishing Processes
It can be seen from Figure 4 that the average area of the LCA polygon for each chemical pollutants can be arranged in the following descending order: DHTDMAC > primary alcohol ethoxylate > sodium xylene sulfonate > PG > SDBS > NaOH > NaCl. It should be pointed out that the ecotoxicity of DHTDMAC also ranked first. As discussed, this was due to the fact that DHTDMAC is difficult to decompose by microorganisms after being discharged into natural water. Surprisingly, the human toxicity CF of primary alcohol ethoxylate is missing and human toxicity cannot be obtained, but its comprehensive assessment ranked second. Primary alcohol ethoxylate can consume dissolved oxygen, interact with cell membranes, and affect the growth of fish and aquatic invertebrates.32,33 It has a high acute toxicity and a possible cholinergic action. 34
The LCA polygon area of chemical substances.
Figure 5 describes the results of adding the areas of LCA polygons of chemical pollutants in each process. The order of the LCA polygon area of the three sub-processes was as follows: preshrinking > desizing > mercerizing. This means that the comprehensive assessment impact of the preshrinking process was the largest, followed by the desizing process and the mercerizing process. The softener used in the preshrinking process can improve the softness of fabric, but it will produce chemical pollutants with great environmental impact. Therefore, it is necessary to use environment-friendly textile chemicals to replace the highly toxic chemicals generally used in the production process. For example, softeners with amide or ester bonds in molecular structure were easily decomposed by microorganisms in wastewater treatment and quickly degraded into C16 and C18 fatty acids and smaller cationic metabolites, which did little harm to the environment. 35
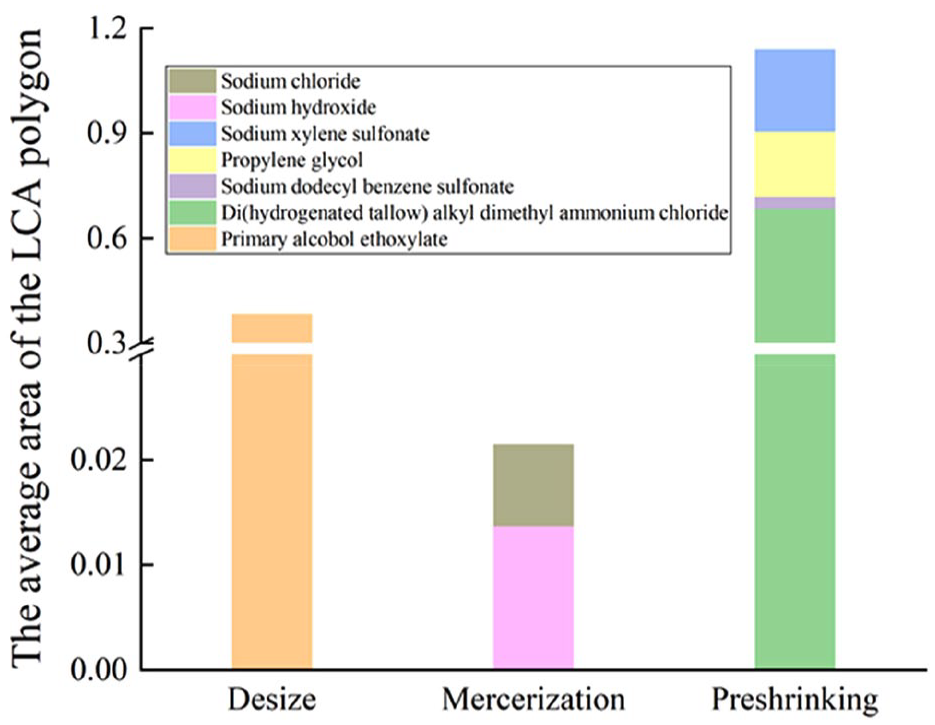
The LCA polygon areas of finishing processes.
From all the above analyses, we can not only get the ecotoxicity and human toxicity of each chemical pollutant in the finishing process, but also the comprehensive assessment of each chemical pollutant. Reviewing former studies, Roos et al. 7 only calculated the human toxicity and ecological toxicity of the products, respectively, and the comparison showed that the human toxicity and ecotoxicity of bleached products were less than those of unbleached products. Qian et al. 9 also calculated and compared the human toxicity and ecotoxicity of different chemical pollutants in the dyeing and finishing processes of denim products. Surprisingly, the LCA polygon method can eliminate the unit boundary of human toxicity and ecotoxicity, and comprehensively assess human toxicity and ecotoxicity, which can obtain the comprehensive assessment results of ChF of chemical pollutants. Therefore, a method that can comprehensively assess the ChF has been applied in this article.
Conclusion
Quantifying the ChF of yarn dyed fabric production and processing processes is convenient for enterprises to manage chemicals, trace the source of pollution in the production process, and guide enterprises to choose low-environmental-load chemicals. Based on the ChF method and the LCA polygon method, this study conducted a comprehensive evaluation of the ChF results for convenient comparison.
In this study, it was found that among the ChFs, the human toxicity of the mercerizing process and the ecotoxicity of the preshrinking process were the largest. Unfortunately, it was not intuitive to get the sequence of toxic effects between finishing processes because the two toxic units were not unified. This article used the LCA polygon method to carry out comprehensive toxic effects, solving the problem that the ChF method can not get the comprehensive evaluation. The comprehensive evaluation results showed that the comprehensive potential toxicity of the preshrinking process was the largest, followed by the desizing process and the mercerizing process.
At present, the operation of society cannot do without chemicals, and the load of chemicals on the environment cannot be completely eliminated. Identifying the toxicity of chemicals and reducing their consumption may be useful tools in the management and control of chemicals to reduce chemical pollution in the textile industry. Furthermore, it is also important to choose the chemicals used in the textile industry. As for the textile enterprises, it means choosing more environmental-friendly chemicals and dyes.
Footnotes
Declaration of conflicting interests
The author(s) declared no potential conflicts of interest with respect to the research, authorship, and/or publication of this article.
Funding
The author(s) disclosed receipt of the following financial support for the research, authorship, and/or publication of this article: The authors are grateful to the General Project of Humanities and Social Sciences Research of the Ministry of Education of China (21YJCZH160), the Open Project Program of Key Laboratory of Eco-textiles, Ministry of Education, Jiangnan University (No.KLET2011), Zhejiang Provincial Natural Science Foundation of China (LY21G030004), and the Fundamental Research Funds of Zhejiang Sci-Tech University (2021Y008) for providing funding support to this research.